
 Open Access Article
 This Open Access Article is licensed under a Creative Commons Attribution-Non Commercial 3.0 Unported Licence
Intermediate aminophenol enables hectogram-scale synthesis of highly bright red carbon quantum dots under ambient conditions†
Xiangyong
Meng
 ,
Maorong
Wang
,
Jishuai
Lin
,
Lihua
Wang
,
Jin
Liu
,
Yang
Song
*,
Qiang
Jing
* and
Haiguang
Zhao
*
,
Maorong
Wang
,
Jishuai
Lin
,
Lihua
Wang
,
Jin
Liu
,
Yang
Song
*,
Qiang
Jing
* and
Haiguang
Zhao
*
College of Materials Science and Engineering, College of Textiles and Clothes, College of Physics, State Key Laboratory of Bio-Fibers and Eco-Textiles, Qingdao University, No. 308 Ningxia Road, Qingdao 266071, P. R. China. E-mail: yangsong@qdu.edu.cn; jingq@qdu.edu.cn; hgzhao@qdu.edu.cn
First published on 21st May 2024
Abstract
Carbon quantum dots (C-dots) have developed into potential nanomaterials for lighting, catalysis and bioimaging because of their excellent optical properties and good biocompatibility. However, it is still a challenge to produce efficient red emitting carbon quantum dots (R-C-dots) due to their obscure formation mechanism. This work offered a method to reveal the formation process from the precursor o-phenylenediamine (o-PDA) to R-C-dots. Different from traditional hydrothermal reactions, R-C-dots were synthesized at relatively low temperature and ambient pressure. The pre-oxidation intermediate aminophenol played an important role in the synthesis of R-C-dots, which further cross-linked and polymerized with o-PDA in an acid environment to form R-C-dots. The obtained R-C-dots had a photoluminescence quantum yield of up to 33.26% and excellent two-photon fluorescence properties. A white light-emitting diode (WLED) based on R-C-dots as the red phosphor exhibited standard white light CIE color coordinates of (0.33, 0.33) with a correlated color temperature of 5342 K and a high color rendering index (CRI) of 94.5. The obtained rendering index is the highest value among WLEDs with color coordinates of (0.33, 0.33) based on C-dots. This work provides a new perspective for the controllable large-scale synthesis of red C-dots.
Introduction
As a new type of fluorescent carbon nanomaterial composed of C, H, O, and N, carbon quantum dots (C-dots) are considered to be the most promising materials compared to traditional semiconductor quantum dots (e.g. CdS and CdSe), due to their wide range of precursor sources, adjustable fluorescence emission, facile synthesis, low toxicity and good biocompatibility.1–10Compared to blue and green-emitting C-dots with high quality, currently the synthesis of red emitting carbon dots (R-C-dots) with high-performance is still a challenge. For example, in the bottom-up synthesis of C-dots, polymerization and carbonization are the two basic processes, which happen in a sealed auto-clave at high temperature.11–18 However, because these two processes usually occur simultaneously at high reaction temperature, it is still a challenge to explore the formation mechanism from precursors to C-dots. In-depth understanding of the reaction mechanism could reveal the structure-dependent photoluminescence mechanism, helping in the controllable production of red C-dots. Consequently, the synthesis of C-dots in an open system at ambient pressure has attracted extensive attention, and can be monitored easily. For example, R-C-dots were synthesized at room temperature using o-phenylenediamine (o-PDA) as the precursor.19–22 However, the strong oxidizing agents (KClO4 or H2O2) used in these reactions prohibited the deep understanding of the growth mechanism of C-dots from o-PDA.
In this work, we demonstrated that the intermediate aminophenol oxidized from o-PDA played an important role in the synthesis of R-C-dots with o-PDA as the precursor in an open system. The obtained R-C-dots have a photoluminescence quantum yield (PLQY) of 33.26%, which is the highest value for R-C-dots derived from o-PDA in an open system as far as we know. It is worth mentioning that a white light-emitting diode (WLED) based on R-C-dots has standard CIE color coordinates (0.33, 0.33) with a high color rendering index (CRI) of 94.5, which is the highest value among WLEDs with identical color coordinates based on C-dots to the best of our knowledge. In addition, benefiting from the mild reaction conditions and deep understanding of the reaction mechanism, the reaction could be scaled up to the hectogram scale, which paves the way for the transformation of C-dots from laboratory to industry.
Results and discussion
Synthesis and formation mechanism of R-C-dots
The R-C-dots were produced using o-PDA as the precursor. The synthesis of R-C-dots involved a pre-oxidation process for 2 h and further acid-catalysis process for 10 h (Fig. S1†). Specifically, in the pre-oxidation process, after heating the reaction mixture (o-PDA dissolved in deionized water) at 60 °C under ambient conditions, o-PDA was partially oxidized into aminophenol with a mass-to-charge ratio (m/z) of 110 (Fig. 1a). Subsequently, aminophenol reacted with o-PDA to form the intermediate 2-amino-3-hydroxy-phenolzine [named (I)] with an m/z of 212 (Fig. 1b). Due to the presence of a functional group (–OH) in the ortho position, the –NH2 group of (I) was further oxidized into the intermediate 2,3-dihydroxyphenolzine [named (II)] with an m/z of 213. After pre-oxidation for 2 h, acid (sulfuric acid, hydrochloric acid or citric acid, with a pH of 5–6) was added into the reaction system to protonate the intermediates and activate the reaction. The R-C-dots began to form through cross-linking and polymerization of the intermediates and o-PDA within 30 minutes. The fluorescence behavior of the R-C-dots was dominated by the molecular fluorophore 5,14-dihydroquinoxalino[2,3-b] phenazine (DHQP) [Fig. S1, (3)†], which has been reported previously for explaining the red color in C-dots synthesized via o-PDA.23 The possible ways in which DHQP was formed are shown in Fig. 1c. The solid R-C-dot powder was obtained by simple filtration [Fig. S1, (4)†], benefiting from the self-precipitation of R-C-dots as they mostly adhered to the beaker wall because of their hydrophobicity (Fig. S2†). The powder dissolved in ethanol emitted very bright red light upon irradiation with a 395 nm ultraviolet lamp [Fig. S1, (5)†]. | ||
| Fig. 1 Formation mechanism and molecular reaction kinetics simulation of intermediates and DHQP. (a and b) The formation of intermediates by pre-oxidation. (c) The formation of DHQP-like fragments. (d and e) The ΔG of the reaction of molecule (I) before and after protonation calculated from DFT simulations. (f and g) The ΔG of the reaction of molecule (II) before and after protonation calculated from DFT simulations. | ||
As shown in Fig. S3,† two groups of experiments using o-PDA as the precursor were conducted. Specifically, in the absence of a pre-oxidation process and only acid-catalysis, a solid powder with no fluorescence was obtained (Fig. S3a and b†). Similarly, R-C-dots cannot be obtained when only pre-oxidation was carried out without acid catalysis (Fig. S3c and d†). These experiments confirmed that R-C-dots can only be obtained by acid catalysis of the pre-oxidation products.
To verify the important role of the intermediate aminophenol, we purchased commercial aminophenol and used it to synthesize R-C-dots. By optimizing the molar ratio of aminophenol and o-PDA, the bright R-C-dots were directly obtained in the presence of acid at 60 °C without peroxidation (Table S1, 1–3†), demonstrating the key role of intermediate aminophenol.
The process of acid-catalysis
In our previous report,24 R-C-dots with similar fluorescence properties to those in this work (named H-R-C-dots) were synthesized by the hydrothermal method, without using acid-catalysis. As shown in Fig. S4,† the similar structural characteristics between H-R-C-dots and R-C-dots were further demonstrated by NMR analysis. Among them, the peak intensity of C![[double bond, length as m-dash]](https://www.rsc.org/images/entities/char_e001.gif) O in the R-C-dots was weaker compared to that of the H-R-C-dots (Fig. S4a†), which may be due to the low degree of oxidation under the low temperature synthetic condition. High temperature and pressure provide sufficient energy for the formation of H-R-C-dots. Instead, in this work, the formation of R-C-dots can only be realized through acid-catalysis. To explain the molecular reaction kinetics of the formation of R-C-dots through acid-catalysis, density functional theory (DFT) calculations were carried out to calculate the Gibbs free energy (ΔG) of the reactions with a reaction temperature of 60 °C and the product DHQP. As shown in Fig. 1d, DHQP could be synthesized by the reaction of molecule (I) with aminophenol, a process involving a dehydration reaction between –NH2 and –OH. The ΔG of the reaction without acid-catalysis was 210.840 kcal mol−1, which indicated that the reaction could not occur without additional energy. However, after –NH2 and –OH were protonated, the calculated ΔG decreased to −444.280 kcal mol−1, which indicated that the reaction could occur (Fig. 1e). Fig. 1f and g show the DFT calculations of ΔG for the reaction of molecule (II) with o-PDA to form DHQP. Similarly, the ΔG before and after acid-catalysis was 18.830 and −97.264 kcal mol−1, respectively, which indicated that acid-catalysis could promote the formation of R-C-dots. Besides, the effect of pH on the reaction yield was also investigated. As shown in Table S2,† R-C-dots could not be synthesized at low pH (group 1). When the pH increased to 3–4, R-C-dots could be obtained with a low yield of 5%, while a high yield of 77% could be obtained when the pH was 5–6. We inferred that, at low pH, multiple sites of the aromatic ring of the intermediates were activated (Fig. S5a†), which inhibited the formation of DHQP fragments, while chain polymerization and network polymerization became the dominant reaction (Fig. S5b and c†).
O in the R-C-dots was weaker compared to that of the H-R-C-dots (Fig. S4a†), which may be due to the low degree of oxidation under the low temperature synthetic condition. High temperature and pressure provide sufficient energy for the formation of H-R-C-dots. Instead, in this work, the formation of R-C-dots can only be realized through acid-catalysis. To explain the molecular reaction kinetics of the formation of R-C-dots through acid-catalysis, density functional theory (DFT) calculations were carried out to calculate the Gibbs free energy (ΔG) of the reactions with a reaction temperature of 60 °C and the product DHQP. As shown in Fig. 1d, DHQP could be synthesized by the reaction of molecule (I) with aminophenol, a process involving a dehydration reaction between –NH2 and –OH. The ΔG of the reaction without acid-catalysis was 210.840 kcal mol−1, which indicated that the reaction could not occur without additional energy. However, after –NH2 and –OH were protonated, the calculated ΔG decreased to −444.280 kcal mol−1, which indicated that the reaction could occur (Fig. 1e). Fig. 1f and g show the DFT calculations of ΔG for the reaction of molecule (II) with o-PDA to form DHQP. Similarly, the ΔG before and after acid-catalysis was 18.830 and −97.264 kcal mol−1, respectively, which indicated that acid-catalysis could promote the formation of R-C-dots. Besides, the effect of pH on the reaction yield was also investigated. As shown in Table S2,† R-C-dots could not be synthesized at low pH (group 1). When the pH increased to 3–4, R-C-dots could be obtained with a low yield of 5%, while a high yield of 77% could be obtained when the pH was 5–6. We inferred that, at low pH, multiple sites of the aromatic ring of the intermediates were activated (Fig. S5a†), which inhibited the formation of DHQP fragments, while chain polymerization and network polymerization became the dominant reaction (Fig. S5b and c†).
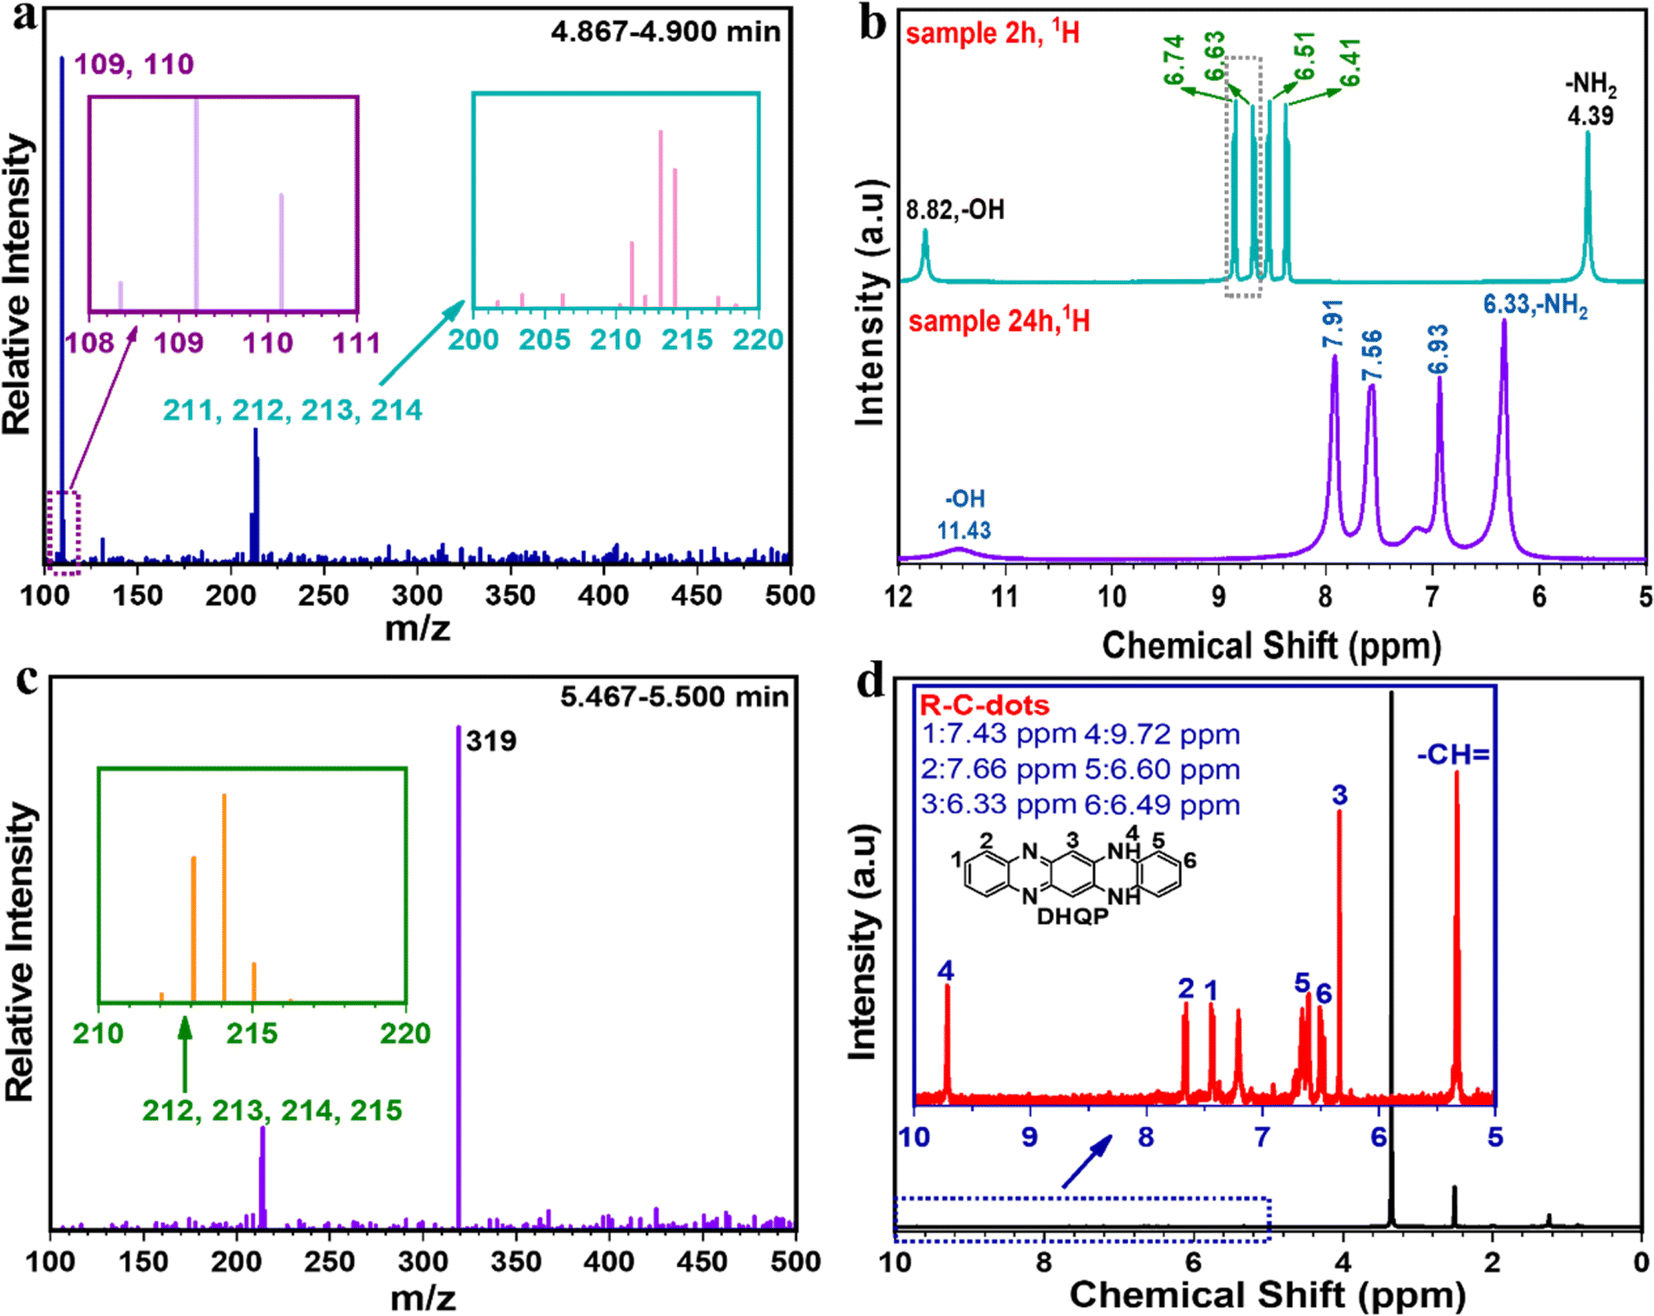
In order to further understand the formation process of R-C-dots, the pre-oxidation products (o-PDA was oxidized for 2 h, and named Sample-2h) were characterized. In the HR-MS spectra of Sample-2h (Fig. 2a), a strong peak at 109 in the retention time range of 4.867–4.900 min was attributed to o-PDA. A new peak at 110 assigned to aminophenol appeared, which might be caused by the oxidation of –NH2 to –OH of o-PDA (Fig. 1a). To verify this speculation, a series of characterization studies was conducted. The full-scan XPS spectrum (Fig. S6†) revealed that Sample-2h was composed of C, N and O elements with an atomic fraction of 76.26%, 19.65% and 4.09%, respectively. Obviously, the C/N atomic ratio (3.9![[thin space (1/6-em)]](https://www.rsc.org/images/entities/char_2009.gif) :1) was greater than that of o-PDA (3:1), which demonstrated that –NH2 was consumed during the peroxidation process. In the 1H NMR spectrum of Sample-2h (Fig. 2b), a new chemical shift at 8.82 ppm was similar to that of phenolic hydroxyl as reported in the literature,25,26 which proved the presence of –OH. Meanwhile, the peaks centered at 4.39, 6.41 and 6.51 ppm could be assigned to the unreacted o-PDA according to the 1H NMR of o-PDA (Fig. S7a†). Among them, the peak at 4.39 ppm was caused by the vibration of hydrogen in –NH2. and those at 6.41 ppm and 6.51 ppm were attributed to the vibration of hydrogen in the benzene ring.27 However, compared to o-PDA, the vibration intensity of –NH2 was significantly reduced, indicating that –NH2 was consumed, which was consistent with the XPS results. In addition, there were two new chemical shifts at 6.63 and 6.74 ppm with sixfold peaks (Fig. S8†), which were similar to that due to the vibration of the benzene ring of o-PDA. However, compared to the vibration of the benzene ring of o-PDA, the two new chemical shifts shifted to the low field by about 0.2 ppm, which was probably caused by the substitution of –NH2 by –OH as the electronegativity of O was slightly greater than thatof N. Furthermore, the integration peak area ratio of the six peaks at 4.39, 6.41, 6.51, 6.63, 6.74, and 8.82 ppm in the 1H NMR was 2:1:1:1:1:1 (Fig. S9†), which matched well with the structure of aminophenol. As a result, the molecular structure with an m/z of 109 was confirmed as aminophenol.
:1) was greater than that of o-PDA (3:1), which demonstrated that –NH2 was consumed during the peroxidation process. In the 1H NMR spectrum of Sample-2h (Fig. 2b), a new chemical shift at 8.82 ppm was similar to that of phenolic hydroxyl as reported in the literature,25,26 which proved the presence of –OH. Meanwhile, the peaks centered at 4.39, 6.41 and 6.51 ppm could be assigned to the unreacted o-PDA according to the 1H NMR of o-PDA (Fig. S7a†). Among them, the peak at 4.39 ppm was caused by the vibration of hydrogen in –NH2. and those at 6.41 ppm and 6.51 ppm were attributed to the vibration of hydrogen in the benzene ring.27 However, compared to o-PDA, the vibration intensity of –NH2 was significantly reduced, indicating that –NH2 was consumed, which was consistent with the XPS results. In addition, there were two new chemical shifts at 6.63 and 6.74 ppm with sixfold peaks (Fig. S8†), which were similar to that due to the vibration of the benzene ring of o-PDA. However, compared to the vibration of the benzene ring of o-PDA, the two new chemical shifts shifted to the low field by about 0.2 ppm, which was probably caused by the substitution of –NH2 by –OH as the electronegativity of O was slightly greater than thatof N. Furthermore, the integration peak area ratio of the six peaks at 4.39, 6.41, 6.51, 6.63, 6.74, and 8.82 ppm in the 1H NMR was 2:1:1:1:1:1 (Fig. S9†), which matched well with the structure of aminophenol. As a result, the molecular structure with an m/z of 109 was confirmed as aminophenol.
 | ||
| Fig. 2 Structure of intermediates. (a and c) HR-MS spectra (retention time range of 4.867–4.900 min and 5.467–5.500 min, respectively) of Sample-2h. (b) 1H NMR spectra of Sample 2h and Sample-24h. (d) 1H NMR spectrum of R-C-dots. | ||
Besides an m/z of 109 in the HR-MS spectrum of Sample-2h, there were signals with an m/z of 211, 212, 213, 214, and 319 (Fig. S2a and c†). According to previous literature,27–29 the peak with an m/z of 211 was attributed to 2,3-diaminophenazine (DAP). However, R-C-dots could not be obtained when using commercial DAP reacted with o-PDA or aminophenol under acidic conditions. In addition, the ΔG of the DAP reaction with o-PDA to form DHQP was also calculated, and the ΔG before and after protonation was 115.460 kcal mol−1 and 64.00 kcal mol−1, respectively, indicating that DAP cannot participate in the formation of R-C-dots.
In order to obtain enough intermediates for characterization, the pre-oxidation time of o-PDA was increased to 24 h and named Sample-24h. As shown in Fig. S10,† compared with the FTIR spectra of DAP and o-PDA, the functional group vibration of Sample-24h was consistent with that of DAP except for the vibration at 3433 cm−1, which was attributed to the stretching vibration of –OH. Due to the presence of –OH, combined with the HR-MS spectrum, we deduced that the possible structures of the intermediates were predominantly (I), and (II) (Fig. 1b).
To confirm this deduction, NMR was applied to analyze the molecular structure of Sample-24h. To facilitate understanding, the chemical shift changes of –NH2 between o-PDA and DAP were first investigated (Fig. S7†). Obviously, the chemical shift of –NH2 shifted from 4.42 ppm to 6.25 ppm due to the increase in the conjugate domain. Similarly, in the 1H NMR spectra of Sample-24h (Fig. 2b), the chemical shift of –NH2 at 6.33 ppm shifted by 2.06 ppm compared to that of Sample-2h, which means that there may be a DAP-like conjugated structure in Sample-24h. In addition, the chemical shift of –OH at 11.43 ppm shifted by 2.61 ppm compared to that of Sample-2h, which was also caused by the increase in the conjugate domain. The other three peaks (6.93, 7.56, and 7.91 ppm) in 1H NMR were consistent with the vibration of hydrogen in the benzene ring of DAP (Fig. S7b†). In summary, the 1H NMR analysis proved the presence of a DAP-like conjugated structure in Sample-24h. Combined with HR-MS analysis, intermediates had a biphenyl ring structure similar to that of DAP, except for the different functional groups –OH, and the possible structure of these intermediates were (I), and (II), respectively, which was consistent with the FTIR analysis.
In addition to the main reactions described above, intermediate (III) with an m/z of 214 may also be formed (Fig. S11a†), which could further react with aminophenol to form intermediate (IV) with an m/z of 319 (Fig. S11b†). However, the trace amounts of (III) and (IV) made it impossible to definite their molecular structure. Therefore, only the main intermediates (I) and (II) were discussed in this work.
Morphology, structure and optical properties of R-C-dots
Benefiting from the clear understanding of the reaction mechanism and facile synthesis method of the R-C-dots, 100 g of R-C-dots were produced by using 150 g of o-PDA as the precursor at a pH of 5–6. Fig. 3a and S12† show that R-C-dots had a uniform dispersion and an average diameter of 2.7 nm. As shown in Fig. 3b and c, high resolution transmission electron microscopy (HR-TEM) images revealed that the interlayer spacing of R-C-dots was 0.21 nm, corresponding to the (100) plane of graphene.30–32 A broad diffraction peak centered at 24.6° (Fig. S13†) in the X-ray diffraction (XRD) pattern was attributed to the (002) crystal plane of graphite.33,34 Both HR-TEM and XRD confirmed the formation of a crystalline structure of the C-dots. The XPS spectrum confirmed that the R-C-dots consist of C, N, and O with an atomic fraction of 85.61%, 4.07% and 10.32%, respectively (Fig. S14a†). Correspondingly, the high-resolution C 1s XPS spectrum (Fig. S14b†) of R-C-dots can be deconvolved into C–C/CC (284.8 eV), C–N/C–O (285.6 eV), and CN/CO (288.1 eV).35 In the high-resolution N 1s XPS spectrum (Fig. S14c†), peaks at 399.5 and 397.7 eV were attributed to pyrrolic N and pyridinic N, respectively.36,37 There was only one peak in high-resolution O 1s spectra (Fig. S14d†), corresponding to C–O (531.9 eV).38 Combined with the FTIR spectrum of o-PDA (Fig. S15†), the strong stretching vibration bands of –NH2 (3385–3191 cm−1) in o-PDA obviously disappeared in the FTIR spectrum of R-C-dots. In contrast, R-C-dots had a very strong infrared band at 2920–2851 cm−1, representing the hydrophobic long alkyl chains and aromatic rings,7 which endowed R-C-dots with hydrophobicity.
 | ||
| Fig. 3 Characterization of R-C-dots. (a and b) Low magnification (a) and high magnification (b) TEM images of the R-C-dots. (c) HR-TEM image of one R-C-dot. (d) PL (red line) and UV-vis absorption (black) spectra of the R-C-dots. (e) PLQY of the R-C-dots dispersed in ethanol solution. (f) The stability of the R-C-dots dispersed in ethanol solution excited by using a 395 nm ultraviolet lamp (100 mW cm−2). (g) Femtosecond transient absorption spectra of the R-C-dots. (h) Two-photon spectra at different laser powers of a 800 nm femtosecond pulse laser. (i) Proposed energy diagram of R-C-dots. | ||
The photoluminescence (PL) spectrum of R-C-dots dissolved in ethanol displayed three PL peaks centered at 603, 649, and 708 nm (Fig. 3d, red line), with corresponding lifetimes of 2.3, 2.4 and 2.3 ns (Fig. S16†), respectively. As shown in Fig. S17,† the R-C-dots showed an excitation-independent PL spectrum, indicating the stable energy band. The absolute photoluminescence quantum yield (PLQY) of R-C-dots was 33.26% (Fig. 3e), which was the highest value for R-C-dots synthesized using o-PDA as the precursor in an open system as far as we know.19–22 The UV-vis absorption spectra of R-C-dots displayed four absorption regions (Fig. 3d, black line). The peak at 290 nm was attributed to the π–π* transition of the CC/CN bond.27 In the low-energy area, R-C-dots exhibited strong excitation absorption bands at 500, 535, and 569 nm, which could be assigned to the n–π* transition of the DHQP structure.23 NMR analysis of R-C-dots demonstrated the presence of a DHQP structure. In the 1H NMR spectra of R-C-dots (Fig. 2d), a small amount of a DHQP-like signal could be observed by magnifying the 5–10 ppm region (inset of Fig. 2d). Among them, the peaks at 7.43, 7.66, 6.33, 6.60, and 6.19 ppm matched with those due to the vibration of hydrogen in the benzene ring, and the peak at 9.72 ppm was attributed to the vibration of –NH–.23,24 However, in our 1H NMR analysis, the H of the benzene ring at the edge of the DHQP molecule was significantly weaker, and the H of the –NH– structure was significantly stronger. This indicated that the benzene ring at the edge of the DHQP molecule was embedded in the structure of the conjugated C-dot core. The way in which the DHQP structure was embedded in C-dots is shown in Fig. S18.† To further explore photostability of the R-C-dots, they were exposed to a 395 nm UV lamp for testing. As shown in Fig. 3f, the original fluorescence intensity of the R-C-dots remained more than 50% after 81 h irradiation with a UV lamp (100 mW cm−2), which is better than that of o-PDA based R-C-dots synthesized in an open synthetic system.19,39 The excellent photostability is beneficial for their potential practical applications.
In order to further clarify the PL mechanism of R-C-dots, femtosecond transient absorption (TA) measurements were performed under 500 nm excitation with a resolution of 400 fs. TA spectra at varied decay times are presented in Fig. 3g. Among them, the positive peak at 530 nm was caused by excited state absorption (ESA). The negative peaks at 575, 625, and 705 nm were ascribed to stimulated emission (SE). Due to the short lifetime of SE, the negative peaks at 575, 625, and 705 nm have no obvious attenuation within the initial 10 ps, but the attenuation occurred and went faster after 10 ps. The positive transient absorption signals observed between 720 nm and 800 nm result from ESA, indicating the presence of energy levels in the excited states. As shown in Fig. 3h, when excited by an 808 nm femtosecond (fs) laser, up-conversion PL emissions of R-C-dots were found with three emission peaks located at 744, 625, and 577 nm. Fig. S19† shows a clear quadratic relationship between the excitation laser power and the PL intensity, which indicated that the up-conversion red PL of R-C-dots is due to two-photon excitation induced PL emission.40 The excellent up-conversion fluorescence properties might provide more opportunities for R-C-dots in application fields, such as anti-counterfeiting and bio-imaging.
Based on UV-vis absorption spectrum and TA results, the energy diagram of the as-prepared R-C-dots is shown in Fig. 3i. Specifically, the absorption bands at 290, 500, 535, and 569 nm correspond to absorption transitions of 0–4, 0–3, 0–2, and 0–1, respectively. Furthermore, the SE at 575, 625 and 705 nm corresponds to emission transitions of a-0, b-0 and c-0, respectively. The ESA processes at 530 and 760 nm are shown in 1–5 and 1–6. Based on the energy diagram, the PL process is dominated by the trap-states. Meanwhile, after two-photon absorption, the excited electrons also decay to the trap energy states and recombine with the holes in the ground state (S0). This explains the three emission peaks after excitation at 808 nm (0–7).
WLEDs based on R-C-dots
Considering their excellent optical properties, we encapsulated R-C-dots with polyvinylpyrrolidone (PVP) as the matrix to obtain red phosphor. As shown in Fig. 4a, the PL spectrum of commercial YAG overlaps significantly with the absorption spectrum of the R-C-dots; therefore, the red emission was significantly enhanced in the WLED, leading to a high red ratio of 34.1% (Fig. S20†). As shown in Fig. 4b, adjusting the ratio of phosphors (R-C-dots/YAG) to 2:1 and wrapping them on a 450 nm LED chip, a standard WLED was obtained (excited via 3 mA direct current), with CIE color coordinates of (0.33, 0.33) (Fig. 4c) and a correlated color temperature (CCT) of 5342 K. Due to the high-quality of the R-C-dot phosphor, the WLED has a high CRI of 94.5 (Fig. 4d and S21†). As far as we know, the high CRI is the best value for a WLED with color coordinates of (0.33, 0.33) derived from C-dots (Table S3†), showing great potential for application in the field of lighting.
 | ||
| Fig. 4 Application of R-C-dots. (a) PL spectrum of YAG (black line), and UV-vis absorption spectrum of R-C-dots. (b) Image of a WLED excited via 3 mA direct current. (c) The color coordinates of the WLED. (d) The color rendering parameters (R1–R15) of the WLED. | ||
Conclusions
In conclusion, a facile, safe and high-yield R-C-dot synthetic method was demonstrated. By controlling the pre-oxidation and acid-catalytic processes, the formation mechanism of R-C-dots was clearly revealed, as the pre-oxidation intermediate of o-PDA, aminophenol could further cross-link and polymerize with o-PDA to form R-C-dots. The R-C-dots had unique down-conversion and up-conversion luminescence properties and high PLQY (33.26%). As a proof-of-concept, the obtained R-C-dots were used as the red component of a WLED, which exhibited standard CIE color coordinates of (0.33, 0.33) and a high CRI of 94.5. Our results provide a new perspective for the controllable large-scale synthesis of red emitting C-dots, which may accelerate the transition of C-dots from laboratory to industry.Data availability
The data that support the findings of this study are available from the corresponding author upon reasonable request.Author contributions
Y. Song, Q. Jing, and H. G. Zhao conceived and designed the project. X. Y. Meng performed all the synthesis, purification, characterization of the materials, and wrote the manuscript with the help of Q. Jing, and H. G. Zhao. Y. Song helped with DFT calculations. M. R. Wang helped with NMR analysis. J. S. Lin, L. H. Wang, and J. Liu helped with some optical measurements. All authors read and approved the final manuscript.Conflicts of interest
There are no conflicts to declare.Acknowledgements
This research was supported by the Youth Innovation Team Project of the Shandong Provincial Education Department, the Taishan Scholar Program of Shandong Province (tsqn202306171), the Natural Science Foundation of Shandong Province (ZR2023QA096) and the Natural Science Foundation of Qingdao (23-2-1-3-zyyd-jch).References
- S. Xue, P. Li, L. Sun, L. An, D. Qu, X. Wang and Z. Sun, The formation process and mechanism of carbon dots prepared from aromatic compounds as precursors: a review, Small, 2023, 19, 2206180 CrossRef CAS PubMed.
- Y. Yu, Q. Zeng, S. Tao, C. Xia, C. Liu, P. Liu and B. Yang, Carbon dots based photoinduced reactions: advances and perspective, Adv. Sci., 2023, 10, 2207621 CrossRef CAS PubMed.
- B. Geng, J. Hu, Y. Li, S. Feng, D. Pan, L. Feng and L. Shen, Near-infrared phosphorescent carbon dots for sonodynamic precision tumor therapy, Nat. Commun., 2022, 13, 5735 CrossRef CAS PubMed.
- X.-W. Hua, Y.-W. Bao and F.-G. Wu, Fluorescent carbon quantum dots with intrinsic nucleolus-targeting capability for nucleolus imaging and enhanced cytosolic and nuclear drug delivery, ACS Appl. Mater. Interfaces, 2018, 10, 10664–10677 CrossRef CAS PubMed.
- Y. Jiao, Y. Liu, Y. Meng, Y. Gao, W. Lu, Y. Liu, X. Gong, S. Shuang and C. Dong, Novel processing for color-tunable luminescence carbon dots and their advantages in biological systems, ACS Sustain. Chem. Eng., 2020, 8, 8585–8592 CrossRef CAS.
- D. Li, E. Kou, W. Li, H. Zhang, X. Zhang, J. Zhuang, Y. Liu, C. Hu, Y. Zheng and Q. Yang, Oxidation-induced quenching mechanism of ultrabright red carbon dots and application in antioxidant RCDs/PVA film, Chem. Eng. J., 2021, 425, 131653 CrossRef CAS.
- J. Liu, T. Kong and H.-M. Xiong, Mulberry-leaves-derived red-emissive carbon dots for feeding silkworms to produce brightly fluorescent silk, Adv. Mater., 2022, 34, 2200152 CrossRef CAS PubMed.
- Y. Zhang, Y. Wu, J. Wang, Y. Hu, W. Fang, J. Dang, Y. Wu, X. Li, H. Zhao and Z. Li, Optimization of ionic liquid-mediated red-emission carbon dots and their imaging application in living cells, ACS Sustain. Chem. Eng., 2020, 8, 16979–16989 CrossRef CAS.
- X. Wang, Y. Han, W. Li, J. Li, S. Ren, M. Wang, G. Han, J. Yu, Y. Zhang and H. Zhao, Doped carbon dots enable highly efficient multiple-color room temperature phosphorescence, Adv. Optical Mater., 2023, 12, 2301962 CrossRef.
- H. Yuan, P. Liu, J. Ren, Z. Jiang, X. Wang and H. Zhao, Carbon dot hybrid porous carbon nanofibers as efficient electrocatalysts for the oxygen reduction reaction, Mater. Chem. Front., 2024, 8, 1643–1650 RSC.
- Y. Han, L. Liccardo, E. Moretti, H. Zhao and A. Vomiero, Synthesis, optical properties and applications of red/near-infrared carbon dots, J. Mater. Chem. C, 2022, 10, 11827–11847 RSC.
- C. Ji, W. Xu, Q. Han, T. Zhao, J. Deng and Z. Peng, Light of carbon: recent advancements of carbon dots for LEDs, Nano Energy, 2023, 114, 2211–2855 CrossRef.
- P. Li, L. Sun, S. Xue, D. Qu, L. An, X. Wang and Z. Sun, Recent advances of carbon dots as new antimicrobial agents, SmartMat, 2022, 3, 226–248 CrossRef CAS.
- X. Li, Y. Fu, S. Zhao, J. Xiao, M. Lan, B. Wang, K. Zhang, X. Song and L. Zeng, Metal ions-doped carbon dots: synthesis, properties, and applications, Chem. Eng. J., 2022, 430, 133101 CrossRef CAS.
- W. Liang, S.-K. Sonkar, D. Saini, K. Sheriff, B. Singh, L. Yang, P. Wang and Y.-P. Sun, Carbon dots: classically defined versus organic hybrids on shared properties, divergences, and myths, Small, 2023, 19, 2206680 CrossRef CAS PubMed.
- S.-Y. Lim, W. Shen and Z. Gao, Carbon quantum dots and their applications, Chem. Soc. Rev., 2015, 44, 362–381 RSC.
- H. Liu, X. Zhong, Q. Pan, Y. Zhang, W. Deng, G. Zou, H. Hou and X. Ji, A review of carbon dots in synthesis strategy, Coord. Chem. Rev., 2024, 498, 215468 CrossRef CAS.
- B. Wang and S. Lu, The light of carbon dots: From mechanism to applications, Matter, 2022, 5, 110–149 CrossRef CAS.
- Y. Ma, L. Wu, X. Ren, Y. Zhang and S. Lu, Toward kilogram-scale preparation of full-color carbon dots by simply stirring at room temperature in air, Adv. Funct. Mater., 2023, 33, 2305867 CrossRef CAS.
- H. Sun, P. Xia, H. Shao, R. Zhang, C. Lu, S. Xu and C. Wang, Heating-free synthesis of red emissive carbon dots through separated processes of polymerization and carbonization, J. Colloid Interface Sci., 2023, 646, 932–939 CrossRef CAS PubMed.
- W. Xu, Q. Han, C. Ji, F. Zeng, X. Zhang, J. Deng, C. Shi and Z. Peng, Solid-state, hectogram-scale preparation of red carbon dots as phosphor for energy-transfer-induced high-quality white LEDs with CRI of 97, Small, 2023, 19, 2304123 CrossRef CAS PubMed.
- M. Zheng, H. Jia, B. Zhao, C. Zhang, Q. Dang, H. Ma, K. Xu and Z.-A. Tan, Gram-Scale Room-Temperature Synthesis of Solid-State Fluorescent Carbon Nanodots for Bright Electroluminescent Light Emitting Diodes, Small, 2023, 19, 2206715 CrossRef CAS PubMed.
- P. Li, S. Xue, L. Sun, X. Zong, L. An, D. Qu, X. Wang and Z. Sun, Formation and fluorescent mechanism of red emissive carbon dots from o-phenylenediamine and catechol system, Light Sci. Appl., 2022, 11, 298 CrossRef CAS PubMed.
- X.-Y. Meng, Y. Song, Q. Jing and H.-G. Zhao, Self-precipitation of highly purified red emitting carbon dots as red phosphors, J. Phys. Chem. Lett., 2023, 14, 9176–9182 CrossRef CAS PubMed.
- Y.-F. Liang, X. Li, X. Wang, M. Zou, C. Tang, Y. Liang, S. Song and N. Jiao, Conversion of simple cyclohexanones into catechols, J. Am. Chem. Soc., 2016, 138, 12271–12277 CrossRef CAS PubMed.
- Q. Wu, D. Yan, Y. Chen, T. Wang, F. Xiong, W. Wei, Y. Lu, W.-Y. Sun, J.-J. Li and J. Zhao, A redox-neutral catechol synthesis, Nat. Commun., 2017, 8, 14227 CrossRef PubMed.
- Q. Zhang, R. Wang, B. Feng, X. Zhong and K. Ostrikov, Photoluminescence mechanism of carbon dots: triggering high-color-purity red fluorescence emission through edge amino protonation, Nat. Commun., 2021, 12, 6856 CrossRef CAS PubMed.
- L. Cao, M. Zan, F. Chen, X. Kou, Y. Liu, P. Wang, Q. Mei, Z. Hou, W.-F. Dong and L. Li, Formation mechanism of carbon dots: from chemical structures to fluorescent behaviors, Carbon, 2022, 194, 42–51 CrossRef CAS.
- D. Sharma, N. Kotwal and P. Chauhan, Electro-oxidative synthesis of phenazines, Org. Lett., 2023, 25, 3772–3777 CrossRef CAS PubMed.
- Y. Wang, Y. Liu, X. Hao, X. Zhou, H. Peng, Z. Shen, I.-I. Smalyukh, X. Xie and B. Yang, Supramolecular liquid crystal carbon dots for solvent-free direct ink writing, Adv. Mater., 2023, 35, 2303680 CrossRef CAS PubMed.
- L. Xu, S. Li, H. Tu, F. Zhu, H. Liu, W. Deng, J. Hu, G. Zou, H. Hou and X. Ji, Molecular engineering of highly fluorinated carbon dots: tailoring Li+ dynamics and interfacial fluorination for stable solid lithium batteries, ACS Nano, 2023, 17, 22082–22094 CrossRef PubMed.
- B. Zhao, H. Ma, H. Jia, M. Zheng, K. Xu, R. Yu, S. Qu and Z.-A. Tan, Triphenylamine-derived solid-state emissive carbon dots for multicolor high-efficiency electroluminescent light-emitting diodes, Angew. Chem., Int. Ed., 2023, 62, e202301651 CrossRef CAS PubMed.
- C. Ji, Q. Han, Y. Zhou, J. Wu, W. Shi, L. Gao, R.-M. Leblanc and Z. Peng, Phenylenediamine-derived near infrared carbon dots: the kilogram-scale preparation, formation process, photoluminescence tuning mechanism and application as red phosphors, Carbon, 2022, 192, 198–208 CrossRef CAS.
- Y. Xian and K. Li, Hydrothermal synthesis of high-yield red fluorescent carbon dots with ultra-narrow emission by controlled O/N elements, Adv. Mater., 2022, 34, 2201031 CrossRef CAS PubMed.
- H. Ding, J.-S. Wei, P. Zhang, Z.-Y. Zhou, Q.-Y. Gao and H.-M. Xiong, Solvent-controlled synthesis of highly luminescent carbon dots with a wide color gamut and narrowed emission peak widths, Small, 2018, 14, 1800612 CrossRef PubMed.
- B. Wang, Z. Wei, L. Sui, J. Yu, B. Zhang, X. Wang, S. Feng, H. Song, X. Yong, Y. Tian, B. Yang and S. Lu, Electron–phonon coupling-assisted universal red luminescence of o-phenylenediamine-based carbon dots, Light Sci. Appl., 2022, 11, 172 CrossRef CAS PubMed.
- W. Li, X. Wang, J. Lin, X.-Y. Meng, L. Wang, M. Wang, Q. Jing, Y. Song, A. Vomiero and H. Zhao, Controllable and large-scale synthesis of carbon quantum dots for efficient solid-state optical devices, Nano Energy, 2024, 122, 109289 CrossRef CAS.
- Q. Zhang, F. Wang, R. Wang, J. Liu, Y. Ma, X. Qin and X. Zhong, Activating one/two-photon excited red fluorescence on carbon dots: emerging n→π photon transition induced by amino protonation, Adv. Sci., 2023, 10, 2207566 CrossRef CAS PubMed.
- S.-Y. Tang, D. Chen, Y.-S. Yang, C.-X. Wang, X.-M. Li, Y.-R. Wang, C.-J. G and Z. Cao, Mechanisms behind multicolor tunable near-infrared triple emission in graphene quantum dots and ratio fluorescent probe for water detection, J. Colloid Interface Sci., 2022, 617, 182–192 CrossRef CAS PubMed.
- S. Lu, L. Sui, J. Liu, S. Zhu, A. Chen, M. Jin and B. Yang, Near-infrared photoluminescent polymer-carbon nanodots with two-photon fluorescence, Adv. Mater., 2017, 29, 1603443 CrossRef PubMed.
Footnote |
| † Electronic supplementary information (ESI) available. See DOI: https://doi.org/10.1039/d4sc02331e |
| This journal is © The Royal Society of Chemistry 2024 |