
 Open Access Article
 This Open Access Article is licensed under a Creative Commons Attribution-Non Commercial 3.0 Unported Licence
Characterization of emerging 2D materials after chemical functionalization
Marina
Garrido
 ,
Alicia
Naranjo
and
Emilio M.
Pérez
*
,
Alicia
Naranjo
and
Emilio M.
Pérez
*
IMDEA Nanociencia, Faraday 9, 28049, Madrid, Spain. E-mail: emilio.perez@imdea.org
First published on 7th February 2024
Abstract
The chemical modification of 2D materials has proven a powerful tool to fine tune their properties. With this motivation, the development of new reactions has moved extremely fast. The need for speed, together with the intrinsic heterogeneity of the samples, has sometimes led to permissiveness in the purification and characterization protocols. In this review, we present the main tools available for the chemical characterization of functionalized 2D materials, and the information that can be derived from each of them. We then describe examples of chemical modification of 2D materials other than graphene, focusing on the chemical description of the products. We have intentionally selected examples where an above-average characterization effort has been carried out, yet we find some cases where further information would have been welcome. Our aim is to bring together the toolbox of techniques and practical examples on how to use them, to serve as guidelines for the full characterization of covalently modified 2D materials.
1. Introduction
Since the isolation of graphene in 2004,1 other 2D materials have attracted the attention of the scientific community, such as transition metal dichalcogenides (TMDCs),2 boron nitride (BN)3 and elemental analogues of graphene4 (e.g., black phosphorus (BP),5,6 germanene,7,8 silicene9,10 and antimonene11,12), among others, due to their remarkable properties.13Once these materials are exfoliated into single or few-layered flakes, some drawbacks emerge. In all cases, the exfoliated 2D materials tend to aggregate due to van der Waals interactions between layers.14–16 In addition, some of these nanomaterials are chemically unstable, namely BP,17 silicene18 or germanene,19 which rapidly oxidize under ambient conditions. In the case of TMDCs, their modification is sometimes convenient to obtain suitable values for their implementation on optoelectronic devices.20
Chemical functionalization with molecular fragments is a powerful tool to overcome these limitations, helping to improve the notable characteristics of 2D materials or introduce new ones.21–24 To name just a few examples, it is possible to open a bandgap in graphene25 or to modify the insulating behaviour of BN.26 The protection against oxidation of BP has also been achieved,27,28 enabling its use in devices exposed to air. The introduction of fluorophores onto the surface of MoS2 leads to 2D fluorescent materials that could be employed in biomedical fields.29
To reach these aims, both the covalent or non-covalent chemistries of 2D materials have been explored.21,30,31 The covalent functionalization takes place by the formation of new bonds between the surface of the materials and the molecular reagent(s) (Fig. 1). This strategy necessarily causes structural changes in the 2D materials, and therefore in their electronic structure at least to some extent, which might or might not be desirable.31,32 On the purely positive side, the newly formed architectures are stable.33,34 On the other hand, the non-covalent modification is based on weak (when considered one by one) and inherently reversible interactions.30 In this case, the structural features of the 2D material and the molecular fragment remain pretty much intact.34 However, these supramolecular materials can be unstable since the desorption of the molecules can occur under appropriate conditions.32
 | ||
| Fig. 1 Schematic representation of the covalent functionalization of 2D materials: MoS2 on top and BP at the bottom. | ||
There has been a considerable number of reviews on the chemical functionalization of 2D materials in the last few years, most of which focus on reactivity,21,30–32 applications34–37 or tuning of properties.22,23,38 The aim of this perspective is to serve as a guideline for the adequate purification and characterization of covalently functionalized 2D materials. We believe this will be useful as the subject is often approached by groups with diverse scientific backgrounds (not necessarily chemistry) and nanochemistry is intrinsically challenging due to the heterogeneous nature of the samples.
In the following sections, we will describe the different characterization techniques together with the information that they can provide. Then, we will present practical examples of functionalization of 2D materials from the literature and focus on their chemical characterization. In some cases, the characterization protocol has been exhaustive. In some others, the reader might find that some piece(s) of the puzzle were left behind. We will present those examples according to the type of reaction employed for the covalent modification of different 2D materials.
2. Characterization techniques
The characterization of organic molecules can often be unambiguous with relatively few spectroscopic and analytical techniques, often TLC (thin layer chromatography) analysis, 1H and 13C NMR (nuclear magnetic resonance) and mass spectrometry are sufficient. In comparison, the full characterization of covalently functionalized 2D materials is significantly more complicated. This is mostly due to their intrinsically heterogeneous composition, but other factors such as their low solubility do not help either.39 It is then mandatory that a battery of multiple techniques are used for a satisfactory characterization of a covalently modified 2D material.40,41 The most common tools for the characterization of 2D materials according to the type of information that can be obtained from each of them are summarized in Table 1.| Characterization techniques | ||
|---|---|---|
| Nanostructure information | ||
| Scanning electron microscopy | SEM | Based on backscattered and/or secondary electrons from the sample |
| Morphology of the material with nm resolution | ||
| Transmission electron microscopy | TEM | Based on electrons transmitted through the sample |
| Morphology of the material with resolution down to the atomic level | ||
| Atomic force microscopy | AFM | Based on the repulsive electronic forces between a tip and the sample |
| Topographic images of the surface | ||
| Scanning tunnelling microscopy | STM | Based on the quantum tunnelling effect |
| Imaging of the density of states of the material with (sub)atomic resolution | ||
| Brunauer–Emmett–Teller analysis | BET | Based on gas (typically N2) adsorption experiments |
| Surface area and pore size information | ||
| X-ray diffraction | XRD | Based on the scattering of X-rays by the atoms of the sample |
| Information on the crystalline structure, including interplanar distance | ||
| Raman spectroscopy | Raman | Based on the inelastic scattering of photons due to vibrational states |
| Number of layers, presence of defects, etc. | ||
![[thin space (1/6-em)]](https://www.rsc.org/images/entities/char_2009.gif) |
||
| Chemical composition | ||
| Thermogravimetric analysis | TGA | Measures changes in weight as a function of temperature |
| Quantitative information about the presence of components with different decomposition/desorption temperatures | ||
| Inductively coupled plasma mass spectrometry | ICP-MS | Based on the ionizing the samples into elemental species |
| Quantitative information on the elemental composition of the materials | ||
| Energy-dispersive X-ray spectroscopy | EDS | Based on the interaction of X-rays with the sample |
| Elemental composition of the materials | ||
| X-ray photoelectron spectroscopy | XPS | Based on the interaction of X-rays with the sample |
| Binding energy of different elements, their electronic state and hybridization | ||
| Electron energy loss spectroscopy | EELS | Based on the inelastic scattering of electrons by the sample |
| Information about types of bonds in the material | ||
| Infrared spectroscopy | IR | Based on the activation of different vibrational modes under infrared radiation |
| Information about bonds present in the material | ||
| Nuclear magnetic resonance spectroscopy | NMR | Based on the magnetic interactions with the spins of the atomic nuclei |
| Information on the bonding environment of the nuclei under observation | ||
|
||
| Electronic structure | ||
| Ultraviolet-visible-near infrared | UV-Vis/NIR | Based on the absorption, reflection and scattering of light |
| Information on electronic transitions of the material | ||
| Photoluminescence spectroscopy | PL | Based on the emission of light by excited states to return to ground state |
| Information on electronic transitions of the material | ||
| Ultraviolet photoelectron spectroscopy | UPS | Based on the interaction of the sample with UV photons |
| Information about the band structure of the material in the valence region | ||
2.1. Nano/micro structure information
Bulk layered materials present robust chemical bonds within planes that are brought together through weak van der Waals interactions perpendicular to them.2,42,43 The disruption of these weak interactions allows the exfoliation of these layered materials. This process has been accomplished using mechanical (e.g., scotch-tape,1,2,11 liquid phase exfoliation (LPE),44,45 ball milling46,47), chemical (ion intercalation)48–50 and electrochemical51 methodologies, leading to single or, most often, few-layer nanosheets. It is essential to perform an initial comprehensive characterization of the starting materials (both bulk and exfoliated). This will provide an adequate comparison with the functionalized structures.Several techniques provide information about the structure of 2D materials at the nano–microscopic level, but the most immediate analysis comes from their observation under different microscopic techniques. Scanning electron (SEM) and transmission electron microscopy (TEM) allow to visualize objects thanks to a focused beam of electrons that interacts with the sample. In SEM, this interaction causes the emission of electrons with different energies generating images that afford data about the morphology and lateral size of the flakes, typically down to a few nm resolution. Similar information can be obtained from TEM, but in this case the image is formed by transmitted electrons,44,52 increasing the resolution to the atomic level.53 Typically, no direct information about the molecular fragments is obtained from either SEM or TEM, since molecular fragments get damaged under electron irradiation,54 and offer the same, in the case of graphene, or significantly lower contrast for other 2D materials. A notable exception are atomic defects, which can be both induced and observed under TEM conditions.55,56 Atomic force microscopy (AFM) is a type of scanning probe microscopy in which the forces between a tip and the sample are transformed into topographic images by the deflection of a cantilever attached to the tip.57 This deflection occurs in the z axis, which makes AFM ideal to obtain information about the thickness of the 2D materials, and therefore the number of layers.52 Scanning tunnelling microscopy (STM), on the other hand is based on the measurement of the quantum tunnelling current that travels from an atomically sharp tip to the surface of the material under observation. STM provides information about the local density of states of the sample with atomic resolution, from which the molecular structure can be directly inferred. Both scanning probe microscopies, AFM and STM, can provide direct structural information on the molecular functionalization of 2D materials.58,59 Brunauer–Emmett–Teller (BET) analysis is used to interpret nitrogen adsorption experiments,60 allowing to determine the surface area and pore size of the samples, which indirectly provides information about their microstructure.61–63 X-ray diffraction (XRD) is based on the scattering of X-rays by the different atomic planes within a sample. For each plane the diffraction occurs with a specific angle that allows to calculate the interplanar distance, giving information about exfoliation (increase) or reaggregation (decrease) of the interlayer distance of 2D materials.64–66 Raman spectroscopy's basic principle is also scattering, but in this case excitation occurs in the UV-Vis-NIR range, so that the data obtained correspond to the difference of energy between two vibrational states.67 Their energy depends on the bonds involved, consequently each layered material possesses its own vibrational modes. Raman spectroscopy is one of the most employed techniques for 2D materials characterization. It is non-destructive, quick and provides information on several key structural features.68 For example, it allows to determine the number of layers69–73 and the presence of defects.74,75 We will see that Raman is also extremely useful for the determination of electronic properties, providing information on the degree of doping.76
2.2. Chemical composition
Regarding the chemical details of 2D materials, the characterization can provide data about the elemental composition and/or about the functional groups on the surface.Thermogravimetric analysis (TGA) measures the change in weight as a function of increasing temperature.77 It is a useful tool to characterize functionalized 2D materials, and often the first analysis that is carried out after functionalization. It gives quantitative information about the presence of different components such as impurities,78 physisorbed molecules79 and covalently attached moieties.48 In addition to the degree of functionalization (amount of molecule present in the material), more data can be obtained when TGA is coupled to mass spectrometry or gas chromatography thanks to the unambiguous assignment of the thermally cleaved fragments.41
Concerning elemental composition, atomic spectrometric techniques like inductively coupled plasma mass spectrometry (ICP-MS) are employed.80 ICP-MS uses argon plasma to ionize a sample into elemental species and detects them by mass spectrometry. One of the advantages of ICP-MS is its extremely low limit of detection, in the parts per trillion range.81,82 Other methods to analyse the elemental composition are based on X-rays. Energy-dispersive X-ray spectroscopy (EDS) is built on the emission of X-rays from a sample when an incident electron beam interacts with it. These X-rays are generated by the energy released when an electron of an outer shell occupies an atomic vacancy in an inner shell.83 The energy of the emitted X-rays is characteristic of each element, which gives direct information about the chemical composition of the sample.84,85 X-ray photoelectron spectroscopy (XPS) is based on the photoelectric effect.86 In this case, the 2D material is irradiated with X-rays and the kinetic energy of the emitted electrons allows to determine their binding energy, which is related with the different elements, their electronic state and their type of hybridization.87 Therefore, XPS does not only provide information about the elemental composition, but also about the chemical environment of each of the elements. Similar information can be obtained by electron energy loss spectroscopy (EELS) where the energy lost by electrons that suffer inelastic scattering during electron microscopy is analysed. From this, one can extract information about the chemical composition and the types of bonds in the material, but in this case with the added value of spatial resolution, in some cases down to the atomic level.88 Infrared spectroscopy (IR) is a standard technique available in almost every laboratory. It is fast and non-destructive, and very useful as first analysis to determine the modification of 2D materials.89 When a sample is irradiated with infrared light different vibrational modes are activated, which are related to specific kinds of bonds, functional groups, and/or molecular interactions.90,91 Therefore, IR spectroscopy provides information about the covalent92 and non-covalent93 functionalization of 2D materials, its coordination with ligands94 and the presence of certain functional groups,95 among others. NMR is based on the irradiation of the sample with electromagnetic pulses, generating magnetic interactions with the spins of the atomic nuclei, whose different relaxation after the pulses gives information about their chemical environment.96 NMR reigns supreme in organic molecular characterization, but has not yet penetrated the world of 2D materials as much as it should. Solution NMR spectroscopy is of course limited by the low solubility of the functionalized 2D nanostructures.40 For this reason, solid-state NMR has been revealed as a more suitable tool for this kind of materials. Due to the broad and weak signals that characterize the NMR spectra of solids, the coupling with the magic angle spinning (MAS)97 and the cross polarization (CP)98 techniques is required to improve the resolution and the signal-to-noise ratio.99 Thanks to the possibility to study several nuclei in the same sample (e.g., 31P, 13C, 1H, 15N), solid-state NMR can provide rich information about functionalized 2D materials.
2.3. Electronic structure
Structural and electronic changes come hand in hand, so some of the techniques described above provide information on the electronic structure of the chemically modified 2D materials, for example EELS. Extinction (Ultraviolet-Visible/Near Infrared, UV-Vis/NIR)2,72 and photoluminescence (PL)2,5 spectroscopies are valuable for studying the optical properties. UV-Vis/NIR refers to absorption, reflection and scattering of light of the electromagnetic spectrum in the corresponding wavelengths.100 This information directly relates to electronic transitions in the materials, and therefore their electronic structure. For example, the 2H (semiconducting phase) and 1T (metallic phase) polytypes of MoS2 can be easily distinguished by the presence (2H) or absence (1T) of excitonic features in the red region of the electromagnetic spectrum.101 The differences between both polytypes arise from the different coordination of the metal atoms, which is trigonal-prismatic in the 2H-phase and octahedral in the 1T one. This different coordination affects the electronic band structure of MoS2 due to the different splitting and filling of the d-orbitals, which is complete for the 2H-phase and partial for the 1T.102,103 This technique can also be used to verify the functionalization if the molecular fragments are chromophores.104,105 Specific functional groups, like thiols or amines, can be detected indirectly by the formation of coloured derivatives that can be identified by UV-Vis spectroscopy. In the case of thiol groups, they are detected with Ellman's reagent106 and for the amine derivatives the Kaiser test is the most employed methodology.40 Which makes mandatory to use complementary techniques. PL relays on the emission of light from a material after an electronically excitation by absorbing photons. It is widely used to determine bandgap energies and their changes due to functionalization.107,108 If the organic addends are endowed with fluorophores, PL can prove their presence.105 Ultraviolet photoelectron spectroscopy (UPS) is a method for quantifying the energy levels associated with valence states on surfaces of metals and semiconductors.109 Its importance is highlighted for studying the band structure and energy levels of semiconductors. Nevertheless, its limited surface sensitivity and the high vacuum requirements make UPS a technique of only limited use. Last, Raman spectroscopy, as previously described, will provide indirect information about electronic properties (changes induced by charge transfer effects).108,110,111In summary, a complete characterization of a covalently functionalized 2D material must contain unambiguous information on its nanostructure (number of layers, lateral size, defects, polytype…), its chemical composition (degree of functionalization, elements present and type(s) of bonds between the molecular fragment(s) and the 2D material) and the influence of the chemical functionalization on the electronic properties of the 2D material (doping, number of defects, etc.).
3. Covalent chemistry of 2D materials: the challenge of characterization
In the last years, several reviews about the covalent functionalization of 2D materials have been published.21,23,32,33 Most of them focus on the reactivity, that is, which reactions work for which material, so the reader is encouraged to refer to those works for more detailed information.In the following paragraphs we will briefly overview the types of reactions employed for the covalent functionalization of 2D materials and the characterization techniques used to determine the successful preparation of these nanostructures. For practical purposes, we will exclude graphene, since its chemistry has been reviewed exhaustively33,39,112–114 and the discussion about characterization processes is applicable to any 2D material.
3.1. Nucleophilic substitution
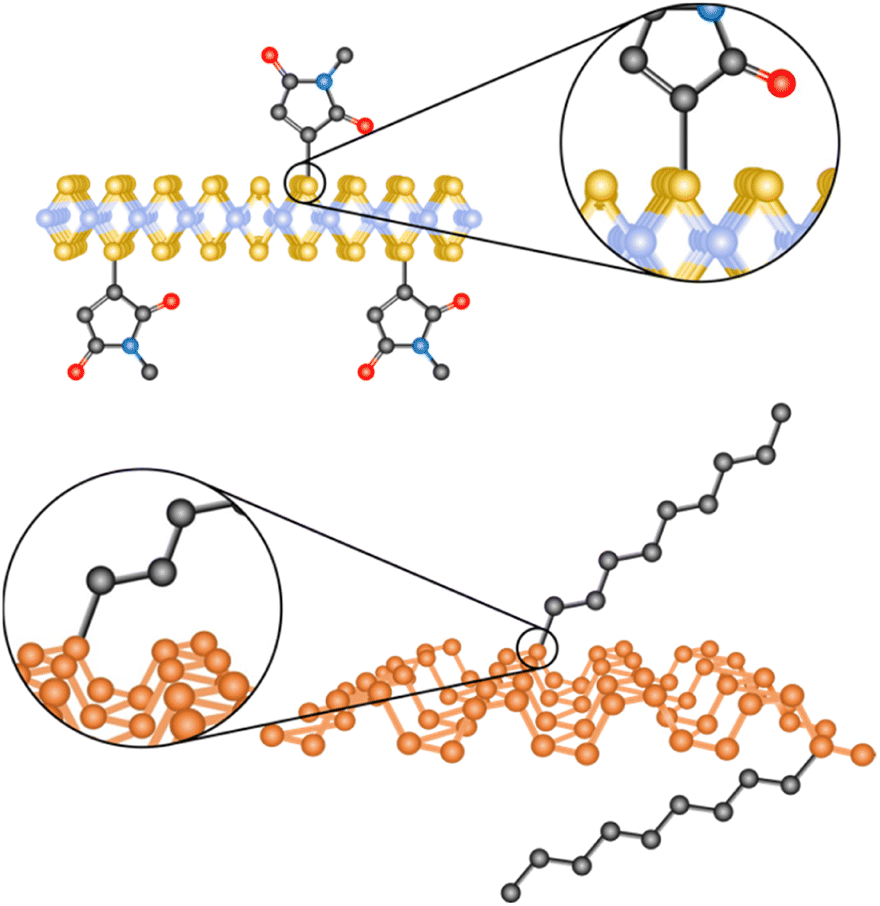
Nucleophilic substitution reactions are based on an electron-rich nucleophile that attacks an electron deficient electrophilic atom, resulting in the displacement of a leaving group.115 From this perspective, 2D materials that can be considered nucleophilic are BP, due to the lone pair electrons on the phosphorous,21 MoS2, because of the soft nucleophilic character of sulfur98 and several negatively charged intercalated 2D materials.116,117The pioneering work of Chhowalla and co-workers, demonstrating the covalent functionalization of the negatively charged intercalated 1T-MoS2 with iodoacetamide (Fig. 2a),92 has paved the way to the covalent functionalization of several 2D materials beyond graphene.118,119 This strategy allows the functionalization of the basal plane of 1T-MoS2 and highlights the importance of a comprehensive characterization to unambiguously prove the covalent functionalization. The chemically exfoliated material contains a mixture of 1T and 2H phases, where the phase concentration was estimated by XPS (Mo 3p), showing a 65% of 1T-phase. Its Raman spectrum exhibited the characteristic bands of 2H-MoS2 (E12g and A1g) and those associated with the 1T-phase (J1, J2 and J3). The functionalization was performed in solution and the material was fully characterized. IR analysis showed a new band at 1223 cm−1 related to the formation of S–CH2 bonds together with the carbonyl amide signal (ca. 1600 cm−1) endowing the attachment with a covalent nature. The formation of the S–C bond was corroborated by XPS with the appearance of a shoulder at ca. 164 eV on the S 2p core level spectrum of the functionalized 1T-MoS2. The C 1s and N 1s core level spectra proved the presence of the amide. The degree of functionalization calculated from the XPS data was in agreement with the one estimated by TGA. The attachment of iodoacetamide was also supported by solid-state 13C NMR. Besides, in the Raman spectrum some changes were noticed, as the down shift and increase on intensity of the J2 and J3 bands and the split of J1 and were attributed to the covalent modification. Control experiments were performed to further proved the covalent functionalization: 2H-MoS2 was reacted with the reagent and no functionalization was detected by XPS (N 1s core level), the same result was obtained when 1T-MoS2 was mixed with acetamide without iodine. All these results were also tested and demonstrated for WS2 and MoSe2, evidencing that the functionalization could only be performed for 1T-phase materials, and from here by annealing, materials could relax to 2H-phase, with no possible direct pathway. However, changing the reacting molecule could open new ways for the nucleophilic substitution chemistry.
 | ||
| Fig. 2 Schematic representation of the MoS2 functionalization strategies for (a) 1T-phase using halide derivatives and (b) 2H-phase using maleimide derivatives. | ||
The use of other electrophiles can afford new strategies for the covalent modification of 2D materials. For this purpose, our group developed the covalent functionalization of 2H-MoS2 through thiol–ene chemistry, using maleimide derivatives as soft electrophiles (Fig. 2b). The starting material was characterized by AFM, TEM, Raman and UV-Vis/NIR spectroscopies to clarify its 2H-phase structure after the exfoliation through LPE. The majority of flakes were shown to be <10 nm thick (from AFM), with lateral sizes between 100 and 600 nm (from TEM). The presence of the characteristic excitonic bands in the UV-Vis/NIR and the Raman signatures of 2H-MoS2 showed that the polytype did not change during the functionalization protocol. Then, several maleimide derivatives were used to perform the functionalization in the presence of triethylamine, under mild conditions.98 TGA was carried out to assess the nature of the modification, the large increase in the desorption temperature of the maleimide points to its covalent bond, as corroborated by the deliberate preparation of the material with both physisorbed and covalently attached molecules, that showed two well differentiated weight losses. At this point it is worth to mention that UV-Vis/NIR measurements during the washing steps were key to prove the removal of the unreacted and physisorbed species (no signal from maleimide was observed). The covalent functionalization of 2H-MoS2 was also corroborated by IR, solid-state 13C NMR and XPS. A detailed comparison between the degree of functionalization calculated by TGA and XPS showed discrepant results, suggesting the formation of oligomers covalently bonded to the surface of the material.120 The formation of oligomers of maleimide was proved employing the same reaction conditions but in the absence of 2H-MoS2. To avoid the functionalization of the material with oligomers, the reaction was carried out in the absence of triethylamine. In this case, the degree of functionalization calculated by TGA agreed with the XPS one, and the formation of the S–C bond was supported by all the characterization techniques. Besides, the characterization after functionalization confirmed that the process did not alter the 2H nature of the TMDCs nanosheets (e.g., E12g and A1g Raman modes were slightly shifted comparing pristine to functionalized samples).
The covalent modification employing maleimide derivatives has been carried out with other sulfide-based 2D materials (e.g., franckeite and few-layer FePS3)97,121 and also allowed the construction of 2D homo and heterostructures.122,123 The mild conditions of this type of chemistry make it useful for obtaining MoS2–DNA bioconjugates,124 or to tailor the electronic properties of field-effect transistors by direct on-device chemistry.125
In a recent work, Hirsch and co-workers described the bisfunctionalization of 1T-MoS2 employing an alkyl iodide and an aryl diazonium salt.126 They found that the bisfunctionalized material can only be obtained performing first the nucleophilic attack to the alkyl iodide and subsequently to the aryl diazonium salt. TGA coupled with mass spectrometry provided the first hints about the importance of the reaction order. When 1T-MoS2 was first reacted with the iodide derivative and subsequently with the aryl diazonium salt, an increase of weight loss was observed from the first functionalized material (alkylated) to the second one. However, when the order of the reactions was reversed, the weight loss did not increase after the second reaction and the fragment related to the alkyl chain was observed in a low temperature region and in a small amount. XPS also corroborated these results. No changes were noticed on the content of C and Br when the alkylation was performed on second place. If the alkyl chain was covalently bonded to 1T-MoS2, the content of C should be increased in comparison with the C content of the first functionalized material (arylated). The degree of functionalization calculated from XPS agreed with the TGA results. Raman spectroscopy also provided details about the degree of functionalization. After reaction, a new band at 210 cm−1 arose in the spectra of all functionalized materials. Its relative intensity to the E12g and A1g increased with the degree of functionalization. Solid-state 13C NMR further proved the bisfunctionalization of the material only when the alkylation was performed in first place. After the reaction of 1T-MoS2 with the alkyl iodide derivative, the characteristic signal of the α-C bonded to iodine disappeared due to the S–C bond being formed. The following reaction of the alkylated 1T-MoS2 with the aryl diazonium salt gave rise to the aromatic signal associated to the phenyl ring, proving the bisfunctionalization of the material. On the other hand, when the aryl diazonium salt was reacted first with 1T-MoS2, the aromatic signal related to the phenyl ring was clearly noticed. However, the subsequent reaction with the alkyl iodide only showed peaks with a very low intensity on the aliphatic region, where one of them corresponds to the α-C bonded to iodine. These results point out to the physisorption of the alkyl iodide and agreed with the TGA ones. Besides, these data showed that the functionalization with aryl diazonium salts is more efficient than the one with alkyl halides due to the different degree of functionalization obtained after the first reaction.
Pumera and co-workers showed the successful functionalization of BP through reaction with alkyl halide derivatives.127 Exfoliated BP was prepared and successive reactions with the electrophilic reagents lead to the formation of P–O–C (due to oxygenated functionalities from oxidated BP) or P–C bonds. The residual oxidation of exfoliated BP was proved by the vibration bands of P![[double bond, length as m-dash]](https://www.rsc.org/images/entities/char_e001.gif) O and P–O functionalities in its IR spectrum and their peak in XPS. Significant changes have been observed in the IR spectra after the nucleophilic reaction. P–O–C and P–O functionalities show their vibration bands at ca. 1020 cm−1, while the P–C bond can be attributed to the additional vibrational band appearing at 850 cm−1, evidencing the formation of the new bond. These results were supported by XPS, where spectra displayed the content of heteroatoms in the modified structures (e.g., sulfur in the case of using (S)-bromomethyl ethanethioate or fluorine for 1,1,1,2,2,3,3,4,4,5,5,6,6-tridecafluoro-8-iodooctane and 1-(bromomethyl)-2,3,4,5,6-pentafluorobenzene). Raman studies were also performed comparing exfoliated with modified BP. Two new bands located at 230 and 195 cm−1 arose after reaction, which are related with the distortion of the lattice due to the attached molecules.116,128
O and P–O functionalities in its IR spectrum and their peak in XPS. Significant changes have been observed in the IR spectra after the nucleophilic reaction. P–O–C and P–O functionalities show their vibration bands at ca. 1020 cm−1, while the P–C bond can be attributed to the additional vibrational band appearing at 850 cm−1, evidencing the formation of the new bond. These results were supported by XPS, where spectra displayed the content of heteroatoms in the modified structures (e.g., sulfur in the case of using (S)-bromomethyl ethanethioate or fluorine for 1,1,1,2,2,3,3,4,4,5,5,6,6-tridecafluoro-8-iodooctane and 1-(bromomethyl)-2,3,4,5,6-pentafluorobenzene). Raman studies were also performed comparing exfoliated with modified BP. Two new bands located at 230 and 195 cm−1 arose after reaction, which are related with the distortion of the lattice due to the attached molecules.116,128
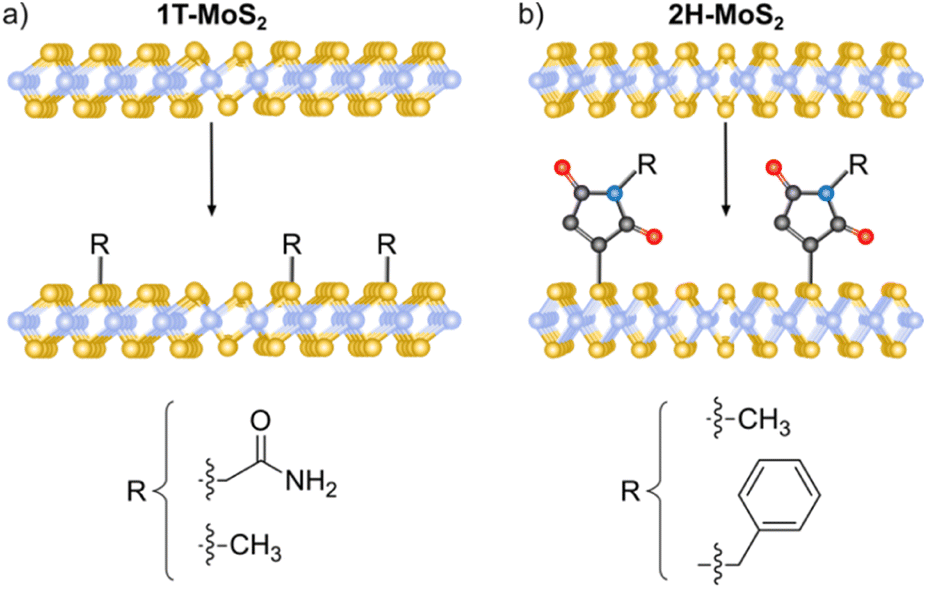
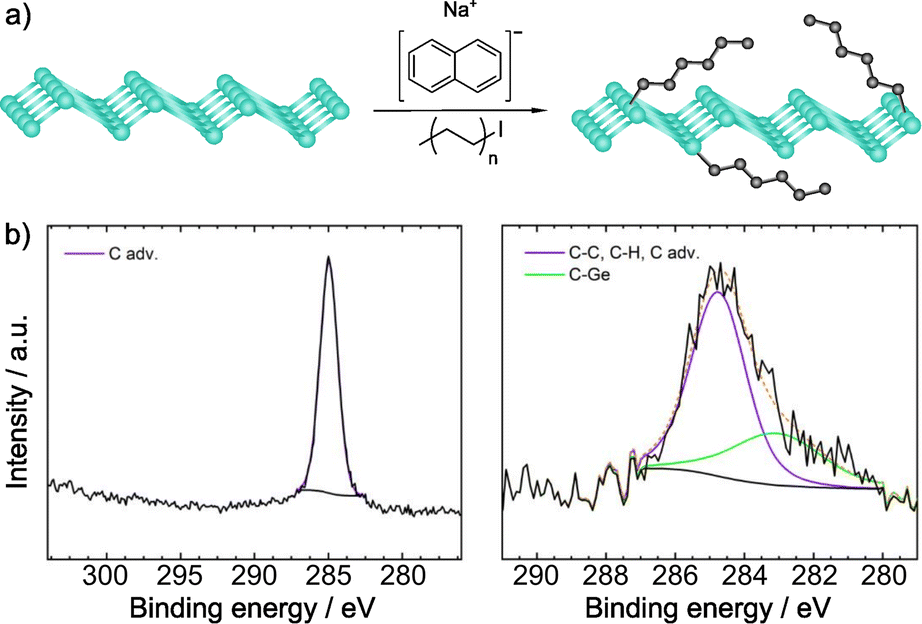
More recently, Hirsch and co-workers described the covalent functionalization of negatively charged BP using iodomethane, CH3I (Fig. 3).116,128 First, BP exfoliation was performed by intercalation of different amounts of alkali metals (mainly sodium).49 Covalent functionalization of exfoliated BP was carried out by dispersing the intercalated material and the alkylation compound in an inert solvent (THF), where NaI was formed as a byproduct. The successful methylation was demonstrated by solid-state NMR (31P), where a shoulder at 23.7 ppm was observed in the spectrum of the product, due to the covalent nature of the new P–C bond. Besides, the analysis of the 13C NMR spectrum also evidenced the presence of the methyl groups (with a small peak at 12.1 ppm). The covalent functionalization was further proved by Raman spectroscopy. New Raman modes below 300 cm−1 and at ca. 700 and 3000 cm−1 were noticed after the reaction. The first one was associated to the distortion of the BP lattice after functionalization, meanwhile the band at 700 cm−1 was related to the P–C bond and the one at 3000 cm−1 to the C–H vibrational mode of the methyl group. The ratio of the intensities of these last two Raman modes and that of the BP A2g band (ca. 450 cm−1) allowed to evaluate the degree of functionalization in a comparable manner to the analysis of the ID/IG ratio for graphene chemistry.129 It was found that the greater the exfoliation, the higher the functionalization, as expected.
 | ||
| Fig. 3 (a) Schematic representation of the intercalation of Na (purple atoms on the structure, of the left) and methylation of BP structure (on the right); (b) Raman spectra of functionalized BP with high amount of intercalated Na (left, NaP4) and low amount of intercalated Na (right, NaP12). Adapted from ref. 116, Copyright 2020, Wiley-VCH. | ||
As previously seen, 31P and 13C NMR studies provide clear information about the covalent functionalization of BP when alkyl halides are involved. However, it is not easy to extrapolate this technique to other materials like BN or MoS2, whose main nuclei have lower sensitivity.130,131
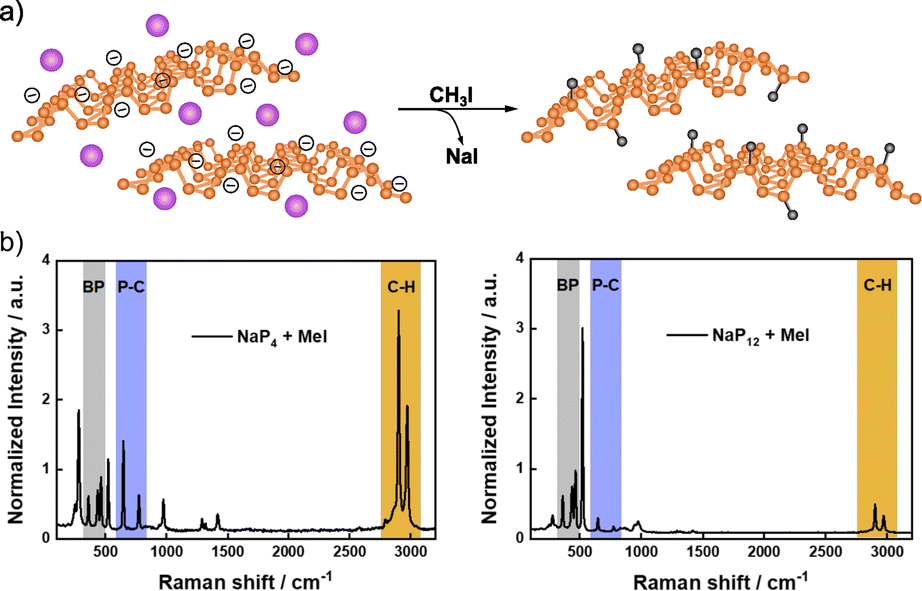
Recently, Hu and co-workers demonstrated that alkyl halides can also be used for the covalent functionalization of solvent-exfoliated BN nanosheets through reductive activation of boron atoms, increasing the reactivity of the lattice (Fig. 4).117 AFM measurements show that the thickness of bulk BN was reduced from 80 nm to 2 nm after exfoliation process. Furthermore, IR analyses after functionalization were performed proving the binding through the appearance of a B–C stretching band (1150 cm−1) and small changes in the region of 2800–3000 cm−1 due to the asymmetric and symmetric stretching modes of C–H bonds. The attachment of the alkyl chains was corroborated by TGA. In addition, this analysis allowed to study the influence of the chain length (C4, C12, C18) and the strength of the leaving group (Cl, Br, I) on the reactivity of the material. The trends observed were as expected, with iodine derivatives and shorter alkyl chains leading to higher functionalization.
 | ||
| Fig. 4 (a) Schematic representation of the nucleophilic attack of reduced boron nitride nanosheets (BNNSs) to several alkyl halides (according to the chain length and different heteroatoms). (b) IR spectra of all the species. Reproduced from ref. 117 with permission from the Royal Society of Chemistry. | ||
Furthermore, XPS studies were carried out to characterize the composition of the materials and the content of different heteroatoms (B, N and C, among others), and slight differences on the B 1s and C 1s peaks were noticed when comparing the modified material to the solvent-exfoliated one. The modification of the BN surface after the reaction was also studied by Z-potential, observing differences between the exfoliated (−37.6 mV) and the obtained product (−19.7 mV). These changes were also reflected on the dispersibility, the modified BN was easily dispersible in chloroform.
The alkylation of elemental analogues of graphene has also been reported. Rieger and co-workers demonstrated that fully hydrogenated silicene can be alkylated with different molecules using Lewis acid catalysed hydrosilylation, where the resulting material showed a thickness up to 4 nm.18 The vibration bands associated with the presence of alkyl chains (ca. 2900 cm−1) have been observed in the IR spectra of the products. Besides, the bands corresponding to the unsaturated bonds involved on the reaction (double or triple bonds) were not noticed. TGA corroborated the attachment of the reagents. XPS was carried out to investigate the reaction mechanism. Raman spectroscopy would have probably also been useful, since the Si–C bond is Raman active.132
Employing a similar protocol, fully hydrogenated germanene (germanane) was reacted with 1-dodecene. Radical-initiated and thermally induced reactions were carried out.19 Both products were characterized by IR and Raman spectroscopies, XPS, TGA and several microscopies. The IR spectra showed similar bands in both cases. The vibration bands associated with the alkyl chain arose at ca. 2900 cm−1 and the one corresponding to the CC bond was not perceived after the reaction (as in the previous example), but there are not reference to the Ge–C mode at ca. 580 cm−1 (see below). However, no obvious modification was noticed when the reaction was performed without the radical initiator at 60 °C. TGA allowed to compare between the pristine germanane and the two products and clear differences were noticed. The weight loss attributed to dehydrogenation in the pristine material was not noticed in both products, suggesting the binding between the material and 1-dodecene. Besides, the product of the thermally induced reaction showed a higher weight loss, at ca. 450 °C, than the radical-initiated one, and this other displayed another weight loss at ca. 350 °C, pointing out to the possible presence of two different covalently attached species in this material. The authors estimated the coverage of the functionalized flakes with XPS data and along with AFM results hypothesized that oligomers were formed in the thermally induced reaction. This hypothesis could be supported by TGA but the formation of oligomers in the radical-initiated reaction cannot be discarded considering those results. NMR experiments would be helpful to study the presence of oligomers (certain differences should be noticed) and the addition of the germanane to the double bond.
Recently, Sofer and co-workers have carried out the alkylation of germanane via abstraction of hydrogen and subsequent reaction with alkyl halides. Exfoliation of CaGe2 in HCl, and treatment with sodium naphthalenide afforded the deprotonated material, which was subsequently treated with the electrophilic reagents. Flakes of the functionalized material were obtained, which showed a size about 100 × 100 μm (by SEM).133 The first technique used to prove the presence of the molecules was IR spectroscopy. The vibration band corresponding to the Ge–C bond (ca. 580 cm−1) was observed for all the reagents, together with the vibrations of the alkyl groups. When perfluoro derivatives were employed, the bands associated to C–F bonds were also noticed. XPS analyses corroborated the presence of Ge–C bonds and no signals from iodine or bromine were detected (Fig. 5). After functionalization, the space between layers was estimated by XRD and, in comparison with the starting germanane, this increased (from 3.86 to 3.94 Å), further demonstrating the presence of the molecules on the surface of the material, since their reaggregation is hampered. TGA coupled with mass analysis also supported the covalent modification of germanane.
 | ||
| Fig. 5 (a) Germanane alkylation scheme. (b) C 1s core level XPS spectra of pristine germanane (left) vs. alkylated germanane (right). Adapted with permission from ref. 133, Copyright 2020 American Chemical Society. | ||
As seen on the previous examples, there are multiple techniques that can be used to prove, to a different extent, the covalent functionalization. Most of the times, combining diverse techniques is crucial for a comprehensive understanding of the functionalization. However, since access to every technique it is not always possible, the choice should be based on the specific chemistry used in the functionalization and the type of material. In our opinion, the combination of IR and Raman is generally a good starting point for the characterization. Both techniques are quick, non-destructive, and not demanding in terms of sample size or preparation. The vibrational spectra will offer insights into the functional groups of the molecular fragments and the (changes to the) structure of the 2D material. Whenever possible, complementing them with NMR is advisable for a complete characterization.
3.2. Reactions involving free radicals
By definition, a free radical is a group of atoms endowed with unpaired valence electrons or an open electron shell, which makes them extremely reactive species.134 These high reactivity can compensate for the typically inert nature of 2D materials, which have made radicals one of the preferred tools for the covalent functionalization of 2D materials. Several radicals have been used for this purpose, for example aryl radicals, carbenes and nitrenes among others. Since these species are highly reactive, they are formed in situ by different precursors (Fig. 6).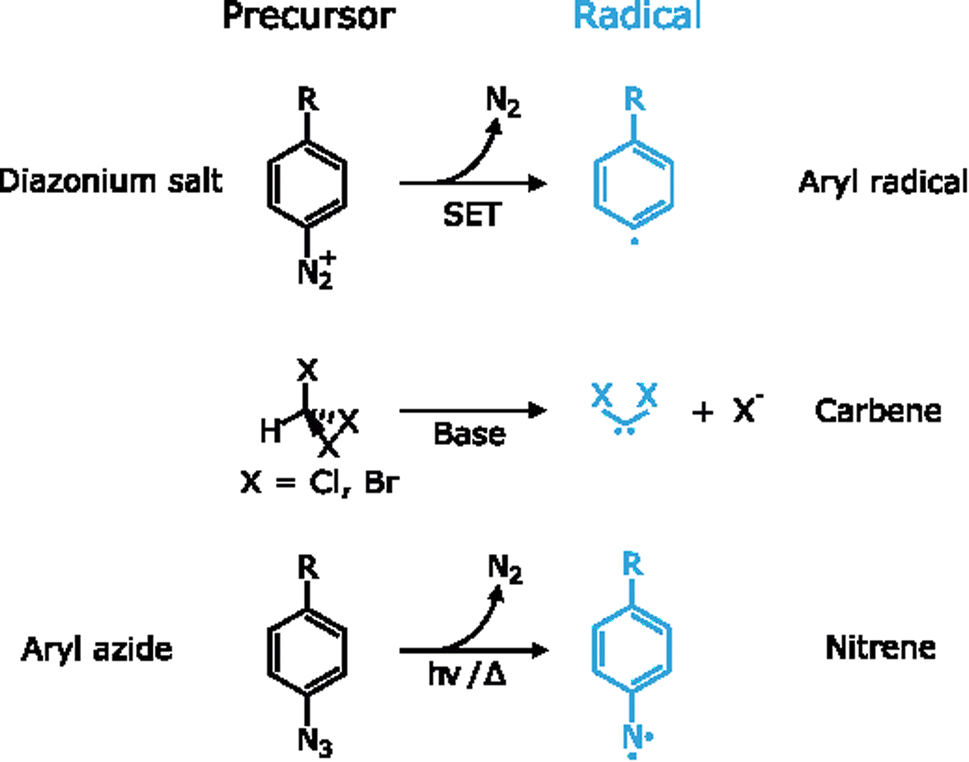 | ||
| Fig. 6 Generation of radical species for the functionalization of 2D materials: aryl radicals by single-electron transfer (SET), carbenes under basic conditions and nitrenes under irradiation/thermal activation. | ||
Aryl diazonium salts are one of the main precursors of free radicals for the functionalization of 2D materials. Upon reaction, they lead to new C–S or C–P bonds on the surface of MoS2 and BP, respectively.
With regards to the functionalization of TMDCs, MoS2 has been thoroughly studied, and among its polytypes, particularly the highly reactive metallic phase (1T-MoS2) that facilitates the reaction between the material and the reagents.92 Several works have employed aryl diazonium salts for the covalent functionalization of 1T-MoS2.95,126,135–138 Typically, the formation of C–S bonds is proved by XPS, through the appearance of a new shoulder at ca. 164 eV.95,126,135,137 The relative intensity of this shoulder increases with functionalization (Fig. 7).135
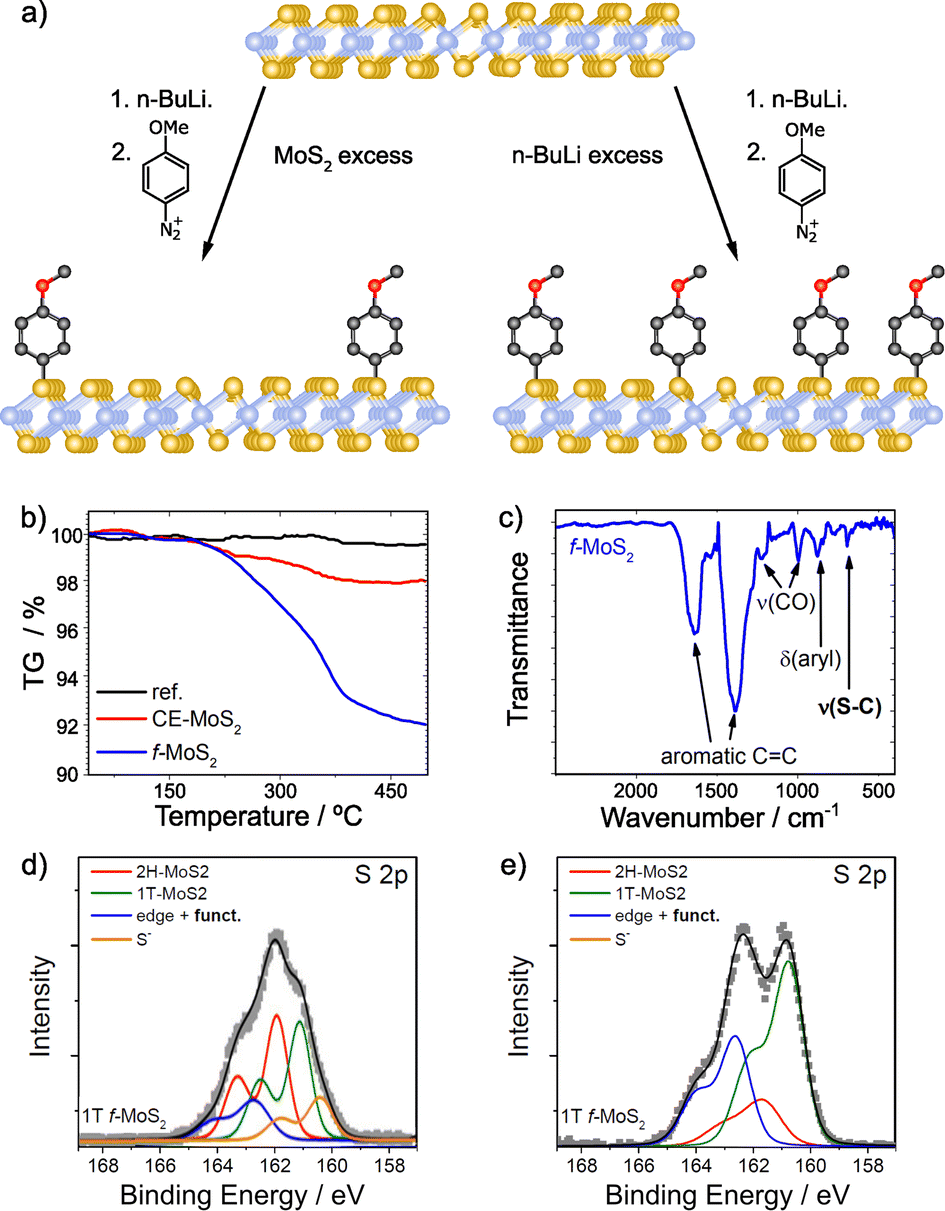 | ||
| Fig. 7 (a) Scheme of the covalent functionalization of 1T-MoS2, by following two different strategies: MoS2 excess (left) and n-BuLi excess (right); TGA and IR spectra for functionalized MoS2 in the presence of MoS2 excess are shown on (b) and (c) respectively; S 2p core level XPS spectra of the different materials: (d) MoS2 excess and (e) n-BuLi excess. Adapted with permission from ref. 135. Copyright 2015 American Chemical Society. | ||
A thorough characterization protocol to unambiguously describe the formation of C–S bonds between 1T-MoS2 and aryl diazonium salts can be found in the report by Backes and co-workers.135 Firstly, they purified and fully characterized the chemically exfoliated MoS2 (1T) to use it as control sample. The content of 1T-phase was determined by XPS and UV-Vis extinction spectroscopy and depends on intercalation conditions, being lower when MoS2 is in excess. The structure of the material is also affected by this. TGA showed that MoS2 is more stable when the amount of 1T-phase is smaller and in TEM images less damaged flakes with sizes around few 100 nm were observed. However, the exfoliation degree (72% of mono- and bilayers determined by statistical analysis of AFM data) and the Z-potential were not affected by the intercalation conditions in this case. The reaction was performed with 4-methoxyphenyldiazonium tetrafluoroborate, and the solid obtained was washed, characterized and compared with the starting material (1T-MoS2). Together with the XPS study mentioned above, complementary characterization techniques (Raman, IR and UV-Vis spectroscopies) and control experiments support the formation of the new covalent bonds. TGA coupled with mass spectrometry (TGA-MS) offered unambiguous information on the covalent functionalization. A weight loss around 7% at ca. 350 °C was observed in the obtained material in comparison with the starting one (Fig. 7b). The mass spectrum of that weight loss displayed the fragments of the 4-methoxyphenyl moiety. The presence of physisorbed or trapped molecules was discarded by the TGA-MS analysis of the control experiment, in which no changes were noticed. Comparing the Raman spectra of the starting 1T-MoS2 and the functionalized material, an increase of the intensity ratio between the A1g and 2LA(M) bands was noticed. This was associated with functionalization, since the value of the functionalized sample was higher than the one of the starting material. Furthermore, Raman spectra measured at increasing temperatures showed that the A1g/2LA(M) intensity ratio returns to that of the unfunctionalized material upon reaching the decomposition temperature of the organic materials, as measured by TGA. Perhaps the most conclusive evidence for the formation of covalent C–S bonds is the IR band at 695 cm−1 detected in the functionalized sample, a frequency which agrees well with expectations for a C–S stretching vibration (Fig. 7c). XPS also proved the functionalization of 1T-MoS2. The main differences between the precursor and the obtained material were found on the S 2p core level spectra. After the intercalation, besides the components associated with the 1T and 2H phases, another component (at lower binding energies) related to electron-rich sulfur atoms was fitted. Following the reaction, this component decreased and the one corresponding to the covalent functionalization increased (at ca. 164 eV). This result was more evident when the content of 1T-phase on the precursor is higher. In this case, the electron-rich sulfur component disappeared completely, as shown on Fig. 7d and e.
The reaction between aryl diazonium salts and MoS2 has also been carried out on the surface of the semiconducting phase (2H-MoS2) by Wang and co-workers.29 In this case, the reaction was studied both on solid supported single flakes and in suspension. The characterization of the deposited flakes was performed by AFM, XPS and Raman and PL spectroscopies. AFM and Raman allowed to determine the number of layers of the sample, which was a mixture of one to four layers material, ranging from 2 to 4 nm. After the reaction with 4-nitrobenzenediazonium salt, the more obvious changes on 2H-MoS2 were noticed on AFM and XPS analyses. AFM images showed the appearance of protrusions (increasing the height up to 6 nm in a densely molecular covered surface) after the reaction, and they were more homogeneously distributed at higher reaction times. This change on the topography points to the covalently attached molecules. XPS proved the formation of the new bond between the material and the reagent. With increasing reaction times, the components of the N 1s and C 1s related to the nitrophenyl moiety increased. Besides, a new component on the S 2p core level spectrum associated to the S–C was clearly noticed after 6 hours of reaction. The physisorption of the nitrophenyl moiety was ruled out since the XPS of the control experiment, performed with nitrobenzene, did not displayed these features. This detailed characterization, when the reaction was carried out onto MoS2 flakes deposited on substrates, clearly confirms the covalent functionalization.
For the samples reacted in suspension, the starting 2H-MoS2 was exfoliated by LPE in surfactant aqueous media, but the degree of exfoliation was not studied, by for instance AFM and Raman spectroscopy. After the reaction, the solid obtained was characterized by IR spectroscopy and TGA. The IR data is convincing with regards to the formation of C–S bonds, with a band at 697 cm−1, but the degree of functionalization determined by TGA (ca. 16% between 100-450 °C) seems excessive for a few-layered material, which has relatively few S atoms on the surface. We found a similar problem when we first reported the reaction of 2H-MoS2 with maleimides98 and only later found out that it was due to the formation of a polymeric layer on top of the MoS2 flakes.120 In this case, we consider that this high value can be due to the presence of residual surfactant (employed to prepare MoS2 dispersions on aqueous media) since a noticeable weight loss in the same temperature range was also observed in the starting 2H-MoS2. The characterization data point to the formation of new covalent bonds between 2H-MoS2 and aryl diazonium salts also for the suspended flakes, but in this case there was no control experiment using nitrobenzene to discard physisorption and no XPS data were presented.
The reaction between BP and aryl diazonium salts has also been studied with the neutral and the activated layered material. When the reaction is carried out in acetonitrile (CH3CN) in the presence of tetrabutylammonium hexafluorophosphate, the characterization of the materials suggests the formation of C–P bonds.139,140 However, this functionalization can only be deduced in an indirect way. XPS analyses indicate the presence of the desired functional groups due to the peaks of heteroatoms present in the molecular addend, like N, but the formation of the covalent C–P bond is not easy to demonstrate with this technique, since its component possesses similar binding energies to those of P 2p and C 1s and the deconvolution is not trivial. Something similar occurs with IR spectroscopy, the presence of P–C140 or absence of NN139 characteristic vibration bands suggests the successful functionalization. In the case of using aryl diazonium porphyrins, further evidence can be obtained from UV-Vis and fluorescence spectroscopies.140
The arylation of neutral BP with aryl diazonium salts depends heavily on reaction conditions. If instead of CH3CN in the presence of tetrabutylammonium hexafluorophosphate, NMP or DMF are used as solvents, the covalent functionalization of the 2D material does not occur.127,141 Due to all these results, in which the formation of C–P bonds is not completely clear or does not take place, the activation of BP is necessary to improve the degree of functionalization. Negatively charged BP is prepared by alkali metal intercalation. In a first attempt, Zhang and co-workers utilized n-BuLi for this purpose.141 The negatively charged starting material was used as control sample. TEM, AFM and Raman spectroscopy proved the successful exfoliation of BP. AFM height profiles displayed a height of 4–8 nm, implying 8–15 layers (considering that one monolayer is around 0.53 nm thick). The product obtained from the reaction with the aryl diazonium salt was carefully washed and characterized. IR spectroscopy showed the presence of the characteristic vibration bands associated with the covalent functionalization, including the one assigned to the P–C bond. Indeed, the intensity of these bands increases when the equivalents of diazonium salt in the reaction grows. A similar trend was observed in the P–C component of the XPS spectra. Despite the overlap between the P–O (ca. 134 eV) and P–C (ca. 133 eV) components on the P 2p core level XPS spectrum, a clear increase in the intensity of the latter peak was noticed with increasing equivalents of the reactive. In spite of these results, no changes related to the lattice distortion were discerned in the Raman spectrum of the functionalized BP. The lack of these characteristic bands could be due to the measuring conditions and/or the anisotropy of BP.127 To corroborate that the observed changes are due to the covalent functionalization of the material, several control experiments were performed, and the abovementioned features were not displayed. TGA seems the missing bit of information in this case, to provide quantitative information on the degree of functionalization with different equivalents of the organic reagent.
In a recent study, Hirsch and co-workers compared the reactivity of neutral and activated BP (Fig. 8).142 In this case, they prepared the BP intercalation compound with K/Na (Fig. 8a). The results obtained for the neutral material corroborate the lack of reactivity in NMP. On the other hand, when negatively charged BP was used, unexpected outcomes were observed. In the Raman spectra of the reaction products, new bands associated with the presence of red phosphorus arise, but not related to the attachment of organic reagents. These results contrast with the ones reported when Li is employed, where no changes were noticed in the Raman spectrum of the reaction product. With the aim to determine if the reaction takes place despite the formation of red phosphorus, TGA, XPS and solid-state NMR analyses were performed. In the XPS analysis the component related to P–C bonds was not observed. Solid-state NMR was conducted to further corroborate that the covalent functionalization of BP did not occur, as concluded by the presence of only one signal in the spectrum of the material after reaction, which corresponds to the starting material (Fig. 8b), in contrast with the results observed when the reaction was carried out with alkyl iodides as electrophiles (Fig. 8c).128 TGA-MS analysis coupled with gas chromatography and electron paramagnetic resonance allowed to shed light into the reaction mechanism, that point to the fluorination of the aryl diazonium salts catalysed by the BP intercalation compounds instead of the covalent functionalization of the 2D material.
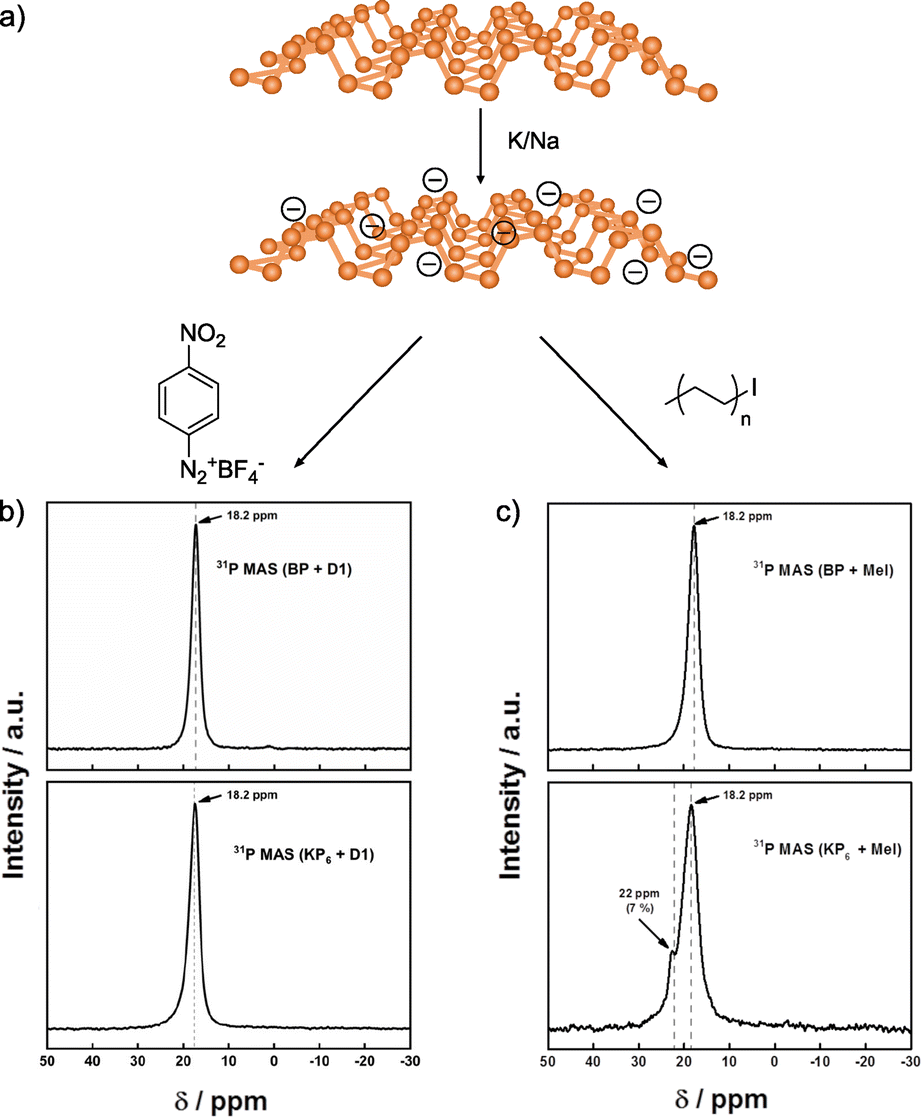 | ||
| Fig. 8 (a) Scheme of the K/Na intercalation on BP. 31P NMR spectra for the functionalization with (b) aryl diazonium salt and (c) alkyl iodide compounds. Both functionalizations are shown, in regard of the neutral BP or activated BP (KP6 species). Adapted from ref. 142 and 128. Copyright 2020 and 2019, respectively, Wiley-VCH. | ||
These apparently contradictory results could be explained by the method used to prepare the activated BP and the reaction conditions employed in each case. In the first example, n-BuLi is the reductive agent and n-hexane the solvent. Meanwhile in the second one, Na/K were utilized for the intercalation and THF was the solvent. In literature there are some examples in which the reactivity of the 2D materials depends on the alkali metal and the solvent.48,143 These two works remark the importance of a thorough characterization protocol to support the final conclusions.
Aryl diazonium salts have been also used for post-functionalization strategies95,136,144 since they are usually para-substituted. These substituents (e.g., azide, Br or ethynyl) allow the subsequent reaction between the functionalized 2D material and a desired moiety endowed with the matching functional group. For example, 1T-MoS2 endowed with arylazide functional groups was reacted with several alkyne derivatives allowing to introduce valuable moieties onto the surface of the material by “click” reaction.136 The presence of arylbromide entities on BP led to the Sonogashira coupling product when the material reacted with an alkyne terminal polymer.144
Other free radical species, such as nitrenes or carbenes, are commonly used for BN and BP functionalization (Fig. 9). Due to the inert nature of BN (high chemical stability and hydrophobicity), its covalent modification is still a challenge. However, in the last few years many groups have developed different strategies to overcome this.145
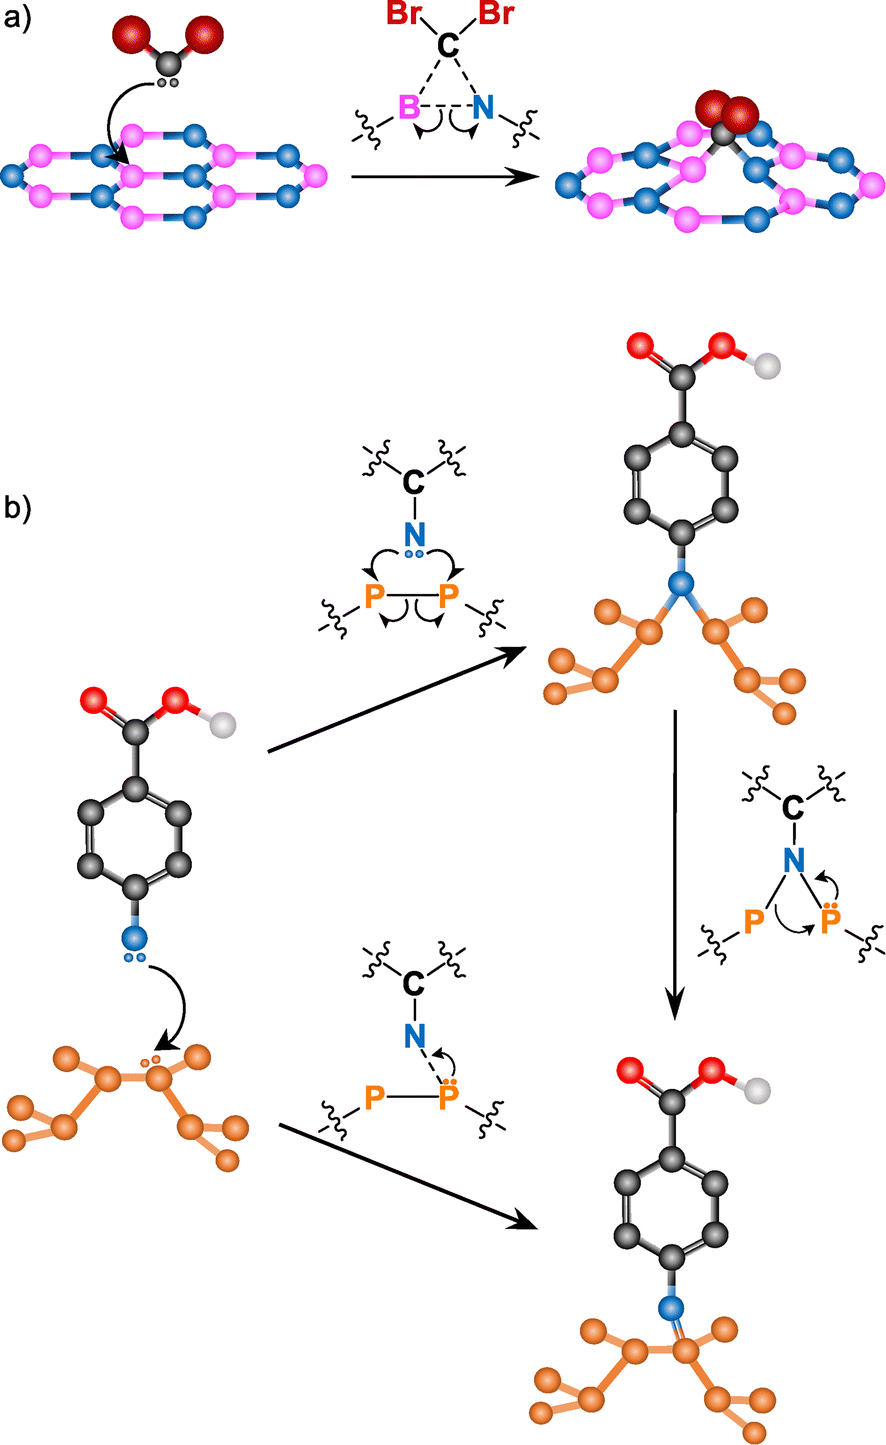 | ||
| Fig. 9 Reaction mechanism for (a) carbenes into BN (adapted with permission from ref. 146 Copyright 2014 American Chemical Society), and (b) nitrenes into BP (adapted from ref. 147 Copyright 2019, Wiley-VCH). | ||
Coleman and co-workers reported the covalent functionalization of exfoliated BN nanosheets using dibromocarbene species.146 Individual nanosheets of up to ∼1 × 1 μm2 dimensions were shown through TEM. The monolayer nature was confirmed by AFM scanning across the edges and obtaining a thickness of 0.35 nm. The formation of B–C and N–C bonds was assessed by several complementary techniques. XRD, IR, Raman and XPS analyses showed bands associated with B–C and C–N bonds. The clearest evidence of the B–C bonds was the new band at 1086 cm−1 in the Raman spectrum of the reaction product, that agrees with the reported values on literature. The attachment of dibromocarbene was corroborated by the detection of Br with different characterization tools. Time-of-flight secondary-ion mass spectroscopy (ToF-SIMS) displayed the two isotopic peaks of bromine (79Br and 81Br) and a shoulder in the C 1s core level XPS spectrum corroborated the presence of CBr2 groups in the functionalized BN.
Nitrene radicals have also been used for the modification of BN, in particular, 4-methoxybenzyloxycarbonyl azide.148 One of the effects expected after the functionalization of 2D materials is a change in their dispersibility. After the reaction, the dispersibility of the functionalized BN in several organic solvents (e.g., ethanol, CHCl3) increased, allowing to perform solution NMR. In the 1H NMR spectrum, several signals in the aromatic region (6–8 ppm), some peaks at ca. 5 and 4 ppm and a new peak at 8.4 ppm (not present in the spectrum of the starting reagent) were observed. The 8.5 ppm signal is associated with the carbamate N–H near the surface of BN, formed in the attack of the nitrene to the material. The formation of the carbamate was supported by IR spectroscopy, due to the shift of the carbonyl band to higher wavenumbers.
The addition of carbenes and nitrenes to the BN lattice leads to the cleavage of the B–N bond on which the addition occurs. The radicals attack the electron-deficient B atom with the subsequent cleavage of the B–N bond, satisfying the valence conditions.146
Nitrenes were also employed for the functionalization of BP by Liu et al.147 The formation of PN bonds was shown by a combination of different characterization techniques. A new band at 1328 cm−1 can be noticed in the IR spectrum of the reaction product, that the authors attributed to a new PN bond. The nature of this new bond was proved by solid-state 31P NMR and XPS. In the N 1s core level spectrum of the functionalized BP, it can be observed a new peak that was not present in the spectra of the pristine material nor in the parent molecule and confirmed the formation of the new bond. Solid-state NMR spectrum corroborated the results, a peak at 6.35 ppm was detected and assigned to the PN bond. In a recent example, nitrenes were generated photolytically instead of by thermal activation.149 In this case, the assessment of the formation of the PN bond was more challenging. N 1s core level XPS spectra cannot clearly prove it, since the residual signal from benzonitrile (reaction solvent) overlap with the one associated with the PN bond. Solid-state NMR was employed to further support the XPS results, but the authors realised that the shoulder attributed to the functionalization of BP (PN) also match with the one ascribed to oxidized BP (PO), despite the higher intensity of it in the functionalized materials. With the aim to unambiguously report the nature of BP functionalization, IR spectroscopy was used, since the PO and PN bonds present different vibration bands. In addition, the assignment of the PN bands was corroborated making use of enriched 15N azides. These are very good examples of through characterization efforts. Even in such cases, one might suggest that TGA could have provided information on the relative quantities of the physisorbed molecules and the ones covalently attached to the material. Likewise, if TGA data had been presented in the work reported by Liu et al.,147 one could have compared the degree of functionalization of BP using nitrenes generated by thermal or photochemical activation in order to rationalize the differences found on the solid-state NMR spectra.
In contrast to the radical additions to the BN lattice, the addition of nitrenes to the lattice of BP does not result in the cleavage of P–P bonds. As shown by theoretical calculations,147,149 the attack of nitrenes to BP gives rise to two possible isomers: one with formation of a single PN bond and another one with formation of two P–N bonds linked by a nitrogen bridge. The formation of the thermodynamically more stable isomer, with PN bonds, is corroborated by experimental results. In addition to the preservation of the lattice, the creation of PN bonds completely passivates the surface of the material due to the five-coordinate bonding of P atoms.
Regarding the goal to prove the covalent functionalization involving free radical species, there are again several characterization techniques that can be used. Based on the examples shown above, IR and XPS have proven to be fundamental to understand covalent modifications. Given the high reactivity of radical species, it is quite common that these suffer side reactions, for instance they can react with themselves or the solvent. So including control samples and analysing them by TGA is strongly recommended, as it can help distinguish between physisorbed and covalently attached molecules.
3.3. Coordination chemistry
Coordination chemistry reactions require the formation of coordination complexes wherein a central atom (typically metals like Cu, Co, Ni or Zn) is surrounded through dative bonds by additional atoms, ions, or neutral molecules known as ligands, in this case the 2D material involved on the reaction.150,151 Coordination chemistry becomes a powerful tool for the chemical modification of the 2D materials featuring metals (e.g. MoS2, WS2 or InSe) due to the abundance of potential coordination sites presented on their structures. For example, the chalcogenides can serve as ligands.152,153 More specifically, taking MoS2 as a model of 2D TMDCs, sulfur surface atoms would react by coordination with divalent metal ions, providing a functionalized material. Ye and co-workers94 reported a covalently cross-linked system between MoS2 and poly(methyl methacrylate) (PMMA), by copper-ion coordination (Fig. 10). Firstly, MoS2 exfoliation was confirmed by UV-Vis (appearance of bands at 674 and 618 nm), TEM and AFM, in which the thickness of the nanosheets was measured as <5 nm, i.e. up to 4–5 layers, as monolayer thickness is ca. 0.65 nm. Secondly, functionalization was proved by XPS and IR, where changes on PMMA internal bonds were clearly assessed. After copper-ion coordination, the CO component on C 1s core level XPS spectrum decreased after the coordination and a new peak in the region of S 2p was noticed (ca. 168 eV). Similar behaviour was registered by IR spectrum, as the decreasing of the CO stretching band (1733 cm−1) and the emergence of a new band at 1672 cm−1. These results confirmed the successful functionalization of the material, even though the chemical nature of the bond has not been fully proved.
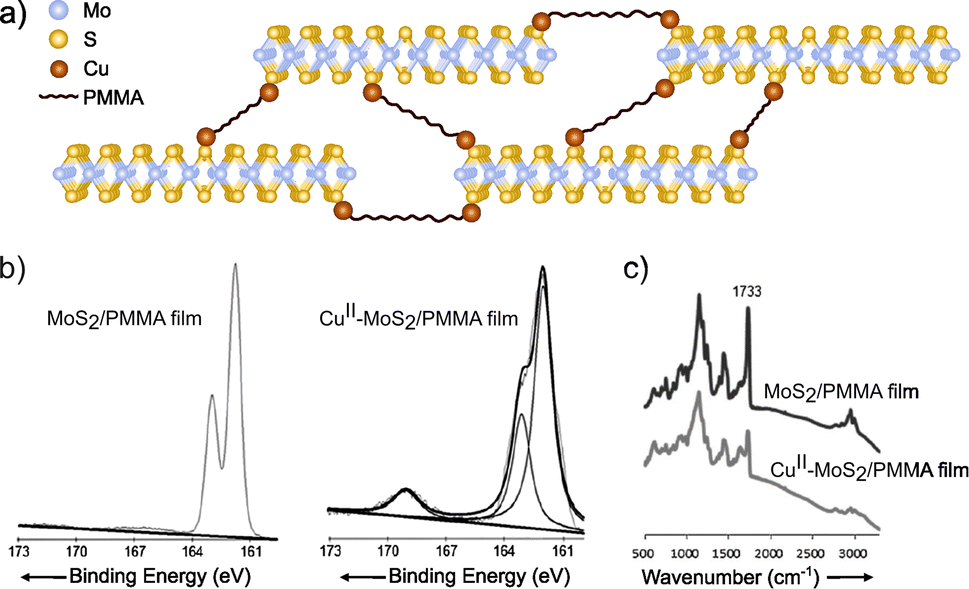 | ||
| Fig. 10 (a) Scheme of the CuII–MoS2/PMMA structure. On the bottom part, (b) S 2p core level XPS spectra of the Cu-free and Cu-coordinated MoS2/PMMA films and (c) IR of the two different species. Adapted from ref. 94, Copyright 2013, Wiley-VCH. | ||
Another MoS2 coordination complex was prepared by McDonald and co-workers.154 They used divalent metal salts (M(OAc)2, where M: Cu, Ni, Zn) that can coordinate the sulfur atoms of the surface of LPE 2H-MoS2. The length (260 nm), width (150 nm) and number of layers (9–10) of the flakes were studied by AFM. Surface modification was proved by optical extinction spectra, comparing bulk vs. functionalized materials, in which copper and zinc complexes seemed to suffer reaggregation (decrease of the optical extinction intensity), while the nickel one displayed stable. XPS results corroborated the modification of 2H-MoS2, where the Mo 3d core level suffered some changes and a new component was clearly noticed in the S 2p core level (ca. 170 eV as previously described), indicating the existence of sulfur atoms in a different chemical environment. Besides, it leads to estimate a high degree of functionalization of the MoS2 basal plane (around 50% on copper salt coordination). These new interactions also affect to the metal salt, as observed in the IR spectra of the reaction products. The bands of the acetate ligands showed pronounced shifts (between 20 and 60 cm−1), indicating the interaction between the metal and the sulfur atoms. To further study these interactions, the authors performed a coordination solvent washing step resulting in the complete defunctionalisation of the material. XPS of the post-washed sample proved that the previous modification did not cause sulfur vacancies to appear and not irreversible oxidation of the 2H-MoS2.
The coordination strategy to functionalize 2D materials focuses on the different metals on their structure. Therefore, the characterization should focus on them. With that purpose, techniques as EDS and HR-TEM are most helpful. Nevertheless, the usual quantitative analysis by TGA and including controls is mandatory.
3.4. Passivation of vacancies
Crystal defects are common in 2D materials. Substitution and interstitial impurities, adatoms, grain boundaries and vacancies are present in all of them.155,156 Atomic vacancies are defined as atom(s) missing from their lattice site. These “empty” positions are typically very reactive, so passivation or vacancy filling is a widely used strategy for the functionalization TMDCs. In chemical terms, this would be equivalent to an addition reaction. Chalcogenide vacancies are frequent on TMDCs, particularly after exfoliation,33 and exposure to thiols or other chalcogenide sources typically results in functionalization. However, the nature of the interaction between these sulfur derivatives and TMDCs is still under discussion. In this sense, McDonald and co-workers have studied the reaction between cysteine and 2H-MoS2.157 In a first step, 2H-MoS2 was exfoliated and subsequently reacted with the thiol derivative. After the reaction, the solid obtained was washed to remove the non-reacted molecules and a change in MoS2 dispersibility was observed. With the aim to study the nature of this modification, IR and Raman spectroscopies, XPS and TGA were performed. Several changes were noticed in the IR spectrum of the obtained material with respect to the pristine one and the starting cysteine. In particular, the S–H band of cysteine (ca. 2550 cm−1) is not present on IR profile, suggesting the reaction of the thiol group in the presence of the material. However, in the XPS spectrum of functionalized MoS2 no changes were observed (both S 2p and Mo 3d peaks), indicating that there was no covalent functionalization. To determine the structure of the reactive cysteine, MoS2 de-functionalization was accomplished (several washings and dialysis) and the cystine residue was found on the water washes. Therefore, the reaction between 2H-MoS2 and cysteine (thiol derivative) yields cystine (disulfide) physisorbed onto the surface of the 2D material as product, instead of the coordination of sulfur atoms to molybdenum atoms, filling the chalcogenide vacancies (Fig. 11a).158 Temperature dependent Raman measurements showed the increase of the intensity of the 2LA(M) band in the modified material, which differs from the behaviour observed in the covalently functionalized 1T-MoS2, also pointing to a different kind of modification.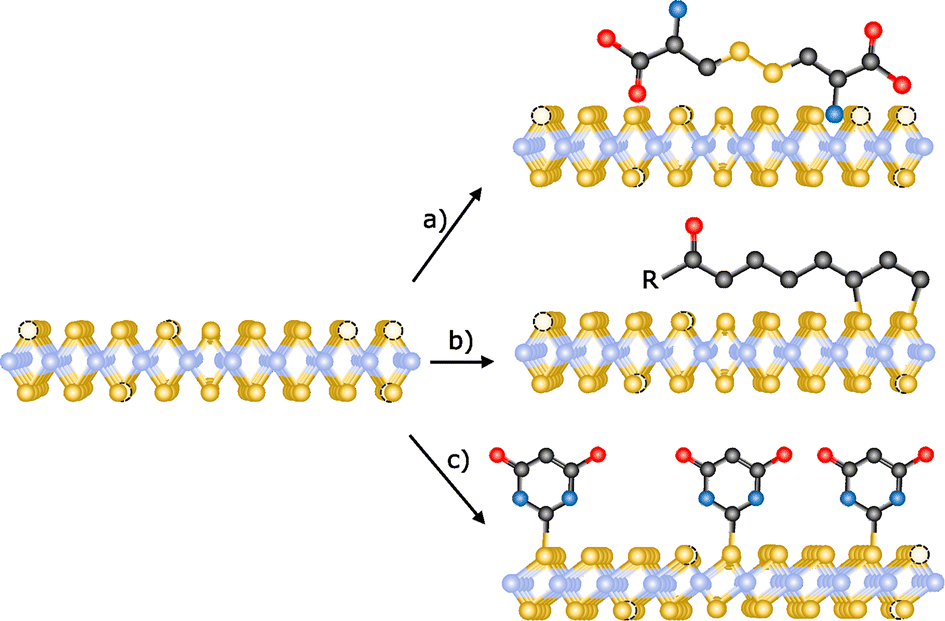 | ||
| Fig. 11 Schematic representation of the different reactions for the passivation of vacancies: (a) physisorption of disulfides (ref. 158), (b) functionalization with 1,2-dithiolanes derivatives (ref. 162) and (c) chemical exfoliation of 2H-MoS2 to 1T-MoS2 using tert-butyllithium and subsequent modification with thiobarbituric acid (ref. 106). | ||
Thiol surfactants were also employed for the exfoliation and passivation of sulfur vacancies in one step. As control experiment, De and co-workers used a surfactant without thiol groups for the exfoliation of the material.159 AFM analysis of all the materials showed flakes with heights of few nanometres, confirming the exfoliation. Their average lateral sizes were in the range of 100–200 nm, and HR-TEM displayed the hexagonally symmetric structure of the 2H-phase. After the exfoliation/functionalization step, the obtained product was dialyzed to remove the excess of surfactant. Despite the different charges of the surfactants (neutral, negative and positive), no changes in zeta potential were found for the non-thiolated ones. In contrast, the dispersions obtained with the thiolated molecules are stable and present different zeta-potential depending on their charges, suggesting a role for the thiol group. To investigate their presence and attachment onto the 2D material, solution 1H NMR and TGA were performed. In the 1H NMR spectra of the three functionalized 2H-MoS2 materials (neutral, positive and negative), several signals in the aliphatic region have been observed proving the functionalization of MoS2. Considering the results by the McDonald group, additional analyses would be needed to unambiguously determine the nature of the attachment between the thiol derivatives and MoS2 and completely discard the physisorption of the molecules.160,161
Another approach for the passivation of chalcogenide vacancies is the use of 1,2-dithiolane derivatives.105 Tagmatarchis and co-workers have described this strategy in which the functionalization occurs at the edges of 2H-MoS2 (Fig. 11b).162 IR spectroscopy of the obtained materials showed characteristic vibration bands of the functional groups present on the 1,2-dithiolanes. TGA corroborated these results and suggested the covalent bond between the material and the organic molecules due to the temperature range of the observed weight loss (between 250 and 550 °C). As in the other cases, the TGA of the starting organic reagents would be useful to completely discard their physisorption since a significant increase in their decomposition temperature is expected after the covalent attachment. UV-Vis and PL spectroscopies also supported the binding of dithiolanes derivatives, specifically in the case of the pyrene one. In the case of MoS2 amine-functionalized (firstly protected with BOC group), the presence of the amine groups and therefore their successful deprotection was proved by the performance of Kaiser test. Raman spectroscopy confirmed the covalent modification of MoS2 due to the decrease of the relative intensity of the 2LA(M) band. In addition to these analyses, XPS spectra proved the filling of sulfur vacancies after the reaction between 1,2-dithiolanes and 2H-MoS2.
Chalcogenide vacancies also exist on 1T-MoS2, therefore its functionalization following the passivation methodology has been reported.163 Like in the case of 2H-MoS2, McDonald and co-workers have proved the physisorption of the oxidized thiol (disulfide) onto the surface of the 1T material instead of the covalent functionalization by filling the vacancies.157 Using a different sulfur derivative, thiobarbituric acid, Pumera and co-workers have covalently functionalized 1T-MoS2 (Fig. 11c).106 Making use of Ellman's reagent, the presence of thiol-free moieties was discarded and concluded that the binding takes place through the sulfur atom of the molecule. The covalent attachment of thiobarbituric acid was corroborated by TGA (10% weight loss at ca. 320 °C) and gas analysis. Theoretical calculations predicted that in the covalently bond molecule the length of the CS bond increases, having a more C–S character. The Raman spectrum of the product supported this finding with the presence of a new band at 940 cm−1, attributed to the C–S bond, whose value matches with the one of the calculated spectrum. The formation of this new bond, together with calculations, point to the tautomerization of thiobarbituric acid after the attachment to the material. XPS analysis confirmed the C–S bond due to the presence of the characteristic shoulder at ca. 164 eV, which together with the strong peak in the N 1s core level spectrum supported the binding of the organic molecule. The homogeneity of the functionalization was determined by EDS mappings. All the characterization performed clearly points to the covalent modification of 1T-MoS2.
As we have seen, the passivation of vacancies is particularly tricky in terms of chemical characterization. As the product of passivation is the direct addition of the starting material and the reagent, there are no new bonds or chemical functionalities formed during reaction, it can be easily confused with strong physisorption. In this case, we suggest to study control samples in detail. In particular, TGA analysis can be useful as physisorption typically induces comparatively small changes in decomposition temperature with regards to chemisorption of molecules.
4. Conclusions and outlook
The complete characterization of chemically modified 2D materials is far from trivial. The main problem is the intrinsic heterogeneity of the sample: after a typical exfoliation-functionalization process one will necessarily end with a complicated mixture of flake morphologies and chemical compositions. The effort of characterization is therefore directed to provide a representative picture of the sample, which needs to be a three dimensional image, including information on: (1) the nano/microstructure: the size of the flakes (statistical analysis of the number of layers and lateral size), the crystal structure (polytypes), and relative abundance of defects; (2) the chemical composition, which elements are present, and how the molecular fragments are bound to the 2D material; and (3) the consequences of the chemical functionalization on the electronic properties of the 2D material.Microscopic analyses, typically AFM and TEM, sometimes complemented with SEM are typically sufficient to complete the first of these three dimensions. As for the electronic consequences of the functionalization, they are intrinsically entangled with the structural changes during chemical modification. We have therefore focused this review on the chemical characterization of 2D materials. And, for the sake of brevity, materials other than graphene. We have presented examples of covalent chemistry on TMDCs, BP, BN, and elemental analogues of graphene, describing in detail the characterization techniques used in each case. The examples selected are all paradigmatic of good practice, where a significant characterization effort has been carried out. Even within this selected collection, one can find instances where further analyses would have been desirable. In particular, we find that the ratio of physisorbed versus covalently attached molecules and the presence and identity of covalent binding between the 2D material and the molecular fragment are the most difficult parameters to pin down unambiguously. With regards to the former, careful purification procedures that remove physisorbed molecules, like exhaustive washings with adequate solvents and detailed analyses of TGA data seem the most powerful techniques. Whenever possible, both should be complemented with analyses of the washings, and desorption/decomposition gases, respectively. As for the chemical bonding the technique(s) of choice depend heavily on the specific chemistry. Vibrational spectroscopy (IR and Raman) can often directly identify the vibration of the bond(s) involved. XPS can be trickier as, more often than not, it will involve changes in the fitting of signals that were already present in the pristine material, which only sometimes will provide solid evidence. Also, because of the surface sensitivity of XPS, analyses of flakes thicker than 2–3 nm will overestimate the groups on the surface, and not provide a representative picture of the whole sample. NMR, and in particular solid-state NMR, is slowly becoming more common in this field, and there is every reason to hope that it will soon become routine, as it is full of chemical information.
Looking back, we find that the extremely rapid pace at which the chemistry of 2D materials has evolved has sometimes led to substandard purification and characterization protocols. Looking forward, we hope this review will help consolidate the toolbox of characterization techniques and provide examples that serve as a guideline to facilitate the efforts towards comprehensive characterization of chemically modified 2D materials.
Author contributions
Marina Garrido: conceptualization, visualization and writing – review & editing. Alicia Naranjo: conceptualization, visualization and writing – review & editing. Emilio M. Pérez: funding acquisition, project administration, supervision and writing – review & editing.Conflicts of interest
There are no conflicts to declare.Acknowledgements
We acknowledge funding from the Ministerio de Ciencia, Innovación y Universidades (PID2020-116661RB-I00), and Comunidad de Madrid “Materiales Disruptivos Bidimensionales (2D)” (MAD2D-CM)-UAM and (MAD2D-CM)-IMDEA-NC funded by the Recovery, Transformation and Resilience Plan, and by NextGenerationEU from the European Union. IMDEA Nanoscience acknowledges support from the “Severo Ochoa” Programme for Centres of Excellence in R&D CEX2020-001039-S.Notes and references
- K. S. Novoselov, A. K. Geim, S. V. Morozov, D. Jiang, Y. Zhang, S. V. Dubonos, I. V. Grigorieva and A. A. Firsov, Science, 2004, 306, 666–669 CrossRef CAS PubMed.
- K. F. Mak, C. Lee, J. Hone, J. Shan and T. F. Heinz, Phys. Rev. Lett., 2010, 105, 136805 CrossRef PubMed.
- D. Pacilé, J. C. Meyer, Ç. Ö. Girit and A. Zettl, Appl. Phys. Lett., 2008, 92, 133107 CrossRef.
- P. Vishnoi, K. Pramoda and C. N. R. Rao, ChemNanoMat, 2019, 5, 1062–1091 CrossRef CAS.
- H. Liu, A. T. Neal, Z. Zhu, Z. Luo, X. Xu, D. Tománek and P. D. Ye, ACS Nano, 2014, 8, 4033–4041 CrossRef CAS PubMed.
- A. Castellanos-Gomez, L. Vicarelli, E. Prada, J. O. Island, K. L. Narasimha-Acharya, S. I. Blanter, D. J. Groenendijk, M. Buscema, G. A. Steele, J. V. Alvarez, H. W. Zandbergen, J. J. Palacios and H. S. J. van der Zant, 2D Mater., 2014, 1, 25001 CrossRef CAS.
- M. E. Dávila, L. Xian, S. Cahangirov, A. Rubio and G. Le Lay, New J. Phys., 2014, 16, 95002 CrossRef.
- L. Li, S. Lu, J. Pan, Z. Qin, Y. Wang, Y. Wang, G. Cao, S. Du and H.-J. Gao, Adv. Mater., 2014, 26, 4820–4824 CrossRef CAS PubMed.
- P. Vogt, P. De Padova, C. Quaresima, J. Avila, E. Frantzeskakis, M. C. Asensio, A. Resta, B. Ealet and G. Le Lay, Phys. Rev. Lett., 2012, 108, 155501 CrossRef PubMed.
- L. Tao, E. Cinquanta, D. Chiappe, C. Grazianetti, M. Fanciulli, M. Dubey, A. Molle and D. Akinwande, Nat. Nanotechnol., 2015, 10, 227–231 CrossRef CAS.
- P. Ares, F. Aguilar-Galindo, D. Rodríguez-San-Miguel, D. A. Aldave, S. Díaz-Tendero, M. Alcamí, F. Martín, J. Gómez-Herrero and F. Zamora, Adv. Mater., 2016, 28, 6332–6336 CrossRef CAS.
- C. Gibaja, D. Rodriguez-San-Miguel, P. Ares, J. Gómez-Herrero, M. Varela, R. Gillen, J. Maultzsch, F. Hauke, A. Hirsch, G. Abellán and F. Zamora, Angew. Chem., Int. Ed., 2016, 55, 14345–14349 CrossRef CAS PubMed.
- M. Shrivastava and V. Ramgopal Rao, Nano Lett., 2021, 21, 6359–6381 CrossRef CAS.
- Y. Hernandez, M. Lotya, D. Rickard, S. D. Bergin and J. N. Coleman, Langmuir, 2010, 26, 3208–3213 CrossRef CAS PubMed.
- C. Hao, B. Yang, F. Wen, J. Xiang, L. Li, W. Wang, Z. Zeng, B. Xu, Z. Zhao, Z. Liu and Y. Tian, Adv. Mater., 2016, 28, 3194–3201 CrossRef CAS.
- M. Garrido, M. Barrejón, J. A. Berrocal, Z. Syrgiannis and M. Prato, Nanoscale, 2022, 14, 8986–8994 RSC.
- J. D. Wood, S. A. Wells, D. Jariwala, K.-S. Chen, E. Cho, V. K. Sangwan, X. Liu, L. J. Lauhon, T. J. Marks and M. C. Hersam, Nano Lett., 2014, 14, 6964–6970 CrossRef CAS.
- T. Helbich, A. Lyuleeva, P. Marx, L. M. Scherf, T. K. Purkait, T. F. Fässler, P. Lugli, J. G. C. Veinot and B. Rieger, Adv. Funct. Mater., 2017, 27, 1606764 CrossRef.
- H. Yu, T. Helbich, L. M. Scherf, J. Chen, K. Cui, T. F. Fässler, B. Rieger and J. G. C. Veinot, Chem. Mater., 2018, 30, 2274–2280 CrossRef CAS.
- P. Ares, J. J. Palacios, G. Abellán, J. Gómez-Herrero and F. Zamora, Adv. Mater., 2018, 30, 1703771 CrossRef.
- S. Thurakkal and X. Zhang, Adv. Sci., 2020, 7, 1902359 CrossRef CAS PubMed.
- S. Bertolazzi, M. Gobbi, Y. Zhao, C. Backes and P. Samorì, Chem. Soc. Rev., 2018, 47, 6845–6888 RSC.
- S. N. Reed-Lingenfelter, M. Wang, N. L. Williams and J. J. Cha, Adv. Mater. Interfaces, 2022, 9, 2100463 CrossRef CAS.
- Y. Zhao, S. Ippolito and P. Samorì, Adv. Opt. Mater., 2019, 7, 1900286 CrossRef.
- L. Daukiya, C. Mattioli, D. Aubel, S. Hajjar-Garreau, F. Vonau, E. Denys, G. Reiter, J. Fransson, E. Perrin, M. L. Bocquet, C. Bena, A. Gourdon and L. Simon, ACS Nano, 2017, 11, 627–634 CrossRef CAS PubMed.
- Y. Xue, Q. Liu, G. He, K. Xu, L. Jiang, X. Hu and J. Hu, Nanoscale Res. Lett., 2013, 8, 49 CrossRef PubMed.
- H. Hu, H. Gao, L. Gao, F. Li, N. Xu, X. Long, Y. Hu, J. Jin and J. Ma, Nanoscale, 2018, 10, 5834–5839 RSC.
- G. Abellán, V. Lloret, U. Mundloch, M. Marcia, C. Neiss, A. Görling, M. Varela, F. Hauke and A. Hirsch, Angew. Chem., Int. Ed., 2016, 55, 14557–14562 CrossRef PubMed.
- X. S. Chu, A. Yousaf, D. O. Li, A. A. Tang, A. Debnath, D. Ma, A. A. Green, E. J. G. Santos and Q. H. Wang, Chem. Mater., 2018, 30, 2112–2128 CrossRef CAS.
- S. Ippolito, A. Ciesielski and P. Samorì, Chem. Commun., 2019, 55, 8900–8914 RSC.
- W. L. B. Huey and J. E. Goldberger, Chem. Soc. Rev., 2018, 47, 6201–6223 RSC.
- A. R. Brill, E. Koren and G. de Ruiter, J. Mater. Chem. C, 2021, 9, 11569–11587 RSC.
- C. Wetzl, A. Silvestri, M. Garrido, H.-L. Hou, A. Criado and M. Prato, Angew. Chem., Int. Ed., 2023, 62, e202212857 CrossRef CAS PubMed.
- J. Azadmanjiri, P. Kumar, V. K. Srivastava and Z. Sofer, ACS Appl. Nano Mater., 2020, 3, 3116–3143 CrossRef CAS.
- H. Wang, C. Li, P. Fang, Z. Zhang and J. Z. Zhang, Chem. Soc. Rev., 2018, 47, 6101–6127 RSC.
- B. Li, C. Lai, G. Zeng, D. Huang, L. Qin, M. Zhang, M. Cheng, X. Liu, H. Yi, C. Zhou, F. Huang, S. Liu and Y. Fu, Small, 2019, 15, 1804565 CrossRef PubMed.
- V. Yadav, S. Roy, P. Singh, Z. Khan and A. Jaiswal, Small, 2019, 15, 1803706 CrossRef.
- K. Cho, J. Pak, S. Chung and T. Lee, ACS Nano, 2019, 13, 9713–9734 CrossRef CAS PubMed.
- A. Hirsch and F. Hauke, Angew. Chem., Int. Ed., 2018, 57, 4338–4354 CrossRef CAS PubMed.
- M. Garrido, L. Gualandi, S. Di Noja, G. Filippini, S. Bosi and M. Prato, Chem. Commun., 2020, 56, 12698–12716 RSC.
- G. Bottari, M. Á. Herranz, L. Wibmer, M. Volland, L. Rodríguez-Pérez, D. M. Guldi, A. Hirsch, N. Martín, F. D'Souza and T. Torres, Chem. Soc. Rev., 2017, 46, 4464–4500 RSC.
- L. Li, Y. Yu, G. J. Ye, Q. Ge, X. Ou, H. Wu, D. Feng, X. H. Chen and Y. Zhang, Nat. Nanotechnol., 2014, 9, 372–377 CrossRef CAS.
- W. Luo, Y. Wang, E. Hitz, Y. Lin, B. Yang and L. Hu, Adv. Funct. Mater., 2017, 27, 1701450 CrossRef.
- J. N. Coleman, M. Lotya, A. O'Neill, S. D. Bergin, P. J. King, U. Khan, K. Young, A. Gaucher, S. De, R. J. Smith, I. V. Shvets, S. K. Arora, G. Stanton, H.-Y. Kim, K. Lee, G. T. Kim, G. S. Duesberg, T. Hallam, J. J. Boland, J. J. Wang, J. F. Donegan, J. C. Grunlan, G. Moriarty, A. Shmeliov, R. J. Nicholls, J. M. Perkins, E. M. Grieveson, K. Theuwissen, D. W. McComb, P. D. Nellist and V. Nicolosi, Science, 2011, 331, 568–571 CrossRef CAS PubMed.
- C.-X. Hu, Y. Shin, O. Read and C. Casiraghi, Nanoscale, 2021, 13, 460–484 RSC.
- Y. Yao, Z. Lin, Z. Li, X. Song, K.-S. Moon and C. Wong, J. Mater. Chem., 2012, 22, 13494–13499 RSC.
- V. J. González, A. M. Rodríguez, I. Payo and E. Vázquez, Nanoscale Horiz., 2020, 5, 331–335 RSC.
- E. Er, H.-L. Hou, A. Criado, J. Langer, M. Möller, N. Erk, L. M. Liz-Marzán and M. Prato, Chem. Mater., 2019, 31, 5725–5734 CrossRef CAS.
- G. Abellán, C. Neiss, V. Lloret, S. Wild, J. C. Chacón-Torres, K. Werbach, F. Fedi, H. Shiozawa, A. Görling, H. Peterlik, T. Pichler, F. Hauke and A. Hirsch, Angew. Chem., Int. Ed., 2017, 56, 15267–15273 CrossRef PubMed.
- J. M. Englert, C. Dotzer, G. Yang, M. Schmid, C. Papp, J. M. Gottfried, H.-P. Steinrück, E. Spiecker, F. Hauke and A. Hirsch, Nat. Chem., 2011, 3, 279–286 CrossRef CAS PubMed.
- S. Yang, P. Zhang, A. S. Nia and X. Feng, Adv. Mater., 2020, 32, 1907857 CrossRef CAS PubMed.
- J. Shen, Y. He, J. Wu, C. Gao, K. Keyshar, X. Zhang, Y. Yang, M. Ye, R. Vajtai, J. Lou and P. M. Ajayan, Nano Lett., 2015, 15, 5449–5454 CrossRef CAS PubMed.
- B. Kwiecińska, S. Pusz and B. J. Valentine, Int. J. Coal Geol., 2019, 211, 103203 CrossRef.
- S. T. Skowron, T. W. Chamberlain, J. Biskupek, U. Kaiser, E. Besley and A. N. Khlobystov, Acc. Chem. Res., 2017, 50, 1797–1807 CrossRef CAS PubMed.
- S. Kretschmer, T. Lehnert, U. Kaiser and A. V. Krasheninnikov, Nano Lett., 2020, 20, 2865–2870 CrossRef CAS PubMed.
- J. Hong, C. Jin, J. Yuan and Z. Zhang, Adv. Mater., 2017, 29, 1606434 CrossRef PubMed.
- E. Meyer, Prog. Surf. Sci., 1992, 41, 3–49 CrossRef CAS.
- L. Daukiya, J. Seibel and S. De Feyter, Adv. Phys.: X, 2019, 4, 1625723 CAS.
- L. Daukiya, J. Teyssandier, S. Eyley, S. El Kazzi, M. C. Rodríguez González, B. Pradhan, W. Thielemans, J. Hofkens and S. De Feyter, Nanoscale, 2021, 13, 2972–2981 RSC.
- T. S. van Erp and J. A. Martens, Microporous Mesoporous Mater., 2011, 145, 188–193 CrossRef CAS.
- K. S. Subrahmanyam, S. R. C. Vivekchand, A. Govindaraj and C. N. R. Rao, J. Mater. Chem., 2008, 18, 1517–1523 RSC.
- S. Bamonte, S. Shubhashish, H. Khanna, S. Shuster, S. J. B. Rubio, S. L. Suib, S. P. Alpay and S. Sahoo, ACS Appl. Mater. Interfaces, 2022, 14, 27799–27813 CrossRef CAS.
- A. Shahzad, K. Rasool, W. Miran, M. Nawaz, J. Jang, K. A. Mahmoud and D. S. Lee, ACS Sustainable Chem. Eng., 2017, 5, 11481–11488 CrossRef CAS.
- L. Jiang, S. Zhang, S. A. Kulinich, X. Song, J. Zhu, X. Wang and H. Zeng, Mater. Res. Lett., 2015, 3, 177–183 CrossRef CAS.
- M. Acerce, D. Voiry and M. Chhowalla, Nat. Nanotechnol., 2015, 10, 313–318 CrossRef CAS PubMed.
- A. R. Deshmukh, J. W. Jeong, S. J. Lee, G. U. Park and B. S. Kim, ACS Sustainable Chem. Eng., 2019, 7, 17114–17125 CrossRef CAS.
- N. Martín Sabanés and K. F. Domke, ChemElectroChem, 2017, 4, 1814–1823 CrossRef.
- S. Zhang, N. Zhang, Y. Zhao, T. Cheng, X. Li, R. Feng, H. Xu, Z. Liu, J. Zhang and L. Tong, Chem. Soc. Rev., 2018, 47, 3217–3240 RSC.
- C. Lee, H. Yan, L. E. Brus, T. F. Heinz, J. Hone and S. Ryu, ACS Nano, 2010, 4, 2695–2700 CrossRef CAS.
- W. Lu, H. Nan, J. Hong, Y. Chen, C. Zhu, Z. Liang, X. Ma, Z. Ni, C. Jin and Z. Zhang, Nano Res., 2014, 7, 853–859 CrossRef CAS.
- X. Luo, X. Lu, G. K. W. Koon, A. H. Castro Neto, B. Özyilmaz, Q. Xiong and S. Y. Quek, Nano Lett., 2015, 15, 3931–3938 CrossRef CAS PubMed.
- A. Griffin, A. Harvey, B. Cunningham, D. Scullion, T. Tian, C.-J. Shih, M. Gruening, J. F. Donegan, E. J. G. Santos, C. Backes and J. N. Coleman, Chem. Mater., 2018, 30, 1998–2005 CrossRef CAS.
- L. H. Li, J. Cervenka, K. Watanabe, T. Taniguchi and Y. Chen, ACS Nano, 2014, 8, 1457–1462 CrossRef CAS PubMed.
- S. Mignuzzi, A. J. Pollard, N. Bonini, B. Brennan, I. S. Gilmore, M. A. Pimenta, D. Richards and D. Roy, Phys. Rev. B: Condens. Matter Mater. Phys., 2015, 91, 195411 CrossRef.
- A. Favron, F. A. Goudreault, V. Gosselin, J. Groulx, M. Côté, R. Leonelli, J.-F. Germain, A.-L. Phaneuf-L’Heureux, S. Francoeur and R. Martel, Nano Lett., 2018, 18, 1018–1027 CrossRef CAS PubMed.
- B. Chakraborty, A. Bera, D. V. S. Muthu, S. Bhowmick, U. V. Waghmare and A. K. Sood, Phys. Rev. B: Condens. Matter Mater. Phys., 2012, 85, 161403 CrossRef.
- A. W. Coats and J. P. Redfern, Analyst, 1963, 88, 906–924 RSC.
- M. Shtein, I. Pri-Bar, M. Varenik and O. Regev, Anal. Chem., 2015, 87, 4076–4080 CrossRef CAS PubMed.
- M. Garrido, E. Martínez-Periñán, J. Calbo, L. Rodríguez-Pérez, J. Aragó, E. Lorenzo, E. Ortí, N. Martín and M. Á. Herranz, J. Mater. Chem. C, 2021, 9, 10944–10951 RSC.
- R. J. C. Brown and M. J. T. Milton, TrAC, Trends Anal. Chem., 2005, 24, 266–274 CrossRef CAS.
- J. Amaro-Gahete, A. M. Kaczmarek, D. Esquivel, C. Jiménez-Sanchidrián, P. Van Der Voort and F. J. Romero-Salguero, Chem.–Eur. J., 2019, 25, 6823–6830 CrossRef CAS PubMed.
- C. C. Mayorga-Martinez, Z. Sofer, D. Sedmidubský, J. Luxa, B. Kherzi and M. Pumera, Nanoscale, 2018, 10, 1540–1546 RSC.
- R. S. Frankel and D. W. Aitken, Appl. Spectrosc., 1970, 24, 557–566 CrossRef CAS.
- X. Zhu, T. Zhang, D. Jiang, H. Duan, Z. Sun, M. Zhang, H. Jin, R. Guan, Y. Liu, M. Chen, H. Ji, P. Du, W. Yan, S. Wei, Y. Lu and S. Yang, Nat. Commun., 2018, 9, 4177 CrossRef PubMed.
- S. G. McAdams, E. A. Lewis, J. R. Brent, S. J. Haigh, A. G. Thomas, P. O'Brien, F. Tuna and D. J. Lewis, Adv. Funct. Mater., 2017, 27, 1703646 CrossRef.
- F. A. Stevie and C. L. Donley, J. Vac. Sci. Technol., A, 2020, 38, 63204 CrossRef CAS.
- M. E. Lipińska, S. L. H. Rebelo, M. F. R. Pereira, J. A. N. F. Gomes, C. Freire and J. L. Figueiredo, Carbon, 2012, 50, 3280–3294 CrossRef.
- K. Suenaga, C. R. Phys., 2014, 15, 151–157 CAS.
- J. Kiefer, J. Grabow, H.-D. Kurland and F. A. Müller, Anal. Chem., 2015, 87, 12313–12317 CrossRef CAS PubMed.
- M. Dendisová, A. Jeništová, A. Parchaňská-Kokaislová, P. Matějka, V. Prokopec and M. Švecová, Anal. Chim. Acta, 2018, 1031, 1–14 CrossRef PubMed.
- Q. Zhu, R. Zhou, J. Liu, J. Sun and Q. Wang, Nanomaterials, 2021, 11, 1353 CrossRef CAS PubMed.
- D. Voiry, A. Goswami, R. Kappera, C. d. C. C. e Silva, D. Kaplan, T. Fujita, M. Chen, T. Asefa and M. Chhowalla, Nat. Chem., 2015, 7, 45–49 CrossRef CAS.
- M. Garrido, J. Calbo, L. Rodríguez-Pérez, J. Aragó, E. Ortí, M. Á. Herranz and N. Martín, Chem. Commun., 2017, 53, 12402–12405 RSC.
- Y.-T. Liu, Z. Tan, X.-M. Xie, Z.-F. Wang and X.-Y. Ye, Chem.–Asian J., 2013, 8, 817–823 CrossRef CAS PubMed.
- I. Gómez-Muñoz, S. Laghouati, R. Torres-Cavanillas, M. Morant-Giner, N. V. Vassilyeva, A. Forment-Aliaga and M. Giménez-Marqués, ACS Appl. Mater. Interfaces, 2021, 13, 36475–36481 CrossRef PubMed.
- P. N. L. Lens and M. A. Hemminga, Biodegradation, 1998, 9, 393–409 CrossRef CAS PubMed.
- J. Villalva, S. Moreno-Da Silva, P. Villa, L. Ruiz-González, C. Navío, S. Garcia-Orrit, V. Vega-Mayoral, J. Cabanillas-González, A. Castellanos-Gomez, E. Giovanelli and E. M. Pérez, Nanoscale Horiz., 2021, 6, 551–558 RSC.
- M. Vera-Hidalgo, E. Giovanelli, C. Navío and E. M. Pérez, J. Am. Chem. Soc., 2019, 141, 3767–3771 CrossRef CAS PubMed.
- M. El Hariri El Nokab, M. H. Habib, Y. A. Alassmy, M. M. Abduljawad, K. M. Alshamrani and K. O. Sebakhy, Polymers, 2022, 14, 1049 CrossRef CAS PubMed.
- M. Picollo, M. Aceto and T. Vitorino, Phys. Sci. Rev., 2019, 4, 20180008 Search PubMed.
- G. Eda, H. Yamaguchi, D. Voiry, T. Fujita, M. Chen and M. Chhowalla, Nano Lett., 2011, 11, 5111–5116 CrossRef CAS PubMed.
- W. Zhao, R. M. Ribeiro and G. Eda, Acc. Chem. Res., 2015, 48, 91–99 CrossRef CAS PubMed.
- M. S. Sokolikova and C. Mattevi, Chem. Soc. Rev., 2020, 49, 3952–3980 RSC.
- X. Chen, D. McAteer, C. McGuinness, I. Godwin, J. N. Coleman and A. R. McDonald, Chem.–Eur. J., 2018, 24, 351–355 CrossRef CAS PubMed.
- R. Canton-Vitoria, C. Stangel and N. Tagmatarchis, ACS Appl. Mater. Interfaces, 2018, 10, 23476–23480 CrossRef CAS PubMed.
- S. Presolski, L. Wang, A. H. Loo, A. Ambrosi, P. Lazar, V. Ranc, M. Otyepka, R. Zboril, O. Tomanec, J. Ugolotti, Z. Sofer and M. Pumera, Chem. Mater., 2017, 29, 2066–2073 CrossRef CAS.
- G. Smestad and H. Ries, Sol. Energy Mater. Sol. Cells, 1992, 25, 51–71 CrossRef CAS.
- S. Zhang, H. M. Hill, K. Moudgil, C. A. Richter, A. R. Hight Walker, S. Barlow, S. R. Marder, C. A. Hacker and S. J. Pookpanratana, Adv. Mater., 2018, 30, 1802991 CrossRef PubMed.
- J. E. Whitten, Appl. Surf. Sci., 2023, 13, 100384 CrossRef.
- M. J. Madito, ACS Appl. Mater. Interfaces, 2021, 13, 37014–37026 CrossRef CAS PubMed.
- S. Kumar, M. K. Kumawat and T. Mohanty, Appl. Surf. Sci., 2023, 609, 155398 CrossRef CAS.
- G. Bottari, M. Á. Herranz, L. Wibmer, M. Volland, L. Rodríguez-Pérez, D. M. Guldi, A. Hirsch, N. Martín, F. D'Souza and T. Torres, Chem. Soc. Rev., 2017, 46, 4464–4500 RSC.
- M. Shabbir, Z. A. Raza, T. H. Shah and M. R. Tariq, J. Nanostruct. Chem., 2022, 12, 1033–1051 CrossRef.
- V. S. Nanjundappa, T. Ramakrishnappa, S. Kempahanumakkagari, H. R. Prakash and B. M. Praveen, Appl. Surf. Sci., 2023, 14, 100386 CrossRef.
- E. Uggerud, J. Phys. Org. Chem., 2006, 19, 461–466 CrossRef CAS.
- S. Wild, X. T. Dinh, H. Maid, F. Hauke, G. Abellán and A. Hirsch, Angew. Chem., Int. Ed., 2020, 59, 20230–20234 CrossRef CAS PubMed.
- C. Sun, J. Zhao, D. Zhang, H. Guo, X. Wang and H. Hu, Nanoscale, 2020, 12, 18379–18389 RSC.
- P. Vishnoi, A. Sampath, U. V. Waghmare and C. N. R. Rao, Chem.–Eur. J., 2017, 23, 886–895 CrossRef CAS PubMed.
- E. X. Yan, M. Cabán-Acevedo, K. M. Papadantonakis, B. S. Brunschwig and N. S. Lewis, ACS Mater. Lett., 2020, 2, 133–139 CrossRef CAS.
- R. Quirós-Ovies, M. Vázquez Sulleiro, M. Vera-Hidalgo, J. Prieto, I. J. Gómez, V. Sebastián, J. Santamaría and E. M. Pérez, Chem.–Eur. J., 2020, 26, 6629–6634 CrossRef PubMed.
- L. Martín-Pérez, S. Medina Rivero, M. Vázquez Sulleiro, A. Naranjo, I. J. Gómez, M. L. Ruíz-González, A. Castellanos-Gomez, M. Garcia-Hernandez, E. M. Pérez and E. Burzurí, ACS Nano, 2023, 17, 3007–3018 CrossRef PubMed.
- M. Vázquez Sulleiro, R. Quirós-Ovies, M. Vera-Hidalgo, I. J. Gómez, V. Sebastián, J. Santamaría and E. M. Pérez, Chem.–Eur. J., 2021, 27, 2993–2996 CrossRef PubMed.
- M. Vázquez Sulleiro, A. Develioglu, R. Quirós-Ovies, L. Martín-Pérez, N. Martín Sabanés, M. L. Gonzalez-Juarez, I. J. Gómez, M. Vera-Hidalgo, V. Sebastián, J. Santamaría, E. Burzurí and E. M. Pérez, Nat. Chem., 2022, 14, 695–700 CrossRef PubMed.
- T. Talha-Dean, K. Chen, G. Mastroianni, F. Gesuele, J. Mol and M. Palma, Bioconjugate Chem., 2023, 34, 78–84 CrossRef CAS PubMed.
- J. Miao, L. Wu, Z. Bian, Q. Zhu, T. Zhang, X. Pan, J. Hu, W. Xu, Y. Wang, Y. Xu, B. Yu, W. Ji, X. Zhang, J. Qiao, P. Samorì and Y. Zhao, ACS Nano, 2022, 16, 20647–20655 CrossRef CAS PubMed.
- X. Chen, C. Bartlam, V. Lloret, N. Moses Badlyan, S. Wolff, R. Gillen, T. Stimpel-Lindner, J. Maultzsch, G. S. Duesberg, K. C. Knirsch and A. Hirsch, Angew. Chem., Int. Ed., 2021, 60, 13484–13492 CrossRef CAS PubMed.
- Z. Sofer, J. Luxa, D. Bouša, D. Sedmidubský, P. Lazar, T. Hartman, H. Hardtdegen and M. Pumera, Angew. Chem., Int. Ed., 2017, 56, 9891–9896 CrossRef CAS PubMed.
- S. Wild, M. Fickert, A. Mitrovic, V. Lloret, C. Neiss, J. A. Vidal-Moya, M. Á. Rivero-Crespo, A. Leyva-Pérez, K. Werbach, H. Peterlik, M. Grabau, H. Wittkämper, C. Papp, H.-P. Steinrück, T. Pichler, A. Görling, F. Hauke, G. Abellán and A. Hirsch, Angew. Chem., Int. Ed., 2019, 58, 5763–5768 CrossRef CAS PubMed.
- A. Criado, M. Melchionna, S. Marchesan and M. Prato, Angew. Chem., Int. Ed., 2015, 54, 10734–10750 CrossRef CAS PubMed.
- T. Zou and P. J. Sadler, Drug Discovery Today: Technol., 2015, 16, 7–15 CrossRef PubMed.
- Ē. Kupče and R. Freeman, J. Magn. Reson., 1992, 98, 217–222 Search PubMed.
- M. Bauer, A. M. Gigler, A. J. Huber, R. Hillenbrand and R. W. Stark, J. Raman Spectrosc., 2009, 40, 1867–1874 CrossRef CAS.
- T. Hartman, J. Šturala, J. Luxa and Z. Sofer, ACS Nano, 2020, 14, 7319–7327 CrossRef CAS PubMed.
- A. Phaniendra, D. B. Jestadi and L. Periyasamy, Indian J. Clin. Biochem., 2015, 30, 11–26 CrossRef CAS PubMed.
- K. C. Knirsch, N. C. Berner, H. C. Nerl, C. S. Cucinotta, Z. Gholamvand, N. McEvoy, Z. Wang, I. Abramovic, P. Vecera, M. Halik, S. Sanvito, G. S. Duesberg, V. Nicolosi, F. Hauke, A. Hirsch, J. N. Coleman and C. Backes, ACS Nano, 2015, 9, 6018–6030 CrossRef CAS PubMed.
- G. Tuci, D. Mosconi, A. Rossin, L. Luconi, S. Agnoli, M. Righetto, C. Pham-Huu, H. Ba, S. Cicchi, G. Granozzi and G. Giambastiani, Chem. Mater., 2018, 30, 8257–8269 CrossRef CAS.
- E. E. Benson, H. Zhang, S. A. Schuman, S. U. Nanayakkara, N. D. Bronstein, S. Ferrere, J. L. Blackburn and E. M. Miller, J. Am. Chem. Soc., 2018, 140, 441–450 CrossRef CAS PubMed.
- K. Pramoda, U. Gupta, I. Ahmad, R. Kumar and C. N. R. Rao, J. Mater. Chem. A, 2016, 4, 8989–8994 RSC.
- M. van Druenen, F. Davitt, T. Collins, C. Glynn, C. O'Dwyer, J. D. Holmes and G. Collins, Chem. Mater., 2018, 30, 4667–4674 CrossRef CAS.
- S. Thurakkal and X. Zhang, Mater. Chem. Front., 2021, 5, 2824–2831 RSC.
- L. Zhang, L.-F. Gao, L. Li, C.-X. Hu, Q.-Q. Yang, Z.-Y. Zhu, R. Peng, Q. Wang, Y. Peng, J. Jin and H.-L. Zhang, Mater. Chem. Front., 2018, 2, 1700–1706 RSC.
- A. Mitrović, S. Wild, V. Lloret, M. Fickert, M. Assebban, B. G. Márkus, F. Simon, F. Hauke, G. Abellán and A. Hirsch, Chem.–Eur. J., 2021, 27, 3361–3366 CrossRef PubMed.
- H.-L. Hou, J. P. Merino, A. Criado, A. Hirsch and M. Prato, 2D Mater., 2019, 6, 25009 CrossRef CAS.
- Y. Cao, X. Tian, J. Gu, B. Liu, B. Zhang, S. Song, F. Fan and Y. Chen, Angew. Chem., Int. Ed., 2018, 57, 4543–4548 CrossRef CAS PubMed.
- T. Sainsbury, A. Satti, P. May, Z. Wang, I. McGovern, Y. K. Gun’ko and J. Coleman, J. Am. Chem. Soc., 2012, 134, 18758–18771 CrossRef CAS PubMed.
- T. Sainsbury, A. O'Neill, M. K. Passarelli, M. Seraffon, D. Gohil, S. Gnaniah, S. J. Spencer, A. Rae and J. N. Coleman, Chem. Mater., 2014, 26, 7039–7050 CrossRef CAS.
- Y. Liu, P. Gao, T. Zhang, X. Zhu, M. Zhang, M. Chen, P. Du, G.-W. Wang, H. Ji, J. Yang and S. Yang, Angew. Chem., Int. Ed., 2019, 58, 1479–1483 CrossRef CAS PubMed.
- T. Sainsbury, A. Satti, P. May, A. O'Neill, V. Nicolosi, Y. K. Gun’ko and J. N. Coleman, Chem.–Eur. J., 2012, 18, 10808–10812 CrossRef CAS PubMed.
- K. L. Walz Mitra, C. H. Chang, M. P. Hanrahan, J. Yang, D. Tofan, W. M. Holden, N. Govind, G. T. Seidler, A. J. Rossini and A. Velian, Angew. Chem., Int. Ed., 2021, 60, 9127–9134 CrossRef CAS PubMed.
- I. Haiduc, Coord. Chem. Rev., 2017, 338, 1–26 CrossRef CAS.
- P. Vishnoi, U. Gupta, R. Pandey and C. N. R. Rao, J. Mater. Chem. A, 2019, 7, 6631–6637 RSC.
- Y.-T. Liu, X.-M. Xie and X.-Y. Ye, Chem. Commun., 2013, 49, 388–390 RSC.
- S. Lei, X. Wang, B. Li, J. Kang, Y. He, A. George, L. Ge, Y. Gong, P. Dong, Z. Jin, G. Brunetto, W. Chen, Z.-T. Lin, R. Baines, D. S. Galvão, J. Lou, E. Barrera, K. Banerjee, R. Vajtai and P. Ajayan, Nat. Nanotechnol., 2016, 11, 465–471 CrossRef CAS PubMed.
- C. Backes, N. C. Berner, X. Chen, P. Lafargue, P. LaPlace, M. Freeley, G. S. Duesberg, J. N. Coleman and A. R. McDonald, Angew. Chem., Int. Ed., 2015, 54, 2638–2642 CrossRef CAS PubMed.
- J. Jiang, T. Xu, J. Lu, L. Sun and Z. Ni, Research, 2019, 2019 DOI:10.34133/2019/4641739.
- X. Zhang, L. Gao, H. Yu, Q. Liao, Z. Kang, Z. Zhang and Y. Zhang, Acc. Mater. Res., 2021, 2, 655–668 CrossRef CAS.
- X. Chen, N. C. Berner, C. Backes, G. S. Duesberg and A. R. McDonald, Angew. Chem., Int. Ed., 2016, 55, 5803–5808 CrossRef CAS PubMed.
- X. Chen, C. McGlynn and A. R. McDonald, Chem. Mater., 2018, 30, 6978–6982 CrossRef CAS.
- S. Karunakaran, S. Pandit, B. Basu and M. De, J. Am. Chem. Soc., 2018, 140, 12634–12644 CrossRef CAS PubMed.
- B. Bartolomei and M. Prato, Small, 2023, 19, 2206714 CrossRef CAS PubMed.
- B. Bartolomei, V. Corti and M. Prato, Angew. Chem., Int. Ed., 2023, 62, e202305460 CrossRef CAS PubMed.
- R. Canton-Vitoria, Y. Sayed-Ahmad-Baraza, M. Pelaez-Fernandez, R. Arenal, C. Bittencourt, C. P. Ewels and N. Tagmatarchis, npj 2D Mater. Appl., 2017, 1, 13 CrossRef.
- S. S. Chou, M. De, J. Kim, S. Byun, C. Dykstra, J. Yu, J. Huang and V. P. Dravid, J. Am. Chem. Soc., 2013, 135, 4584–4587 CrossRef CAS PubMed.
| This journal is © The Royal Society of Chemistry 2024 |