DOI:
10.1039/D3SC05325C
(Edge Article)
Chem. Sci., 2024,
15, 6363-6377
Ultrafast symmetry-breaking charge separation in Perylenemonoimide-embedded multichromophores: impact of regioisomerism†
Received
9th October 2023
, Accepted 20th March 2024
First published on 21st March 2024
Abstract
Symmetry-breaking charge separation (SB-CS) has recently evolved as an emerging concept offering its potential to the latest generation of organic photovoltaics. However there are several concerns that need to be addressed to reach the state-of-the-art in SB-CS chemistry, for instance, the desirable molecular geometry, interchromophoric distance and extent of electronic coupling. To shed light on those features, it is reported herein, that ortho-functionalized perylene monoimide (PMI) constituted regioisomeric dimer and trimer derivatives with varied molecular twisting and electronic conjugation have been synthesized. In steady-state photophysical studies, all the dimers and trimer derivatives exhibit a larger bathochromic shift in the emission spectra and a significant reduction of fluorescence quantum yield in polar DMF. Among the series of multichromophores, ortho- and self-coupled dimers display the strikingly different optical feature of SB-CS with a very fast charge separation rate (τCS = 80.2 ps) upon photoexcitation in DMF, which is unveiled by femtosecond transient absorption (fs-TA) studies. The SB-CS for two dimers is well-supported by the formation of PMI˙+ and PMI˙− bands in the fs-TA spectra. Further analysis of fs-TA data revealed that, among the other multichromophores the trimer also exhibits a clear charge separation, whereas SB-CS signatures are less prominent, but can not be completely disregarded, for the meta- and para-dimers. Additionally, the charge separation dynamics of those above-mentioned PMI derivatives are devoid of a kinetically favorable excimer or triplet formation. The evidence of a profound charge transfer phenomenon in the ortho-dimer is characterized by density functional theory (DFT) calculations on excited state electronic structures. The excitonic communications in the excited state electronic arrangements unravel the key role of dihedral twisting in SB-CS. The thermodynamic feasibility of CS (ΔGCS) and activation barrier (ΔG≠) of the derivatives in DMF are established from the Rehm–Weller equation and Marcus's theory, respectively. This work is an in-depth study of the effect of mutual orientation of PMIs and regioisomerism in determining sustainable guidelines for using SB-CS.
Introduction
The phenomenon of symmetry-breaking charge separation (SB-CS) is a fundamental and sister concept for photoinduced charge separation which has endowed a significant contribution to organic photovoltaics, organic photonics, and artificial photosynthesis.1 The formation of multiple excitons (electron hole pairs) at the donor–acceptor interfaces of the optoelectronic devices via photoinduced SB-CS substantially improves the charge carrier mobility of excitons, thus reflecting on their greater performances in photovoltaic devices.2,3 The SB-CS is more advantageous than charge separation in conventional donor (D)–acceptor (A) systems due to the occurrence of a minimum energy loss (<100 mV for SB-CS and ∼500 mV for a D–A chromophore).4 The SB-CS can be viewed as an electron transfer-mediated transformation of the symmetrical lowest excited states into an unsymmetrical stable charge-separated state (electrons and holes are spatially separated) in the presence of the surrounding environments.1,4,5 Several factors such as mutual orientation of chromophores, distances between monomers created using variable spacer units, extent of electronic coupling, and more importantly, the surrounding dielectric medium markedly influence the rate of SB-CS.6–10 Depending upon the occurrence of SB-CS, it can be categorized into two classes: intermolecular (a photosynthetic system in purple bacteria)11 and an intramolecular SB-CS. Multichromophoric systems constituted of two or more identical chromophores are generally recognized as ideal scaffolds for the manifestation of intramolecular SB-CS.3,12,13 By mimicking the highlyefficient natural SB-CS system of the purple bacteria, judicious design strategies for chromophores featuring the desired photophysical properties have emerged as the first and foremost principle to create multichromophores for intramolecular SB-CS.14–16 Uptonow, the most investigated intramolecular bichromophoric systems exploited for SB-CS include a variety of organic dyes such as 9,9-bianthryls,17,18 BODIPY,19,20 perylene,21,22 perylene diimide (PDI),16,23 terrylenediimide (TDI),24 zinc dipyrrin,25,26 metalloporphyrin,27 phthalocyanine28,29 and so on.30–35 Extensive studies showed that weakly electronically-coupled multichromophoric systems strongly favor SB-CS by exhibiting a rapid charge separation (timescale: 100 fs–10 ps) in polar solvents.3,36
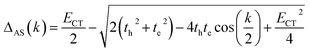
In the gallery of organic π-conjugated materials for SB-CS, perylene imide (PI) embedded molecular dyads/triads have captured increased attention from physical-organic chemists due to the intriguing photophysical properties of PI's and the desired synthetic modifications on the perylene imide core.37–40 Besides the previously mentioned features, the extreme electronic conjugation along their large π-skeletons and high electron affinity has bestowed on them an additional attribute for better charge separation.41–43 By exploiting those advantages, Wasielewski, Würthner and Kim, Xia, Hariharan and other groups have developed perylene diimide (PDI)-based multichromophoric systems exhibiting efficient charge separation and accomplishing long-lived charge-separated state via symmetry breaking.36,44–46 A myriad of the literature reveals that the PDI chromophore has been extensively employed for SB-CS,47–49 but such a phenomenon on its monoimide analog (perylene monoimide, PMI) has barely been researched. A few examples of PMI-based SB-CS have been reported, for instance, Hariharan and co-workers revealed SB-CS by direct peri–peri linked PMI dimer.50,51 The peri-positions of the PMIs create a significant change in π-conjugation when compared to that of the PDIs, which can unfold distinct excited-state photophysical properties.52–56 In this flourishing area, molecular engineering approaches have become a subject of great demand to attain a high CS rate. Also, the impact of regioisomerism on SB-CS remain elusive in the past literature. Therefore, in the quest to achieve fast SB-CS and to find the role of regioisomerism, we have developed a series of novel PMI-based multichromophoric architectures comprised of ortho-functionalized PMI-acetylene units (o-PMI-ac) connected via a phenyl (Ph) bridge at different positions (ortho-, meta-, para-) as well as a self-coupled PMI dimer and a 1,3,5-Ph-substituted PMI trimer (Fig. 1) which are abbreviated as o-Ph(o-PMI-ac)2, m-Ph(o-PMI-ac)2, p-Ph(o-PMI-ac)2, (o-PMI-ac)2 and 1,3,5-Ph(o-PMI-ac)3, respectively. We have thoroughly investigated the effect of structural configuration for those multichromophores on the SB-CS process using steady-state absorption and emission, time-resolved fluorescence measurements, femtosecond transient absorption spectroscopy, and first-principles calculations. The study revealed that the ortho- and self-coupled PMI dimers show prominent SB-CS in a polar solvent, whereas it is prohibited in a weaklypolar solvent. The structural distortion between the PMI monomers and the desired interchromophoric distance have led them to be suitable candidates for SB-CS with a weak-electronic coupling feature. Furthermore, the excited state CS phenomenon of the aforementioned derivatives is well-supported by in-depth theoretical calculations in addition to electrochemical investigation.
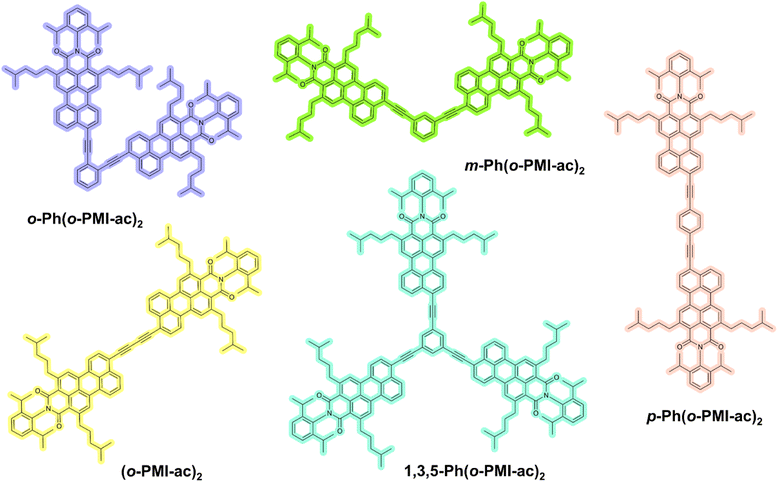 |
| | Fig. 1 Chemical structures of multichromophoric PMI derivatives investigated in this work. | |
Results and discussion
Synthesis of PMI-coupled derivatives
The PMI-based multichromophores were synthesized by following the Sonogashira–Hagihara cross-coupling reaction giving a moderate to high yield (see Schemes S1 and S2,† and the detailed synthetic procedures for all compounds are provided in the ESI†). Briefly, o-PMI-ac was synthesized by a Ru-catalyzed regioselective ortho-functionalization of PMI, followed by selective monobromination at the peri-position, introduction of a TIPS-acetylene moiety in the presence of the Pd2(dba)3-P(o-tolyl)3 catalytic system and finally, deprotection of the TIPS. Next, the o-PMI-ac units were coupled at different positions of the phenyl core to obtain the desired multichromophores. All the intermediate and desired compounds were comprehensively characterized by 1H-NMR spectroscopy, and high-resolution mass spectrometry including ESI-MS and MALDI (Fig. S1–S18†). The self-coupled dimer was obtained as a side product in the cross-coupling reactions. Here, the idea behind the introduction of an alkyne linker between the PMI and phenyl moieties was to extend the conjugation between the PMI units, thus modulating the electronic coupling, which is a crucial factor for the charge separation. In addition to that, bulky branched alkyl chains were incorporated in both ortho-positions of the PMI core that aided the significant increase in their solubility by disrupting the intense π–π interaction among the multichromophores, which acts as a pre-requisite solubility factor for carrying out the spectroscopic investigations.
Steady-state and time-resolved optical properties
The steady-state optical properties for all the synthesized derivatives were measured in three weakly polar to highly polar solvents namely toluene (Tol), chloroform (CHCl3), and N,N-dimethylformamide (DMF) with dielectric constant values of 2.38, 4.81, and 38.25, respectively. The optical purity of all the synthesized derivatives was validated from the superimposition of the absorption and excitation spectra in CHCl3 (see Fig. S19–S23 in the ESI†). Fig. 2a shows that the o-PMI-ac monomer (c = 2.0 μM) in toluene exhibited a well-resolved absorption spectrum consisting of vibronic features at 512 nm, 483 nm and 452 nm corresponding to 0–0, 0–1, and 0–2 transitions, respectively. The molar extinction coefficient of the o-PMI-ac at its λabsmax = 512 nm was found to be εmax = 41![[thin space (1/6-em)]](https://www.rsc.org/images/entities/char_2009.gif) 160 M−1 cm−1. The ortho-PMI dimer, i.e., o-Ph(o-PMI-ac)2 showed an unusual absorption profile possessing λabsmax at 490 nm in comparison to the parent PMI chromophore in toluene. Here, the 0–1 vibronic band emerged as the predominant band rather than the 0–0 band (A0–0/A0–1 = 0.84), as discussed in the next section. On the other hand, in the normalized absorption spectra, m-Ph(o-PMI-ac)2, p-Ph(o-PMI-ac)2, 1,3,5-Ph(o-PMI-ac)3 and self-coupled (o-PMI-ac)2 dimer restored the nature of the vibronic progressions (A0–0/A0–1 > 1.0) at their characteristic bands in toluene which were akin to those in the reference monomer o-PMI-ac. The characterized vibronic features in the absorption spectrum for the self-coupled derivative were less sharp (λAbsmax = 574 nm) in comparison to those of the other dimers and trimer derivatives. The evolution of strong vibronic progressions for all the PMI dimers/trimer derivatives is a sign of the coupling between the vinyl stretching mode (∼1250 cm−1) of the perylene core and the S0–S1 electronic transition of the PMIs.14,57 Notably, the dimers and trimer except ortho-PMI dimer showed a considerable bathochromic shift (17–48 nm) in their absorption spectra relative to the reference monomer because of the increased electronic conjugation between the two PMI monomer units through the phenyl linker. The UV-Vis. absorption spectra for all the derivatives delineated a negligible shift in their respective absorption maxima in weakly polar to highly polar solvents (Table 1), showing the insensitivity of their ground state electronic property towards the solvent polarity. The results of a concentration-dependent absorption study shown in Fig. S24 and S25† manifested no sign of aggregation of the multichromophores at the working concentration (c = 1.0 μM). To understand the excited-state optical properties, firstly, the fluorescence spectra of all the PMI derivatives in toluene were measured. On photoexcitation at 500 nm, the emission spectrum of the o-PMI-ac monomer in toluene displayed well-structured vibronic features mostly centered at 534 nm and 574 nm (λemmax = 534 nm) in conjunction with a weakly intense band at 624 nm. The emission profiles of the dimer and trimer derivatives in the same solvent (toluene) also revealed the appearance of a well-defined vibronic progression akin to o-PMI-ac, which was indicative of their existence in the monomer state, as shown in Fig. 2b. In stark contrast to the solvent polarity-independent absorption profiles, the emission spectra of the monomer and other derivatives exhibited a bathochromic shift in highly polar DMF when compared to toluene (Fig. 2c and d for the ortho-PMI dimer, and Fig. S26–S30† for the other derivatives). It was noted that the emission spectra of the dimers and trimer became broad in DMF in comparison to toluene, which might be possible due to polar solvent-assisted charge separation via symmetry breaking. The SB-CS in a polar medium leads to the generation of charge-separated species which interact with the solvent's dipole, resulting in a red shift and a broadening of the spectra.50,58 In addition, a marginal change in λabsmax and a relatively larger red shift in λemmax ensured to attain a large Stokes shift in DMF but not in the other two solvents (e.g., for ortho-PMI dimer, the Stokes shifts were 66 nm, 77 nm, and 88 nm in toluene, CHCl3 and DMF, respectively). Subsequently, to gain further insights into the excited-state CS characteristics of such multichromophores, we measured the absolute fluorescence quantum yield (ΦFl) and the average fluorescence lifetime (τavg) in three solvents, as shown in Table 1. The ΦFl values for the o-PMI-ac monomer in toluene and CHCl3 were 79% and 71%, respectively, but were decreased in DMF to give ΦFl of 54% (note that the decrease of ΦFl accounts for an inherent dipolar feature of PMI which is consistent with its asymmetric structure). Much to our delight, the dimer and trimer molecules expressed appreciably high ΦFl values (QY range – 75–84%) in toluene, which drastically dropped in DMF (ΦFl < 15%), for example, for the ortho-PMI dimer, ΦFl (Tol) = 75%, ΦFl (CHCl3) = 64% and ΦFl (DMF) <1.0%. The reduction of ΦFl values for multichromophores in polar DMF is ascribed to the activation of an additional non-radiative decay pathway in DMF. Similarly, the fluorescence lifetime measurement showed that the reference (o-PMI-ac) exhibited an increase in the fluorescence lifetime values with an increase in the solvent polarity (4.1 ns in Tol to 4.5 ns in DMF, Fig. 2e, Tables S1 and S2†) which is indicative of intramolecular charge transfer (ICT) characteristic present in o-PMI-ac. These ICT characteristics are further supported by an observed red shift in the steady state emission spectrum of the monomer (Fig. S26†) and the Lippert–Mataga plot in Fig. S31.† We estimate that a large change of dipole moment between the ground and excited electronic states (Δμ = 4.77 Debye), is indicative of the presence of an ICT state. A similar behavior was observed for other PMI derivatives59 and recently for terrylene monoimide.60 The impact of the solvent polarity on the CT and locally excited (LE) states is widely recognized in the literature. As the solvent polarity increases, the CT energy level undergoes a gradual decrease because of the robust interaction between the solvent and solute. In contrast, the LE energy level remains relatively unaffected by the solvent polarity, and this is attributed to the small dipole moment associated with the LE state. This phenomenon implies that in high-polarity solvents, the CT state is energetically lower than the LE state while it is reversed in low-polarity solvents. A similar increase in the fluorescence lifetime with solvent polarity was observed for the PMI monomer,50 aryl-substituted 9,9′-bianthryl derivatives61 and substituted N,N-diphenyl-amine dyads.62 The fluorescence decay of all the multichromophores in weakly and medium polar solvents were properly fitted with the mono-exponential function. In DMF, all these derivatives displayed bi-exponential decay, indicating the evolution of a new excited-state species in polar DMF (Fig. 2f, S32, Tables S1 and S2†). A bi-exponential fluorescence decay may result from two potential reasons, the first involves a radiative charge recombination
as observed in inorganic semiconductors. If this is the case, the spectra of the delayed emission would shift to a lower energy, reflecting the magnitude of the driving force for the SB-CS, as the emission would originate from the lower energy charge transfer (CT) state. The second possibility is that, due to the small driving force for SB-CS, the charges could recombine to the S1 state rather than directly to the ground state and would create a pseudo-equilibrium between the SB-CS state and the S1 state. This bi-exponential fluorescence lifetime was also observed for a spiro-conjugated perylenediimide dimer.36 Based on the spectroscopic outcomes in DMF such as the bathochromic shift together with the broadening in the emission spectra, the profound reduction of absolute ΦFl values and the prominent change in time-resolved decay, we anticipate the possibility of charge separation in polar DMF. The charge separation can facilitate the non-radiative decay channels competitive to the radiative pathway, from the S1 to CS state, and as a result, it diminishes the emission quantum efficiency of these multichromophoric PMI derivatives in DMF, that were not observed in toluene. Therefore, in the next section, we discuss the investigation of the excitonic interactions in the excited state together with their conformational studies by using computational methodologies.
160 M−1 cm−1. The ortho-PMI dimer, i.e., o-Ph(o-PMI-ac)2 showed an unusual absorption profile possessing λabsmax at 490 nm in comparison to the parent PMI chromophore in toluene. Here, the 0–1 vibronic band emerged as the predominant band rather than the 0–0 band (A0–0/A0–1 = 0.84), as discussed in the next section. On the other hand, in the normalized absorption spectra, m-Ph(o-PMI-ac)2, p-Ph(o-PMI-ac)2, 1,3,5-Ph(o-PMI-ac)3 and self-coupled (o-PMI-ac)2 dimer restored the nature of the vibronic progressions (A0–0/A0–1 > 1.0) at their characteristic bands in toluene which were akin to those in the reference monomer o-PMI-ac. The characterized vibronic features in the absorption spectrum for the self-coupled derivative were less sharp (λAbsmax = 574 nm) in comparison to those of the other dimers and trimer derivatives. The evolution of strong vibronic progressions for all the PMI dimers/trimer derivatives is a sign of the coupling between the vinyl stretching mode (∼1250 cm−1) of the perylene core and the S0–S1 electronic transition of the PMIs.14,57 Notably, the dimers and trimer except ortho-PMI dimer showed a considerable bathochromic shift (17–48 nm) in their absorption spectra relative to the reference monomer because of the increased electronic conjugation between the two PMI monomer units through the phenyl linker. The UV-Vis. absorption spectra for all the derivatives delineated a negligible shift in their respective absorption maxima in weakly polar to highly polar solvents (Table 1), showing the insensitivity of their ground state electronic property towards the solvent polarity. The results of a concentration-dependent absorption study shown in Fig. S24 and S25† manifested no sign of aggregation of the multichromophores at the working concentration (c = 1.0 μM). To understand the excited-state optical properties, firstly, the fluorescence spectra of all the PMI derivatives in toluene were measured. On photoexcitation at 500 nm, the emission spectrum of the o-PMI-ac monomer in toluene displayed well-structured vibronic features mostly centered at 534 nm and 574 nm (λemmax = 534 nm) in conjunction with a weakly intense band at 624 nm. The emission profiles of the dimer and trimer derivatives in the same solvent (toluene) also revealed the appearance of a well-defined vibronic progression akin to o-PMI-ac, which was indicative of their existence in the monomer state, as shown in Fig. 2b. In stark contrast to the solvent polarity-independent absorption profiles, the emission spectra of the monomer and other derivatives exhibited a bathochromic shift in highly polar DMF when compared to toluene (Fig. 2c and d for the ortho-PMI dimer, and Fig. S26–S30† for the other derivatives). It was noted that the emission spectra of the dimers and trimer became broad in DMF in comparison to toluene, which might be possible due to polar solvent-assisted charge separation via symmetry breaking. The SB-CS in a polar medium leads to the generation of charge-separated species which interact with the solvent's dipole, resulting in a red shift and a broadening of the spectra.50,58 In addition, a marginal change in λabsmax and a relatively larger red shift in λemmax ensured to attain a large Stokes shift in DMF but not in the other two solvents (e.g., for ortho-PMI dimer, the Stokes shifts were 66 nm, 77 nm, and 88 nm in toluene, CHCl3 and DMF, respectively). Subsequently, to gain further insights into the excited-state CS characteristics of such multichromophores, we measured the absolute fluorescence quantum yield (ΦFl) and the average fluorescence lifetime (τavg) in three solvents, as shown in Table 1. The ΦFl values for the o-PMI-ac monomer in toluene and CHCl3 were 79% and 71%, respectively, but were decreased in DMF to give ΦFl of 54% (note that the decrease of ΦFl accounts for an inherent dipolar feature of PMI which is consistent with its asymmetric structure). Much to our delight, the dimer and trimer molecules expressed appreciably high ΦFl values (QY range – 75–84%) in toluene, which drastically dropped in DMF (ΦFl < 15%), for example, for the ortho-PMI dimer, ΦFl (Tol) = 75%, ΦFl (CHCl3) = 64% and ΦFl (DMF) <1.0%. The reduction of ΦFl values for multichromophores in polar DMF is ascribed to the activation of an additional non-radiative decay pathway in DMF. Similarly, the fluorescence lifetime measurement showed that the reference (o-PMI-ac) exhibited an increase in the fluorescence lifetime values with an increase in the solvent polarity (4.1 ns in Tol to 4.5 ns in DMF, Fig. 2e, Tables S1 and S2†) which is indicative of intramolecular charge transfer (ICT) characteristic present in o-PMI-ac. These ICT characteristics are further supported by an observed red shift in the steady state emission spectrum of the monomer (Fig. S26†) and the Lippert–Mataga plot in Fig. S31.† We estimate that a large change of dipole moment between the ground and excited electronic states (Δμ = 4.77 Debye), is indicative of the presence of an ICT state. A similar behavior was observed for other PMI derivatives59 and recently for terrylene monoimide.60 The impact of the solvent polarity on the CT and locally excited (LE) states is widely recognized in the literature. As the solvent polarity increases, the CT energy level undergoes a gradual decrease because of the robust interaction between the solvent and solute. In contrast, the LE energy level remains relatively unaffected by the solvent polarity, and this is attributed to the small dipole moment associated with the LE state. This phenomenon implies that in high-polarity solvents, the CT state is energetically lower than the LE state while it is reversed in low-polarity solvents. A similar increase in the fluorescence lifetime with solvent polarity was observed for the PMI monomer,50 aryl-substituted 9,9′-bianthryl derivatives61 and substituted N,N-diphenyl-amine dyads.62 The fluorescence decay of all the multichromophores in weakly and medium polar solvents were properly fitted with the mono-exponential function. In DMF, all these derivatives displayed bi-exponential decay, indicating the evolution of a new excited-state species in polar DMF (Fig. 2f, S32, Tables S1 and S2†). A bi-exponential fluorescence decay may result from two potential reasons, the first involves a radiative charge recombination
as observed in inorganic semiconductors. If this is the case, the spectra of the delayed emission would shift to a lower energy, reflecting the magnitude of the driving force for the SB-CS, as the emission would originate from the lower energy charge transfer (CT) state. The second possibility is that, due to the small driving force for SB-CS, the charges could recombine to the S1 state rather than directly to the ground state and would create a pseudo-equilibrium between the SB-CS state and the S1 state. This bi-exponential fluorescence lifetime was also observed for a spiro-conjugated perylenediimide dimer.36 Based on the spectroscopic outcomes in DMF such as the bathochromic shift together with the broadening in the emission spectra, the profound reduction of absolute ΦFl values and the prominent change in time-resolved decay, we anticipate the possibility of charge separation in polar DMF. The charge separation can facilitate the non-radiative decay channels competitive to the radiative pathway, from the S1 to CS state, and as a result, it diminishes the emission quantum efficiency of these multichromophoric PMI derivatives in DMF, that were not observed in toluene. Therefore, in the next section, we discuss the investigation of the excitonic interactions in the excited state together with their conformational studies by using computational methodologies.
 |
| | Fig. 2 Normalized (a) absorption and (b) emission spectra of all the investigated compounds including the reference monomer in toluene. (c) The normalized absorption and (d) normalized emission spectra of o-Ph(o-PMI-ac)2 in three different solvents. The fluorescence lifetime decay of (e) o-PMI-ac monomer and (f) o-Ph(o-PMI-ac)2 in three solvents. | |
Table 1 Photophysical properties of PMI derivatives in three solvents
| Comp. |
Solvent |
λ
absmax
/nm |
λ
emmax
/nm |
Stokes shiftc/nm |
Φ
Fl
/% |
|
Absorption maxima.
Emission maxima of four derivatives in the mentioned solvents.
Represents the Stokes shifts [λemmax − λabsmax].
The absolute QY was measured in three solvents using an integrating sphere. Quantum yield (±<5.0%).
|
|
ortho-Dimer |
Tol |
491 |
557 |
66 |
75 ± 0.5 |
| CHCl3 |
490 |
567 |
77 |
64 ± 0.5 |
| DMF |
493 |
581 |
88 |
<1.0 |
|
meta-Dimer |
Tol |
527 |
548 |
21 |
74 ± 0.4 |
| CHCl3 |
529 |
554 |
25 |
65 ± 0.4 |
| DMF |
529 |
568 |
39 |
15 ± 1.7 |
|
para-Dimer |
Tol |
536 |
558 |
22 |
73 ± 0.7 |
| CHCl3 |
540 |
566 |
26 |
64 ± 0.7 |
| DMF |
540 |
574 |
34 |
12 ± 3.8 |
| SC dimer |
Tol |
560 |
574 |
14 |
48 ± 1.4 |
| CHCl3 |
560 |
580 |
20 |
64 ± 2.5 |
| DMF |
558 |
588 |
30 |
<1.0 |
Electronic structure calculations
In this section, we discuss the molecular aggregation and excitonic communication in the excited state electronic structure. The discussion of the calculated absorption and emission spectrum have been provided in the ESI† together with the NTO plot in Fig. S33.† A brief description of Fig. 3a–c is provided in the ESI.† The long-range (Kasha-like) Coulomb exchange coupling (JCoul) values are calculated by using the transition charges from the electrostatic potential (TrESP) and the following equation:36,63| | 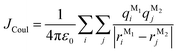 | (1) |
where qMi refers to the transition charges on the ith atom of monomer M and  which refers to the displacement vectors with respect to the centre of mass during an electronic transition. The calculated values for the three dimers are listed in Table 2. In the Kasha-like aggregation, the predominant nature of the coulombic coupling arises due to the large S1 ← S0 transition electric dipole moment (TEDM).64 The TEDM values of ortho-, meta- and para-PMI dimers are 5.61, 6.38 and 7.96 au, respectively, (see Table S3†). Therefore, the order of the JCoul values should be JCoulpara− > JCoulmeta− > JCoulortho−. However, the order is reversed in the present case: JCoulpara− < JCoulmeta− < JCoulortho−. Therefore, the aggregation behavior based on the Kasha rule is unconventional here. This framework can be explained by considering the hole (th) and the electron (te) transfer integrals that allow the mixing of the Frenkel and CT excitons as previously demonstrated by Hestand et al. with oligoacenes65 and later on by Zhong et al. with donor–acceptor chromophores.66 In the excitonic coupling limit, the energy of the symmetric (S) and antisymmetric (AS) band is calculated by:
| | | ES(AS)(k) = E0–0 + ΔS(AS)(k) | (2) |
where k is the wave vector and k = 0 refers to the bright state. E0–0 is the energy of the absorption maxima and ΔS(AS)(k) is the energy shift due to the excitonic coupling, expressed as:| | 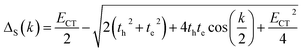 | (3) |
| |  | (4) |
In the case of th = te, ΔAS(k = 0) = 0, indicates no energy shift. However, for th ≠ te, ΔAS(k = 0) < 0, it clearly illustrates a red shift in the EAS(k = 0) value in eqn (2). Hence, it generates a H-like band which is completely unconventional with respect to the Kasha mechanism that relies on the Coulombic electrostatic interaction. The calculated th, te and ΔAS(k = 0) values are shown in Table 2. The th and te are not equal and are of same sign for all the cases. Therefore, for all the present cases (thte > 0), the lower band is symmetric (S) and the upper band is antisymmetric (AS), as shown in Fig. 3a. For the ortho-PMI dimer, the ΔAS(k = 0) is more negative (−112.6 cm−1) than that of the meta-PMI dimer (−46 cm−1) as shown by (ECT)ortho− < (ECT)meta− and (thte)ortho− > (thte)meta− in eqn (4). This results a more red-shifted (lower energy) value in EAS(k = 0) for the ortho-PMI dimer and shows H-aggregation, as illustrated in Fig. 3d and e, respectively. In the present scenario, the CT state is not detected among the first four singlet excited states of the para-PMI dimer but the state may arise in the higher energy states which is not considered here. Therefore, the ECT of the para-PMI dimer is much larger than that of the others. Consequently, there is a blue-shift in the EAS(k = 0) value, which results in a J-like band. In a similar fashion, the interaction between the diabatic CS states can split them into two delocalized charge resonance states (DCR) with a splitting parameter of 2|JCT| (see Fig. 3c).6,67 The CT couplings (JCT) are calculated with the te and th values and the energy differences between the virtual CT state (ECT) and the S1 state (ES1):68| | 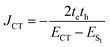 | (5) |
 |
| | Fig. 3 The framework of the conventional Kasha model (a) J-aggregate and (b) H-aggregate, where S = symmetric band and AS = antisymmetric band. In the excitonic coupling limit (a) thte > 0 and (b) thte < 0. (c) The excited state energy diagram at the ground state optimized ortho-PMI dimer (PMI–PMI dihedral angle, φ = 44°) with a polarized continuum model of the chloroform solvent. The delocalized Frenkel and charge resonance excitons are the linear combination of the localized Frenkel (M*M or MM*) and CT (M−M+ or M+M−) states of the monomers (M). The coupling between the delocalized states results in adiabatic excited states (S1–S4). The oscillator strengths are denoted by f. (d) and (e) deviation from the Kasha-like aggregation in the ortho- and meta-dimer, respectively (eqn (2)–(4)). | |
Table 2 The hole (th) and electron (te) transfer integral together with the short-range CT coupling (JCT), long-range Coulomb electrostatic coupling (JCoul) and energy shift of the antisymmetric band (ΔAS(k = 0)). Here, φ denotes the PMI–PMI dihedral angle in the dimer
| (cm−1) |
t
h
|
t
e
|
J
CT
|
ΔCT |
J
Coul
|
ΔAS(k = 0) |
|
ortho-Dimer (φ = 20°) |
−2925 |
−165.7 |
−143.0 |
−2533 |
188.1 |
−543.5 |
|
ortho-Dimer (φ = 44°) |
−1296 |
−54.3 |
−20.5 |
−491.0 |
185.6 |
−112.6 |
|
ortho-Dimer (φ = 80°) |
−29.7 |
−13.8 |
0.12 |
−0.32 |
184.9 |
0.21 |
|
meta-Dimer |
−802.6 |
−25.1 |
−4.55 |
−145.0 |
79.4 |
−46.1 |
|
para-Dimer |
694.1 |
16.9 |
— |
— |
64.4 |
≳0 |
The sign of te and th is dependent on the relative orientation of the nodal plane of HOMO and LUMO at an excitonic communication limit.68,69 The JCTs of ortho-PMI and meta-PMI dimers are calculated as −20.5 and −4.55 cm−1 (Table 2). Hence, the possibility of the formation of the DCR state in the meta-PMI dimer is less because the CT coupling is not dominant when compared to the ortho-PMI dimer. The local electrostatic symmetry of the charge resonance state in the ortho-PMI dimer is broken by the solvent polarity and the hole/electron particularly occupies one monomeric unit which provides spontaneity to the generation of PMI˙+–PMI˙−. The charges then recombine to produce a local exciton which is emitted to the ground state via a radiative or a non-radiative pathway.13,68 In this process, the charge recombination can also occur directly from the initially created excited states which introduced a self-energy correction (ΔCT) and this was determined by the expression:68
| |  | (6) |
A self-energy correction of – 491 cm−1 in the ortho-PMI dimer indicates that there is a strong coupling between the local exciton and charge-separated excitons which also agrees with the non-Kasha aggregation behavior (ΔAS(k = 0) < 0) in the ortho-PMI dimer. However, a better justification of the Frenkel-CT mixing can be explained by considering the variations in intermolecular orientation,58 see below.
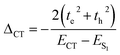
The selected atoms in the dimer for a relaxed PES scan are shown in the Fig. S34.† As shown in Fig. 4a, the orbital overlap (J) between the HOMO(M1) and HOMO(M2) or LUMO(M1) and LUMO(M2) is responsible for the SB-CS process whereas the J between the HOMO(M1) and LUMO(M2) is responsible for the charge recombination process to the ground state. Hence, it is relevant to investigate JHH, JLL and JHL. For the ortho-PMI dimer, JHH, JLL and JHL together with JH–1,H, JL,L+1, JH–1,L+1 and JH–1,L are considered. The investigation is justified in Fig. S35,† where the HOMO − 1 of the neutral PMI reassembles with the singly occupied molecular orbital (SOMO) of the radical cation PMI while the LUMO of the neutral PMI molecule is identical with the SOMO of the radical anion PMI. Another reason is that the absorption maxima and CT states of the ortho-PMI dimer appeared mostly from the transitions between HOMO − 1, HOMO, LUMO and LUMO + 1 FMOs (Table S4†). The variations of J with the PMI–PMI dihedral angle (φ) are shown in Fig. 4b and c and Table S6†. For the ortho-PMI dimer, all types of coupling strengths are increasing with the decrease in the torsional angle. The geometry with φ ≈ 20° and 40° showed the maximum coupling strengths in JHH and JH−1,H. Comparatively lower values of the JLL and JL,L+1 indicate that the electron transfer is suppressed, and the SB-CS occurs mainly via hole transfer between the monomeric units. The structure with φ ≈ 80° shows the minimal coupling in all cases. Therefore, the two structures φ ≈ 20° (maximum J) and φ ≈ 80° (minimum J) are considered for further studies. The NTO plots of the singlet excited states are shown in Fig. 4d and e, and the FMOs are shown in Fig. S36.† The characteristics of the Frenkel exciton in the S1 and S2 state, and the CR exciton in the S3 and S4 state are more prominent in φ ≈ 20° than in φ ≈ 80°. The absorption wavelength for the PMI monomer at CAM-B3LYP/def2-SVP/PCM (chloroform) level is 442 nm (f = 1.32) whereas for φ ≈ 20° and φ ≈ 80°, the λcalcabs are 453 nm (f = 2.25) and 451 nm (f = 2.29), respectively, for the ortho-PMI dimer. The JCoul, JCT, ΔCT and ΔAS(k = 0) are listed in Table 2. The φ ≈ 44° corresponds to the full optimized structure. No significant changes have been observed in the JCoul values in the φ ≈ 20°, 44° and 80° structures. However, φ ≈ 20° carries a more negative JCT (−143.0 cm−1) whereas φ ≈ 80° shows a minimal JCT (0.12 cm−1). This shows that the structure with φ ≈ 20° it may be possible for it to show a larger excitonic occurrence (thte > 0).68 Consequently, a high negative ΔCT value corresponding to that structure refers to a significant Frenkel-CT mixing, which is an indication of the formation of an unconventional Kasha H-band. A large red-shift of the asymmetric band at k = 0 confirms the deviation. The lower values of JH–1,L with respect to the JH–1,H shows that the rate of charge recombination is relatively small, unlike that of SB-CS. The meta- and para-PMI dimers are both rigid for the excited-state phenomenon and hence, do not show any significant variation in the orbital overlap with the interchromophoric orientations, as shown in Fig. S37.†
 |
| | Fig. 4 (a) Scheme for the locally excited (LE), symmetry-breaking charge transfer (SB-CT) and charge recombination (CR) phenomenon in a dimer consisting of two monomeric units, M1 and M2 (H stands for HOMO and L stands for LUMO). (b) The variation of coupling strengths between HOMO − 1 and HOMO, LUMO and LUMO + 1, and HOMO − 1 and LUMO + 1 of monomer 1 and monomer 2, respectively, with dihedral angles between the two PMI units in the ortho-PMI dimer. (c) The variation of coupling strengths between the HOMOs, LUMOs and HOMO and LUMO of monomer 1 and monomer 2, respectively, with a dihedral angle between the two PMI units in ortho-PMI dimer. (d) and (e) The NTO plots with an isosurface of ±0.0002 au corresponding to the first four singlet excited states in the ortho-PMI dimers with a dihedral angle between two PMI units of 20° (higher coupling strength) and 80° (lower coupling strength), respectively. The energies are in eV and calculated at the CAM-B3LYP/def2-SVP/PCM (chloroform) level of theory. | |
The energy of the first excited singlet states of the ortho-PMI dimer against the variation in the PMI–PMI dihedral angle is plotted in Fig. S38,† which indicates the formation of an excimer-like structure.70 The structure corresponding to the minima of this plot nearly agrees with the optimized S1 structure (φ = 38.5°), as shown in Fig. S39.† The solvent polarity simplifies the Frenkel-CT mixing in the excited state which introduces an amount of the CT characteristic to the S1 and breaks down the adiabaticity of the state in the ortho-PMI dimer, which is also evident from the larger Stokes shift and is comparable to the others (Tables 1 and S5†). This results in a decrease in fluorescence lifetime, and hence, proceeds to an ultrafast SB-CS, as recently discussed by Hong et al.14 and Qin et al.71 with perylene bisimide dimer and perylene monoimide dimer, respectively. Furthermore, Marcus's theory is appropriate here to explain the electron transfer process as the SB-CS process relies on the nonadiabatic electron transfer (NAET).72 In this context, the NAET is predominantly dependent on Marcus's parameters: (i) driving force for the CS (ΔGCS), (ii) reorganization energy (λtotal), and (iii) electronic coupling (JHL). For the ortho-PMI dimer, the ΔGCS values in toluene, chloroform, and DMF are 0.46, 0.11 and −0.19 eV, respectively, (calculated using the Rehm–Weller equation as discussed later). The internal λ (λi) is calculated by using the optimized ionic structures at both their ground-state and excited-state. The contribution of solvent in λ (λs) is also calculated in different solvents as discussed in the ESI.† Here, λtotal = λi + λs. A schematic showing an explanation of the Marcus parameters in SB-CS is captured in Fig. S40† and the calculated values are provided in Table S7.† The lower value of ΔGCS and the higher value of λtotal with the increase of solvent polarity clearly signifies that in DMF, the SB-CS occurs spontaneously. This finding is confirmed by calculating the activation barrier for the NAET:
| | | ΔG‡ = (ΔGCS + λtotal)2/4λtotal | (7) |
The ΔG‡ values are found to decrease with increase of the polarity of the solvents (Table S7†). Hence, the present computational study concludes that there is the presence of delocalized charge resonance states as an intermediate in the SB-CS and that the solvent polarity simplifies the process.
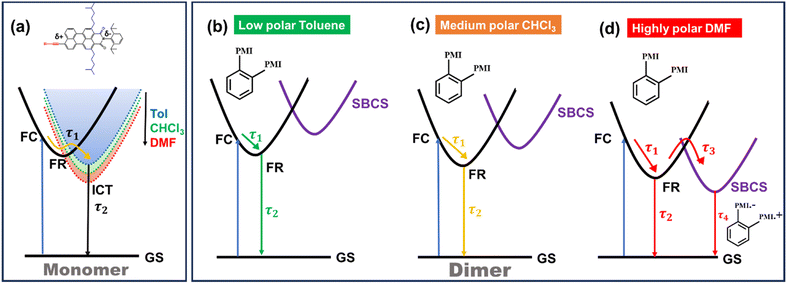
Femtosecond transient absorption (TA) studies
To delve deeper into the solvent-modulated excited state dynamics of various structural PMI-dimers/trimer, femtosecond transient absorption (fs-TA) measurements73,74 were performed in solvents of varying polarities. The 2D contour of fs-TA data for each compound in CHCl3 together with the corresponding steady-state and pump-probe laser spectra are shown in Fig. S41.† The fs-TA spectra at different probe delays for the monomer, ortho-PMI dimer and the self-coupled dimer are shown in Fig. 5 and for the meta-PMI dimer and para-PMI dimer, and those for the PMI-trimer are shown in Fig. S42.† The monomeric o-PMI-ac shows a ground state bleach (GSB) signal which corresponds to the S0 → S1 transition, i.e., re-absorption from the ground state bleach (GSB) containing three different vibronic bands at 450 nm, 482 nm, and 520 nm, were quite similar to what was observed in the steady-state absorption spectrum. A stimulated emission (SE) band corresponds to the S1 → S0 transition is observed at around 570 nm, which was nearly comparable to the 0 → 1 vibronic band in the emission spectrum; and the 0 → 0 band is spectrally indistinguishable from that of the 0 ← 0 band of the GSB at 520 nm. The excited singlet state absorption (ESA) corresponding to the Sn ← S1 transition is observed in the 620–750 nm region. A slightly blue-shifted (compared with toluene), ESA band in CHCl3 and DMF exhibits a rise in intensity followed by decay, over longer probe delays. An observable red shift in the steady state emission spectrum of the monomer (Fig. S26†) and an increase in the single-exponential fluorescence lifetime with an increase in the solvent polarity (4.1 ns in Tol to 4.5 ns in DMF, Table S2†) is indicative of the ICT characteristic present in the monomer o-PMI-ac.
 |
| | Fig. 5 Plots for transient absorption spectral traces at various probe delay times for the monomer (left panel), the ortho-PMI dimer (middle panel), and the self-coupled dimer (right panel) in toluene (a, b, c), CHCl3 (d, e, f), and DMF (g, h, i), respectively. The assignment of the ESA bands corresponding to the radical species is done on the basis of the spectroelectrochemistry data (Section VII in the ESI†). | |
The fs-TA data of monomer o-PMI-ac in different polar solvents were reproduced well by the global lifetime fitting analysis, where the two relaxation processes are assumed to be taking place in a sequential pathway. Such global analysis of the fs-TA data enables a holistic understanding of the excited state dynamics by exploiting multiple spectrally overlapped signals and by examining these signals simultaneously, a comprehensive perspective of the behavior of the excited state can be obtained.74 A two-step sequential model as shown in Fig. 6a, A → B → GS was employed to fit the excited-state photophysics of the monomer. The corresponding evolution-associated difference spectra (EADS) together with the population dynamics and time constants are shown in Fig. S43† and Table 3, respectively. The first relaxation process A → B is assigned to the relaxation from the Franck–Condon (FC) region to a fully-relaxed (FR) region of the initially populated LE singlet state (state A), and eventually to an ICT state (state B) with a time constant (τ1 or τA→B ≡ τVR+FR→ICT) of 3.8 ps in Tol. This time constant was found to become faster on increasing the solvent polarity to 2.62 ps and 2.25 ps in CHCl3 and DMF, respectively. The second time constant (τ2 or τB→GS) ranging from 3–4 ns was attributed to the decay of the B state back to the ground state, and this time scale matches well with the fluorescence lifetime (Table S2†). To show the quality of the fitting results, the kinetics at a few selected wavelengths are shown in Fig. S44.† The choice of this kinetic model (A → B → GS) is justified by the progressive red-shift in the fluorescence spectra as well as the increase in fluorescence lifetime with increasing solvent polarity, as mentioned earlier.
 |
| | Fig. 6 Schematic potential energy diagram showing (a) solvent-dependent stabilization of charge transfer state in monomer and (b–d) different relaxation pathways for dimers after photoexcitation in lower polarity solvent toluene (b), in medium polarity solvents CHCl3 (c) and in highly polar solvent DMF (d). | |
Table 3 Time constants obtained from the global target analysis of the fs-TA data for toluene, CHCl3, and DMF
| Compound |
Solvent |
τ
1 or τA→B ≡ τVR+FR→ICT (ps) |
τ
2 or τB→GS ≡ τFl(ps) |
τ
3 or τB→C ≡ τSB-CS (ps) |
τ
4 or τC→GS ≡ τCR (ps) |
|
Fixed lifetime values derived from TCSPC.
|
| Monomer |
Tol |
3.80 ± 0.02 |
3628 ± 1 |
— |
— |
| CHCl3 |
2.62 ± 0.01 |
4260 ± 6 |
— |
— |
| DMF |
2.15 ± 0.006 |
3670 ± 2 |
— |
— |
|
ortho-Dimer |
Tol |
2.13 ± 0.01 |
4053 ± 2 |
— |
— |
| CHCl3 |
0.62 ± 0.004 |
3824 ± 1 |
— |
— |
| DMF |
0.21 ± 0.005 |
1730a |
80.2 ± 0.01 |
901 ± 2 |
|
meta-Dimer |
Tol |
1.13 ± 0.004 |
3148 ± 7 |
— |
— |
| CHCl3 |
53.7 ± 0.1 |
3004 ± 2 |
— |
— |
| DMF |
4.1 ± 0.04 |
900a |
2913 ± 115 |
4545 ± 10 |
|
para-Dimer |
Tol |
2.58 ± 0.006 |
1788 ± 0.3 |
— |
— |
| CHCl3 |
1.81 ± 0.05 |
2129 ± 0.9 |
— |
— |
| DMF |
0.63 ± 0.002 |
3600a |
90.8 ± 0.38 |
851.2 ± 3 |
| Self-coupled dimer |
Tol |
17.6 ± 0.02 |
1351 ± 0.27 |
— |
— |
| CHCl3 |
1.64 ± 0.009 |
1481 ± 0.6 |
— |
— |
| DMF |
0.16 ± 0.006 |
3380a |
83.1 ± 0.01 |
1012 ± 5 |
| Trimer |
Tol |
2.01 ± 0.008 |
2322 ± 0.5 |
— |
— |
| CHCl3 |
0.27 ± 0.001 |
2332 ± 7.1 |
— |
— |
| DMF |
0.23 ± 0.004 |
800a |
3.92 ± 0.003 |
1268 ± 0.6 |
In a weakly polar solvent Tol and a medium polar solvent CHCl3, the fs-TA spectra of the monomer of all the dimers and trimer resemble the steady-state absorption features in the GSB signal and a far red-shifted ESA signal occurs at around 745 nm, as shown in Fig. 5 and S42.† A red-shifted GSB, and ESA signals of different (o-PMI-ac)2 dimers and trimer, when compared to the monomer, is indicative of the difference in the electronic couplings between the monomeric PMI moiety present at various molecular conformational constraints within the dimer44,45 as discussed in the previous section.
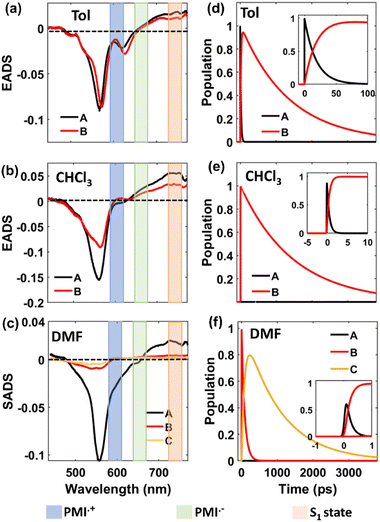
Contrary to the steady-state absorption spectrum, the ortho-dimer shows a maximum intensity at the 0 ← 0 band in the TA spectrum. This is primarily because this band results from the overlap of the GSB and the SE signal, as shown in Fig. 5 (middle panel). For, the ortho-PMI dimer in toluene and CHCl3, the spectral features resembled the monomer, however, the kinetics varied significantly. To extract the excited-state deactivation process of the ortho-dimer in Tol and CHCl3, the best-fitting results were obtained when a two-step sequential model A → B → GS (Fig. 6a) was employed. The EADS for the ortho-PMI dimer in Tol and CHCl3 are shown in Fig. 7a and b, respectively, and the corresponding population kinetics are shown in Fig. 7d–f. The first relaxation process A → B is assigned to the relaxation from the Franck-Condon region to a fully-relaxed region of the initially populated mixed state (state A) of the Frenkel and CT excitons with a shorter lifetime component (τ1 or τA→B). This time component becomes faster in CHCl3 (τ1 or τA→B = 0.62 ps) when compared to toluene (τ1 or τA→B = 2.13 ps). The FR state (B state) further decays to the ground state (B → GS) with a lifetime component (τ2 or τ![[B with combining right harpoon above (vector)]](https://www.rsc.org/images/entities/char_0042_20d1.gif) →GS) of 4.2 ns or 3.6 ns in toluene or CHCl3, respectively, which is in agreement with the fluorescence lifetimes (see Table S2†). A progressive red shift in the stimulated emission signal in the second EADS (blue) (Fig. 7e) indicated the emergence of a novel transient species characterized by dipolar character (state B), represented as the relaxed S1 state or as the charge transfer (CT) state in a previous report.46 However, in the present case, this state can be labelled as the fully relaxed mixed state of the Frenkel and CT excitons (FR state). The comparison of the time constants obtained from the global analysis in Tol, CHCl3, is summarized in Table 3. Clearly, the charge separated state is not energetically accessible via symmetry-breaking charge separation (SB-CS) in Tol or CHCl3, which is further evident from the absence of any spectral signature of PMI˙+ in these three solvents, and the Gibbs free energy calculations (ΔGCS = +0.46 eV and +0.11 eV in Tol and CHCl3, respectively). This also correlates well with the large fluorescence quantum yields in toluene (ΦFl = 75%) and CHCl3 (ΦFl = 64%). The absence of any distinct charge-separated radical cation and anion absorption bands for PMI in Tol and CHCl3 indicates that the SB-CS state lies energetically higher than the FR state in these solvents as shown in Fig. 6b and c. Interestingly, in the highly polar solvent DMF, the ESA band near 700 nm decays promptly at a longer delay time which was accompanied by a concomitant growth of a new band near 600 nm with a positive ΔOD. The evolution of a 590 nm band associated with an isosbestic point of 650 nm nearby indicates the formation of new transient species (PMI radical cation and anion, PMI˙+ and PMI˙−). The spectral evidence of the PMI˙+ species centred on one PMI monomer in the TA spectra substantiated the generation of the PMI˙− also in another identical PMI unit which showed a spectral signature at 640 nm.75,76 The formation of a radical cation/anion is corroborated by the chemical oxidation and spectroelectrochemistry studies (see the ESI†). However, due to the close-lying absorptions of PMI˙+ and PMI˙−, we observed a single broad ESA band. The presence of such a radical species is a clear indication of solvent-mediated SB-CS between the two PMI moieties in DMF.36,46 In DMF the energy level of the SB-CS state can be effectively stabilized by solvation, bringing it below the mixed FR state, from where the charge separation is energetically favorable. Because the FR state can relax via both radiative (fluorescence) and non-radiative (to the SB-CS state) relaxation pathways, a branching of the population of the FR state is expected. Additionally, the existence of an equilibrium mechanism allowing both forward and backward charge transfer processes would typically lead to an enhanced fluorescence lifetime and quantum yield of the FR state.46,72,77 However, it is important to note that such enhancements were not observed in the case of DMF because the SB-CS state is energetically much lower than the FR state, allowing for no back-transfer of the population. Therefore, based on the energetics, we infer that both the FR and SB-CS states are emissive and the emission from the SB-CS state results from radiative charge recombination. This justifies our choice of a kinetic model for SB-CS in DMF involving population branching leading to a dual fluorescence which, due to spectral overlap, exhibits a biexponential lifetime in the TCSPC measurements. To explain this, a global target analysis of the fs-TA data was performed. The species-associated difference spectra (SADS) obtained from the target analysis employing the kinetic scheme considered a branching of the population (Fig. 6d) using a kinetic model A → B↗GS↘
→GS) of 4.2 ns or 3.6 ns in toluene or CHCl3, respectively, which is in agreement with the fluorescence lifetimes (see Table S2†). A progressive red shift in the stimulated emission signal in the second EADS (blue) (Fig. 7e) indicated the emergence of a novel transient species characterized by dipolar character (state B), represented as the relaxed S1 state or as the charge transfer (CT) state in a previous report.46 However, in the present case, this state can be labelled as the fully relaxed mixed state of the Frenkel and CT excitons (FR state). The comparison of the time constants obtained from the global analysis in Tol, CHCl3, is summarized in Table 3. Clearly, the charge separated state is not energetically accessible via symmetry-breaking charge separation (SB-CS) in Tol or CHCl3, which is further evident from the absence of any spectral signature of PMI˙+ in these three solvents, and the Gibbs free energy calculations (ΔGCS = +0.46 eV and +0.11 eV in Tol and CHCl3, respectively). This also correlates well with the large fluorescence quantum yields in toluene (ΦFl = 75%) and CHCl3 (ΦFl = 64%). The absence of any distinct charge-separated radical cation and anion absorption bands for PMI in Tol and CHCl3 indicates that the SB-CS state lies energetically higher than the FR state in these solvents as shown in Fig. 6b and c. Interestingly, in the highly polar solvent DMF, the ESA band near 700 nm decays promptly at a longer delay time which was accompanied by a concomitant growth of a new band near 600 nm with a positive ΔOD. The evolution of a 590 nm band associated with an isosbestic point of 650 nm nearby indicates the formation of new transient species (PMI radical cation and anion, PMI˙+ and PMI˙−). The spectral evidence of the PMI˙+ species centred on one PMI monomer in the TA spectra substantiated the generation of the PMI˙− also in another identical PMI unit which showed a spectral signature at 640 nm.75,76 The formation of a radical cation/anion is corroborated by the chemical oxidation and spectroelectrochemistry studies (see the ESI†). However, due to the close-lying absorptions of PMI˙+ and PMI˙−, we observed a single broad ESA band. The presence of such a radical species is a clear indication of solvent-mediated SB-CS between the two PMI moieties in DMF.36,46 In DMF the energy level of the SB-CS state can be effectively stabilized by solvation, bringing it below the mixed FR state, from where the charge separation is energetically favorable. Because the FR state can relax via both radiative (fluorescence) and non-radiative (to the SB-CS state) relaxation pathways, a branching of the population of the FR state is expected. Additionally, the existence of an equilibrium mechanism allowing both forward and backward charge transfer processes would typically lead to an enhanced fluorescence lifetime and quantum yield of the FR state.46,72,77 However, it is important to note that such enhancements were not observed in the case of DMF because the SB-CS state is energetically much lower than the FR state, allowing for no back-transfer of the population. Therefore, based on the energetics, we infer that both the FR and SB-CS states are emissive and the emission from the SB-CS state results from radiative charge recombination. This justifies our choice of a kinetic model for SB-CS in DMF involving population branching leading to a dual fluorescence which, due to spectral overlap, exhibits a biexponential lifetime in the TCSPC measurements. To explain this, a global target analysis of the fs-TA data was performed. The species-associated difference spectra (SADS) obtained from the target analysis employing the kinetic scheme considered a branching of the population (Fig. 6d) using a kinetic model A → B↗GS↘![[C with combining right harpoon above (vector)]](https://www.rsc.org/images/entities/char_0043_20d1.gif) GS where state C is the SB-CS state. The corresponding SADS and population dynamics obtained from global fitting of the TA data in DMF are shown in Fig. 7c and f, respectively. Selected kinetic traces were superimposed on fitted curves at different wavelengths obtained from the global and target analysis, and these were chosen to display the fitting qualities shown in Fig. S45.† SADS 1 is ascribed to the FC state (state A), which evolves into a FR state (state B) as shown by SADS 2 in τ1 or τA→B = 0.21 ps. This state B further evolves into a fully charge-separated state or SB-CS state (state C) (PMI˙+–PMI˙−) via symmetry breaking as shown by SADS 3 with a time constant (τ2 or τB→C) of 80.2 ps. This SB-CS state (state C) obtained in a highly polar solvent undergoes radiative charge recombination to the GS with a lifetime component (τ3 or τC→GS) of 901 ps (the long lifetime of 901 ps of the SB-CS state is indicative of radiative decay which also explains the biexponential nature of the fluorescence lifetime of the dimer in DMF). The fluctuations in density observed in polar solvents are always accompanied by stochastic variations in the orientation of the solvent dipoles which may effectively disrupt the symmetrical nature of the dimeric system and lead to the emergence of a larger net dipole moment, thereby decreasing the energy level of the charge separation state. This phenomenon drives the relaxation of the FR towards the SB-CS state.78 The CT in the ortho-PMI dimer is governed predominantly by through-space coupling between the PMI chromophores and to some extent by through-bond coupling which is also evident from a negative (−0.004 Å) bond-length alternation (BLA) of a covalent phenyl linker (see the Computational section of the ESI†).
GS where state C is the SB-CS state. The corresponding SADS and population dynamics obtained from global fitting of the TA data in DMF are shown in Fig. 7c and f, respectively. Selected kinetic traces were superimposed on fitted curves at different wavelengths obtained from the global and target analysis, and these were chosen to display the fitting qualities shown in Fig. S45.† SADS 1 is ascribed to the FC state (state A), which evolves into a FR state (state B) as shown by SADS 2 in τ1 or τA→B = 0.21 ps. This state B further evolves into a fully charge-separated state or SB-CS state (state C) (PMI˙+–PMI˙−) via symmetry breaking as shown by SADS 3 with a time constant (τ2 or τB→C) of 80.2 ps. This SB-CS state (state C) obtained in a highly polar solvent undergoes radiative charge recombination to the GS with a lifetime component (τ3 or τC→GS) of 901 ps (the long lifetime of 901 ps of the SB-CS state is indicative of radiative decay which also explains the biexponential nature of the fluorescence lifetime of the dimer in DMF). The fluctuations in density observed in polar solvents are always accompanied by stochastic variations in the orientation of the solvent dipoles which may effectively disrupt the symmetrical nature of the dimeric system and lead to the emergence of a larger net dipole moment, thereby decreasing the energy level of the charge separation state. This phenomenon drives the relaxation of the FR towards the SB-CS state.78 The CT in the ortho-PMI dimer is governed predominantly by through-space coupling between the PMI chromophores and to some extent by through-bond coupling which is also evident from a negative (−0.004 Å) bond-length alternation (BLA) of a covalent phenyl linker (see the Computational section of the ESI†).
 |
| | Fig. 7 Plots of EADS and population kinetics of the ortho-PMI dimer (λex = 530 nm) in toluene (a, d), CHCl3 (b, e), and DMF (c, f), respectively. Black for LE, blue for CT and cyan for SB-CS. | |
For the self-coupled dimer, which forms a J-type dimer, photoexcitation at 550 nm directly excites the molecule to the hot vibrational energy levels of the singlet state, S1. The fs-TA spectral traces at the indicated probe wavelengths of different polarities are shown in Fig. 5c, f, and 5i, and a simplified kinetic scheme is proposed to explain the observed results (Fig. 8). A two-step sequential model, A → B → GS (similar to that used for the ortho-dimer in Tol, and CHCl3 as shown in Fig. 6b and c is used to extract the time constants of the corresponding excited-state processes that are shown in Table 3, and the corresponding EADS time-dependent concentration kinetics are shown in Fig. 8. Kinetics traces at several selected typical wavelengths are depicted in Fig. S46† and show the good quality of the fitting results. For Tol and CHCl3, the first time constant (τ1 or τA→B) corresponds to relaxation of the FC state (state A) to the FR state (state B) and a longer time scale corresponds to the decay of the FR state to the GS (τ2 or τB→GS), which is in agreement with the fluorescence lifetime from the FR state. The formation of the FR state (τ1 or τA→B) is found to be dependent on the polarity of the solvent (Table 3) and is significantly slower in the case of the self-coupled dimer (16.1 ps/1.64 ps) when compared to the ortho-dimer (2.13 ps/0.62 ps) in Tol/CHCl3, respectively. In the formation of the SB-CS state in toluene, and CHCl3 it is not evident which is also supported by the high fluorescence quantum yield of these dimers in these solvents (Tables 2 and 1) and these results are consistent with the fs-TA data.
 |
| | Fig. 8 Plots of EADS and population kinetics of the self-coupled dimer (λex = 550 nm) in toluene (a, d), CHCl3 (b, e), and DMF (c, f), respectively. | |
For the self-coupled dimer in DMF, a kinetic model including the population branching (similar to ortho-PMI dimer in DMF, Fig. 6d) is considered. A clear appearance of a new ESA band at 590 nm corresponded to the formation of PMI˙+ and the spectral signature of PMI˙− showed a positive absorption at 640 nm which overlapped with the ESA of the FC state (state A), and indicated SB-CS, as shown in Fig. 5i. The results for the obtained SADS are shown in Fig. 8c together with the population kinetics (Fig. 8f). The SB-CS formation rate in DMF, is found to be comparable for both the ortho-dimer kSB-CS = 0.0124 ps−1 and for the self-coupled dimer kSB-CS = 0.012 ps−1.
In the case of the meta-, para-PMI dimers and trimer, the excited state relaxation process varies differently with the change in the solvent polarity as shown in Fig. S42.† Fig. S47–S49† (ESI) shows the results of the global target analysis employing a similar kinetic model (Fig. 6) as used for the ortho-dimer and the self-coupled dimer, and for the meta-dimer, para-dimer and trimer in various solvents, and the corresponding relaxation time constants are summarized in Table 3. Kinetic traces at selected wavelengths are shown in Fig. S50–S52† and show the quality of fit. In toluene and CHCl3, the results can be rationalized in a similar way as for the ortho- and self-coupled dimers. The two major processes participating in excited state relaxation in Tol, CHCl3 are relaxation of the FC (state A) to the FR (state B) followed by the decay of the FR state to the GS. A comparison of solvent-dependent relaxation kinetics of these dimers shows a slower relaxation of the equilibrated state to the GS for the meta-PMI dimer when compared to para-PMI dimer and trimer in Tol and CHCl3, which is also in agreement with the observed fluorescence lifetimes (Table S2†). In a higher polarity solvent, DMF, it was clear that for the trimer, the initial SADS 1 is dominated by a strong artifact which is ascribed to the FC state (state A) as shown in Fig. S49c (ESI).† This state further evolves to a FR state (state B) as shown by SADS 2 and finally into a SB-CS state (state C) as shown by SADS 3 with a time constant (τ2 or τB→C) of 3.92 ps. This is further evident from the diminished negative SE band and a positive ESA band in the region from 590 nm to 630 nm. However, the SADS obtained for the meta-dimer and para-dimer (Fig. S47c and 48c†) did not show any such switching of ΔOD (SE to ESA). These findings suggest the presence of a different predominant non-radiative relaxation mechanism in these two dimers (which may be attributed to solvent fluctuations, and conformational relaxation77), effectively decreasing the degree of coupling between the FC and CT states necessary for SB-CS78 and also leading to a decrease in the fluorescence lifetime.
However, it should be noted that the absence of a characteristic spectrum for PMI˙− or PMI˙+ in SADS for the meta- and para-dimers may arise due to the masking of this band because of the overlapping spectral features. To verify this, we analyzed the kinetic traces at 590 nm (where the characteristic spectral feature of PMI˙+ for the ortho-dimer, self-coupled dimer and trimer appears) (Fig. S53†); the corresponding fitting parameters are summarized in Table S8†. A somewhat similar analysis was employed recently in a different context, where the kinetics of the ESA bands' intensity ratios were compared to verify the formation of a TIPS-pentacene cation in the TIPS-pentacene/MAPbI3 perovskite bilayer film.79 A comparison between the kinetics in toluene and DMF shows that a negative (GSB/SE) to a positive (ESA) ΔOD upon changing the solvent from Tol to DMF is present only for ortho-, self-coupled dimers and trimer but not for the meta or para dimers, which is suggestive of a less efficient SB-CS in these two dimers. This observation is also consistent with the theoretical prediction of a relatively less (when compared with the ortho dimer) extent of coupling between the Frenkel and CT states in these two dimers. However, the observation of fluorescence quenching and biexponential fluorescence kinetics in DMF for the meta and para dimers and the fast rate of relaxation of the FR state (90 ps) for para-dimer (comparable with that for the ortho- and self-coupled dimers, which is about 80 ps), hints that the presence of SB-CS in these two dimers cannot be completely ruled out.
Thermodynamic feasibility of charge separation
The fs-TAS studies unravel a symmetry-breaking charge separation for the ortho- and self-coupled dimer in DMF which is less prominent for the trimer derivative. The formation of radical pairs via SB-CS is established by chemical oxidation using SbCl5 and spectroelectrochemical reduction, as given in Fig. S54 and S55.† The thermodynamic feasibility of such charge separation process can be explicated from the Gibbs free energy change (ΔGCS) during the charge separation which can be determined from the well-known Rehm–Weller equation (eqn (8)):| |  | (8) |
where, EOX and ERED denote the first oxidation and reduction potential of the donor PMI and acceptor PMI units, respectively, in dimers/trimer; E0,0 is the energy of the first excited state of the compound which can be estimated from the intercrossing point of the normalized absorption and emission spectra. The parameters dDA, rA, and rD are calculated from the ground state geometry of the dimer derivatives optimized by DFT at the B3LYP/6-31+g(d,p) level of theory. The rD and rA illustrate the effective radius of the donor radical cation and acceptor radical anion, respectively. The εRef and εS are the dielectric constant of the reference solvent used in the electrochemical measurement and the particular solvent used for the determination of the CS. Here, the electrochemical measurements were performed in anhydrous dichloromethane (DCM).
We have estimated the ΔGCS for two dimers showing SB-CS in DMF by considering the EOX and ERED values from the cyclic voltammetry plots (Fig. S56†) and the previously mentioned parameters in eqn (8). The data in Table 4 shows that ΔGCS is negative (ΔGCS < 0) in polar DMF but it is expressed as ΔGCS > 0 in weakly-polar and medium-polar solvents. These values show that the charge separation is thermodynamically favorable in a polar solvent but is not feasible in weakly-polar solvents. For other dimers, a negative ΔGCS in DMF is also obtained (−0.14 eV and −0.09 eV for meta- and para-PMI dimers respectively) as shown in Table S9†, indicating the possibility of a partial charge transfer in DMF. Furthermore, the self-energy correction (ΔCT) for the meta-dimer cannot be neglected. The ΔCT = −145 cm−1 indicates that there is an existing coupling between the local and charge-separated excitons (Table 2). Therefore, it is feasible that a partial charge transfer will be manifested in the meta-dimer. In certain circumstances, however, a decrease in CT-mediated coupling is made possible by an increase in spatial separation and is largely reliant on the monomer's LUMO and HOMO nodal patterns. Additionally, the CT integrals show no change in the monomer's orientation, which is a crucial solvent-related feature (Fig. S37†). A schematic illustration of SB-CS occurring here is shown in Fig. S57.†
Table 4 The Gibbs free energies determined for the charge separation of two dimers in three different solvents
| Compound |
Solvent |
E
ox/V |
E
Red/V |
E
0,0/eV |
r
D or rA/Å |
d
DA/Å |
ΔGCS (eV) |
|
ortho-Dimer |
Tol |
1.43 |
−0.92 |
2.28 |
4.75 |
11.1 |
+0.46 |
| CHCl3 |
1.43 |
−0.92 |
2.26 |
4.75 |
11.1 |
+0.11 |
| DMF |
1.43 |
−0.92 |
2.25 |
4.75 |
11.1 |
−0.19 |
| Self-coupled dimer |
Tol |
1.36 |
−1.02 |
2.18 |
4.75 |
14.1 |
+0.70 |
| CHCl3 |
1.36 |
−1.02 |
2.18 |
4.75 |
14.1 |
+0.28 |
| DMF |
1.36 |
−1.02 |
2.17 |
4.75 |
14.1 |
−0.08 |
Further discussion
In summary, the excited state relaxation mechanism for the ortho-dimer and the self-coupled dimer, when considered alongside the previously mentioned outcomes, can be described as illustrated in Fig. 6. In a weakly polar solvent like Tol and the medium polar solvent CHCl3, the relaxation occurs via an initial relaxation of the FC state to the FR state followed by decay to the GS. In contrast, in the highly polar DMF, the solvent fluctuation leads to stabilization of the SB-CS state with a clear observation of a radical cation and the anion peaks, which were not so prominent for the meta-, para-dimer and trimer. The distinctly different excited-state dynamics of all the dimers are mainly attributed to the different molecular geometries. In both the ortho- and self-coupled dimer, the rate of charge recombination is obtained much slower than the rate of charge separation [for the ortho-dimer, kCR = (901 ps)−1 whereas kSB-CS = (80.2 ps)−1] in DMF which is quite an exothermic process due to the prevailing Marcus inverted region,16 and is also evident from the negative ΔGCS in DMF (Tables 3 and 4). The branching ratio for the FR state population decayed into the radiative channel and the SB-CS state can be attained by considering the relative rates: 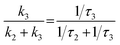 . This estimate shows that ∼95% of the population branches into the SB-CS channel in the ortho-dimer whereas it is ∼80% for the self-coupled dimer. It should be noted that the SB-CS state may undergo a further additional deactivation pathway, which involves the recombination of the charge-separated state to populate the triplet state, thus lowering the possibility of the crucially important long-lived charge separation, essential for the photovoltaic application.3,80 However, in the present study, the lack of any long-lived component and any distinctive features for the 3PMI state in the TA spectra of dimers and trimer suggests the absence of any triplet state formation.44,47 A summary of charge separation and charge recombination time constants (τ) of PDI and PMI-based multichromophoric systems has been provided in Table S10†.
Conclusions
To summarize, we have presented here a design strategy to construct a series of covalently linked alkyne-bridged PMI-based multichromophores and thoroughly investigated the impact of positional isomerism on the SB-CS phenomenon. Steady-state spectroscopic measurements showed a considerable red shift in the emission spectra when the solvent polarity was increased. In highly polar DMF, a huge decrease in fluorescence QY and alteration of fluorescence lifetime indicates the possibility of charge separation and further stabilization of the charge-separated state. Ultrafast charge separation and charge recombination in DMF for the ortho- and self-coupled dimers in this series were established using a femtosecond transient absorption study. For other dimers, the relaxation of the excited state occurs via structural relaxation and the trimer was found to show some reminiscent of SB-CS. The underlying difference in the relaxation mechanism was evident from the femtosecond transient studies, which arose principally from the difference in the interchromophore coupling among the PMI units in different regioisomers. The twisted conformation is responsible for making a weakly coupled system which becomes favorable for SB-CS. Additionally, the theoretical studies provide strong evidence for predominant charge transfer characteristics between two identical chromophores in the ortho-PMI dimer rather than the meta- and para-congeners which is attributed mostly to the through-space coupling and some extent to the through-bond coupling between two PMI units. The two isomers exhibiting high thermal and chemical stability, large synthetic scalability and more importantly, notable charge separation characteristics can be exploited as potential candidates for their application in modern organic photovoltaics.
Data availability
The data can be avilable upon request from the corresponding author.
Author contributions
RR synthesized all the compounds, purified them, and characterized them by HRMS and NMR spectroscopic techniques. RR also performed steady-state UV-Vis absorption, fluorescence, and TCSPC for lifetime and electrochemical measurements. SC and YS performed all the femtosecond transient absorption measurements and their analysis was supervised by AKD. VS designed the synthesis of the molecules used in this project and optimized the synthetic protocols. The theoretical calculations were performed by AKP. The initial draft of the manuscript was made by RR, SC, AKP, and YS. The final draft of the manuscript was revised by AD, AKD and ALK after receiving data from the other authors. Analysis and interpretation of data were done by all the authors. All the authors have approved the final version of the manuscript.
Conflicts of interest
There are no conflicts to declare.
Acknowledgements
RR and VS acknowledge IISER Bhopal and CSIR, respectively, for their doctoral fellowships. SC and YS both acknowledge IISER Mohali for their doctoral fellowships. AKP sincerely acknowledges Technical Research Center (TRC) in IACS Kolkata for the Research Associate fellowship. RR and ALK convey thanks to the Central Instrumental Facility in IISER Bhopal. ALK thanks IISER Bhopal for the research funding. AKD acknowledges SERB, DST (CRG/2021/003981) and IISER Mohali for funding. AD thanks SERB (CRG/2020/000301) for financial support.
Notes and references
- E. Vauthey, ChemPhysChem, 2012, 13, 2001–2011 CrossRef CAS PubMed.
- A. N. Bartynski, M. Gruber, S. Das, S. Rangan, S. Mollinger, C. Trinh, S. E. Bradforth, K. Vandewal, A. Salleo, R. A. Bartynski, W. Bruetting and M. E. Thompson, J. Am. Chem. Soc., 2015, 137, 5397–5405 CrossRef CAS PubMed.
- E. Sebastian and M. Hariharan, ACS Energy Lett., 2022, 7, 696–711 CrossRef CAS.
- M. Kellogg, A. Akil, D. S. Muthiah Ravinson, L. Estergreen, S. E. Bradforth and M. E. Thompson, Faraday Discuss., 2019, 216, 379–394 RSC.
- A. I. Ivanov, B. Dereka and E. Vauthey, J. Chem. Phys., 2017, 146, 164306 CrossRef PubMed.
- A. Aster, G. Licari, F. Zinna, E. Brun, T. Kumpulainen, E. Tajkhorshid, J. Lacour and E. Vauthey, Chem. Sci., 2019, 10, 10629–10639 RSC.
- M. Söderberg, B. Dereka, A. Marrocchi, B. Carlotti and E. Vauthey, J. Phys. Chem. Lett., 2019, 10, 2944–2948 CrossRef PubMed.
- W. Kim, T. Kim, S. Kang, Y. Hong, F. Würthner and D. Kim, Angew. Chem., Int. Ed., 2020, 59, 8571–8578 CrossRef CAS PubMed.
- B. Dereka, D. Svechkarev, A. Rosspeintner, A. Aster, M. Lunzer, R. Liska, A. M. Mohs and E. Vauthey, Nat. Commun., 2020, 11, 1925 CrossRef CAS PubMed.
- C. Lee, C. H. Choi and T. Joo, Phys. Chem. Chem. Phys., 2020, 22, 1115–1121 RSC.
- P. D. Laible, D. K. Hanson, J. C. Buhrmaster, G. A. Tira, K. M. Faries, D. Holten and C. Kirmaier, Proc. Natl. Acad. Sci. U.S.A., 2020, 117, 865–871 CrossRef CAS PubMed.
- J. H. Golden, L. Estergreen, T. Porter, A. C. Tadle, D. Sylvinson, M. R, J. W. Facendola, C. P. Kubiak, S. E. Bradforth and M. E. Thompson, ACS Appl. Energy Mater., 2018, 1, 1083–1095 CrossRef CAS.
- R. M. Young and M. R. Wasielewski, Acc. Chem. Res., 2020, 53, 1957–1968 CrossRef CAS PubMed.
- Y. Hong, F. Schlosser, W. Kim, F. Würthner and D. Kim, J. Am. Chem. Soc., 2022, 144, 15539–15548 CrossRef CAS PubMed.
- K. Wang, G. Shao, S. Peng, X. You, X. Chen, J. Xu, H. Huang, H. Wang, D. Wu and J. Xia, J. Phys. Chem. B, 2022, 126, 3758–3767 CrossRef CAS PubMed.
- C. Lin, T. Kim, J. D. Schultz, R. M. Young and M. R. Wasielewski, Nat. Chem., 2022, 14, 786–793 CrossRef CAS PubMed.
- F. C. Grozema, M. Swart, R. W. J. Zijlstra, J. J. Piet, L. D. A. Siebbeles and P. T. van Duijnen, J. Am. Chem. Soc., 2005, 127, 11019–11028 CrossRef CAS PubMed.
- T. Takaya, S. Saha, H.-o. Hamaguchi, M. Sarkar, A. Samanta and K. Iwata, J. Phys. Chem. A, 2006, 110, 4291–4295 CrossRef CAS PubMed.
- Y. Liu, J. Zhao, A. Iagatti, L. Bussotti, P. Foggi, E. Castellucci, M. Di Donato and K.-L. Han, J. Phys. Chem. C, 2018, 122, 2502–2511 CrossRef CAS.
- M. T. Whited, N. M. Patel, S. T. Roberts, K. Allen, P. I. Djurovich, S. E. Bradforth and M. E. Thompson, Chem. Commun., 2012, 48, 284–286 RSC.
- V. Markovic, D. Villamaina, I. Barabanov, L. M. Lawson Daku and E. Vauthey, Angew. Chem., Int. Ed., 2011, 50, 7596–7598 CrossRef CAS PubMed.
- R. E. Cook, B. T. Phelan, R. J. Kamire, M. B. Majewski, R. M. Young and M. R. Wasielewski, J. Phys. Chem. A, 2017, 121, 1607–1615 CrossRef CAS PubMed.
- G. Ran, J. Zeb, Y. Song, P. A. Denis, U. Ghani and W. Zhang, J. Phys. Chem. C, 2022, 126, 3872–3880 CrossRef CAS.
- N. E. Powers-Riggs, X. Zuo, R. M. Young and M. R. Wasielewski, J. Am. Chem. Soc., 2019, 141, 17512–17516 CrossRef CAS PubMed.
- C. Trinh, K. Kirlikovali, S. Das, M. E. Ener, H. B. Gray, P. Djurovich, S. E. Bradforth and M. E. Thompson, J. Phys. Chem. C, 2014, 118, 21834–21845 CrossRef CAS PubMed.
- Z. Mahmood, N. Rehmat, S. Ji, J. Zhao, S. Sun, M. Di Donato, M. Li, M. Teddei and Y. Huo, Chem. - Eur. J., 2020, 26, 14912–14918 CrossRef CAS PubMed.
- T. Kim, J. Kim, H. Mori, S. Park, M. Lim, A. Osuka and D. Kim, Phys. Chem. Chem. Phys., 2017, 19, 13970–13977 RSC.
- M. Cacioppo, T. Scharl, L. Đorđević, A. Cadranel, F. Arcudi, D. M. Guldi and M. Prato, Angew. Chem., Int. Ed., 2020, 59, 12779–12784 CrossRef CAS PubMed.
- P. Roy, G. Bressan, J. Gretton, A. N. Cammidge and S. R. Meech, Angew. Chem., Int. Ed., 2021, 60, 10568–10572 CrossRef CAS PubMed.
- B. Dereka, A. Rosspeintner, Z. Li, R. Liska and E. Vauthey, J. Am. Chem. Soc., 2016, 138, 4643–4649 CrossRef CAS PubMed.
- I. Papadopoulos, M. J. Álvaro-Martins, D. Molina, P. M. McCosker, P. A. Keller, T. Clark, Á. Sastre-Santos and D. M. Guldi, Adv. Energy Mater., 2020, 10, 2001496 CrossRef CAS.
- J. S. Beckwith, A. Rosspeintner, G. Licari, M. Lunzer, B. Holzer, J. Fröhlich and E. Vauthey, J. Phys. Chem. Lett., 2017, 8, 5878–5883 CrossRef CAS PubMed.
- B. Dereka, A. Rosspeintner, R. Stężycki, C. Ruckebusch, D. T. Gryko and E. Vauthey, J. Phys. Chem. Lett., 2017, 8, 6029–6034 CrossRef CAS PubMed.
- X. Niu, Z. Kuang, M. Planells, Y. Guo, N. Robertson and A. Xia, Phys. Chem. Chem. Phys., 2020, 22, 15743–15750 RSC.
- P. Su, H. Liu, L. Shen, J. Zhou, W. Wang, S. Liu, X. Nie, Z. Li, Z. Liu, Y. Chen and X. Li, Mater. Chem.
Front., 2022, 6, 707–717 RSC.
- E. Sebastian and M. Hariharan, J. Am. Chem. Soc., 2021, 143, 13769–13781 CrossRef CAS PubMed.
- V. Sharma, J. D. B. Koenig and G. C. Welch, J. Mater. Chem. A, 2021, 9, 6775–6789 RSC.
- F. Würthner, C. R. Saha-Möller, B. Fimmel, S. Ogi, P. Leowanawat and D. Schmidt, Chem. Rev., 2016, 116, 962–1052 CrossRef PubMed.
- R. Roy, N. R. Sajeev, V. Sharma and A. L. Koner, ACS Appl. Mater. Interfaces, 2019, 11, 47207–47217 CrossRef CAS PubMed.
- O. Chatterjee, R. Roy, A. Pramanik, T. Dutta, V. Sharma, P. Sarkar and A. L. Koner, Adv. Opt. Mater., 2022, 10, 2201187 CrossRef CAS.
- C. Li and H. Wonneberger, Adv. Mater., 2012, 24, 613–636 CrossRef CAS PubMed.
- N. Zink-Lorre, S. Seetharaman, D. Gutiérrez-Moreno, F. Fernández-Lázaro, P. A. Karr and F. D'Souza, Chem. - Eur. J., 2021, 27, 14996–15005 CrossRef CAS PubMed.
- V. Piradi, Y. Gao, F. Yan, M. Imran, J. Zhao, X. Zhu and S. K. So, ACS Appl. Energy Mater., 2022, 5, 7287–7296 CrossRef CAS.
- Y. Wu, R. M. Young, M. Frasconi, S. T. Schneebeli, P. Spenst, D. M. Gardner, K. E. Brown, F. Würthner, J. F. Stoddart and M. R. Wasielewski, J. Am. Chem. Soc., 2015, 137, 13236–13239 CrossRef CAS PubMed.
- J. Sung, A. Nowak-Król, F. Schlosser, B. Fimmel, W. Kim, D. Kim and F. Würthner, J. Am. Chem. Soc., 2016, 138, 9029–9032 CrossRef CAS PubMed.
- J. Kong, W. Zhang, G. Li, D. Huo, Y. Guo, X. Niu, Y. Wan, B. Tang and A. Xia, J. Phys. Chem. Lett., 2020, 11, 10329–10339 CrossRef CAS PubMed.
- Y. Guo, Z. Ma, X. Niu, W. Zhang, M. Tao, Q. Guo, Z. Wang and A. Xia, J. Am. Chem. Soc., 2019, 141, 12789–12796 CrossRef CAS PubMed.
- E. Sebastian, J. Sunny and M. Hariharan, Chem. Sci., 2022, 13, 10824–10835 RSC.
- E. Sebastian and M. Hariharan, Angew. Chem., Int. Ed., 2023, 62, e202216482 CrossRef CAS PubMed.
- H. Khandelwal, A. R. Mallia, R. T. Cheriya and M. Hariharan, Phys. Chem. Chem. Phys., 2012, 14, 15282–15285 RSC.
- H. Song, H. Zhao, Y. Guo, A. M. Philip, Q. Guo, M. Hariharan and A. Xia, J. Phys. Chem. C, 2020, 124, 237–245 CrossRef CAS.
- N. Kapuria, V. Sharma, P. Kumar and A. L. Koner, J. Mater. Chem. C, 2018, 6, 11328–11335 RSC.
- A. Dannenhoffer, H. Sai, D. Huang, B. Nagasing, B. Harutyunyan, D. J. Fairfield, T. Aytun, S. M. Chin, M. J. Bedzyk, M. Olvera de la Cruz and S. I. Stupp, Chem. Sci., 2019, 10, 5779–5786 RSC.
- R. Roy, A. Khan, O. Chatterjee, S. Bhunia and A. L. Koner, Org. Mater., 2021, 3, 417–454 CrossRef CAS.
- R. Roy, A. Khan, T. Dutta and A. L. Koner, J. Mater. Chem. B, 2022, 10, 5352–5363 RSC.
- J. Warnan, J. Willkomm, Y. Farré, Y. Pellegrin, M. Boujtita, F. Odobel and E. Reisner, Chem. Sci., 2019, 10, 2758–2766 RSC.
- N. J. Hestand and F. C. Spano, Chem. Rev., 2018, 118, 7069–7163 CrossRef CAS PubMed.
- L. Estergreen, A. R. Mencke, D. E. Cotton, N. V. Korovina, J. Michl, S. T. Roberts, M. E. Thompson and S. E. Bradforth, Acc. Chem. Res., 2022, 55, 1561–1572 CrossRef CAS PubMed.
- V. Sharma, D. Sahoo, F. Chandra and A. L. Koner, ChemistrySelect, 2017, 2, 11747–11754 CrossRef CAS.
- P. J. Brown, M. L. Williams, S. Nakamura, J. R. Palmer, R. M. Young and M. R. Wasielewski, J. Phys. Chem. C, 2024, 128, 58–66 CrossRef CAS.
- R. Komskis, P. Adomėnas, O. Adomėnienė, P. Baronas, T. Serevičius and S. Juršėnas, J. Phys. Chem. C, 2019, 123, 27344–27354 CrossRef CAS.
- W. Zhang, J. Kong, D. Hu, M. Tao, X. Niu, S. Vdović, D. Aumiler, Y. Ma and A. Xia, J. Phys. Chem. C, 2020, 124, 5574–5582 CrossRef CAS.
- M. E. Madjet, A. Abdurahman and T. Renger, J. Phys. Chem. B, 2006, 110, 17268–17281 CrossRef CAS PubMed.
- M. Kasha, Discuss. Faraday Soc., 1950, 9, 14–19 RSC.
- N. J. Hestand, H. Yamagata, B. Xu, D. Sun, Y. Zhong, A. R. Harutyunyan, G. Chen, H.-L. Dai, Y. Rao and F. C. Spano, J. Phys. Chem. C, 2015, 119, 22137–22147 CrossRef CAS.
- C. Zhong, D. Bialas and F. C. Spano, J. Phys. Chem. C, 2020, 124, 2146–2159 CrossRef CAS.
- B. Engels and V. Engel, Phys. Chem. Chem. Phys., 2017, 19, 12604–12619 RSC.
- N. J. Hestand and F. C. Spano, Acc. Chem. Res., 2017, 50, 341–350 CrossRef CAS PubMed.
- A. Benny, R. Ramakrishnan and M. Hariharan, Chem. Sci., 2021, 12, 5064–5072 RSC.
- D. Bansal, A. Kundu, V. P. Singh, A. K. Pal, A. Datta, J. Dasgupta and P. Mukhopadhyay, Chem. Sci., 2022, 13, 11506–11512 RSC.
- C. Qin, Z. Zhang, Q. Xu, J. Song, Z. Jiao, S. Ma, R. Qin and Y. Jiang, J. Phys. Chem. Lett., 2023, 14, 2455–2462 CrossRef CAS PubMed.
- A. F. Coleman, M. Chen, J. Zhou, J. Y. Shin, Y. Wu, R. M. Young and M. R. Wasielewski, J. Phys. Chem. C, 2020, 124, 10408–10419 CrossRef CAS.
- Y. Silori, S. Chawla and A. K. De, ChemPhysChem, 2020, 21, 1908–1917 CrossRef CAS PubMed.
- K. Rani, S. Chawla, V. Kumari, A. K. De and S. Sengupta, J. Mater. Chem. C, 2022, 10, 10551–10561 RSC.
- K. M. Lefler, D. T. Co and M. R. Wasielewski, J. Phys. Chem. Lett., 2012, 3, 3798–3805 CrossRef CAS PubMed.
- R. T. Cheriya, A. R. Mallia and M. Hariharan, Energy Environ. Sci., 2014, 7, 1661–1669 RSC.
- J. M. Alzola, N. A. Tcyrulnikov, P. J. Brown, T. J. Marks, M. R. Wasielewski and R. M. Young, J. Phys. Chem. A, 2021, 125, 7633–7643 CrossRef CAS PubMed.
- J. J. Piet, W. Schuddeboom, B. R. Wegewijs, F. C. Grozema and J. M. Warman, J. Am. Chem. Soc., 2001, 123, 5337–5347 CrossRef CAS PubMed.
- S. Lee, D. Hwang, S. I. Jung and D. Kim, J. Phys. Chem. Lett., 2017, 8, 884–888 CrossRef CAS PubMed.
- A. J. Gillett, A. Privitera, R. Dilmurat, A. Karki, D. Qian, A. Pershin, G. Londi, W. K. Myers, J. Lee, J. Yuan, S.-J. Ko, M. K. Riede, F. Gao, G. C. Bazan, A. Rao, T.-Q. Nguyen, D. Beljonne and R. H. Friend, Nature, 2021, 597, 666–671 CrossRef CAS PubMed.
Footnotes |
| † Electronic supplementary information (ESI) available: Synthesis procedure, theoretical calculations, steady-state spectroscopy, transient absorption study, electrochemical study. See DOI: https://doi.org/10.1039/d3sc05325c |
| ‡ These authors contributed equally to this work. |
|
| This journal is © The Royal Society of Chemistry 2024 |
Click here to see how this site uses Cookies. View our privacy policy here. 
 Open Access Article
 This Open Access Article is licensed under a Creative Commons Attribution-Non Commercial 3.0 Unported Licence
 c,
Yogita
Silori
bd,
Ayan
Datta
c,
Yogita
Silori
bd,
Ayan
Datta

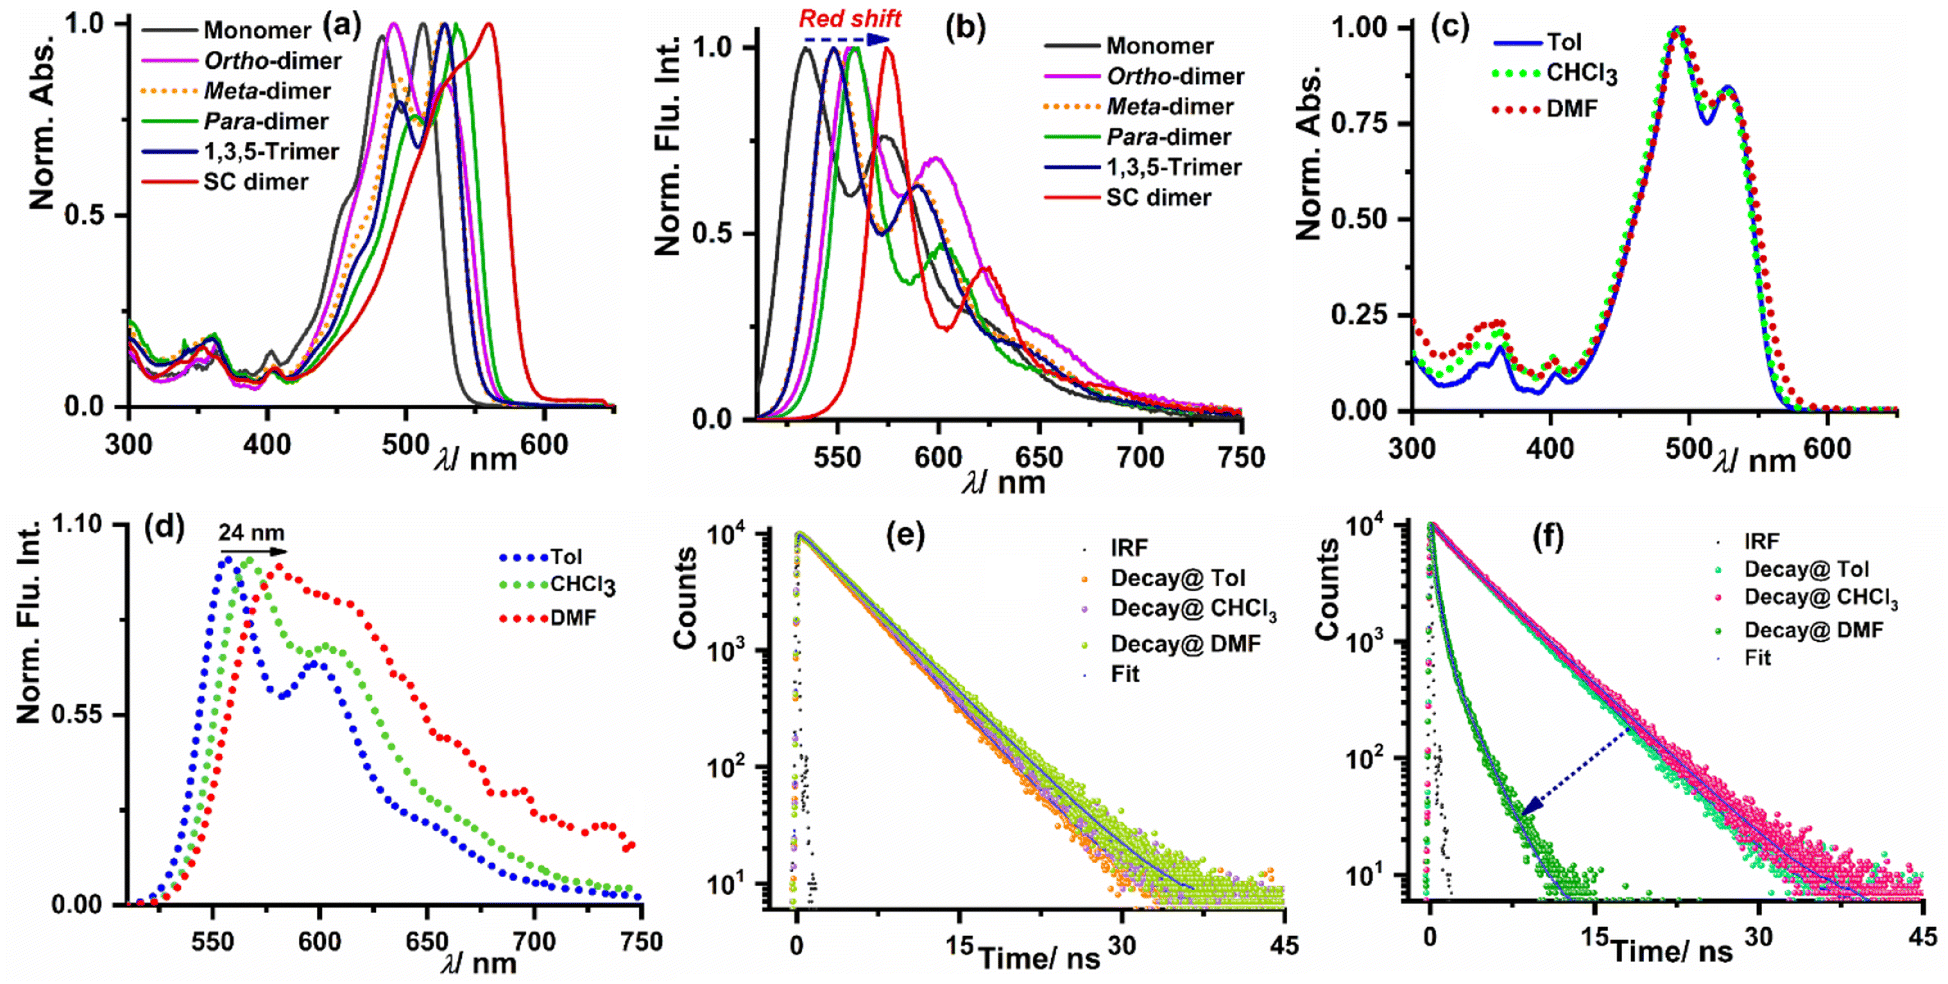

 which refers to the displacement vectors with respect to the centre of mass during an electronic transition. The calculated values for the three dimers are listed in Table 2. In the Kasha-like aggregation, the predominant nature of the coulombic coupling arises due to the large S1 ← S0 transition electric dipole moment (TEDM).64 The TEDM values of ortho-, meta- and para-PMI dimers are 5.61, 6.38 and 7.96 au, respectively, (see Table S3†). Therefore, the order of the JCoul values should be JCoulpara− > JCoulmeta− > JCoulortho−. However, the order is reversed in the present case: JCoulpara− < JCoulmeta− < JCoulortho−. Therefore, the aggregation behavior based on the Kasha rule is unconventional here. This framework can be explained by considering the hole (th) and the electron (te) transfer integrals that allow the mixing of the Frenkel and CT excitons as previously demonstrated by Hestand et al. with oligoacenes65 and later on by Zhong et al. with donor–acceptor chromophores.66 In the excitonic coupling limit, the energy of the symmetric (S) and antisymmetric (AS) band is calculated by:
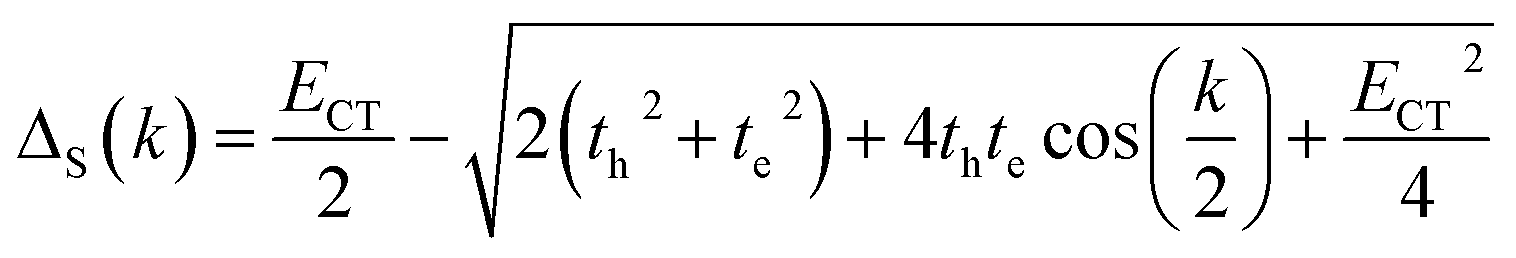

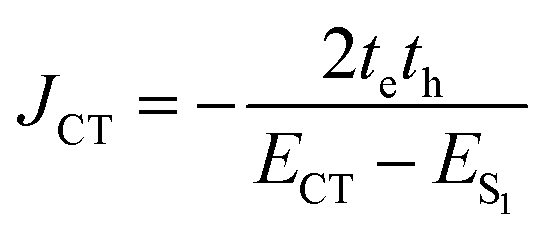
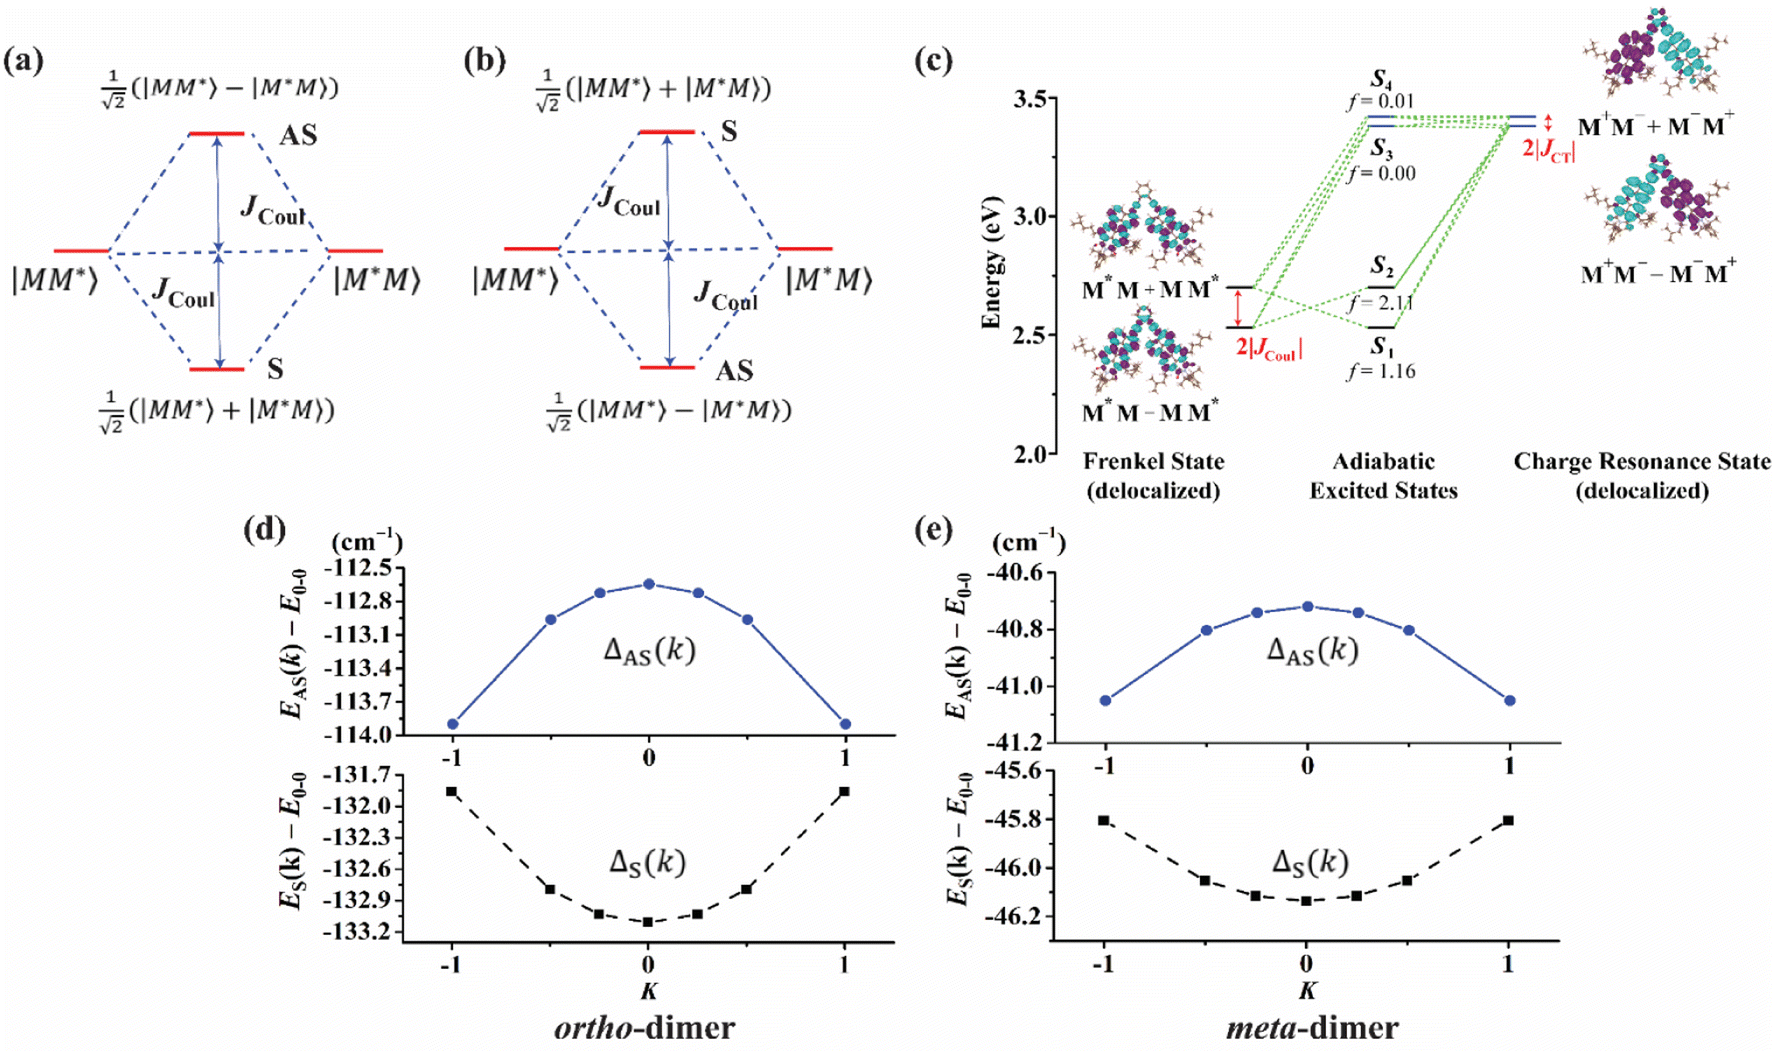
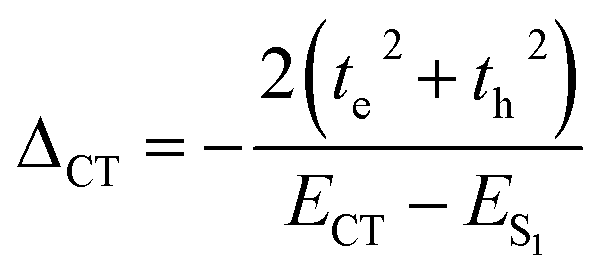
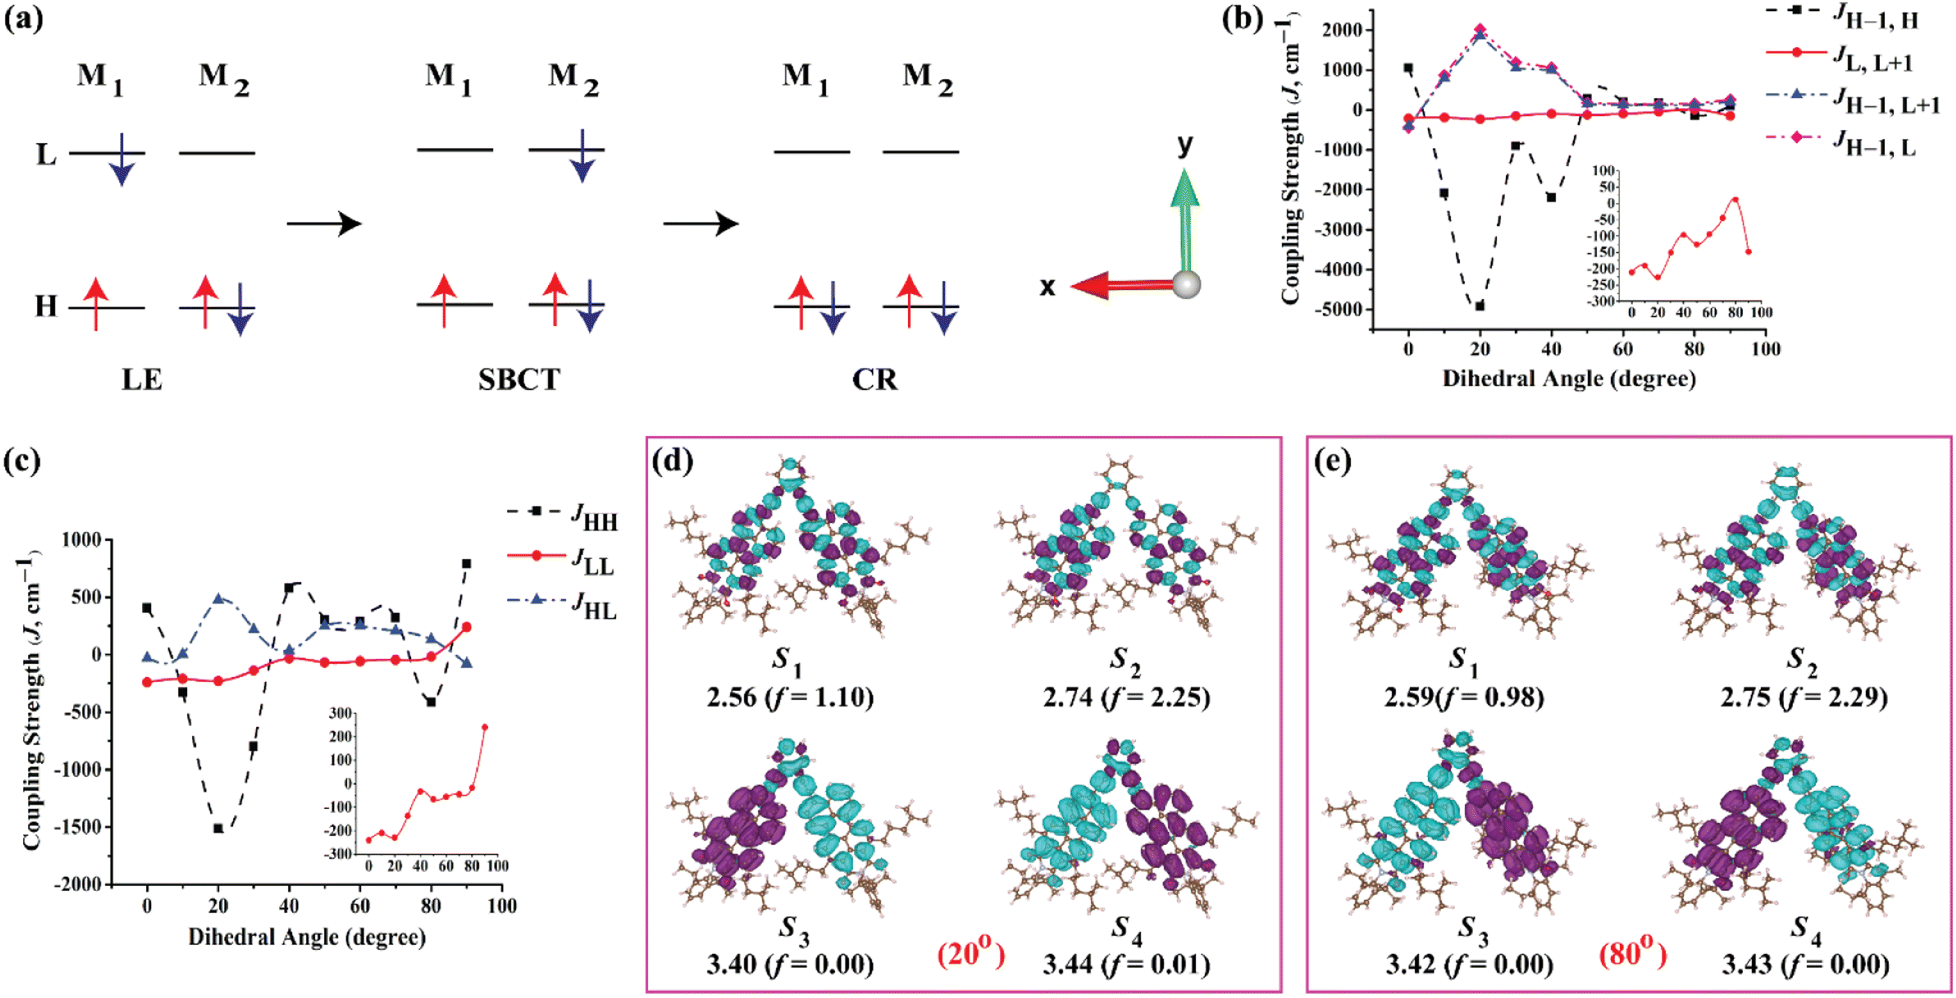
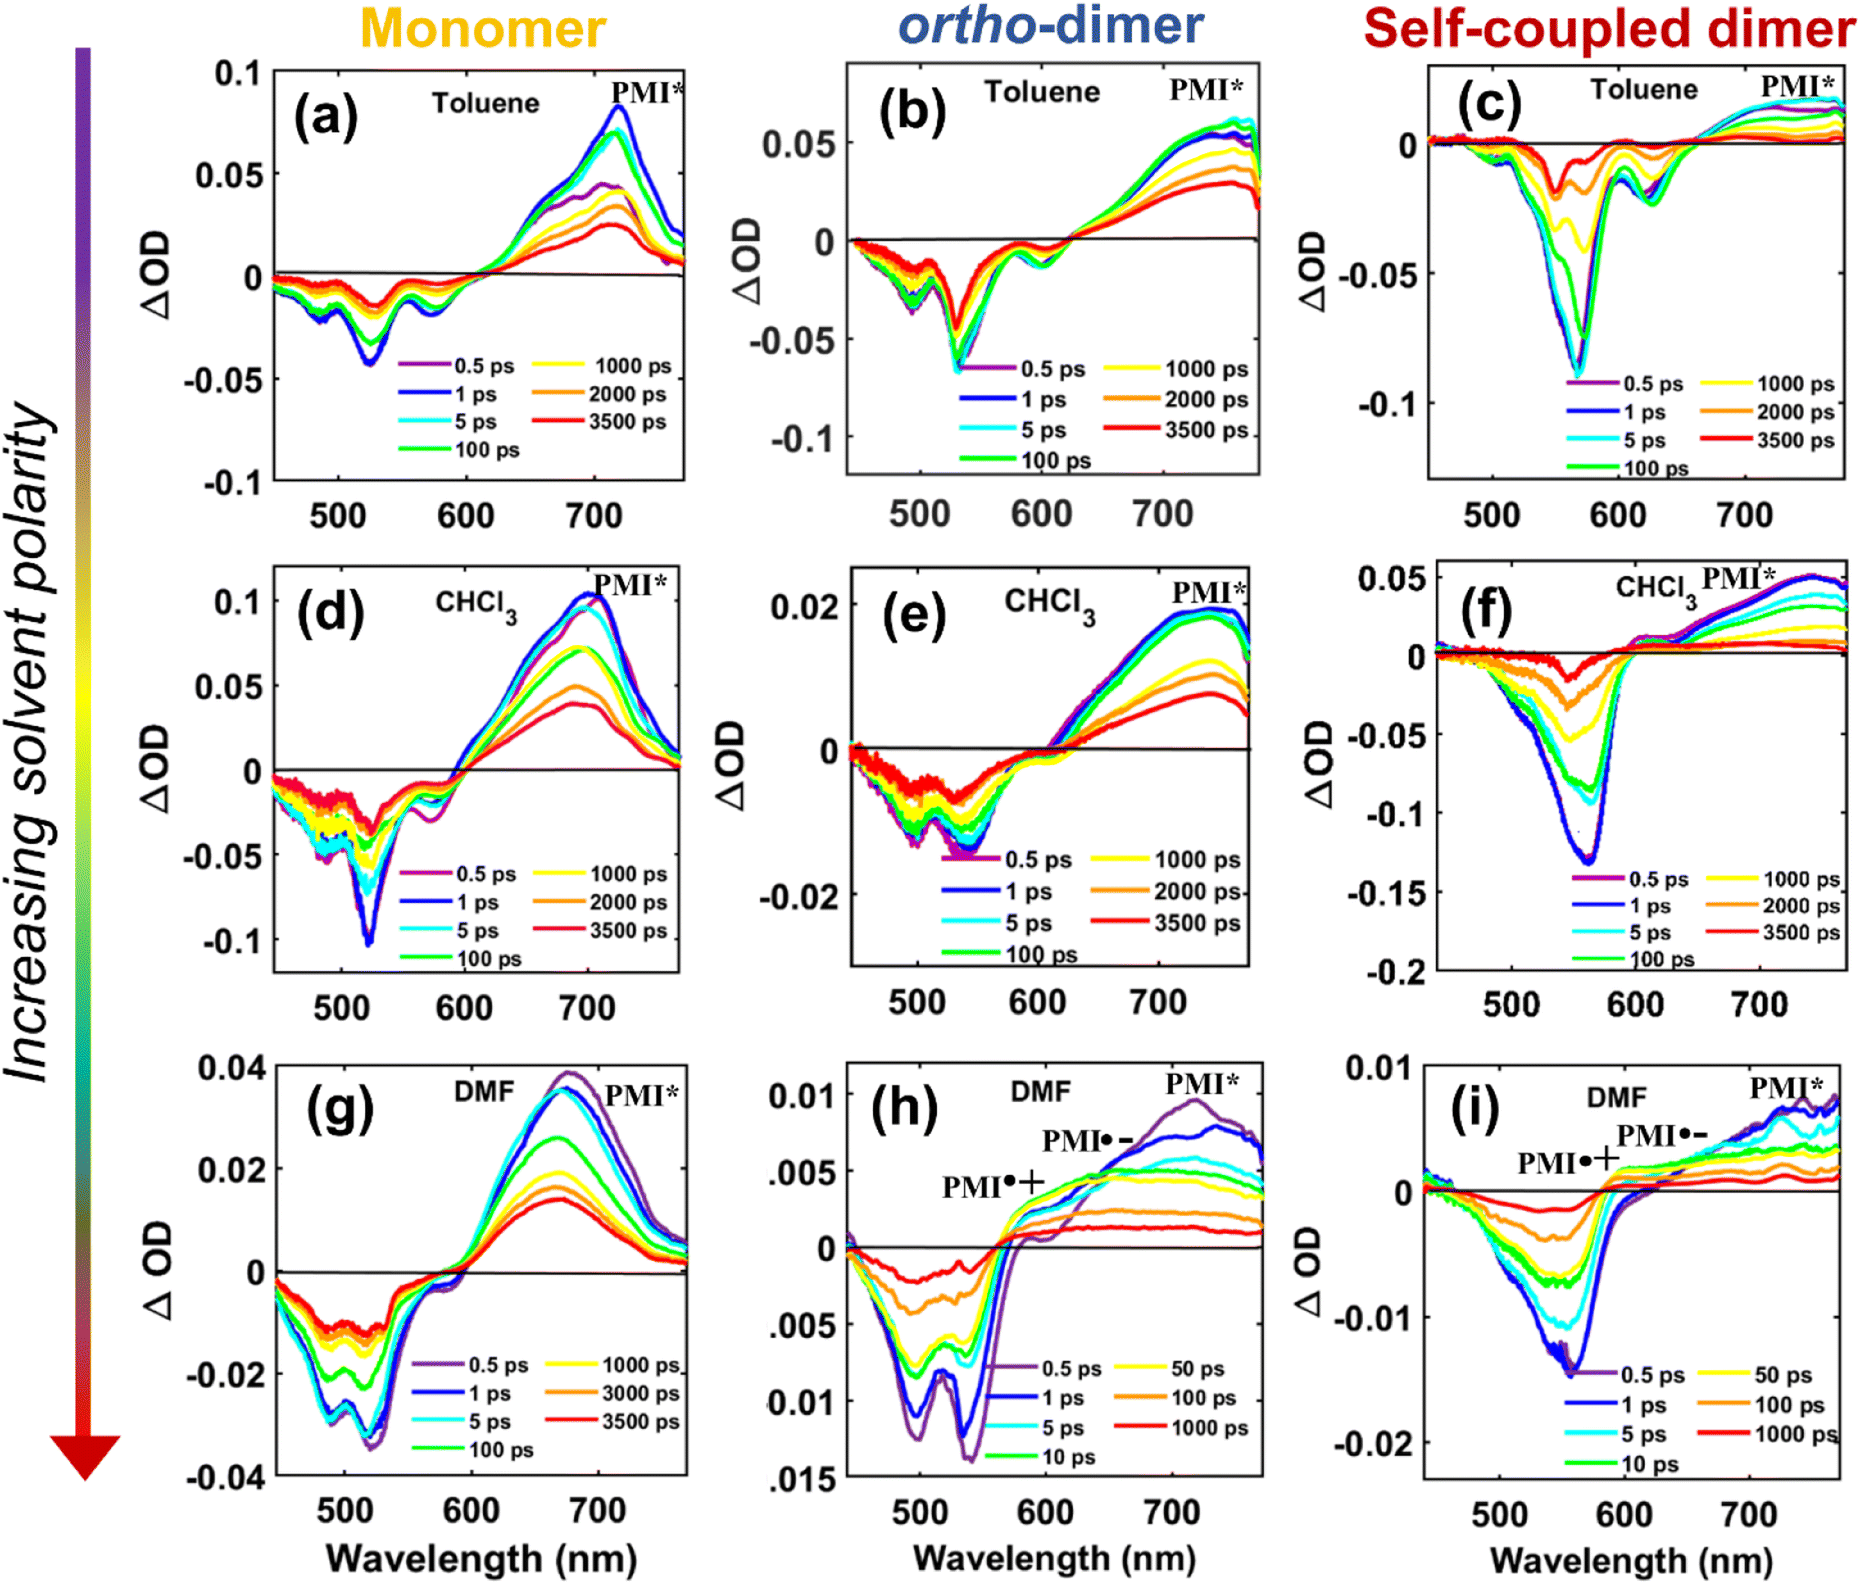
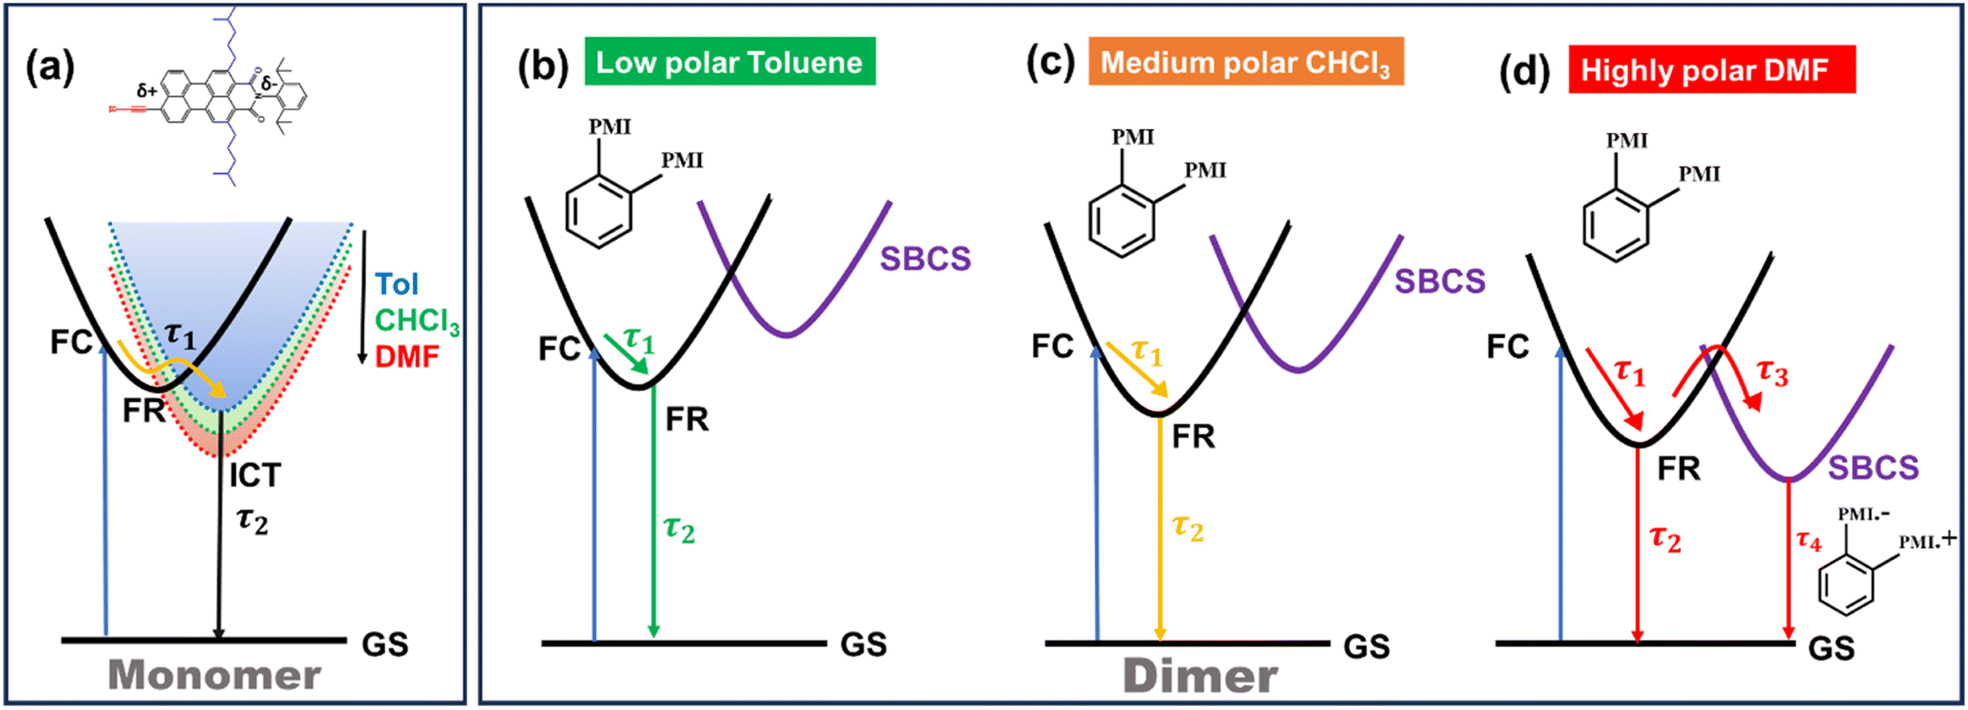
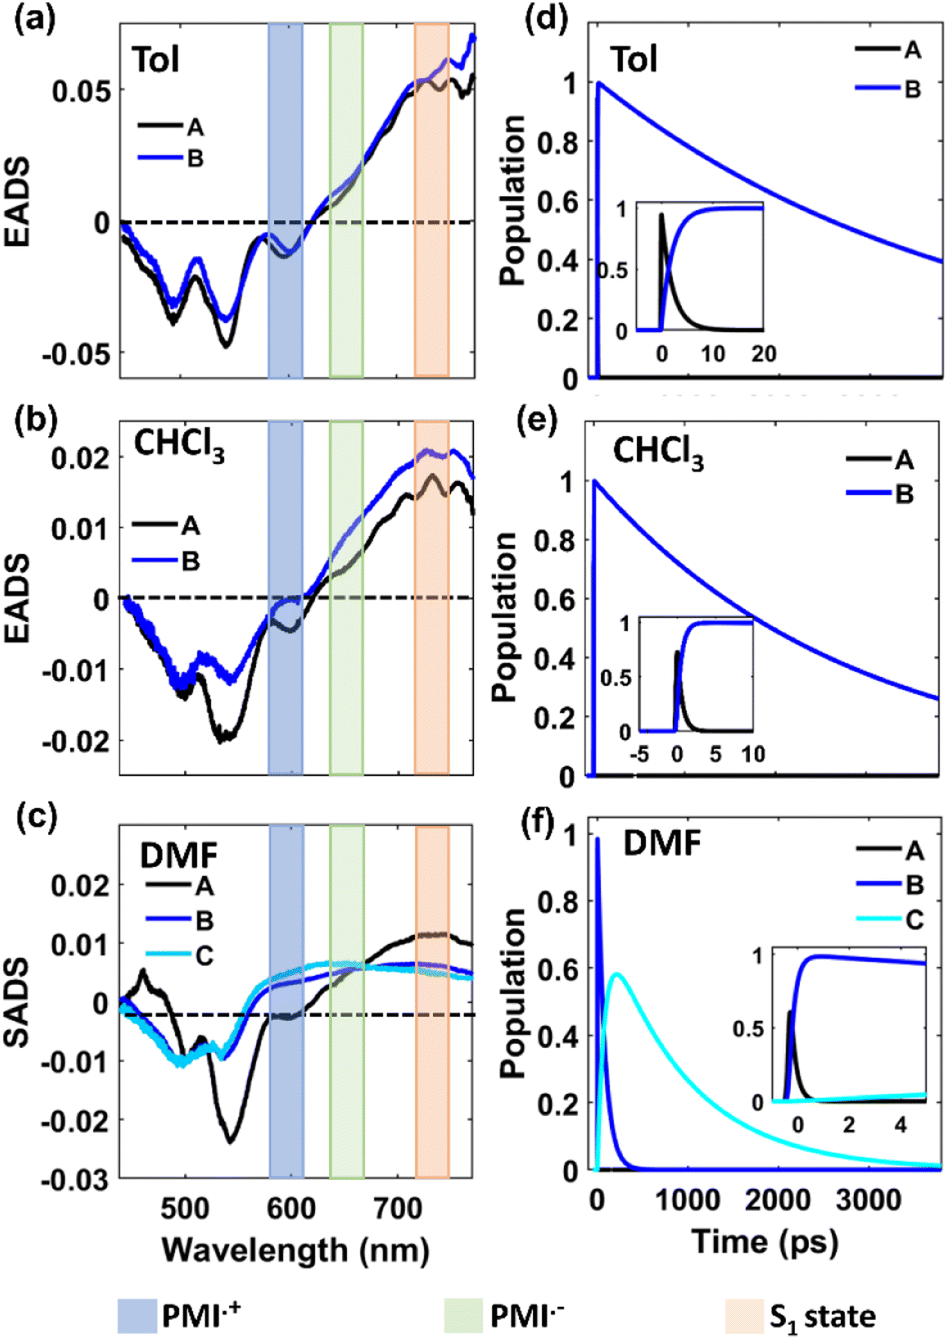
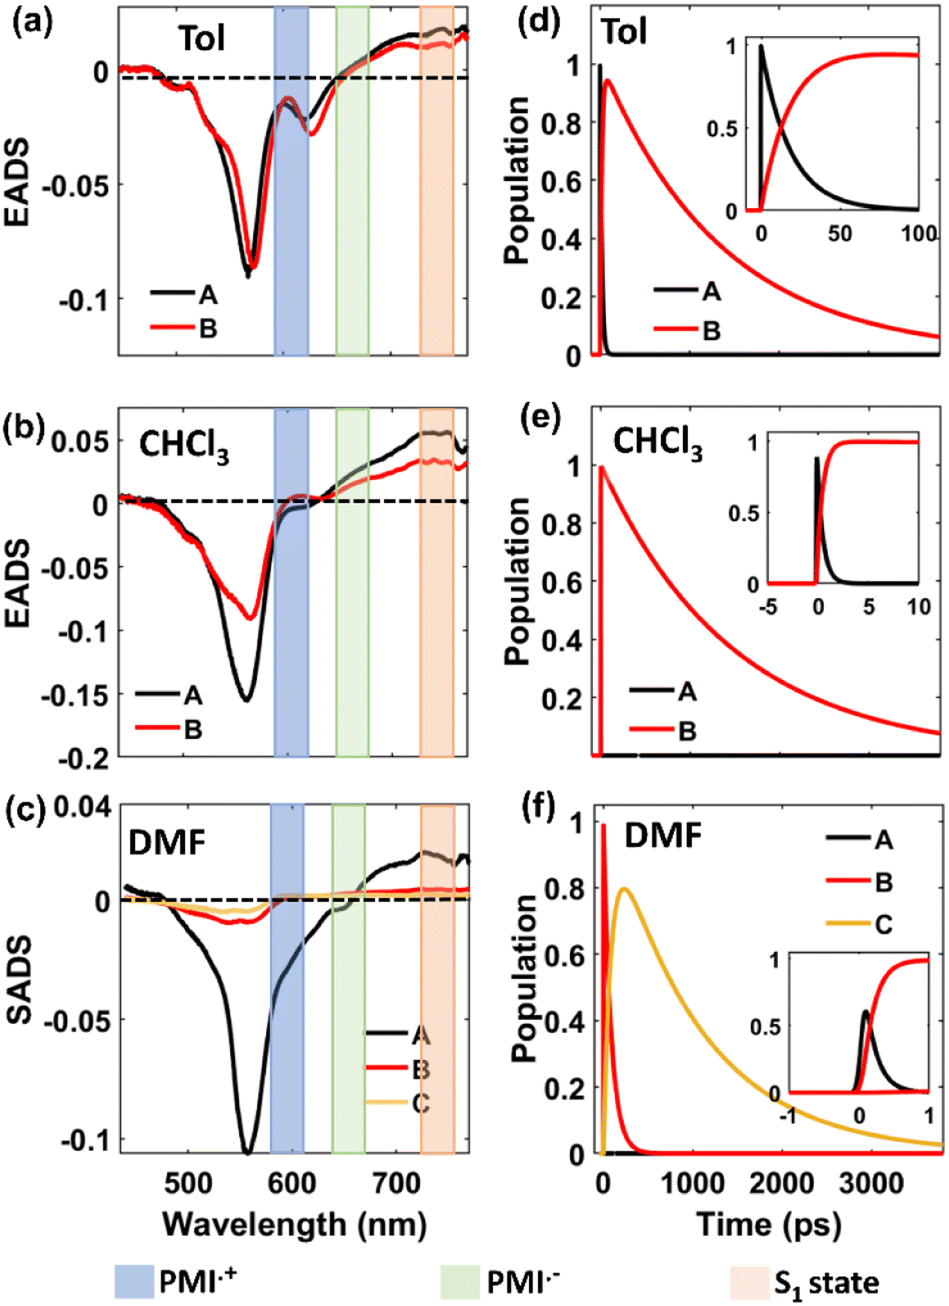
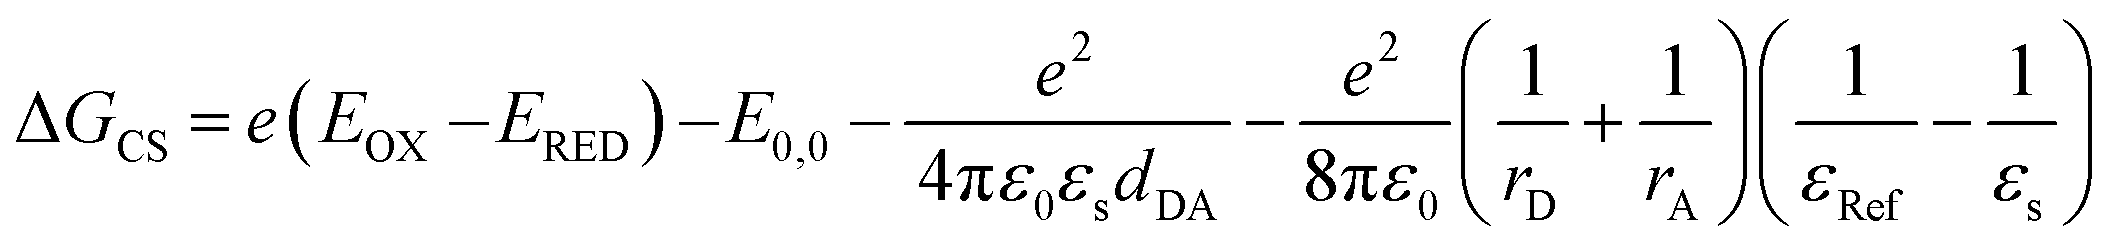
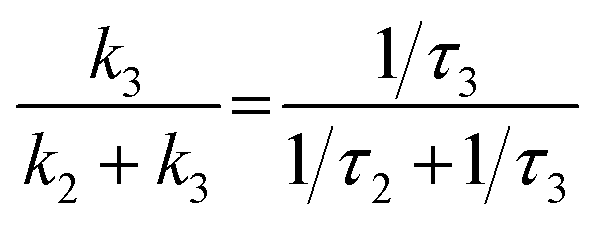 . This estimate shows that ∼95% of the population branches into the SB-CS channel in the ortho-dimer whereas it is ∼80% for the self-coupled dimer. It should be noted that the SB-CS state may undergo a further additional deactivation pathway, which involves the recombination of the charge-separated state to populate the triplet state, thus lowering the possibility of the crucially important long-lived charge separation, essential for the photovoltaic application.3,80 However, in the present study, the lack of any long-lived component and any distinctive features for the 3PMI state in the TA spectra of dimers and trimer suggests the absence of any triplet state formation.44,47 A summary of charge separation and charge recombination time constants (τ) of PDI and PMI-based multichromophoric systems has been provided in Table S10†.