
 Open Access Article
 This Open Access Article is licensed under a
 Creative Commons Attribution 3.0 Unported Licence
Studying the cation dependence of CO2 reduction intermediates at Cu by in situ VSFG spectroscopy†
Liam C.
Banerji
 a,
Hansaem
Jang
a,
Adrian M.
Gardner
ab and
Alexander J.
Cowan
*a
a,
Hansaem
Jang
a,
Adrian M.
Gardner
ab and
Alexander J.
Cowan
*a
aDepartment of Chemistry, Stephenson Institute for Renewable Energy, University of Liverpool, Liverpool, UK. E-mail: acowan@liverpool.ac.uk
bEarly Career Laser Laboratory, University of Liverpool, Liverpool, UK
First published on 17th January 2024
Abstract
The nature of the electrolyte cation is known to have a significant impact on electrochemical reduction of CO2 at catalyst|electrolyte interfaces. An understanding of the underlying mechanism responsible for catalytic enhancement as the alkali metal cation group is descended is key to guide catalyst development. Here, we use in situ vibrational sum frequency generation (VSFG) spectroscopy to monitor changes in the binding modes of the CO intermediate at the electrochemical interface of a polycrystalline Cu electrode during CO2 reduction as the electrolyte cation is varied. A CObridge mode is observed only when using Cs+, a cation that is known to facilitate CO2 reduction on Cu, supporting the proposed involvement of CObridge sites in CO coupling mechanisms during CO2 reduction. Ex situ measurements show that the cation dependent CObridge modes correlate with morphological changes of the Cu surface.
Introduction
Anthropogenic climate change has led to the urgent requirement for sustainable carbon cycles to be developed. The use of CO2 through capture and conversion technologies has been identified as a promising way to generate chemical feedstocks and fuels.1 Electrochemical CO2 reduction (eCO2R) has been studied extensively at a range of metal surfaces; however there is still an incomplete mechanistic understanding of the eCO2R reaction.2 Cu has been identified as the only heterogeneous, monometallic catalyst to be able to reduce CO2 to products that require more than two electrons in the reaction pathway in appreciable quantities, including many short-chain oxygenates and hydrocarbons (C2+ products).3–5 This is hypothesised to be due to optimal binding energies of crucial intermediates on Cu surfaces, shown by density functional theory (DFT) studies.6The nature of the catalyst is only one of the many factors which influence the performance of eCO2R; cell architecture and electrochemical environment both also play major roles. The species of the electrolyte has been shown to dramatically alter the product distribution of the reaction at Au,7–9 Ag10–12 and Cu.11–17 Specifically, the alkali metal cation species present in the electrolyte has a profound effect on the faradaic efficiency (FE) towards target carbon products. When Cu is the electrode, the C2/C1 product ratio is also reported to increase in the order Li+ < Na+ < K+ < Rb+ < Cs+. The dependence of product distribution on cations has also been detected in zero-gap cathode structures, where cation cross-over from a liquid analyte through an anion exchange membrane occurred.18 The hypotheses for the mechanism of these catalytic enhancements are widely debated within the community; the three predominant arguments can be summarised as (i) the pKa of the water molecules in the hydration sphere of the cation at the cathode decreases as the alkali metal group is descended from Li+ to Cs+ increasing the available CO2 by minimising conversion to bicarbonate locally.12,19 (ii) An increase in the potential drop across the outer Helmholtz plane (OHP), and hence local electric field, due to the smaller hydrated radius going from Li+ to Cs+.20 The increased electric field can benefit eCO2R kinetics via a number of mechanisms, including reducing the activation barrier for charge transfer and through the stabilisation of reaction intermediates.20 Finally (iii) stabilisation of intermediates through specific cation/reaction intermediate interactions has been proposed, impacting on both CO2 and CO binding strengths and the CO coupling reactions11,21–24 and supporting this conclusion is the recent demonstration that eCO2R does not occur in rigorously prepared solutions where the cation has been excluded.9
Vibrational spectroscopies19,25–29 such as surface enhanced infrared absorption spectroscopy (SEIRAS), surface enhanced Raman spectroscopy (SERS) and shell isolated nanoparticle enhanced Raman spectroscopy (SHINERS) have been used extensively to study the electrode–electrolyte interface during eCO2R and to explore the role of cations. SEIRAS measurements have studied bicarbonate at an operating electrode providing evidence for the role of the cation in pH buffering during eCO2R.19 The potential dependent (often labelled vibrational Stark) tuning rates of vibrational probes (such as CO) at Au,28,29 Cu21 and Pt26 have also been reported and these can provide an indication of local field strength. Such studies show that the field strength correlates with an increased interfacial cation concentration and a decreased hydrated cation radius. However, it is important to note that in many cases only a single metal–CO binding site is discussed. Furthermore a recent study of a Au electrode measured the field strengths arising at the electrode from the applied potential and found these to be relatively small when compared to the solvation induced Onsager reaction field, which is induced by the cation through direct interaction with surface CO.29
Although SEIRAS and SERS have provided important insights into the eCO2R reaction, both techniques require surface modification of the electrode. This is typically roughening, or in some cases deposition of the catalysts onto a suitably roughened support, in order to gain sufficient enhancement factors to enable identification of surface species. A concern is that samples suitable for SEIRAS/SERS can show significantly different catalytic activities to the polycrystalline electrode surfaces that are routinely employed in eCO2R and this can be correlated to differences in CO binding sites.25 CO has been identified linearly bound atop (COatop) and at bridging sites (CObridge) by attenuated total reflection (ATR) FTIR and also SERS spectroscopies.30–40 Whilst CObridge has been considered to be irreversibly bound and not active on the eCO2R pathway,33 recent works have proposed that the presence of CObridge leads to an increase in C2 products,30,34,36,37 with DFT calculations suggesting that CO–CO coupling may be more facile between COatop and CObridge.36 Interestingly, a preliminary ATR-FTIR study noted that CObridge sites are present in Cs+ containing electrolytes21 which are proposed to promote C2 formation and a similar observation was made by Raman spectroscopy.35 However, as highlighted in a recent review,41 there is a need for improved understanding of the nature of surface intermediates during eCO2R at Cu and their dependence on the reaction conditions. Here we use VSFG spectroscopy to study ν(CO) at polycrystalline Cu (pc-Cu) electrodes to identify relative populations of reaction intermediates and their evolution in the presence of different electrolyte salts. Three alkali metal cations have been chosen for analysis: K+, which is the most commonly used electrolyte cation for eCO2R, Cs+, which has been shown to give the greatest enhancement for C2+ products, and Na+, which shows poorer eCO2R performance than K+ whilst maintaining appreciable levels of C-based products. The ability of VSFG to study catalyst|electrolyte interfaces without the need for modifications, as required in the aforementioned spectroelectrochemical studies, which can fundamentally alter the electrodes activity, makes it an important tool to assess the mechanisms occurring on the pc-Cu electrodes routinely employed for eCO2R.
Results and discussion
The data for the in situ VSFG experiments on a pc-Cu electrode in 0.5 M Na+, K+ or Cs+ bicarbonate electrolytes purged with CO2 at a range of applied potentials is shown in Fig. 1. Full experimental details are provided in the Methods section and the experiment design is shown in Fig. S1.† The potential is held for 150 seconds with the VSFG spectrum collected for 120 s, following a 30 s equilibration period. The potential steps progress in the order −0.5 → −1.0 → −0.1 → −0.5 V vs. Ag+ in 0.1 V increments. Progressing the potential steps in this order ensures that the Cu surface is fully reduced at the start of the experiment. All potentials from this point onwards will be referenced against the Ag+ pseudo reference electrode and the choice of reference electrode is discussed in ESI Note 1.† The potential window was chosen following linear sweep measurements of the same electrode which showed that the catalytic onset potential under CO2 was ca. −0.8 V for all of the electrolytes (Fig. S2†). As discussed in ESI Note 2,† VSFG spectra are recorded with a short time delay (ca. 0.7 ps) between the mIR pulse (centred at approximately 1920 cm−1, 170 fs duration) and a time-asymmetric nIR picosecond laser pulse in order to minimise the non-resonant SFG response that can otherwise dominate the VSFG spectrum.42 Spectra are also normalised to the intensity of the mIR profile as discussed in ESI Note 3.†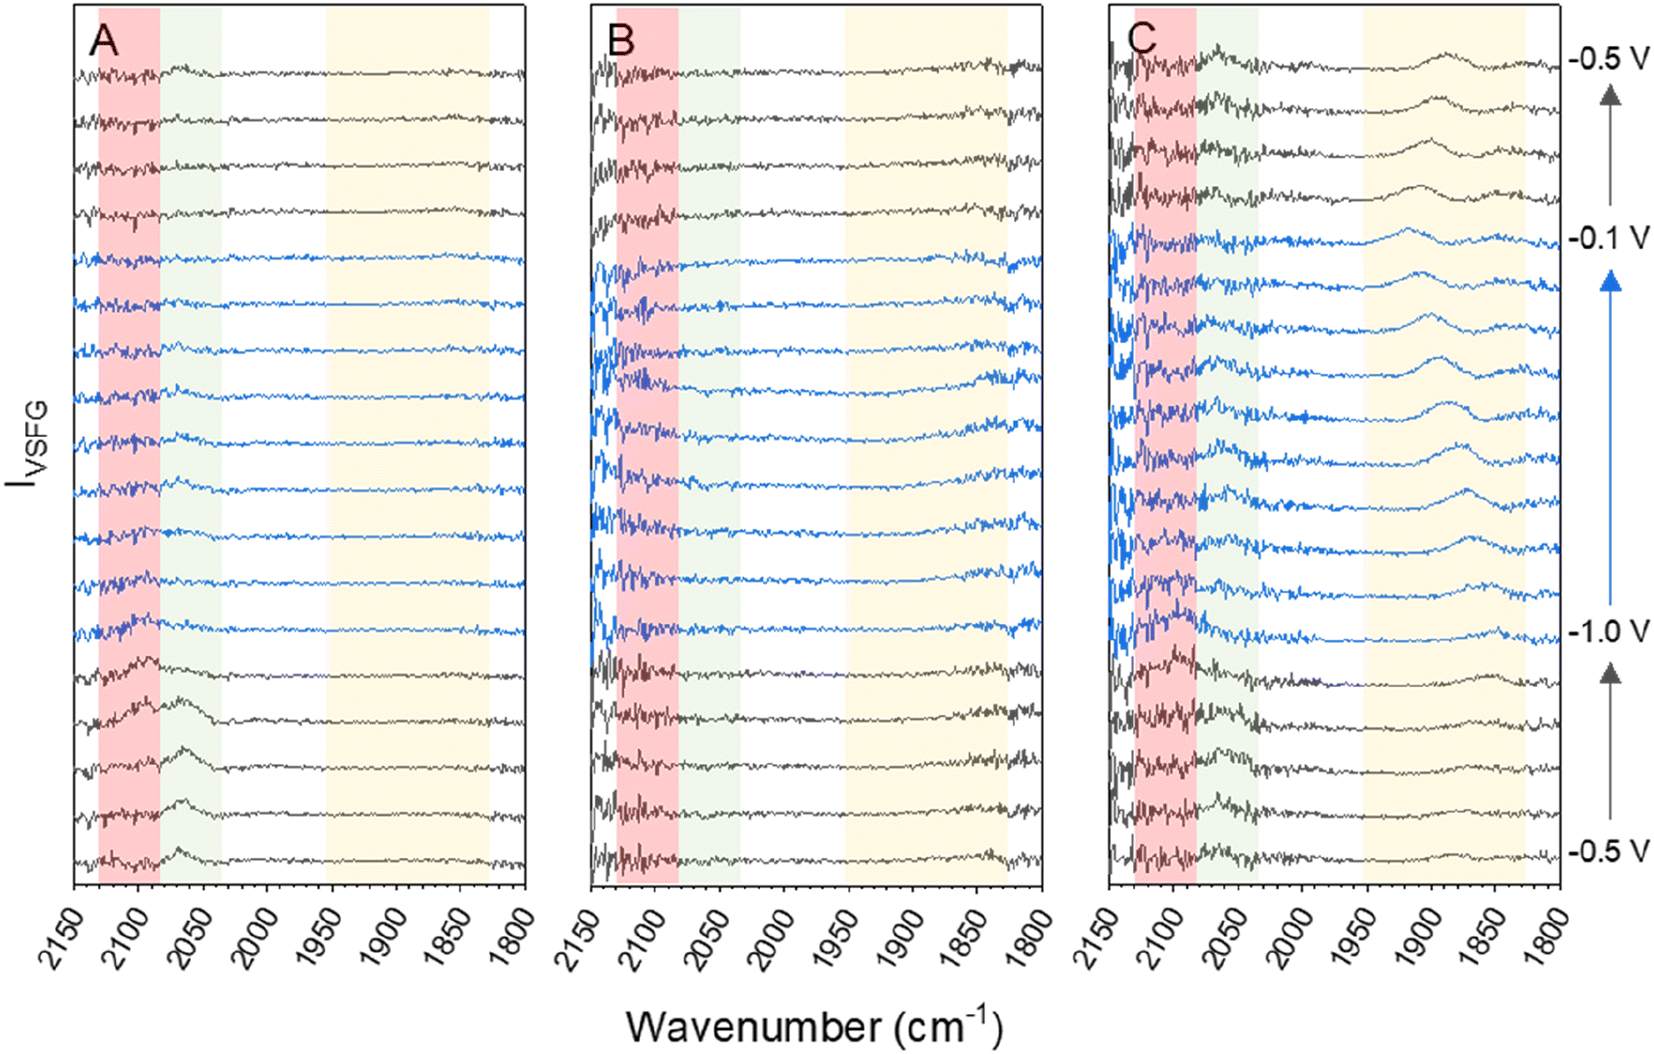 | ||
| Fig. 1 VSFG spectra showing CO modes on pc-Cu across the studied potential window CO2-purged 0.5 M (a) NaHCO3, (b) KHCO3 and (c) CsHCO3 during sequential potential measurements (−0.5 → −1.0 → −0.1 → −0.5 V vs. Ag+ in 0.1 V increments). In each panel the data for the reverse steps (−1.0 → −0.1 V) is in blue to guide the eye. The red, green and yellow shaded regions highlight the spectral range where bands are assignable to ν(COatop(defect)), ν(COatop(terrace)) and ν(CObridge) sites respectively. | ||
The CO binding site on Cu is dependent on the cation type and applied potential
Fig. 1 shows that ν(CO) are detected by in situ VSFG spectroscopy on the pc-Cu electrode during eCO2R but the nature and presence of ν(CO) is dependent upon the choice of electrolyte cation. In the presence of Na+, a single ν(CO) at approximately 2062 cm−1 is present at −0.5 V. A second band at 2094 cm−1 grows in at −0.8 V and follows to become the dominant band by −0.9 V. As discussed below the exact positions of the ν(CO) depends on the applied potential. The presence of adsorbed CO at −0.5 V, positive of the anticipated onset potential for eCO2R (Fig. S2†), is due to the production of CO during prior measurements on the cell (ESI Note 2†). The 2062 and 2094 cm−1 bands can be assigned to CO linearly bound at terraced (COatop(terrace)) and defect (COatop(defect)) sites, respectively.25,27,43,44 VSFG band intensities (IVSFG) recorded by homodyne detection scale quadratically with number density and are also dependent on the orientation of the vibrational mode and ordering at the surface.45 Here we use (IVSFG)0.5 as a way to estimate the relative populations of the different CO binding modes, Fig. 2, with IVSFG determined from the peak area obtained by Lorentzian peak fitting. As shown in Fig. 2, when using NaHCO3 COatop(terrace) accumulates between −0.5 and −0.8 V, whilst CO accumulates at defect sites between −0.7 and −0.9 V. It is reported that CO2 reduction to CO occurs preferentially at defect sites, formed following the reduction of surface oxides, and the increase in population of COatop(defect) at potentials around where eCO2R onsets (ca. −0.8 V, Fig. S2† and 2) is in line with this proposal.46 However, we note that defect formation on Cu is known to be sensitive to CO coverage and we cannot rule out that the potential dependence of COatop(defect) is due to the potential dependent formation of the binding site or relative potential dependent stability of the binding sites, and this is discussed further below. | ||
Fig. 2 Square root of the area of the different VSFG measured CO modes (IVSFG0.5) as an estimate of surface concentration on Cu as a function of applied potential and electrolyte salt (a) NaHCO3, (b) CsHCO3, during eCO2R. Values of 0 counts indicate that the signal![[thin space (1/6-em)]](https://www.rsc.org/images/entities/char_2009.gif) :noise for the peak was insufficient to enable convergence for the fit. Populations could not be estimated for the KHCO3 system in the absence of IVSFG for this data set. :noise for the peak was insufficient to enable convergence for the fit. Populations could not be estimated for the KHCO3 system in the absence of IVSFG for this data set. | ||
When CsHCO3 is used as the electrolyte during eCO2R the two VSFG bands assigned to COatop(terrace) and COatop(defect) at approximately 2066 and 2094 cm−1 respectively are present, alongside an additional band at 1887 cm−1 (at −0.5 V), Fig. 1C. The frequency of the band at 1887 cm−1 matches that previously assigned to CObridge binding at Cu.30,33,34,38,39,41,47 Past studies have proposed that bridge bound CO is electrochemically stable30,33,38,47 and we also observe that the band at 1887 cm−1 at −0.5 V is stable across a wide potential window (−0.1 to −1.0 V, Fig. 2A and S5†) and that CO accumulates at this site during the experiment. The observation that CObridge is present when Cs+ is used as an electrolyte but not Na+ is notable. When the VSFG experiment in CsHCO3 is repeated under CO instead of CO2, the CObridge species is not observed, Fig. 3. This demonstrates that the generation of and/or occupancy of the CObridge site relies upon the specific local conditions generated during eCO2R. Both the CO coverage and concentration in the electrolyte have also been shown to be important factors in the reconstruction of Cu surfaces,27,48 which may explain the evolution of different binding motifs when compared to the VSFG data during eCO2R.
 | ||
| Fig. 3 VSFG spectra showing CO modes on Cu across the studied potential window in CO-purged 0.5 M CsHCO3 at the potentials indicated. The red and green shaded regions highlight the spectral range where bands are assignable to ν(COatop(defect)) and ν(COatop(terrace)) sites respectively. A background subtraction using the first −0.5 V spectrum (where no CO modes are observable) has been performed on all spectra to remove interference in the COatop region by supercontinuum generation, shown in Fig. S7 and discussed in ESI Note 3.† | ||
Fig. 1B shows that VSFG experiments in KHCO3 have very low IVSFG bands only. Previously a lack of observation of ν(COatop) bands by VSFG on pc-Cu has been attributed to the presence of a disordered CO layer on the electrode.49 It is well established that CO can be measured at Cu electrodes in KHCO3 by linear vibrational spectroscopies (e.g. SEIRAS, Raman).27,36,37,44,50–56 The lack of detected Cu–CO by VSFG during eCO2R using a KHCO3 is therefore proposed to be due to disorder of the Cu–CO surface. Overall, it is clear that there is a large variation in the manner in which CO binds at the surface in the presence of each of the cations during eCO2R.
The CO potential dependent stretching frequency changes as the cation is changed
Variations in local electric field as the cation is changed have been proposed to be a significant factor in controlling eCO2R activity and these may be a factor behind the potential and cation dependence of the CO binding site observed in Fig. 2. Potential dependent ν(CO) frequency changes are often used as an indicator of local electric field strength and these are shown in Fig. 4.57 The deviation from linearity in the potential dependent frequency tuning < −0.8 V (shaded blue in Fig. 4) demonstrates that directly equating potential dependent frequency tuning to electric field effects is an oversimplification. Consequently, tuning rates here are determined from linear fits of the data between −0.1 and −0.8 V, where the frequency tuning is relatively linear, and only in cases in which there are 3 or more data points so that an error can be calculated. Tuning rates are annotated on the Fig. 4 for the −0.5 to −0.8 V cathodic and the −0.8 to −0.1 anodic scans. A full set of all tuning rates calculated in CO2 purged electrolytes can be found in Fig. S8.† | ||
| Fig. 4 VSFG measured ν(CO) on Cu as a function of applied potential with CO2 purged (a) 0.5 M NaHCO3 and (b) CsHCO3 in the −0.5 → −1.0 V (black) and −1.0 → −0.1 V (red) scan directions. Tuning rates in the potential range −0.1 to −0.8 V are annotated and the region in which the frequency tuning rates become non-linear is shaded in blue. Blue data points (crosses) are ν(CO) values when the potential is stepped back between −0.1 to −0.5 at the end of the experiment. | ||
The VSFG experiment in CO2 purged CsHCO3 shows a tuning rate of 24.3 (±2.7) cm−1 V−1 for the ν(COatop(terrace)) site when the potential is scanned from −0.5 to −0.8 V. The ν(CObridge) mode tunes at a higher rate of 74.4 (±13.6) cm−1 V−1. The difference in both absolute frequency and potential dependant frequency between the CObridge and COatop sites can be explained by the increase in backdonation to π* antibonding orbitals as the CO adsorbate coordinates to more metal atoms.58 The tuning rate of the ν(COatop(terrace)) site is less than half in NaHCO3 (9.0 (±3.4) cm−1 V−1, Fig. 4A and S8b†) compared to CsHCO3. Tuning rates for the ν(COatop(defect)) site are more difficult to compare; the number of data points in the linear region are not enough to extract associated errors in the case of the anodic scan in CsHCO3 and the cathodic scan in NaHCO3. Tentative comparison of the tuning rates in opposite scan directions shows a significantly higher rate in the presence of Cs+; however, the uncertainty in the linear regression means conclusions cannot be drawn regarding ν(COatop(defect)). The potential dependent tuning rates for CO on Cu surfaces measured here fall within the distribution reported. The VSFG measured decrease in tuning rate for Na+ and Cs+ is in line with past reports, where it has been shown to vary in the order Na+ < K+ < Cs+.20
The cation induced change in CO binding mode correlates with ex situ measured changes in electrode morphology due to eCO2R
VSFG measurements show that the different cations lead to the population of a different set of surface sites by CO during eCO2R on Cu. It is known that eCO2R can lead to both reversible (with applied potential) and irreversible restructuring of the Cu surface, which would modify available sites for CO binding.27,59,60 To assess cation dependent surface structuring, atomic force microscopy (AFM) was used to study the Cu surfaces after cycling through the potential step programme used for spectroelectrochemistry in CO2 purged electrolytes, Fig. 5A–D. AFM shows the electrochemical experiments lead to changes in the grain size of Cu surface post-experiment. Interestingly, there is a correlation between cation size and post-electrolysis Cu grain size; the mean grain size increases in the order of pre-bulk electrolysis (32.4 ± 7.0 nm) < Na+ (68.7 ± 21.4 nm) < K+ (93.3 ± 23.3 nm) < Cs+ (139.5 ± 44.1 nm). The AFM map post-electrolysis also has the widest distribution of grain size with Cs+ present, indicating particularly high levels of surface reconstruction using this cation. As the CObridge site is present in CsHCO3 when purging with CO2 but not CO, AFM images have been recorded of the Cu surface after bulk electrolysis in CO purged CsHCO3, Fig. 5E. Similar reconstruction occurs; however the average particle size is lower for the CO purged system (104.3 ± 29.9 nm), closer to that of the CO2 purged KHCO3 system. We note that it is important to take caution when interpreting ex situ characterisation of Cu surfaces as they are not true representations of surfaces under operando conditions. In situ TEM shows that metallic Cu structures formed under operating conditions are rapidly changed upon exposure to air and subsequent Cu2O formation.61 Nonetheless, the clear difference in ex situ morphology post-electrolysis is indicative of differences in structure in situ depending on the cation used offering a rationale for the cation dependence of CO binding site measured in situ by VSFG spectroscopy.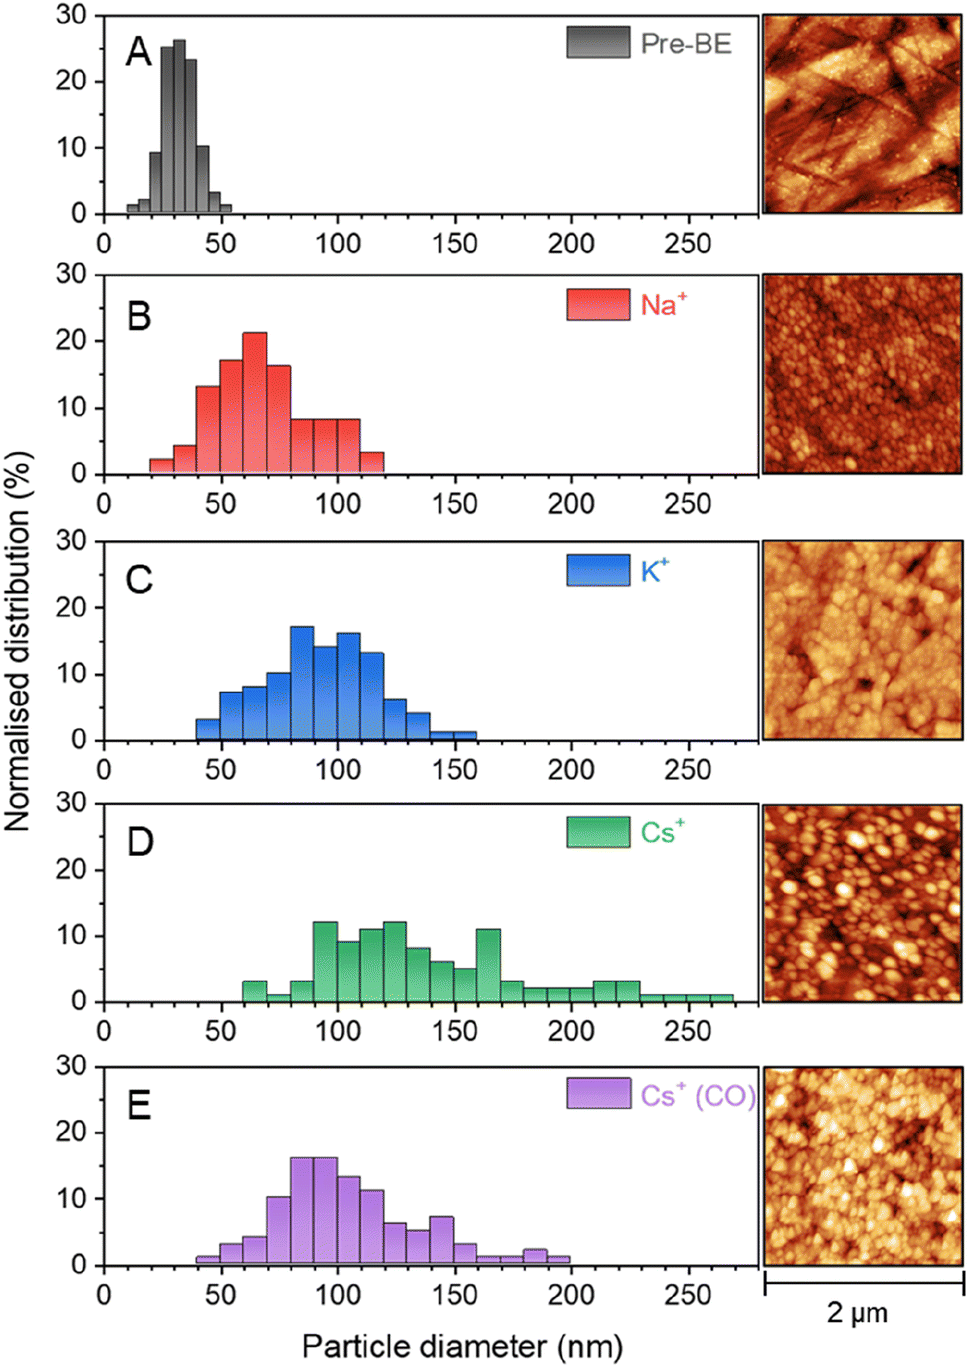 | ||
| Fig. 5 AFM images showing surface morphology of the Cu electrode surface (a) before bulk electrolysis, after bulk electrolysis in CO2 purged 0.5 M (b) NaHCO3, (c) KHCO3 and (d) CsHCO3 and also in (e) CO purged 0.5 M CsHCO3. Image analysis methods are described in the Experimental section. | ||
VSFG spectroscopy allows us to explore the potential dependence (and stability) of the atop binding modes in the presence of Na+ and Cs+, Fig. 1. Overall, the potential dependent profiles of the COatop(terrace) and COatop(defect)IVSFG response are similar, with the COatop(defect) increasing at potentials negative of −0.7 V. The slight decreases in IVSFG for COatop(defect) at the most negative potentials studied (−1.0 V) in the presence of Na+, but not Cs+, indicate that Cs+ leads to stabilisation of CO binding at the defect site and past studies have also proposed that this may occur.9,11,23 The potential dependent tuning rates of the CO stretching modes need to be interpreted with caution. Deviations in the linear applied potential versus CO frequency relationship are observed at catalytic potentials (<−0.8 V) which is reasonable given that we anticipate both changes in the local environment (electrode structure), as indicated by the post-experiment AFM studies, and changes in CO concentration which will impact on dipolar coupling. The excellent agreement between the anodic and cathodic tuning rates in each electrolyte (Fig. 4), despite clear differences in IVSFG observed (Fig. 2), suggests the effects of dipolar coupling in the −0.1 to −0.8 V potential range in our experiments is minimal. It is striking that there is a significant increase in tuning rate of the ν(COatop(terrace)) mode in the presence of Cs+ compared to Na+ which is indicative of an increase in local field strength at the Cu electrode in the presence of CO which will modify Cu–CO stabilities.
However the most striking result is that the nature of the CO binding site is strongly dependent on the cation used. With Na+ CO is bound atop at both terrace and defect sites. With K+ we propose that a more disordered surface with multiple sites occupied by CO occurs leading to no clear VSFG modes. When Cs+ is used, which is widely reported to give the highest levels of eCO2R activity,11–17 there is a build-up of CO bound at bridge sites on the Cu surface which is not seen with other cations. The CObridge site is considered electrochemically inactive33 making it striking that it is observed using Cs+, but not Na+ which is usually less active for eCO2R. One possible cause of the apparent contradictory results is misassignment of the CObridge mode. For example, metal impurities can lead to different M–CO modes being present and these have been proposed to be the cause of erroneous assignments in SEIRAS studies.62 Common causes of metal ions in the electrochemical cell, such as counter electrode dissolution and impurities from the supporting electrolyte itself, are addressed by the use of carbon counter electrodes and a thorough pre-electrolysis of the electrolyte solution (see Experimental section). Furthermore, observation that the ν(CO) at ∼1887 cm−1 on Cu is not present during spectroelectrochemical studies of CsHCO3 purged with CO, but that it is present during studies of the same electrolyte when CO2 purged, supports assignment to an intermediate formed during eCO2R on Cu, namely multiply (bridge) bound CO.30,33,34,38,39,41,47
Although electrochemically inactive at the potentials studied here, the presence of bridge bound CO may still enhance eCO2R activity for C2+ products and a number of studies propose that C–C coupling is facilitated by bridge sites during eCO2R, with calculations revealing that energetic barriers are lowest for coupling between COatop and CObridge sites.30,34,36,37,63 In fact, a recent study reports C2 FE over 90% at industrially relevant current densities and attributes this catalytic behaviour to the stable ratio of COatop/CObridge sites, observed via Raman spectroscopy.34 The observation by VSFG spectroscopy that CObridge is formed with CsHCO3, an electrolyte with an increased C2/C1 product ratio when compared to K+ and Na+,11–17 strongly supports the involvement of the bridging site in CO–CO coupling.
Potential and pH induced surface reconstruction has been reported to trigger formation of the bridge binding site, with a high pH being particularly beneficial.33 Cu surface restructuring is also sensitive to a range of other factors including the initial presence of a surface oxide,64 local CO concentration/surface CO coverage27,48 and the nature of the electrolyte anion.38,65 The presence and nature of alkali metal cations has also been proposed to be a controlling factor18 with one study postulating that increased activity for C–C bond formation using Cs+ is due to electrolyte induced modification of the Cu surface.66 It is therefore striking that the detection of the CObridge mode in situ correlates with increased ex situ measured changes in electrode morphology post-electrolysis when Cs+ is used as the electrolyte during eCO2R.
Conclusions
VSFG spectroscopy enables the study of a pc-Cu electrode without the need for surface modification/nano-structuring of the electrode which is often applied to linear vibrational spectroscopies to obtain suitable levels of surface sensitivity. There is increasing evidence that the morphology of the electrode can have a profound effect on catalytic activity making it important that spectroscopic studies are carried out on the most commonly employed electrode structures. Past VSFG studies have identified ν(C–H) but been unable to identify the important surface bound CO on pc-Cu; here we identify that the detection of CO at the pc-Cu depends on the choice of cation and specific reaction conditions. We measure high levels of CObridge by VSFG when a Cs+ electrolyte is used. We find that there is a correlation between ex situ post electrolysis measurements of electrode morphology, which shows that the degree of restructuring is cation dependent, and the presence of the CObridge intermediates as measured by VSFG spectroscopy. These results suggest that a high level of bridge site formation is related to, or facilitated by, the Cu restructuring that happens as a result of the use of the Cs+ cations in the supporting electrolyte. Recent reports have indicated that multiple (bridge) bound CO may be electrochemically inert33 but this work builds on the emerging evidence that CObridge sites are a key intermediate in the CO–CO coupling step that is required for C2+ formation during eCO2R.30,34,36,37,63Experimental section
VSFG cell preparation
All VSFG experiments were performed in a custom spectroelectrochemical “cross-cell”. The cross cell and all components were kept in Milli-Q water between experiments to avoid contamination by organics in the air, with additional thorough rinsing before assembly. The 3 mm diameter Cu (Alvatek) working electrode was mechanically polished for 10 minutes using 1.0 μm then for a further 10 minutes using 0.05 μm alumina suspension. The electrode was rinsed thoroughly and sonicated in Milli-Q water between each polish. The working electrode was then secured into the cross cell with a Ag wire pseudo reference electrode (sanded, rinsed and sonicated before each experiment) and a glassy-carbon counter electrode (mechanically polished before each experiment). Electrolytes used were 0.5 M KHCO3 (99.5%, Merck), NaHCO3 (99.7%, Fisher) or CsHCO3. Due to issues regarding impurities when using commercial CsHCO3, CsHCO3 was prepared from CsOH (99.95%, Merck) by purging with CO2 (99.995%, BOC) for 1 hour, verified by a pH change from 13.6 to 7.4. All electrolytes were pre-electrolysed at −0.025 mA cm−2 with Ti plates overnight prior to use to remove any metal impurities. Electrolytes were purged with CO2 for 20 minutes in a sealed vial before being cannula-transferred into the cross cell. For the CO purged controls, the electrolytes were first degassed with N2 for 20 min before a 1 min purge with CO (99.97%, BOC). Working electrodes were pressed up against the 2 mm thick CaF2 window after electrolyte transfer.VSFG apparatus
A diagram of the VSFG setup is provided in Fig. S1.† The VSFG experiments were performed using a newly constructed spectrometer. 90% of the output PHAROS-PH1-SP (Light Conversion, 1030 nm, 10 kHz, 10 W, 170 fs pulse duration) laser system is used to generate both the nIR and mIR laser pulses required for the VSFG experiments. 1 W of the output is used to generate a time asymmetric narrow-band nIR pulse (1030 nm, 10 kHz, ∼1.5 ps, ∼13 cm−1 linewidth) via an etalon (SLS Optics), which is directed to the sample through a half-wave plate (Thorlabs, WPH10M-1030) and polariser (Thorlabs, LPVIS050-MP2) to rotate the light to a horizontal polarisation, and p-polarised w.r.t refection from the sample, at an angle of incidence of ∼45°. A 950 nm long pass filter (Thorlabs, FEL0950) is also used to filter out second harmonic 515 nm light generated within the halfwave plate. This nIR pulse is focused by a 30 cm lens (Thorlabs LB1779-B), with the sample placed ∼25 cm away from this lens, resulting in an approximate beam diameter at the sample of ∼400 μm (1/e2 diameter) with a power of ∼20 mW. 8 W of the laser output is used in an IR OPA (Light Conversion, Orpheus-One-HE) to generate the broadband IR beam which can be tuned across the frequency range of interest (10 kHz, 170 fs pulse duration and ∼150 cm−1 @ 1900 cm−1). The mIR output passes through a twisted periscope to switch the polarisation from vertical to the desired horizontal polarisation. The purity of the polarisation is checked using a polariser (Thorlabs, LPMIR050-MP2) which is removed from the beam path prior to VSFG measurement. The mIR beam is focussed onto the sample, with an approximate beam diameter of 300 μm using a Au parabolic mirror (Thorlabs, MPD249H-M01) at an angle of incidence of ∼50° and p-polarisation w.r.t reflection from the sample, with a power of ∼20 mW. A gas-purge generator removes H2O, CO2 and other contaminants in the air from the IR beam path. Resulting p-polarised VSFG light is directed through 950 (Thorlabs, FES0950) and 900 nm (Thorlabs, FES0900) short pass filters to remove the 1030 nm nIR beam. The beam goes through another polariser (Thorlabs, LPVIS050-MP2) before being focussed using a 15 mm focal length lens (Thorlabs, LA1540-B) through 150 μm slits and into the spectrograph (Andor, Kymera), and is detected on a CCD camera (Andor, iDus416). nIR/mIR delay is introduced using a linear stage (ThorLabs, LTS300C) on the nIR beam path. The spectrograph was calibrated using Ne spectral lines and the rovibrational P, Q and R CO2 branches.Spectroelectrochemical measurements
Laser beams were always initially aligned off a Au mirror to allow comparison to an IR profile on a clean surface. The potential was stepped from −0.5 → −1.0 → −0.1 → −0.5 V on Cu using a potentiostat (PalmSens). Each potential step was held for 150 s, before sweeping at 50 mV s−1 to the next step to avoid current spikes when jumping between potentials. After equilibration for 30 s, VSFG spectra were acquired for 120 s. Spectra were collected for nIR/mIR delays of 1000, 670 and 0 fs in that order.AFM characterisation
A contact-mode cantilever (Pointprobe®, NanoWorld®, Switzerland) was inserted onto an AFM nose cone (Keysight Technologies, United States). The nose cone was loaded into an atomic force microscope (5500 AFM, Keysight Technologies, United States) and then the laser was aligned to situate the beam spot on the cantilever tip. After approaching the cantilever, images were acquired using Keysight NanoNavigator software (version 1.8.2), morphologies were analysed using Gwyddion (version 2.61) and size distributions were obtained using ImageJ (version 1.53t). In ImageJ the scale of the edge of each image was set to 2 μm and the diameters of a randomly selected set of 100 particles were determined using the measure function.Data availability
Underpinning data including multicurve fits are freely available at on the University of Liverpool Research Data Catalogue (https://doi.org/10.17638/datacat.liverpool.ac.uk/2557).Author contributions
LCB: investigation, data analysis, writing – original draft. HJ: investigation, data analysis, writing – original draft. AG: conceptualization, methodology, writing – review and editing, supervision. AJC: conceptualization, supervision, writing – review and editing, project administration.Conflicts of interest
There are no conflicts to declare.Acknowledgements
We are grateful to UKRI-EPSRC for financial support through grants EP/W038021/1 and EP/P034497/1. LB thanks the University of Liverpool for funding for a PhD studentship. Parts of this work were carried out in the University of Liverpool Early Career Researcher Laser Laboratory supported by UKRI-EPSRC grant EP/S017623/1 and the University of Liverpool, maintained and operated as a shared research facility by the Faculty of Science and Engineering. We are grateful to Prof. Richard Nichols (University of Liverpool) for access to the AFM apparatus.References
- L. Fu, Z. Ren, W. Si, Q. Ma, W. Huang, K. Liao, Z. Huang, Y. Wang, J. Li and P. Xu, J. CO2 Util., 2022, 66, 102260 CrossRef CAS.
- I. E. L. Stephens, K. Chan, A. Bagger, S. W. Boettcher, J. Bonin, E. Boutin, A. K. Buckley, R. Buonsanti, E. R. Cave, X. Chang, S. W. Chee, A. H. M. da Silva, P. de Luna, O. Einsle, B. Endrődi, M. Escudero-Escribano, J. V Ferreira de Araujo, M. C. Figueiredo, C. Hahn, K. U. Hansen, S. Haussener, S. Hunegnaw, Z. Huo, Y. J. Hwang, C. Janáky, B. S. Jayathilake, F. Jiao, Z. P. Jovanov, P. Karimi, M. T. M. Koper, K. P. Kuhl, W. H. Lee, Z. Liang, X. Liu, S. Ma, M. Ma, H. Oh, M. Robert, B. R. Cuenya, J. Rossmeisl, C. Roy, M. P. Ryan, E. H. Sargent, P. Sebastián-Pascual, B. Seger, L. Steier, P. Strasser, A. S. Varela, R. E. Vos, X. Wang, B. Xu, H. Yadegari and Y. Zhou, J. Phys.: Energy, 2022, 4, 042003 Search PubMed.
- Y. Hori, K. Kikuchi and S. Shin, Chem. Lett., 1985, 14, 1695–1698 CrossRef.
- K. P. Kuhl, E. R. Cave, D. N. Abram and T. F. Jaramillo, Energy Environ. Sci., 2012, 5, 7050 RSC.
- S. Nitopi, E. Bertheussen, S. B. Scott, X. Liu, A. K. Engstfeld, S. Horch, B. Seger, I. E. L. Stephens, K. Chan, C. Hahn, J. K. Nørskov, T. F. Jaramillo and I. Chorkendorff, Chem. Rev., 2019, 119, 7610–7672 CrossRef CAS PubMed.
- A. A. Peterson and J. K. Nørskov, J. Phys. Chem. Lett., 2012, 3, 251–258 CrossRef CAS.
- H. Kim, H. S. Park, Y. J. Hwang and B. K. Min, J. Phys. Chem. C, 2017, 121, 22637–22643 CrossRef CAS.
- B. M. Setterfield-Price and R. A. W. Dryfe, J. Electroanal. Chem., 2014, 730, 48–58 CrossRef CAS.
- M. C. O. Monteiro, F. Dattila, B. Hagedoorn, R. García-Muelas, N. López and M. T. M. Koper, Nat. Catal., 2021, 4, 654–662 CrossRef CAS.
- M. R. Thorson, K. I. Siil and P. J. A. Kenis, J. Electrochem. Soc., 2013, 160, F69–F74 CrossRef CAS.
- J. Resasco, L. D. Chen, E. Clark, C. Tsai, C. Hahn, T. F. Jaramillo, K. Chan and A. T. Bell, J. Am. Chem. Soc., 2017, 139, 11277–11287 CrossRef CAS PubMed.
- M. R. Singh, Y. Kwon, Y. Lum, J. W. Ager and A. T. Bell, J. Am. Chem. Soc., 2016, 138, 13006–13012 CrossRef CAS PubMed.
- A. Murata and Y. Hori, Bull. Chem. Soc. Jpn., 1991, 64, 123–127 CrossRef CAS.
- G. Z. Kyriacou and A. K. Anagnostopoulos, J. Appl. Electrochem., 1993, 23, 483–486 CrossRef CAS.
- E. Pérez-Gallent, G. Marcandalli, M. C. Figueiredo, F. Calle-Vallejo and M. T. M. Koper, J. Am. Chem. Soc., 2017, 139, 16412–16419 CrossRef PubMed.
- Y. Lum, B. Yue, P. Lobaccaro, A. T. Bell and J. W. Ager, J. Phys. Chem. C, 2017, 121, 14191–14203 CrossRef CAS.
- S. Banerjee, Z.-Q. Zhang, A. S. Hall and V. S. Thoi, ACS Catal., 2020, 10, 9907–9914 CrossRef CAS.
- G. A. El-Nagar, F. Haun, S. Gupta, S. Stojkovikj and M. T. Mayer, Nat. Commun., 2023, 14, 2062 CrossRef CAS PubMed.
- O. Ayemoba and A. Cuesta, ACS Appl. Mater. Interfaces, 2017, 9, 27377–27382 CrossRef CAS PubMed.
- S. Ringe, E. L. Clark, J. Resasco, A. Walton, B. Seger, A. T. Bell and K. Chan, Energy Environ. Sci., 2019, 12, 3001–3014 RSC.
- C. M. Gunathunge, V. J. Ovalle and M. M. Waegele, Phys. Chem. Chem. Phys., 2017, 19, 30166–30172 RSC.
- J. H. Montoya, C. Shi, K. Chan and J. K. Nørskov, J. Phys. Chem. Lett., 2015, 6, 2032–2037 CrossRef CAS PubMed.
- L. D. Chen, M. Urushihara, K. Chan and J. K. Nørskov, ACS Catal., 2016, 6, 7133–7139 CrossRef CAS.
- R. B. Sandberg, J. H. Montoya, K. Chan and J. K. Nørskov, Surf. Sci., 2016, 654, 56–62 CrossRef CAS.
- C. M. Gunathunge, J. Li, X. Li, J. J. Hong and M. M. Waegele, ACS Catal., 2020, 10, 6908–6923 CrossRef CAS.
- G. Hussain, L. Pérez-Martínez, J.-B. Le, M. Papasizza, G. Cabello, J. Cheng and A. Cuesta, Electrochim. Acta, 2019, 327, 135055 CrossRef CAS.
- C. M. Gunathunge, X. Li, J. Li, R. P. Hicks, V. J. Ovalle and M. M. Waegele, J. Phys. Chem. C, 2017, 121, 12337–12344 CrossRef CAS.
- J. A. Rebstock, Q. Zhu and L. R. Baker, Chem. Sci., 2022, 13, 7634–7643 RSC.
- Q. Zhu, S. K. Wallentine, G.-H. Deng, J. A. Rebstock and L. R. Baker, JACS Au, 2022, 2, 472–482 CrossRef CAS PubMed.
- T. C. Chou, C. C. Chang, H. L. Yu, W. Y. Yu, C. L. Dong, J. J. Velasco-Vélez, C. H. Chuang, L. C. Chen, J. F. Lee, J. M. Chen and H. L. Wu, J. Am. Chem. Soc., 2020, 142, 2857–2867 CrossRef CAS PubMed.
- X. Wang, Z. Wang, F. P. García de Arquer, C. T. Dinh, A. Ozden, Y. C. Li, D. H. Nam, J. Li, Y. S. Liu, J. Wicks, Z. Chen, M. Chi, B. Chen, Y. Wang, J. Tam, J. Y. Howe, A. Proppe, P. Todorović, F. Li, T. T. Zhuang, C. M. Gabardo, A. R. Kirmani, C. McCallum, S. F. Hung, Y. Lum, M. Luo, Y. Min, A. Xu, C. P. O'Brien, B. Stephen, B. Sun, A. H. Ip, L. J. Richter, S. O. Kelley, D. Sinton and E. H. Sargent, Nat. Energy, 2020, 5, 478–486 CrossRef CAS.
- A. Wuttig, J. Ryu and Y. Surendranath, J. Phys. Chem. C, 2021, 125, 17042–17050 CrossRef CAS.
- C. M. Gunathunge, V. J. Ovalle, Y. Li, M. J. Janik and M. M. Waegele, ACS Catal., 2018, 8, 7507–7516 CrossRef CAS.
- M. Fang, M. Wang, Z. Wang, Z. Zhang, H. Zhou, L. Dai, Y. Zhu and L. Jiang, J. Am. Chem. Soc., 2023, 145, 11323–11332 CrossRef CAS PubMed.
- F. Shao, J. K. Wong, Q. H. Low, M. Iannuzzi, J. Li and J. Lan, Proc. Natl. Acad. Sci. U. S. A., 2022, 119, 1–9 Search PubMed.
- F. Li, A. Thevenon, A. Rosas-Hernández, Z. Wang, Y. Li, C. M. Gabardo, A. Ozden, C. T. Dinh, J. Li, Y. Wang, J. P. Edwards, Y. Xu, C. McCallum, L. Tao, Z.-Q. Liang, M. Luo, X. Wang, H. Li, C. P. O'Brien, C.-S. Tan, D.-H. Nam, R. Quintero-Bermudez, T.-T. Zhuang, Y. C. Li, Z. Han, R. D. Britt, D. Sinton, T. Agapie, J. C. Peters and E. H. Sargent, Nature, 2020, 577, 509–513 CrossRef CAS PubMed.
- C. Zhan, F. Dattila, C. Rettenmaier, A. Bergmann, S. Kühl, R. García-Muelas, N. López and B. R. Cuenya, ACS Catal., 2021, 11, 7694–7701 CrossRef CAS.
- S. K. Shaw, A. Berná, J. M. Feliu, R. J. Nichols, T. Jacob and D. J. Schiffrin, Phys. Chem. Chem. Phys., 2011, 13, 5242–5251 RSC.
- Y. Zhao, X. Chang, A. S. Malkani, X. Yang, L. Thompson, F. Jiao and B. Xu, J. Am. Chem. Soc., 2020, 142, 9735–9743 CAS.
- Z. Sun, M. M. Sartin, W. Chen, F. He, J. Cai and Y. X. Chen, J. Phys. Chem. C, 2019, 123, 21467–21477 CrossRef CAS.
- C. M. Gunathunge, J. Li, X. Li and M. M. Waegele, ACS Catal., 2020, 10, 11700–11711 CrossRef CAS.
- A. Lagutchev, S. A. Hambir and D. D. Dlott, J. Phys. Chem. C, 2007, 111, 13645–13647 CrossRef CAS.
- I. Oda, H. Ogasawara and M. Ito, Langmuir, 1996, 12, 1094–1097 CrossRef CAS.
- H. An, L. Wu, L. D. B. Mandemaker, S. Yang, J. Ruiter, J. H. J. Wijten, J. C. L. Janssens, T. Hartman, W. Stam and B. M. Weckhuysen, Angew. Chem., Int. Ed., 2021, 60, 16576–16584 CrossRef CAS PubMed.
- A. M. Gardner, K. H. Saeed and A. J. Cowan, Phys. Chem. Chem. Phys., 2019, 21, 12067–12086 RSC.
- C. W. Li and M. W. Kanan, J. Am. Chem. Soc., 2012, 134, 7231–7234 CrossRef CAS PubMed.
- J. Salimon, R. M. Hernández-Romero and M. Kalaji, J. Electroanal. Chem., 2002, 538–539, 99–108 CrossRef CAS.
- B. Eren, D. Zherebetskyy, L. L. Patera, C. H. Wu, H. Bluhm, C. Africh, L.-W. Wang, G. A. Somorjai and M. Salmeron, Science, 2016, 351, 475–478 CrossRef CAS PubMed.
- Z.-C. Huang-fu, Q.-T. Song, Y. He, J. Wang, J.-Y. Ye, Z.-Y. Zhou, S.-G. Sun and Z.-H. Wang, Phys. Chem. Chem. Phys., 2019, 21, 25047–25053 RSC.
- F. Li, Y. C. Li, Z. Wang, J. Li, D.-H. Nam, Y. Lum, M. Luo, X. Wang, A. Ozden, S.-F. Hung, B. Chen, Y. Wang, J. Wicks, Y. Xu, Y. Li, C. M. Gabardo, C.-T. Dinh, Y. Wang, T.-T. Zhuang, D. Sinton and E. H. Sargent, Nat. Catal., 2020, 3, 75–82 CrossRef CAS.
- M. B. Ross, C. T. Dinh, Y. Li, D. Kim, P. De Luna, E. H. Sargent and P. Yang, J. Am. Chem. Soc., 2017, 139, 9359–9363 CrossRef CAS PubMed.
- S. Zhu, B. Jiang, W.-B. Cai and M. Shao, J. Am. Chem. Soc., 2017, 139, 15664–15667 CrossRef CAS PubMed.
- D. Ren, B. S.-H. Ang and B. S. Yeo, ACS Catal., 2016, 6, 8239–8247 CrossRef CAS.
- J. de Ruiter, H. An, L. Wu, Z. Gijsberg, S. Yang, T. Hartman, B. M. Weckhuysen and W. van der Stam, J. Am. Chem. Soc., 2022, 144, 15047–15058 CrossRef CAS PubMed.
- S. Jiang, K. Klingan, C. Pasquini and H. Dau, J. Chem. Phys., 2019, 150, 041718 CrossRef PubMed.
- Y. Hori, O. Koga, H. Yamazaki and T. Matsuo, Electrochim. Acta, 1995, 40, 2617–2622 CrossRef CAS.
- S. D. Fried and S. G. Boxer, Acc. Chem. Res., 2015, 48, 998–1006 CrossRef CAS PubMed.
- A. Föhlisch, M. Nyberg, J. Hasselström, O. Karis, L. G. M. Pettersson and A. Nilsson, Phys. Rev. Lett., 2000, 85, 3309–3312 CrossRef PubMed.
- P. Grosse, A. Yoon, C. Rettenmaier, A. Herzog, S. W. Chee and B. Roldan Cuenya, Nat. Commun., 2021, 12, 6736 CrossRef CAS PubMed.
- G. H. Simon, C. S. Kley and B. Roldan Cuenya, Angew. Chem., Int. Ed., 2021, 60, 2561–2568 CrossRef CAS PubMed.
- Y. Yang, S. Louisia, S. Yu, J. Jin, I. Roh, C. Chen, M. V. Fonseca Guzman, J. Feijóo, P.-C. Chen, H. Wang, C. J. Pollock, X. Huang, Y. Shao, C. Wang, D. A. Muller, H. D. Abruña and P. Yang, Nature, 2023, 614, 262–269 CrossRef CAS PubMed.
- M. Dunwell, X. Yang, Y. Yan and B. Xu, J. Phys. Chem. C, 2018, 122, 24658–24664 CrossRef CAS.
- H. Bai, T. Cheng, S. Li, Z. Zhou, H. Yang, J. Li, M. Xie, J. Ye, Y. Ji, Y. Li, Z. Zhou, S. Sun, B. Zhang and H. Peng, Sci. Bull., 2021, 66, 62–68 CrossRef CAS PubMed.
- S. J. Raaijman, N. Arulmozhi and M. T. M. Koper, ACS Appl. Mater. Interfaces, 2021, 13, 48730–48744 CrossRef CAS PubMed.
- D. Gao, I. Sinev, F. Scholten, R. M. Arán-Ais, N. J. Divins, K. Kvashnina, J. Timoshenko and B. Roldan Cuenya, Angew. Chem., Int. Ed., 2019, 58, 17047–17053 CrossRef CAS PubMed.
- R. M. Arán-Ais, D. Gao and B. Roldan Cuenya, Acc. Chem. Res., 2018, 51, 2906–2917 CrossRef PubMed.
Footnote |
| † Electronic supplementary information (ESI) available. See DOI: https://doi.org/10.1039/d3sc05295h |
| This journal is © The Royal Society of Chemistry 2024 |