
 Open Access Article
 This Open Access Article is licensed under a Creative Commons Attribution-Non Commercial 3.0 Unported Licence
Single-molecule electrochemical imaging resolves the midpoint potentials of individual fluorophores on nanoporous antimony-doped tin oxide†
Jin
Lu‡
 *ab and
Matthew D.
Lew
*ab
*ab and
Matthew D.
Lew
*ab
aPreston M. Green Department of Electrical and Systems Engineering, McKelvey School of Engineering, Washington University in St. Louis, St. Louis, MO 63130, USA. E-mail: luj@nanoctr.cn; mdlew@wustl.edu
bInstitute of Materials Science and Engineering, Washington University in St. Louis, St. Louis, MO 63130, USA
First published on 29th December 2023
Abstract
We report reversible switching of oxazine, cyanine, and rhodamine dyes by a nanoporous antimony-doped tin oxide electrode that enables single-molecule (SM) imaging of electrochemical activity. Since the emissive state of each fluorophore is modulated by electrochemical potential, the number of emitting single molecules follows a sigmoid function during a potential scan, and we thus optically determine the formal redox potential of each dye. We find that the presence of redox mediators (phenazine methosulfate and riboflavin) functions as an electrochemical switch on each dye's emissive state and observe significantly altered electrochemical potential and kinetics. We are therefore able to measure optically how redox mediators and the solid-state electrode modulate the redox state of fluorescent molecules, which follows an electrocatalytic (EC′) mechanism, with SM sensitivity over a 900 μm2 field of view. Our observations indicate that redox mediator-assisted SM electrochemical imaging (SMEC) could be potentially used to sense any electroactive species. Combined with SM blinking and localization microscopy, SMEC imaging promises to resolve the nanoscale spatial distributions of redox species and their redox states, as well as the electron transfer kinetics of electroactive species in various bioelectrochemical processes.
Introduction
Electron transfer is a fundamental process in all living systems that governs various energy-conversion pathways, such as photosynthesis and respiration. In these systems, redox proteins, small molecules, and their assemblies are delicately arranged to transfer electrons down an energy gradient.1,2 For example, in the bacterial extracellular electron transfer (EET) process, outer membrane c-type cytochromes and extracellular appendages facilitate electron transfer out of the cell to insoluble electron acceptors.3,4 At the molecular level, each electron transfer step only spans up to a few nanometers, from one donor molecule to an acceptor in its vicinity. Thus, living systems must organize these molecules, each with distinct electrochemical properties and biochemical functions, within complex biochemical environments, such as biomembranes and cellular compartments.Resolving and imaging such electron transfer activities at the nanoscale has drawn much attention recently and is usually accomplished by reducing the size of an electrode, for instance using a nanoelectrode, and scanning it across a sample or leveraging nanoelectrode arrays. El-Naggar and Naaman reported measuring the spin-dependent electron transport of single decaheme cytochrome conduits by using magnetic conductive probe atomic force microscopy.5 Lovely reported visualizing the charge flow in individual pili proteins with electrostatic force microscopy.6 Tao demonstrated a break junction technique to measure individual single-molecule oxidation and reduction events in electrochemical scanning tunneling microscopy.7 However, raster-scanning a nanoscale electrode limits imaging speed, and thus, it remains challenging to measure single-electron transfer events across a large field of view.
We propose that redox-responsive fluorescent molecules can locally sense target redox reactions or biological electron transfer processes and report them remotely, often amplifying the few electrons involved in a target reaction into thousands or more fluorescence photons to be detected by a single-molecule (SM) fluorescence microscope; we term this approach SM electrochemical (SMEC) imaging. Various fluorogenic probes have been developed to image redox species8–10 or protein adducts11 within cells. Further characterizations of the potential dependance of SM redox activity have enabled the development of fluorescence-based single-molecule electrochemistry.12–18
Despite recent progress, several challenges remain in using redox-active probes to image electron transfer in living systems, for example, through multiheme cytochromes or pili structures. First, an appropriate electrode interface that is compatible with SM fluorescence imaging is needed. Transparent conducting oxides, especially indium tin oxide (ITO), play a key role in optical studies of electrochemical activity. Various transparent electrodes, such as silicon carbide,19 amorphous silicon,20 and porous ITO21,22 have been reported for general electrochemical and optical microscopy applications. However, to image and track single fluorophores optically, it is critical to (at least temporarily) immobilize the target molecules by covalent binding,23 trapping them within a polymer film,13 or hindering their diffusion.14 We have previously demonstrated14 that a 100 nm-thick, porous silica layer on ITO is useful for capturing electrochemical transformations of single resorufin molecules. However, the nonconducting silica layer impedes any electrical interface with the redox bio(macro)molecules of interest. An alternative conductive and transparent electrode material, antimony-doped tin oxide (ATO), with tunable pore sizes has been developed recently.24,25 Porous ATO shows excellent biocompatibility to immobilize redox biomolecules and monitor their electron transfer behaviors.26
Second, a handful of redox responsive dyes and electrofluorogenic probes, including methylene blue, cresyl violet, fluorescein, resazurin/resorufin, and Nile blue, have been widely used by spectroelectrochemists for decades.27,28 Many were originally developed for staining in biology and histology, rather than for localization microscopy with optimized switching rates and photostability. On the other hand, a large number of novel fluorescent probes, such as ATTO, Alexa Fluor, CF, and iFluor, demonstrate superior SM imaging with enhanced brightness and excellent photostability.29 Most of them, if their chemical structures are disclosed, bear the core structures of the oxazine, cyanine, or rhodamine families, which are known to be redox responsive. As reported by Gooding23 and Tinnefeld,30 the reversible on–off switch of the cyanine Alexa Fluor 647 and the oxazine ATTO 655 can be controlled by electron transfer reactions. Thus, these bright and stable dyes could be excellent SMEC probes.
Perhaps most importantly, quantitative SMEC imaging of the redox activities or electron transfer processes of biomolecules requires interactions between redox dyes, target redox biomolecules, and the electrode to be carefully measured. One can imagine that, with proper calibration, imaging the electrochemical switching of a single dye can aid in measuring local redox potential, electron transfer kinetics, or concentration of reduced/oxidized forms of the target redox biomolecule, all with nanoscale resolution. Thus, quantitatively characterizing the switching of redox-active fluorophores on a suitable transparent electrode is essential for realizing the potential of SMEC imaging.
In this work, we demonstrate SMEC imaging enabled by a transparent nanoporous ATO electrode and redox-active dyes from the oxazine, cyanine, and rhodamine families. We investigate the on–off switching of these dyes in response to applied potential and characterize their electrochemical responses at the SM level. We focus on how on–off fluorescence switching is modulated in the presence of redox mediators, including phenazine methosulfate and riboflavin, which are known to facilitate extracellular electron transfer processes in microorganisms, and discuss the underlying mechanisms. Critically, we show that imaging SMEC probes produces spatial maps of midpoint potential and quantifies the spatial heterogeneity of electron-transfer processes on porous ATO surfaces.
Results and discussion
nATO film confines the diffusion of single fluorescent probes
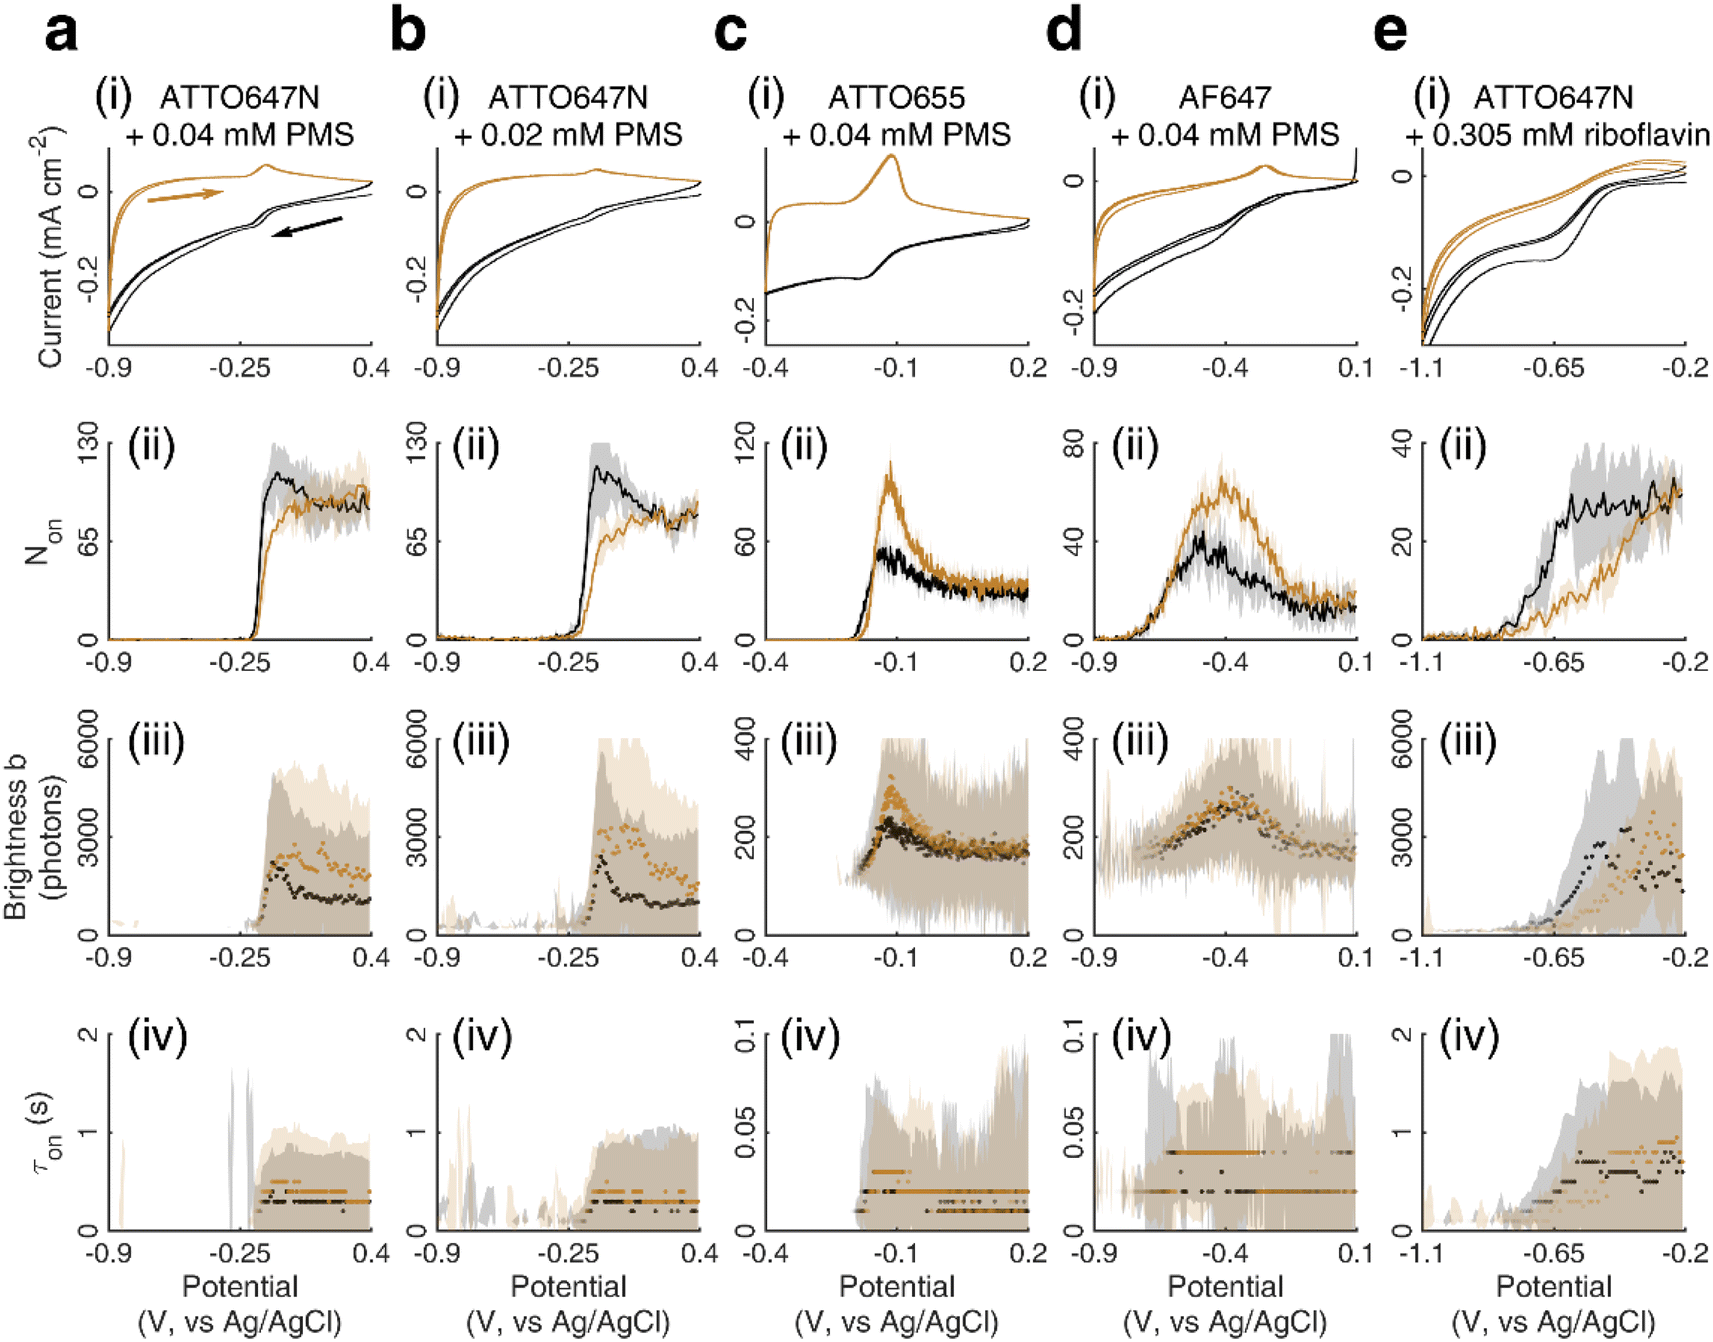
As demonstrated previously,14 slowing the diffusion of fluorescent molecules is essential to resolve them optically with SM sensitivity. We synthesized nanoporous antimony-doped tin oxide (nATO) films on ITO coverslips using a sol–gel method31 (Experimental section). The nATO coating is optically transparent and electrically conductive with a high surface area (Fig. S1†). Fluorescent probes diffuse slowly or become trapped within the pores so that they are clearly resolved by a camera compared to an unmodified bare ITO surface (Fig. S2†).We tested three probes from major chemical families, including ATTO655 (an oxazine dye), AF647 (a cyanine), and ATTO647N (a carbo-rhodamine), on the nATO-coated ITO coverslip. The probes exhibited distinct binding affinities and photobleaching rates. During our image analysis procedure, localizations were removed if their measured point-spread function widths were unreliable or if their brightness was too dim to avoid artifacts caused by diffusing or dim SMs (see Experimental). By measuring the position and duration of each SM fluorescence blinking event, we calculate average fluorescence burst durations (or “on-times” τon) of 8.4 ms for ATTO655, 22 ms for AF647, and 68 ms for ATTO647N (Fig. S3†). The exposure time used for each probe (ATTO655: 10 ms, AF647: 20 ms, ATTO647N: 100 ms) was adjusted to best match each τon accordingly, allowing us to capture more photons from each molecule within each frame and reduce the noise in each measurement.
Electrochemical modulation of single fluorescent probes
We chose to investigate the fluorescence responses of ATTO and Alexa Fluor dyes (Scheme 1), which are known for high brightness and excellent photostability, to various applied electrochemical potentials. We first modulated the potential of the nATO electrode between 0 V and −0.8 V in the presence of ATTO655. During the forward scan, shown in Fig. 1a(i), the number of ATTO655 molecules emitting fluorescence in each frame (Non) significantly decreases as the potential drops below −0.4 V, where ATTO655 is reduced to its nonfluorescent form. ATTO655 accepts one electron to form a nonfluorescent (semireduced) radical state at a potential of Ered = −0.42 V (vs. SCE, or −0.38 V vs. Ag/AgCl, sat'd KCl).32 As the potential continues to decrease, the dissolved molecular oxygen (Ered < −0.44 V vs. SCE) is depleted, and ATTO655 is likely to accept a second electron to form a leuco-dye.33 Both the radical and leuco forms of ATTO655 are nonfluorescent, and we observed a consistent low number of active ATTO655 molecules (1.0 ± 1.0 (mean ± std) in one field of view) at potentials below −0.7 V. However, we cannot distinguish between the two nonfluorescent forms directly from imaging. The reduction of ATTO655 is electrochemically reversible. During the reverse scan, as potential sweeps above −0.4 V, fluorescent ATTO655 molecules reappear, indicating the transition of ATTO655 from its dark states (radical and leuco-dye) to its fluorescent state.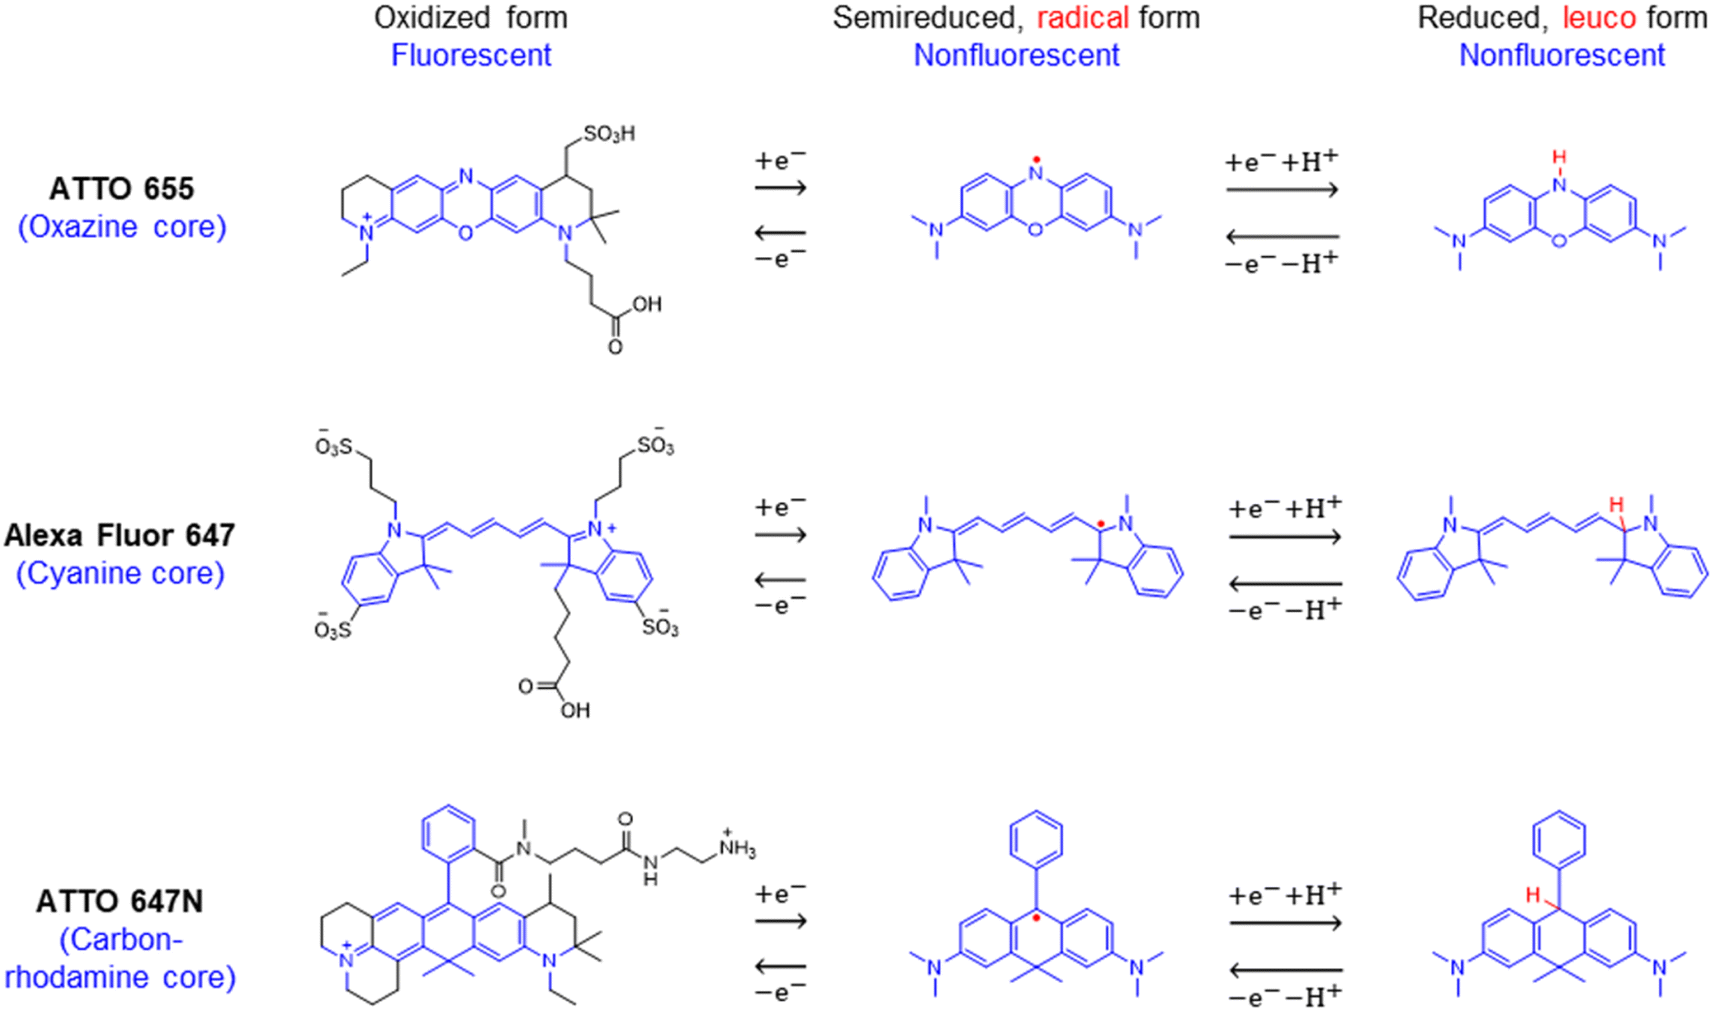 | ||
| Scheme 1 Chemical structures and reversible electrochemical redox reactions of ATTO 655,33,34 Alexa Fluor 647,23 and ATTO 647N.35,36 Their core structures (belonging to the oxazine, cyanine, and rhodamine families, respectively) and corresponding redox reactions are highlighted in blue. Note: (i) possible side reactions, such as the reactions between the radical/leuco-dyes with molecular oxygen,33 are not drawn here; (ii) nonfluorescent reduced dyes may contain either or both radical or/and leuco forms under our electrochemical reduction conditions. | ||
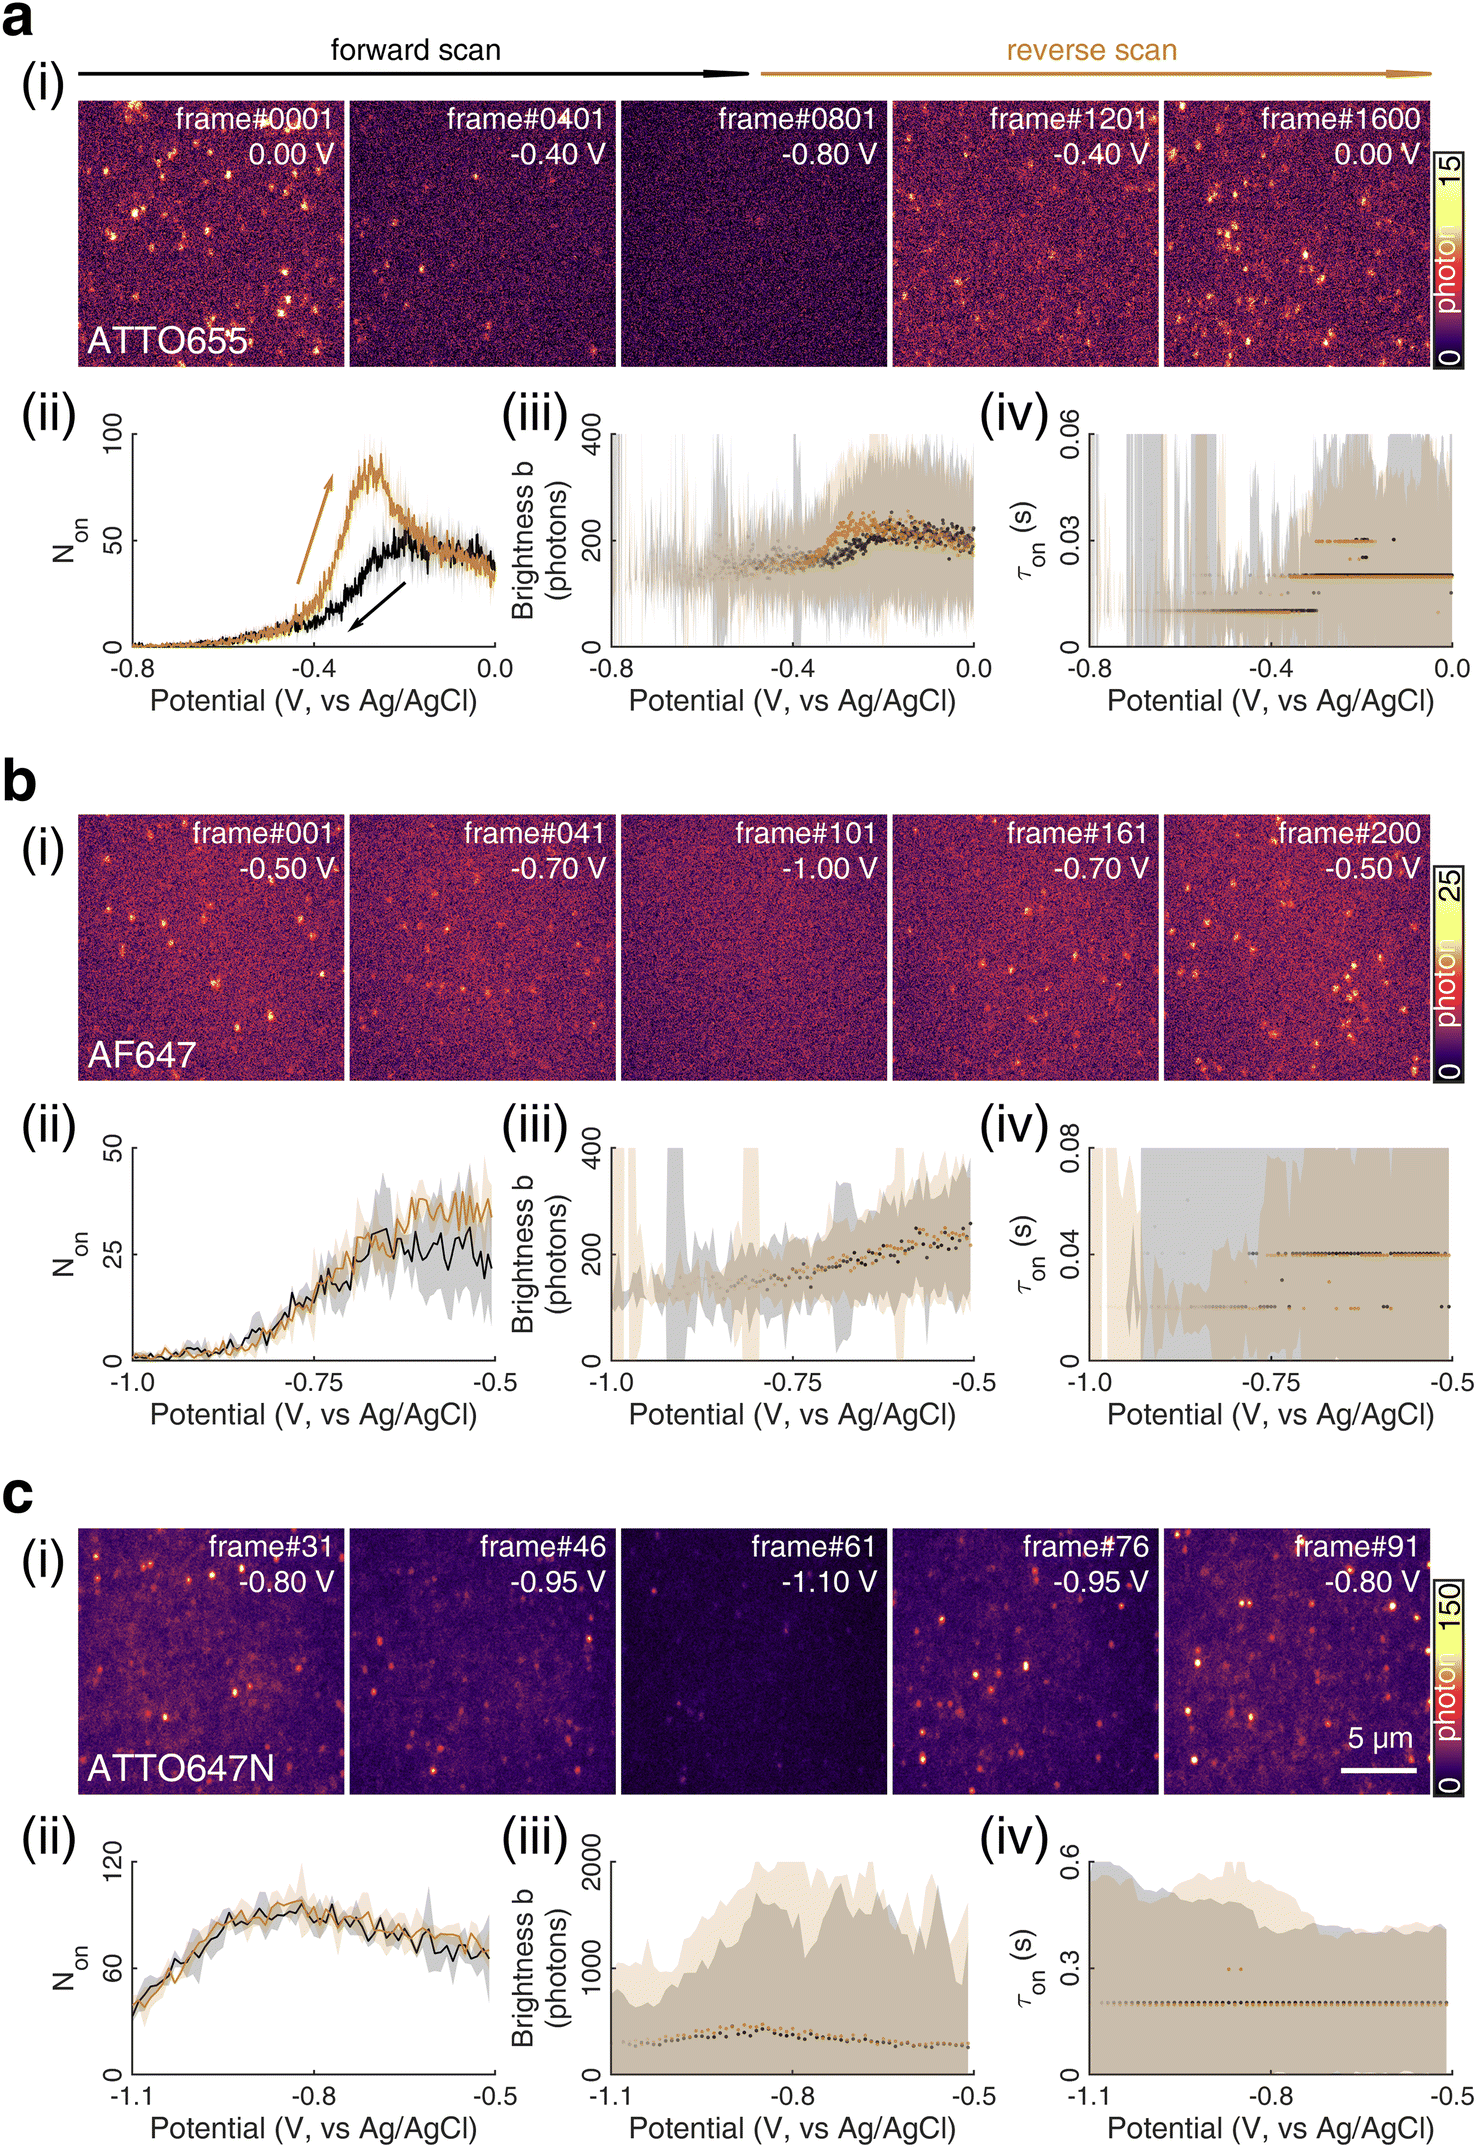 | ||
| Fig. 1 (i) SMEC imaging of (a) ATTO655, (b) AF647, and (c) ATTO647N dye molecules on nanoporous ATO (nATO) films in 1 M NaNO3 solution while sweeping the applied electrochemical potential (see Movies S1–S3† for full videos). The (ii) number Non, (iii) brightness b, and (iv) duration τon of single-molecule fluorescence bursts captured during the potential sweeps. The (ii) solid line and (iii and iv) dots represent the median values and the shaded areas represent ± one standard deviation of response over three full sweep cycles. Black and dark yellow trajectories represent the forward and reverse scans, respectively. Scale bar: 5 μm. | ||
Over 3 repeated scan cycles, Fig. 1a(ii) shows the changes in the number Non of detected (bright) ATTO655 molecules as a function of the applied potential, where the solid line represents the average response. The shaded area is the standard deviation of Non over the 3 cycles. These data indicate that, across multiple scans, the nATO electrode facilitates electron transfer to and from ATTO655 and that the fluorescence bursts of single ATTO655 effectively and reproducibly indicate its redox state. Note that, during the reverse scan, Non recovers to a spike (82.5 ± 4.2 molecules) that is almost twice the Non in the forward scan (48.5 ± 4.6 molecules), before it decays to a level consistent with the forward scan at 0 V. The spike is most likely caused by the reappearance of molecular oxygen in the diffusion layer during the reverse scan that chemically quenches the dark state of leuco-ATTO655.33
Here, we only consider the electrochemical process induced by external potential modulation. We assume the ATTO655 probe (dyeox) and its nonfluorescent reduced form (dyered) have the same adsorption affinity toward the nATO surface, and the total concentration of ATTO655 probe on the electrode is constant ([dyeox] + [dyered] = c). The ratio of fluorescent to nonfluorescent ATTO655 follows the Nernst equation:
 | (1) |
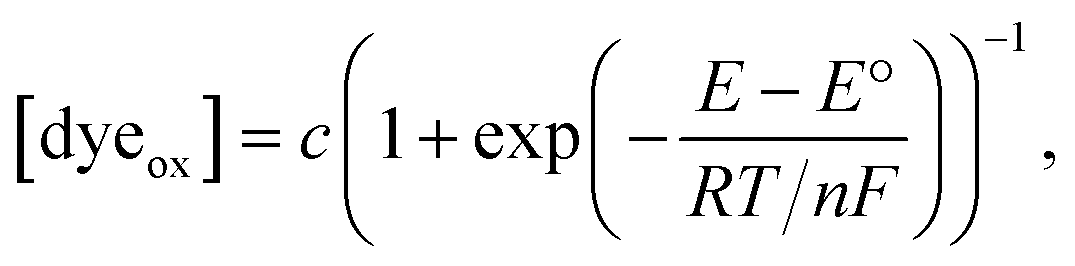 | (2) |
 which matches the reported value.32 However, the redox current from nM concentrations of dyes cannot be detected in conventional CV measurements (Fig. S4†).
We further analyze the brightness b of the molecules in each image stack, quantified as the number of photons detected from each ATTO655 molecule in each frame. On average, we observed b = 243.5 ± 139.3 photons (median ± 1 std dev.) emitted from each ATTO655 molecule at oxidizing potentials (>−0.1 V). As the applied potential decreases in the forward scan, the probability of ATTO655 to be reduced to its radical and leuco forms increases, resulting in decreased brightness b and shorter fluorescence burst durations τon. When Non approaches zero at potentials below −0.6 V, we only observed 2 or 3 molecules per field of view randomly adsorbed on the nATO surface, where heterogeneous electron transfer at these “inert” locations is blocked, even at such low potentials. Since these few “long-lived” molecules may not appear at identical potentials in subsequent scans, the statistics (median, std) of b and τon are noisy (see shaded areas in Fig. 1a(iii) and (iv) below −0.6 V). In the reverse scan, the singlet state of the fluorophore is electrochemically restored. We observe recovered Non, b, and τon values accordingly (Fig. 1a(ii)–(iv)).
We also performed SMEC imaging of AF647 and ATTO647N while scanning the potential applied to the nATO electrode. Both AF647 and ATTO647N exhibit negative redox potentials ( and
and  ), which we measured by fitting Non data to applied potentials using a sigmoid function (eqn (2)). AF647 and ATTO647N are likely to accept one electron and form nonfluorescent semireduced radicals at negative potentials33 and to be oxidized back into a fluorescent form in the reverse scan. Their electrochemical responses (Non, b, τon) are reversible across multiple scan cycles (Fig. 1b(ii)–(iv) and c(ii)–(iv)). Note that we did not sweep the potential below −1.10 V to avoid possible electrochemical damage of the nATO–ITO electrode. At −1.10 V, there are still more than 39% ATTO647N molecules left in the on state (91.9 ± 7.0 molecules between −0.80 V and −0.90 V vs. 36.0 ± 4.9 molecules at −1.10 V, Fig. 1c(ii)), but Non should decrease further for more negative potentials. Scanning the potential at different rates reveals that SMEC processes on nATO follow diffusion-controlled electrochemical kinetics for ATTO655, AF647, and ATTO647N (Fig. S5†).
Imaging electrochemical modulation by redox mediators with high sensitivity
We further studied how the redox behaviors of single fluorescent probes are modulated by two redox mediators, phenazine methosulfate (PMS) and riboflavin. PMS is a widely used redox cycler that accepts electrons from enzymes and reduces oxygen, cytochrome c, and other redox biomolecules. It is also known to promote the EET processes between bacteria and electrodes.37,38 As a redox mediator, PMS undergoes single- or two-electron reduction to form the free radical PMS or reduced PMSH, respectively (Fig. S6a†).By mixing 0.04 mM PMS with ATTO647N in 1 M NaNO3, we observed a pair of reversible redox peaks in cyclic voltammetry that correspond to the two-electron redox reaction of PMS with the formal potential EPMS/PMSH = −0.16 V on the nATO electrode (Fig. 2a(i)). Interestingly, in the presence of PMS, ATTO647N is reduced to its nonfluorescent form at a more positive potential (Fig. 2a(ii)) relative to when PMS is absent (Fig. 1c(ii)). After averaging the Non trajectories from three scan cycles and fitting to a sigmoid function (eqn (2)), we calculated the midpoint potential of ATTO647N reduction in the presence of PMS to be EATTO647N(PMS) = −0.14 V. This value is close to EPMS/PMSH (−0.16 V) and much more positive than  (−1.02 V). We also noticed that during the forward scan, near EATTO647N(PMS), the number Non, brightness b, and fluorescence burst duration τon of ATTO647N all sharply drop to zero (Fig. 2a(ii)–(iv)). For example, by counting Non, there are 88.8 ± 3.6 (mean ± std) ATTO647N molecules in the potential range of 0.40 V to 0.20 V, with a significant drop to 0.1 ± 0.1 molecules between −0.70 V and −0.90 V where ATTO647N is reduced. In contrast, without PMS, more than 39% of the ATTO647N molecules remain bright at −1.10 V (Fig. 1c(ii)).
 | ||
| Fig. 2 (i) Cyclic voltammetry of (a) ATTO647N with 0.04 mM PMS, (b) ATTO647N with 0.02 mM PMS, (c) ATTO655 with 0.04 mM PMS, (d) AF647 with 0.04 mM PMS, and (e) ATTO647N with 0.305 mM riboflavin, all in 1 M NaNO3. The corresponding (ii) number Non, (iii) brightness b, and (iv) duration τon of single-molecule fluorescence bursts captured during the potential sweep. (ii) Solid lines and (iii and iv) dots represent the median values and the shaded areas represent ± one standard deviation of response over three full sweep cycles. Black and dark yellow trajectories represent the forward and reverse scans, respectively. | ||
As the PMS concentration decreases to 0.02 mM, the redox CV current peaks diminish. For example, the cathodic current peak drops from 15 μA cm−2 for 0.04 mM PMS to 4 μA cm−2 for 0.02 mM PMS (Fig. 2a(i) and b(i)). However, we still observe a large positive-shifted midpoint potential for ATTO647N reduction (EATTO647N(PMS) = −0.15 V, Fig. 2b(ii)) that is quite similar to the 0.04 mM PMS condition (Fig. 2a(ii)). This consistency in midpoint potentials measured from the Non trajectories suggests that even trace concentrations of redox mediators should be detectable by SMEC, well beyond conditions where the electrochemical current becomes undetectable.
We further conducted SMEC imaging of ATTO655 and AF647 in the presence of 0.04 mM PMS (Fig. 2c and d). The midpoint potentials, obtained by fitting the Non responses to sigmoid functions (eqn (2)), showed the same trend as did ATTO647N. The calculated potentials are EATTO655(PMS) = −0.16 V and EAF647(PMS) = −0.61 V, both more positive than the redox potentials of the dyes without PMS 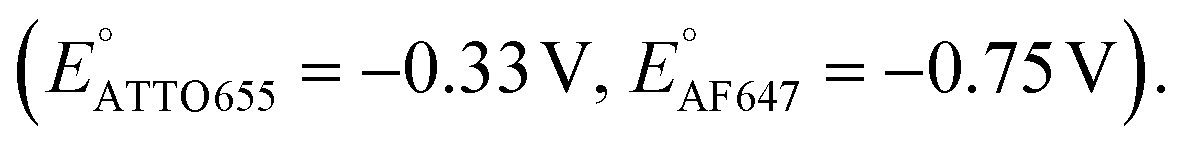
We next studied SMEC imaging in the presence of a second mediator, riboflavin. Riboflavin is a precursor of many important coenzymes (such as flavin mononucleotide and flavin adenine dinucleotide) that participate in various essential redox reactions in living systems. It is also a self-secreted redox shuttle that facilitates electron transport processes in Shewanella.39,40 Riboflavin undergoes two-electron reduction to form reduced riboflavin (Fig. S6b†), and this process is electrochemically quasi-reversible (−0.419 V, vs. Ag/AgCl) on a glassy carbon electrode.41 On an nATO electrode, we observed a reduction wave of riboflavin with the cathodic peak potential at Erbf(pc) = −0.67 V (pc: cathodic peak, Fig. 2e(i)). Thus, a high overpotential is necessary to reduce riboflavin on the nATO surface.
When modulating the potential of a mixture of ATTO647N and 0.305 mM riboflavin, we observed a decrease in Non during the forward scan. Fitting the data to a sigmoid function (eqn (2)) yields a midpoint (cathodic) potential EATTO647N(rbf) of −0.69 V. This potential is higher than  and is close to Erbf(pc), thereby matching the trend observed with PMS. However, we observed the electrochemical reduction of riboflavin to be irreversible, with no oxidation current wave; the number Non of detected ATTO647N recovers very slowly and increases nearly linearly from zero to its original level while the potential is scanned from −0.8 V to −0.2 V. This response (Fig. 2e(ii)) is remarkably different from the off–on switch of ATTO647N in the presence of the reversible mediator PMS (Fig. 2a(ii)). Sigmoid function (eqn (2)) fits of the data in Fig. 1 and 2 are shown in Fig. S7.†
Mediators fully convert dye molecules to their dark state at positive-shifted potentials
With the mediators PMS and riboflavin present, we observed each SMEC probe to have a significantly shifted redox potential relative to when the mediators are absent, which implies that dye reduction is highly coupled to the electrochemistry of nearby mediators in solution (for example, PMS/PMSH). This process follows an electrocatalytic (EC′) reaction mechanism as shown below.| O + ne− ↔ R | (3) |
 | (4) |
In this process, PMS (O) is first reduced to PMSH (R), which further converts active ATTO647N, ATTO655, or AF647 (A) to its nonfluorescent dark form (D) and regenerates PMS (O). The electrochemical behaviors of EC′ mechanism are well-studied.42 When the homogeneous rate constant kf2 is large and the dye molecule concentration is much lower than the mediators ([A] ≪ [O]), the redox potential for reaction (4) (ED,2) is described by
 | (5) |
We next compare the performance of PMS-mediated reduction on the three dyes. We estimate the concentration ratios of the three dyes to be [ATTO647N]![[thin space (1/6-em)]](https://www.rsc.org/images/entities/char_2009.gif) :[ATTO655]:[AF647] = 7.0:2.4:1.0 by measuring Non within the initial 200 mV of each forward scan (Fig. 2a(ii), c(ii), d(ii) and S8†). The experiments were carried out with a fixed PMS concentration (0.04 mM) and scan rate (100 mV s−1). The redox potential of AF647 is the most negative or the least shifted of the three dyes, indicating that the rate constant kf2 of PMS-mediated AF647 reduction is much less than that of ATTO647N or ATTO655. The calculated rate constant ratio is kf2,ATTO647N/PMS:kf2,ATTO655/PMS:kf2,AF647/PMS = 1.0:0.27:2.6 × 10⁻⁹.
:[ATTO655]:[AF647] = 7.0:2.4:1.0 by measuring Non within the initial 200 mV of each forward scan (Fig. 2a(ii), c(ii), d(ii) and S8†). The experiments were carried out with a fixed PMS concentration (0.04 mM) and scan rate (100 mV s−1). The redox potential of AF647 is the most negative or the least shifted of the three dyes, indicating that the rate constant kf2 of PMS-mediated AF647 reduction is much less than that of ATTO647N or ATTO655. The calculated rate constant ratio is kf2,ATTO647N/PMS:kf2,ATTO655/PMS:kf2,AF647/PMS = 1.0:0.27:2.6 × 10⁻⁹.
Both dye and mediator structures affect electrochemical dark-state switching
During electrochemical reduction, the Non trajectories drop at various rates as the applied potential decreases (Fig. 2a–e(ii)). The slopes of these Non trajectories are quantified by fitting them to sigmoid functions (eqn (2)), and the measurements are summarized in Table 1.| Dyes and mediators | Number Non of detected fluorescent moleculesa | Molecule brightness, ba |
|
|
|---|---|---|---|---|
| Midpoint potential, E (V) | Slope, k (V−1) | Midpoint potential, E (V) | ||
a
N
on and b trajectories are fit to the sigmoid function  where E is the midpoint potential and k is the slope. Fitting was performed for the forward (cathodic) scan only, and the fitting parameters are reported as median ± 1 std dev. of three successive scans. where E is the midpoint potential and k is the slope. Fitting was performed for the forward (cathodic) scan only, and the fitting parameters are reported as median ± 1 std dev. of three successive scans.
|
||||
| ATTO655 | −0.314 ± 0.007 | 34.2 ± 4.4 | −0.255 ± 0.012 | +59 |
| ATTO655 + 0.04 mM PMS | −0.170 ± 0.002 | 121.0 ± 12.9 | −0.157 ± 0.004 | +13 |
| AF647 | −0.755 ± 0.027 | 24.0 ± 7.6 | −0.642 ± 0.038 | +113 |
| AF647 + 0.04 mM PMS | −0.628 ± 0.010 | 24.6 ± 10.7 | −0.533 ± 0.009 | +95 |
| ATTO647N | −1.073 ± 0.009 | 19.2 ± 4.1 | −0.982 ± 0.030 | +91 |
| ATTO647N + 0.04 mM PMS | −0.148 ± 0.008 | 91.0 ± 15.0 | −0.125 ± 0.010 | +23 |
| ATTO647N + 0.02 mM PMS | −0.164 ± 0.003 | 70.7 ± 8.5 | −0.131 ± 0.004 | +33 |
| ATTO647N + 0.305 mM riboflavin | −0.666 ± 0.049 | 30.8 ± 22.2 | −0.574 ± 0.038 | +92 |

For the cases of dye reduction without PMS, the slopes estimated from Non trajectories (34.2 V−1, 24.0 V−1, and 19.2 V−1 for ATTO655, AF647, and ATTO647N, respectively) are much smaller than the theoretical values (nF/RT = 77.9 V−1, if we assume they all undergo 2-electron transfer processes, eqn (2)). We hypothesize that these shallower responses stem from averaging the electrochemical responses of many dyes, which sense heterogeneities in the nATO itself. That is, each dye molecule may have a different electrochemical interface with the nATO electrode, due to its complex structure, thereby yielding different effective midpoint potentials E for each molecule. Taking an ensemble average over these responses would result in a shallower slope k than would be expected from a uniform Nernstian electrochemical interface.
Adding PMS consistently causes a steeper slope in Non as the applied potential drops, and among the three probes, ATTO647N and ATTO655 show much steeper drops during the forward scan compared to AF647 (Fig. 2a, c, d(ii) and Table 1, concentration of PMS is held constant). These observations are consistent with the larger rate constants kf2 for ATTO647N and ATTO655 reduction. In this scenario, dye molecules on the electrode are transformed rapidly, and the process of dye molecules diffusing from bulk solution to adsorb to the nATO surface becomes rate-limiting. Therefore, for higher rates kf2, the number Non of bright molecules decreases much faster at the same applied potential, resulting in larger slopes.
We further map the spatial distribution of midpoint potential for redox dyes along the nATO surface, both in the absence and presence of mediators (Fig. 3a and b). We notice obvious spatial variations in the ATTO655 midpoint potential map, especially in the forward scan, and two spots with low midpoint potentials in particular (see arrows in Fig. 3a and c and the discussion in Fig. S9†), compared to the ATTO655 + PMS map (Fig. 3b). The measured low midpoint potentials may indicate regions where the electron-transfer process is unfavorable between the SMEC probes and the nATO electrode, resulting in large overpotentials. On the other hand, PMS, as a mediator, greatly promotes electron transfer through the electrocatalytic (EC′) mechanism. In SMEC imaging, it not only shifts the midpoint potential of ATTO655 on–off switching toward the positive direction (Fig. 3c), but also produces much more uniform dye reduction maps. Therefore, the activity of PMS or other mediators that similarly promote kf2 are readily distinguishable by characterizing the redox transformation of single fluorophores in SMEC imaging. Given a suitably active mediator, spatial heterogeneities of electron transfer on nATO are potentially eliminated, enabling consistent quantification of mediator activity across a large field of view with single-molecule sensitivity. We therefore believe that nanoscale variations in redox activity should be resolvable from midpoint potential maps in the future.
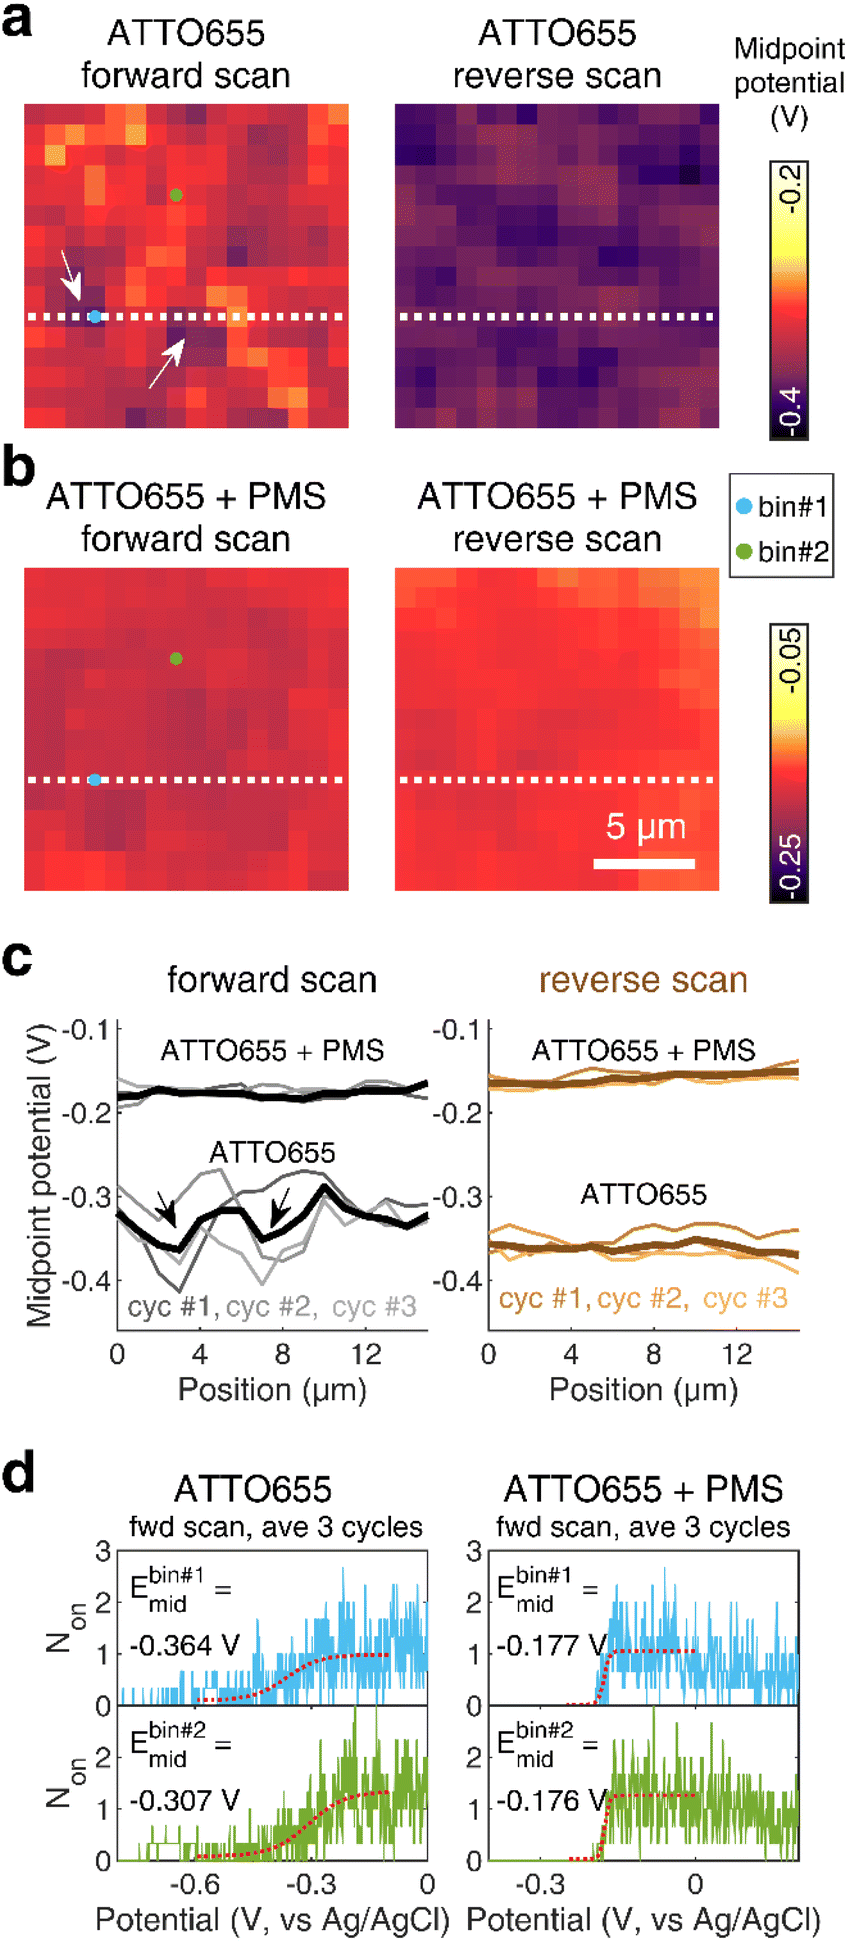 | ||
| Fig. 3 Midpoint potential maps calculated from forward and reverse potential scans of ATTO655 (a) without and (b) with 0.04 mM PMS. Bin size: 1 × 1 μm2. Scale bar: 5 μm. (c) Line profiles indicate fluctuations of the midpoint potential along a 1 × 16 μm2 region (white dotted line as shown in (a and b)) on the nATO surface. Thick solid lines are midpoint potentials extracted from averaged Non trajectories across three scan cycles and thin solid lines represent the data of each scan cycle. White arrows in (a) and black arrows in (c) indicate two representative regions exhibiting relatively low midpoint potentials. (d) The raw Non responses of two representative 1 × 1 μm2 bins (indicated by blue dot for bin #1 and green dot for bin #2 in (a and b)) from the average of three forward scan cycles (blue profiles for bin #1 and green profiles for bin #2). The red dotted profiles represent the fitting to a sigmoid function, from which the midpoint potentials are extracted. | ||
Fluorescence emission decreases during redox transformation
As long as a molecule is detectable above background, the number Non of detected fluorescent molecules in SM imaging is independent of the number of photons collected from each molecule. Overall, the SM brightness b trajectories fluctuate during the potential scans. Interestingly, fluorescence emission from these probes dims when the sweeping potential approaches the formal potential of a dye or its formal potential with mediators present (ED,2), before they are fully converted to their nonfluorescent form (Fig. 1a(iii)–c(iii) and 2a–e(iii)). The brightness trajectories also follow sigmoidal shapes, but the midpoint potential inferred from the brightness b is always tens of mV more positive than the midpoint potential from the number of molecules Non.
The brightness b, measured for each molecule within each frame, quantifies the number of fluorescence photons collected during a single exposure interval by the detector. For each molecule, this period consists of hundreds to thousands of absorption and emission cycles between the ground state, first excited singlet state, and triplet state. Inspired by works from Tinnefeld,30,44 we hypothesize that, at more negative external applied potentials, a dye is more likely to further switch to a reduced ionic dark state during a fluorescence cycle. However, we currently have insufficient information to propose an exact chemical mechanism. Since dim molecules are still detected above background, the brightness trajectories aways drop earlier during a forward scan (at a more positive potential) than the Non trajectories do. It is therefore not surprising that the difference in midpoint potential  is uniformly positive in our data (Table 1). For example, the difference in midpoint potential
  is +59 mV for ATTO655. In the presence of 0.04 mM PMS, ATTO655 reduction is greatly promoted, and the difference in midpoint potential
  is decreased greatly to +13 mV. In contrast, as 0.04 mM PMS does not efficiently mediate AF647 reduction,
  is only reduced from +113 mV (AF647 only) to +95 mV (AF647 with PMS). The difference in midpoint potential is therefore inversely related to the slope of the number Non trajectory; if the trajectory drops more quickly, the measured difference in midpoint potential between Non and trajectories b is minimized.
Conclusions
We have reported single-molecule electrochemical (SMEC) imaging of oxazine, cyanine, and rhodamine dyes on a nanoporous ATO-coated ITO coverslip. Although the electrochemical current associated with the redox transformations of single dyes is too low to detect, we demonstrated optical measurement of their redox potentials by counting the number of emitting molecules within each frame as the external potential is modulated. More importantly, in the presence of redox mediators, we quantified optically the redox interactions between the dyes and mediators. Their reactions follow the electrocatalytic (EC′) mechanism, with significantly altered electrochemical potential and kinetics compared to direct transformation by the nATO electrode. In particular, the spatiotemporal patterns of fluorescence bursts resolved by SMEC enable us to reconstruct midpoint potential maps that quantify the spatial heterogeneity of electron transfer across the porous ATO surface, which is otherwise hidden in ensemble-averaged measurements.We therefore expect SMEC imaging to have the capability of resolving much more complex electrochemical interactions, rather than solely characterizing the dyes' own redox potentials. For any electroactive species of interest that follow the general scheme of reactions (3) and (4), regardless of whether they are fluorescent or not, it should be possible to “indirectly” sense their electrochemical activities by using SMEC probes, i.e., redox-active fluorophores, with SM sensitivity. Combined with SMLM (single-molecule localization microscopy) techniques, we believe the spatial resolution of SMEC imaging (e.g., that of the midpoint potential map) can be further improved down to the nanoscale, far beyond what is demonstrated here. We are excited by the possibility of probing the spatiotemporal dynamics of redox species and their local concentrations, redox states, and electron transfer kinetics, such as cytochrome or pili-facilitated EET processes in microorganisms45,46 in future work. To achieve this goal, the underlying electrochemical mechanisms driving bright–dark transitions at the SM level need more investigation, although the EC′ mechanism have been well-studied for decades by electrochemical methods. This work, together with additional simulations of SMEC Non responses following the EC′ mechanism, optimization of imaging conditions, and development of robust SMEC imaging standards, will pave the road for studying bioelectrochemical dynamics at the nanoscale with single-molecule sensitivity.
Experimental
Materials
Antimony(III) chloride (SbCl3), tin(IV) chloride pentahydrate (SnCl4·5H2O), polyethylene glycol (Mw = 20000), resorcinol, 37 w/w% formaldehyde solution, epichlorohydrin, mineral oil, sodium nitrate (NaNO3), ATTO 647N amine (ATTO647N), ATTO 655, and Alexa Fluor 647 (AF647) were purchased from Sigma-Aldrich. ITO substrates were obtained from SPI USA (6488-AB, 15–30 Ω cm). Deionized water (>18 MΩ cm) was obtained through a Milli-Q water purification system and used for all aqueous solutions.
Preparation of nanoporous ATO-coated ITO coverslip
In a typical preparation, 12 mg of SbCl3 and 280 mg of SnCl4·5H2O were mixed and dissolved in 1.2 g of absolute ethanol, followed by adding 60 mg of deionized water while stirring. To this solution, 302 mg of polyethylene glycol was added and stirred for at least 30 minutes to fully dissolve. Next, 198 mg of resorcinol and 316 mg of 37 w/w% formaldehyde solution were added, and the solution was stirred for 10 min. Finally, 3.92 g of epichlorohydrin was added to the solution and was stirred further for another 2 min prior to casting onto ITO coverslips.ITO coverslips were first cleaned in an ultrasonicator with methanol for 15 min, followed by sonication with 0.5 M K2CO3 in 2:1 methanol:deionized water mixture for 15 min. The four edges of ITO coverslips were masked with Scotch tape. The precursor solution was then cast onto the ITO coverslip, and the excess was removed immediately. The coatings with ITO coverslips were gently immersed in a bath of mineral oil and kept at room temperature for 24 hours. The mineral oil bath was subsequently heated on a hotplate at 70 °C for 3 days. The ITO coverslips were extracted from the oil bath, rinsed with hexane, and the tape masks were removed. The ITO coverslips with coatings were placed in a furnace and heated at 475 °C for 10 hours for calcination of the ATO coatings.
Single-molecule fluorescence imaging
A home-built microscope47 with a 100× TIRF objective lens (NA 1.50, Olympus, UPLAPO100XOHR) was used to perform imaging. For ATTO647N, ATTO655, and AF647 imaging, a 633 nm laser (Coherent OBIS) with a peak intensity of 5.8 kW cm−2 (for ATTO655, AF647) or 1.7 kW cm−2 (for ATTO647N) and a dichroic beamsplitter (Semrock, Di02-R635) were used. The emission was filtered by a bandpass filter (Semrock, FF01-676/37), and only y-polarized images were captured with the typical integration time (10 ms for ATTO655, 20 ms for AF647, 100 ms for ATTO647N) using an sCMOS camera (Photometrics Prime BSI). The single molecules located within the center region (17.55 × 17.55 μm2) of the image were counted and analyzed in this report.ThunderSTORM,48 an ImageJ plug-in, was first used to detect point-spread function (PSF), or image, of single florescent molecules (SMs) to resolve their positions (x, y coordinates), brightness, and sigma (PSF width) value for each captured frame. Localizations with sigma values smaller than 50 nm or greater than 200 nm or brightness less than 100 photons were discarded to remove artifacts from diffusing and dim SMs.
The external voltage modulation was generated by a potentiostat (Stanford Research Systems, EC301) and applied on the ATO-coated ITO coverslip working electrode with respect to an Ag/AgCl (sat'd KCl) reference electrode. A platinum wire was used as the counter electrode. For SMEC imaging, 1 M NaNO3 was used as supporting electrolyte. The trigger pulses generated by the potentiostat were used to synchronize image acquisition by the sCMOS camera.
Data availability
The data that support the findings of this study are openly available in OSF at https://osf.io/zprjy/, reference number zprjy.Author contributions
JL and MDL conceived the idea and designed the experiments. JL carried out the experiments. JL and MDL wrote the manuscript. All authors commented and reviewed the manuscript and figures.Conflicts of interest
There are no conflicts to declare.Acknowledgements
Research reported in this publication was supported by the US Office of Naval Research Multidisciplinary University Research Initiative (N00014-18-1-2632). The authors acknowledge financial support from Washington University in St. Louis and the Institute of Materials Science and Engineering for the use of instruments and assistance by Dr Huafang Li.Notes and references
- Z. Zhang, L. Huang, V. M. Shulmeister, Y. I. Chi, K. K. Kim, L. W. Hung, A. R. Crofts, E. A. Berry and S. H. Kim, Nature, 1998, 392, 677–684 CrossRef CAS PubMed.
- J.-D. Rochaix, Biochim. Biophys. Acta, Bioenerg., 2011, 1807, 375–383 CrossRef CAS PubMed.
- L. Shi, H. Dong, G. Reguera, H. Beyenal, A. Lu, J. Liu, H. Q. Yu and J. K. Fredrickson, Nat. Rev. Microbiol., 2016, 14, 651–662 CrossRef CAS PubMed.
- J. A. Gralnick and D. K. Newman, Mol. Microbiol., 2007, 65, 1–11 CrossRef PubMed.
- S. Mishra, S. Pirbadian, A. K. Mondal, M. Y. El-Naggar and R. Naaman, J. Am. Chem. Soc., 2019, 141, 19198–19202 CrossRef CAS PubMed.
- N. S. Malvankar, S. E. Yalcin, M. T. Tuominen and D. R. Lovley, Nat. Nanotechnol., 2014, 9, 1012–1017 CrossRef CAS PubMed.
- Y. Li, H. Wang, Z. Wang, Y. Qiao, J. Ulstrup, H. Y. Chen, G. Zhou and N. Tao, Proc. Natl. Acad. Sci. U. S. A., 2019, 116, 3407–3412 CrossRef CAS PubMed.
- A. Kaur, J. L. Kolanowski and E. J. New, Angew. Chem., Int. Ed., 2016, 55, 1602–1613 CrossRef CAS PubMed.
- Z. Lou, P. Li and K. Han, Acc. Chem. Res., 2015, 48, 1358–1368 CrossRef CAS PubMed.
- J. Chan, S. C. Dodani and C. J. Chang, Nat. Chem., 2012, 4, 973–984 CrossRef CAS PubMed.
- R. Lincoln, L. E. Greene, W. Zhang, S. Louisia and G. Cosa, J. Am. Chem. Soc., 2017, 139, 16273–16281 CrossRef CAS PubMed.
- Y. Gao, X. Liu, L. Sun, Y. Xu, S. Yang, C. Fan and D. Li, J. Phys. Chem. Lett., 2019, 10, 82–89 CrossRef CAS PubMed.
- C. Lei and D. Hu, Anal. Chem., 2021, 93, 8864–8871 CrossRef CAS PubMed.
- J. Lu, Y. Fan, M. D. Howard, J. C. Vaughan and B. Zhang, J. Am. Chem. Soc., 2017, 139, 2964–2971 CrossRef CAS PubMed.
- J. Zhao, L. P. Zaino and P. W. Bohn, Faraday Discuss., 2013, 164, 57–69 RSC.
- C. Lei, D. Hu and E. J. Ackerman, Chem. Commun., 2008, 7345, 5490–5492 RSC.
- R. Hao, Z. Peng and B. Zhang, ACS Omega, 2020, 5, 89–97 CrossRef CAS PubMed.
- W. Xu, H. Shen, Y. J. Kim, X. Zhou, G. Liu, J. Park and P. Chen, Nano Lett., 2009, 9, 3968–3973 CrossRef CAS PubMed.
- H.-P. Phan, M. K. Masud, R. K. Vadivelu, T. Dinh, T.-K. Nguyen, K. Ngo, D. V. Dao, M. J. A. Shiddiky, M. S. A. Hossain, Y. Yamauchi and N.-T. Nguyen, Chem. Commun., 2019, 55, 7978–7981 RSC.
- J. Lian, Y. Yang, W. Wang, S. G. Parker, V. R. Gonçales, R. D. Tilley and J. J. Gooding, Chem. Commun., 2019, 55, 123–126 RSC.
- D. Ciornii, M. Riedel, K. R. Stieger, S. C. Feifel, M. Hejazi, H. Lokstein, A. Zouni and F. Lisdat, J. Am. Chem. Soc., 2017, 139, 16478–16481 CrossRef CAS PubMed.
- D. Mersch, C. Y. Lee, J. Z. Zhang, K. Brinkert, J. C. Fontecilla-Camps, A. W. Rutherford and E. Reisner, J. Am. Chem. Soc., 2015, 137, 8541–8549 CrossRef CAS PubMed.
- S. Fan, J. E. A. Webb, Y. Yang, D. J. Nieves, V. R. Gonçales, J. Tran, G. Hilzenrat, M. Kahram, R. D. Tilley, K. Gaus and J. J. Gooding, Angew. Chem., Int. Ed., 2019, 58, 14495–14498 CrossRef CAS PubMed.
- K. Hou, D. Puzzo, M. G. Helander, S. S. Lo, L. D. Bonifacio, W. Wang, Z.-H. Lu, G. D. Scholes and G. A. Ozin, Adv. Mater., 2009, 21, 2492–2496 CrossRef CAS.
- C. R. Simmons, D. Schmitt, X. Wei, D. Han, A. M. Volosin, D. M. Ladd, D. K. Seo, Y. Liu and H. Yan, ACS Nano, 2011, 5, 6060–6068 CrossRef CAS PubMed.
- P. Kwan, D. Schmitt, A. M. Volosin, C. L. McIntosh, D. K. Seo and A. K. Jones, Chem. Commun., 2011, 47, 12367–12369 RSC.
- L. Jeuken, M. Orrit and G. Canters, Curr. Opin. Electrochem., 2023, 37, 101196 CrossRef CAS.
- V. Martinez and M. Henary, Chem.–Eur. J., 2016, 22, 13764–13782 CrossRef CAS PubMed.
- H. Li and J. C. Vaughan, Chem. Rev., 2018, 118, 9412–9454 CrossRef CAS PubMed.
- J. Vogelsang, T. Cordes, C. Forthmann, C. Steinhauer and P. Tinnefeld, Proc. Natl. Acad. Sci. U. S. A., 2009, 106, 8107–8112 CrossRef CAS PubMed.
- S. Sharma, A. M. Volosin, D. Schmitt and D.-K. Seo, J. Mater. Chem. A, 2013, 1, 699–706 RSC.
- S. Doose, H. Neuweiler and M. Sauer, ChemPhysChem, 2009, 10, 1389–1398 CrossRef CAS PubMed.
- S. Van De Linde, I. Krstić, T. Prisner, S. Doose, M. Heilemann and M. Sauer, Photochem. Photobiol. Sci., 2011, 10, 499–506 CrossRef CAS PubMed.
- R. Zhan, S. Song, Y. Liu and S. Dong, J. Chem. Soc., Faraday Trans., 1990, 86, 3125–3127 RSC.
- L. Carlini, A. Benke, L. Reymond, G. Lukinavičius and S. Manley, ChemPhysChem, 2014, 15, 750–755 CrossRef CAS PubMed.
- T. Slanina and T. Oberschmid, ChemCatChem, 2018, 10, 4182–4190 CrossRef CAS.
- O. Simoska, E. M. Gaffney, K. Lim, K. Beaver and S. D. Minteer, J. Electrochem. Soc., 2021, 168, 025503 CrossRef CAS.
- K. Rabaey, N. Boon, M. Höfte and W. Verstraete, Environ. Sci. Technol., 2005, 39, 3401–3408 CrossRef CAS PubMed.
- E. Marsili, D. B. Baron, I. D. Shikhare, D. Coursolle, J. a Gralnick and D. R. Bond, Proc. Natl. Acad. Sci. U. S. A., 2008, 105, 3968–3973 CrossRef CAS PubMed.
- S. Xu, Y. Jangir and M. Y. El-Naggar, Electrochim. Acta, 2016, 198, 49–55 CrossRef CAS.
- D.-N. Lee, S. Bae, K. Han, I.-S. Shin, S. K. Kim and J.-I. Hong, Chem.–Eur. J., 2017, 23, 16078–16084 CrossRef CAS PubMed.
- J. Savéant and C. Costentin, Elements of Molecular and Biomolecular Electrochemistry, Wiley, 2019, pp. 113–117 Search PubMed.
- K. R. Ward, N. S. Lawrence, R. S. Hartshorne and R. G. Compton, J. Phys. Chem. C, 2011, 115, 11204–11215 CrossRef CAS.
- T. Cordes, J. Vogelsang and P. Tinnefeld, J. Am. Chem. Soc., 2009, 131, 5018–5019 CrossRef CAS PubMed.
- S. Pirbadian, S. E. Barchinger, K. M. Leung, H. S. Byun, Y. Jangir, R. A. Bouhenni, S. B. Reed, M. F. Romine, D. A. Saffarini, L. Shi, Y. A. Gorby, J. H. Golbeck and M. Y. El-Naggar, Proc. Natl. Acad. Sci. U. S. A., 2014, 111, 12883–12888 CrossRef CAS PubMed.
- P. Subramanian, S. Pirbadian, M. Y. El-Naggar and G. J. Jensen, Proc. Natl. Acad. Sci. U. S. A., 2018, 115, E3246–E3255 CrossRef CAS PubMed.
- O. Zhang, J. Lu, T. Ding and M. D. Lew, Appl. Phys. Lett., 2018, 113, 031103 CrossRef PubMed.
- M. Ovesný, P. Křížek, J. Borkovec, Z. Švindrych and G. M. Hagen, Bioinformatics, 2014, 30, 2389–2390 CrossRef PubMed.
Footnotes |
| † Electronic supplementary information (ESI) available: Three supplementary movies and supplementary Fig. S1–S9 with additional discussions. See DOI: https://doi.org/10.1039/d3sc05293a |
| ‡ Current address: CAS Key Laboratory for Biomedical Effects of Nanomaterials and Nanosafety, National Center for Nanoscience and Technology, Beijing, 100190, China. |
| This journal is © The Royal Society of Chemistry 2024 |