 Open Access Article
Creative Commons Attribution 3.0 Unported Licence
Infrared spectroscopy reveals metal-independent carbonic anhydrase activity in crotonyl-CoA carboxylase/reductase†
Aharon
Gomez‡§
 a,
Matthias
Tinzl§
b,
Gabriele
Stoffel
b,
Hendrik
Westedt
b,
Helmut
Grubmüller
c,
Tobias J.
Erb
bd,
Esteban
Vöhringer-Martinez
 *a and
Sven T.
Stripp
 *ef
*ef
aDepartamento de Físico Química, Facultad de Ciencias Químicas, Universidad de Concepción, Concepción, Chile. E-mail: evohringer@udec.cl
bDepartment of Biochemistry and Synthetic Metabolism, Max-Planck-Institute for Terrestrial Microbiology, Karl-von-Frisch-Str. 10, D-35043 Marburg, Germany
cDepartment of Theoretical and Computational Biophysics, Max-Planck-Institute for Multidisciplinary Sciences, Am Fassberg 11, 37077 Göttingen, Germany
dCenter for Synthetic Microbiology (SYNMIKRO), Germany
eFreie Universität Berlin, Experimental Molecular Biophysics, Arnimallee 14, 14195 Berlin, Germany
fTechnische Universität Berlin, Division of Physical Chemistry, Strasse des 17. Juni 124, 10623 Berlin, Germany. E-mail: s.stripp@tu-berlin.de
First published on 29th February 2024
Abstract
The conversion of CO2 by enzymes such as carbonic anhydrase or carboxylases plays a crucial role in many biological processes. However, in situ methods following the microscopic details of CO2 conversion at the active site are limited. Here, we used infrared spectroscopy to study the interaction of CO2, water, bicarbonate, and other reactants with β-carbonic anhydrase from Escherichia coli (EcCA) and crotonyl-CoA carboxylase/reductase from Kitasatospora setae (KsCcr), two of the fastest CO2-converting enzymes in nature. Our data reveal that KsCcr possesses a so far unknown metal-independent CA-like activity. Site-directed mutagenesis of conserved active site residues combined with molecular dynamics simulations tracing CO2 distributions in the active site of KsCCr identify an ‘activated’ water molecule forming the hydroxyl anion that attacks CO2 and yields bicarbonate (HCO3−). Computer simulations also explain why substrate binding inhibits the anhydrase activity. Altogether, we demonstrate how in situ infrared spectroscopy combined with molecular dynamics simulations provides a simple yet powerful new approach to investigate the atomistic reaction mechanisms of different enzymes with CO2.
Introduction
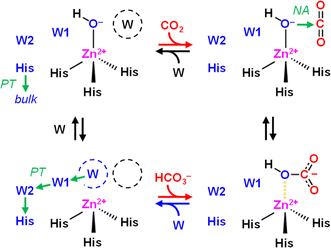
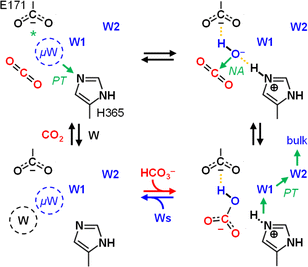
Developing catalytic strategies for the capture and conversion of carbon dioxide (CO2) is key to increased mitigation, utilization, and sequestration of this critical greenhouse gas. While still being a challenge for synthetic chemistry enzymes provide a natural blueprint for efficient CO2-converting catalysts.1 Several enzymes are known that interact with CO2 and/or bicarbonate (HCO3−) during catalysis, in particular carbonic anhydrases (CAs) and carboxylases.CAs catalyze the reversible conversion of CO2, H2O, and bicarbonate (HCO3−) with rate enhancements of close to 8 × 10⁶ compared to the reaction in aqueous solution (eqn (1)). This makes them one of the most effective CO2-converting catalysts in nature.2 CAs are present in all three domains of life and have been classified in eight families.3 Almost all known CAs feature a zinc cation (Zn2+) as active site cofactor,4 which plays a central role in catalysis as Zn2+ coordinates a hydroxide anion (OH−) that attacks CO2 as a nucleophile to form HCO3− (Scheme 1). The OH− species itself is generated through proton abstraction from a zinc-bound water molecule to a nearby base, which is usually a histidine.5–8
| CO2 + 2H2O ↔ HCO3− + H3O+ | (1) |
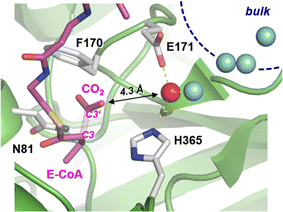
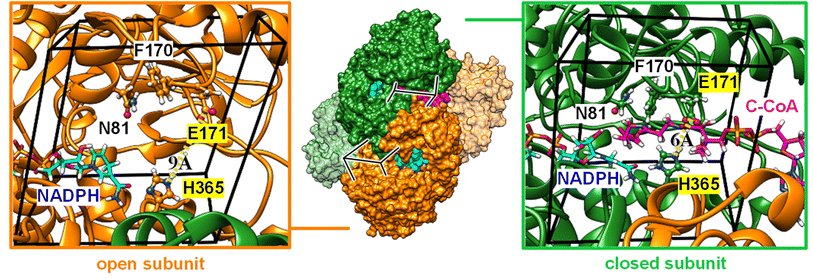
Carboxylases catalyze the addition of CO2 to an acceptor substrate with the family of enoyl-CoA carboxylases/reductases (ECRs) encompassing some of the most efficient CO2-fixing enzymes found in nature.9 ECRs catalyze the reductive carboxylation of α,β-unsaturated enoyl-CoAs with the reduced form of nicotinamide adenine dinucleotide phosphate (NADPH) as cofactor. Hydride transfer from NADPH to the enoyl-CoA substrate generates a reactive enolate species, which acts as a nucleophile that attacks a CO2 molecule bound at the active site.10,11 At the example of crotonyl-CoA carboxylase/reductase from Kitasatospora setae (KsCcr), Fig. 1 illustrates how CO2-binding is achieved through four amino acid residues and one conserved water molecule that is coordinated by an aspartate E171 and a histidine H365 (μW).12
All molecular species involved in the above described CO2-conversions (H2O, CO2, HCO3−) show characteristic absorbance between 4000–1000 cm−1, which makes them available to Fourier-transform infrared (FTIR) spectroscopy.13–16 In a protein sample, however, these signals are overlaid by the intense absorbance of bulk water and the amide bands of the protein backbone.17 This limitation can be overcome by FTIR difference spectroscopy, which provides the means to distinguish between protein sample background signals and the signature of a given reaction upon a specific trigger.18 We developed a FTIR difference spectroscopy-based setup in which catalysis can be triggered via the gas phase.19 Compared to the conventional transmission configuration a protein film is formed on top of the silicon crystal of an attenuated total reflection (ATR) optical cell,20 which makes the protein amendable to changes in the gas phase, e.g., by switching from a inert carrier gas (100% N2 or Ar, defining the background signal) to a ‘reactive’ gas mixture (see ESI† for further details). This specific design allows studying the reaction of CO2-converting enzymes providing the substrate (i.e., CO2) in situ and thus the reaction trigger for these enzymes.19
Here, we applied in situ ATR FTIR spectroscopy to study the interaction of KsCcr with CO2. Our results show that the active site of KsCcr does not only bind CO2 but surprisingly possesses a so-far unknown, intrinsic CA-like activity, which enables the enzyme to catalyze the reversible interconversion of CO2, H2O, and HCO3−. Studying the reaction in absence or presence of substrates or inhibitors with wild-type and five active site variants, we identified key residues for the observed CA-like activity including a cluster of strongly hydrogen-bonded, ‘local’ water molecules. Moreover, computer simulations suggest that conformational dynamics and substrate binding in KsCcr modulate CO2 binding at the active site. Combining experiment and simulation, we propose a mechanism for the CA-like activity of KsCcr that involves an ‘activated’ water molecule, which is essential for CO2-binding during the CO2-fixation reaction of KsCcr but also serves as nucleophilic OH− anion in the enzyme's CA-like reaction.
Results and discussion
Infrared signatures of anhydrase activity
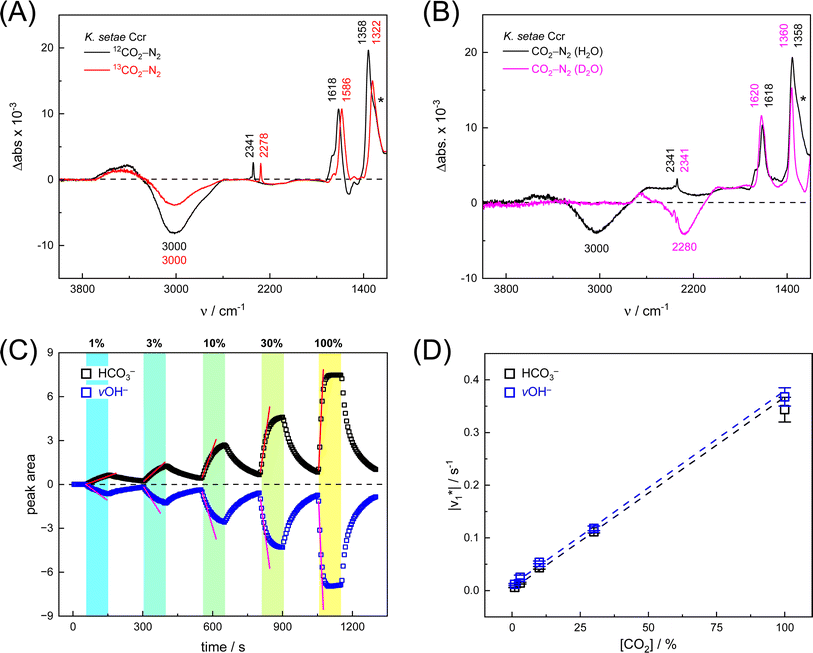
First, we pipetted 1 μl KsCcr solution (200 μM protein in 25 mM Tris/HCl pH 7.5) on the ATR crystal of the FTIR spectrometer and monitored water evaporation under dry N2 gas in situ. Once sufficiently concentrated, we rehydrated the protein film under a stream of aerosol that was created by sending dry N2 gas (3 L min−1) through a wash bottle containing a dilute Tris/HCl buffer solution (1 mM, pH 7.5). Then, we added 10% CO2 to the N2 carrier gas for 50–100 s and recorded data to calculate a series of time-resolved in situ ATR FTIR difference spectra that result from the interaction of KsCcr with CO2 (Fig. S1†). In reference experiments with pure water and buffer solution, 25 mM Tris/HCl (pH 8) was found to be sufficiently concentrated preventing acidification in the presence of 10% CO2 (Fig. S2†).Fig. 2A depicts a ‘CO2–N2’ FTIR difference spectrum recorded 25 s after addition of 10% CO2. The positive band at 2341 cm−1 corresponds to CO2 in solution.13 Further positive bands were observed at 1618 cm−1, 1358 cm−1, and 1298 cm−1, the latter as a shoulder. These bands are assigned to bicarbonate in solution,14–16i.e., the asymmetric and symmetric stretching modes of CO2 (v2, v3) and the HCO3− bending mode (v4). A broad negative band at 3000 cm−1 appeared in an energy regime corresponding to a strongly hydrogen-bonded network of ‘local’ water molecules,21–23 indicating that water is consumed during bicarbonate formation.
To confirm assignment of the observed bands, we investigated potential isotope effects. Adding 13CO2 gas instead of CO2 resulted in a specific down-shift of the CO2 band to 2278 cm−1 (Δ63), as well as the v2 and v3 bands of HCO3− to 1586 cm−1 and 1322 cm−1 (Δ32 and Δ36, respectively). The isotope effect on the band at 1258 cm−1 was rather minor while the broad negative band at 3000 cm−1 was not affected by 13CO2, which is in line with our assignments of CO2/HCO3− and ‘local’ water. We also investigated the influence of solvent isotope effects by exchanging the hydrated KsCcr protein film from H2O to D2O (Fig. 2B). In the presence of D2O, we observed a large down-shift of the negative band from 3000 cm−1 to 2280 cm−1 (Δ720) supporting our assignment of the water cluster. While the H/D exchange only had an insignificant effect on the v2 and v3 bands, the shoulder at 1298 cm−1 seemed to disappear in the deuterated sample. This is due to a ∼300 cm−1 down-shift that moves the signal out of the detection window of our FTIR setup and additionally confirms the COH (v4) assignment.15
Next, we studied the kinetics of the reaction between KsCcr and CO2. The difference spectra were simulated with contributions from CO2, H2O, and HCO3− and corrected for unspecific changes (Fig. S3†). The resulting ‘peak area’ for each reactant was plotted against time. Fig. 2C shows the changes of HCO3− (given by the sum of v2, v3, and v4) and ‘local’ water (vOH−) in KsCcr upon reaction with CO2. We titrated the enzyme in five consecutive steps changing the gas atmosphere to a continuous partial pressure of 1, 3, 10, 30, and 100% CO2 followed by exposure to 100% N2 after each CO2 step. Qualitatively, these data demonstrate that the intensity of the HCO3− and water bands are proportional to the CO2 concentration in the atmosphere and that the CO2/HCO3− conversion is reversible (eqn (1)). The initial velocity of CO2 hydration  was estimated by linear regression based on the first three data points after changing the atmosphere from N2 to CO2 for each step. We assume that the reaction velocity is not significantly affected by the back reaction due to the small build-up of HCO3− within the first 15 s. A similar approach was chosen to quantify the initial velocity of HCO3− dehydration
  initiated by removing CO2 from the gas atmosphere (Fig. S4†). The data yielded apparent reaction velocities
  and
and  that are specific for our experimental approach. Earlier, we explored how the humidity of concentrated protein films influences the velocity of substrate diffusion24,25 and its overall elastic properties.26 Now, we show that corresponding observations are made with KsCcr: when the humidity was reduced from 75% to 35% (determined via the OH stretching vibrations of H2O, see Fig. S3†) the velocity of CO2 hydration decreased accordingly (Fig. S5†). Although the spectroscopically measured velocities are lower than in solution assays27 our data facilitates a quantitatively significant comparison between samples under tightly controlled steady-state conditions. To demonstrate the catalytic activity of KsCcr in solution, we performed the ‘colorimetric’ analysis of CO2 hydration as pioneered by Wilbur and Anderson.28 Here, the injection of a defined amount of CO2-saturated buffer induces an acidification (eqn (1)), which leads to a bleach of a strong absorbance band of bromothymol blue that can be followed over time by UV/vis spectroscopy. Our data in Fig. S6† demonstrate that CO2 hydration in aqueous solution is much slower than in the presence of KsCcr or β-type carbonic anhydrase from E. coli (EcCA) confirming the observed anhydrase activity of KsCcr.29
Fig. 2D shows how the calculated reaction velocities for HCO3− formation and water consumption (given in absolute values  to visually aid the comparison) depend linearly on the CO2 concentration. The experimental variation has been determined in repetitions of five (Fig. S7†). This confirms the proposed reaction model of pseudo-first order kinetics for enzymatic CO2 hydration in aqueous solution30 and highlights the quantitative connection between CO2, HCO3−, and water in the active site. Fig. S8† depicts a quantification of HCO3− based on Na2CO3 reference samples and an analysis of the exponential correlation between CO2 partial pressure and HCO3− concentration in the protein film. This facilitates the analysis of the initial velocity of the back reaction
  as a function of bicarbonate concentration. The data in Fig. S4† suggest a higher reaction order and overall slower kinetics. We speculate that the apolar active site of KsCcr (Fig. 1) may slow down HCO3− binding, which would impede the back reaction.
To verify and benchmark the CO2/HCO3− conversion by KsCcr, we repeated the experiments with carbonic anhydrase EcCA at conditions comparable to the experiments with KsCcr. The ‘CO2–N2’ FTIR spectrum for EcCA after 25 s in the presence of 10% CO2 (Fig. 3A) is strikingly similar to the one observed for KsCcr (Fig. 2B) including the positive features for CO2 and HCO3−, as well as the negative water band at 3050 cm−1 (2300 cm−1 in D2O). However, Fig. 3B shows that EcCA catalyses the CO2/HCO3−conversion nearly four times faster than KsCcr ( respectively). The superior activity of EcCA is observed in solution as well (Fig. S6†). For comparison unspecific CO2 conversion by bovine serum albumin (BSA,
  ) is plotted in Fig. 3B. Note the lack of a negative band at 3000 cm−1
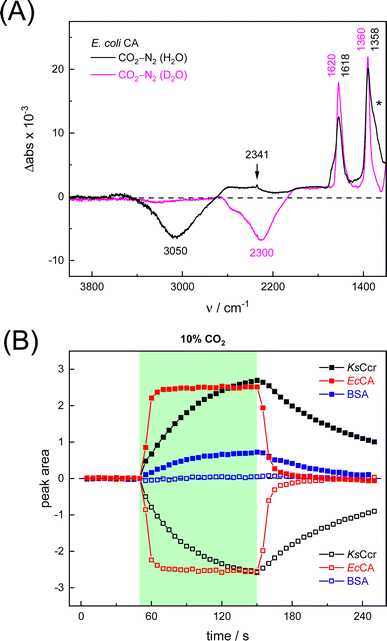 | ||
| Fig. 3 Infrared characterization of the reaction of EcCA with CO2. (A) ‘CO2–N2’ ATR FTIR difference spectra in the presence of H2O (black) or D2O (magenta). These data show that EcCA and KsCcr (Fig. 2) react very similar with CO2. (B) Plotting the evolution of spectral traces for HCO3− (closed symbols) and vOH− (open symbols) against time, the superior reaction velocity of EcCA (red) over KsCcr (black) and BSA background (blue) becomes evident. | ||
The CO2 conversion kinetics of KsCcr in Fig. 2 are in the range of uncatalyzed CO2 hydration in solution (Fig. S6†). Therefore, we probed background CO2 conversion in (i) water, (ii) buffer, and (iii) BSA as a generic biological crowder.31 No significant HCO3− formation was observed with pure water, presumably due to the acidification in unbuffered solution (Fig. S2†). When recording ‘CO2–N2’ difference spectra on a drop of Tris/HCl buffer (2 μl, 25 mM, pH 8) approximately 10% HCO3− formation was observed within the same time frame as in the KsCcr experiments (Fig. S2†) although much more CO2 is dissolved in the drop compared to KsCcr or EcCA (Fig. S9†). As argued above, data based on liquid sample cannot be compared directly, therefore we formed a BSA protein film to probe uncatalyzed CO2 hydration under conditions comparable to the experiments with KsCcr or EcCA. At pH 7–8, BSA shows up to 30% of the bicarbonate formation activity observed with KsCcr and a HCO3−/CO2 ratio similar to KsCcr or EcCA. However, the unique water feature of KsCcr and EcCA is shifted to 3320 cm−1, indicative of uncatalyzed CO2 hydration from bulk water (Fig. S9†). Accordingly, when the BSA solution was adjusted to pH values between 5–9, the observed HCO3− formation resembles the pH profile of the CO2/HCO3− couple in the absence of enzyme. Note that this is not the case for KsCcr: in the same pH range, this enzyme shows largely unchanged CO2 hydration activity (Fig. S9†). Overall, these controls demonstrated that KsCcr possesses a CA-like activity similar to the reaction of ‘true’ CAs.
Substrate binding and hydrophilic residues influence anhydrase activity
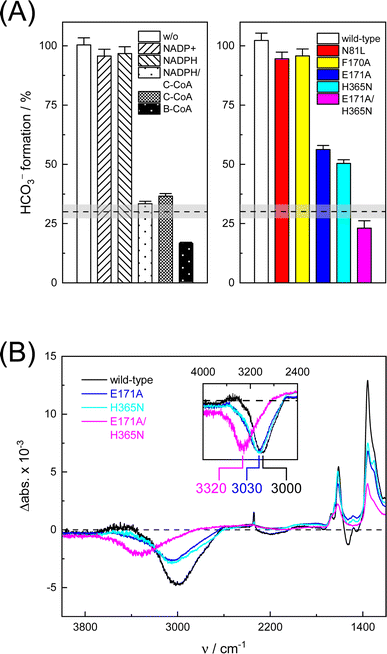
In the next step, we investigated the CO2/HCO3− conversion activity of KsCcr in the presence of NADPH, NADP+, native substrate crotonyl-coenzyme A (C-CoA), and side product butyryl-coenzyme A (B-CoA).9–11 We tested six different combinations: (i) KsCcr only, (ii) KsCcr + 10 mM NADP+, (iii) KsCcr + 10 mM NADPH, (iv) KsCcr + 10 mM NADPH + 1 mM C-CoA, (v) KsCcr + 1 mM C-CoA, and (vi) KsCcr + 1 mM B-CoA. Fig. 4A shows the HCO3− peak area observed after 60 s in the FTIR difference experiments (i.e., upon saturation of the signals, see Fig. S9†), normalized to wild-type KsCcr, which defines ‘100%’ bicarbonate formation. The experimental variation has been determined in repetitions of five (Fig. S7†). In these experiments, neither NADPH nor NADP+ affected bicarbonate formation, while the presence of C-CoA or B-CoA decreased band intensity down to 33% and 17%, respectively. Based on our reference experiments (Fig. S9†), we note that about 30% CO2 hydration can be considered as background activity, which is indicated by the dashed line in Fig. 4A. These data suggest that HCO3− formation and carboxylation are mutually exclusive indicating that the CO2/HCO3− conversion occurs only at the substrate-free active site of KsCcr. We speculate that the superior inhibition activity of B-CoA is related to the structural flexibility of this catalytic side product, which has been shown to fit the active site of KsCcr smoothly.32 These properties might affect unspecific binding site as well pushing the activity below the threshold.We have shown previously that four amino acids play a key role in CO2 binding at the active site of KsCcr: histidine H365, glutamate E171, asparagine N81, and phenylalanine F170.12 H365 and E171 are involved in coordinating a conserved water molecule in bridging position (μW), which is in hydrogen-bonding contact with water molecules that connect the active site with bulk water (Fig. 1). Asparagine N81 orients CO2 in the active site for the carboxylation reaction, and F170 shields the pocket from water.
To understand the molecular basis of CO2/HCO3− conversion in KsCcr, we tested five active site variants. Qualitatively, the ‘CO2–N2’ FTIR difference spectra of single point mutants N81L, F170A, E171A, and H365N were similar to wild-type KsCcr. However, while N81L and F170A showed full conversion, bicarbonate formation of variants E171A and H365N was reduced by ca. 50% (Fig. 4A). Compared to H365N variant E171A showed slightly slower bicarbonate formation. In the KsCcr E171A/H365N double mutant both conversion and reaction velocity were found to be reduced even further (Fig. S10†). Fig. 4B highlights an interesting detail in the difference spectra of wild-type KsCcr, E171A, H365N, and E171A/H365N: the water band shifts from 3000 cm−1 to 3030 cm−1 in the single point mutants and all the way down to 3320 cm−1 in the double mutant. This indicates that KsCcr E171A/H365N has lost its CA-like activity and exhibits only unspecific CO2 hydration much like BSA that showed a similar ‘CO2–N2’ FTIR difference spectrum (Fig. S9†) and in agreement with the reduced CO2 hydration activity reported in Fig. 4A. In summary, these experiments suggest that the CA-like activity depends on the active site of KsCcr, and likely involves E171 and H365.
Computer simulations reveal conformation-dependent CO2 binding and explain substrate inhibition
To rationalize the observed inhibition of CA-like activity through substrate binding, we performed atomistic MD simulations in the presence of CO2 using the X-ray crystal structure of KsCcr that binds both NADPH and side product B-CoA (ternary complex, PDB ID 6NA4).32 Note that the enzyme is a tetramer that shows half-site reactivity, i.e., exists as dimer of open and closed subunits (colored orange and green in Fig. 5). Compared to the open subunits the closed subunits contain the substrate and represent the catalytically active sites in the ternary complex. For our simulations, we replaced B-CoA by C-CoA and defined a specific volume box (Fig. 5) to calculate the CO2 binding free energy in the open and closed subunit. Notably, active site residues H365 and E171, which we associate with CA-like activity, adopted different geometries in the open and closed conformations. Compared to the open subunit, the distance between E171 and H365 was 3 Å shorter in the closed subunit and the conserved water molecule μW was hydrogen-bonded between the two residues (Fig. 5). Additionally, we studied the X-ray structure without substrate (binary complex, PDB ID 6NA4) that presents similar geometries of both residues in the closed and open subunits.32We presume that H365 can act as base in its neutral, monoprotonated state initiating proton abstraction from μW and thus forming the hydroxyl ion for subsequent CO2 hydration. To determine the protonation state of H365 in different subunits of the binary and ternary complexes, we calculated the pKa shift (Table S1†).33 For the open active site, the pKa shift is negative (ΔpKa = −0.9 ± 0.1) indicating that H365 rather adopts a monoprotonated state. For the closed active site without substrate (binary complex), we also obtained a negative shift (ΔpKa = −0.6 ± 0.1) while the pKa shift was positive in the presence of the substrate (ΔpKa = +1.2 ± 0.1), likely because of favorable interactions of the H365 with the negatively charged phosphate groups of C-CoA. Thus, H365 is monoprotonated in the empty, closed active site and capable of initiating proton abstraction from μW. In the presence of substrate H365 most likely changes its protonation state, thus suppressing CA activity.
In addition, CO2 binding to the active site plays an important role. To understand the influence of conformational changes and presence of the substrate on CO2, we carried out extensive MD simulations. From the ratio of local CO2 concentration in the active site volume (black box in Fig. 5) and the concentration in the bulk we calculated the CO2 binding free energy to the active site volume for the open and closed subunits of the binary and ternary complexes of KsCcr ( see ESI†). Our calculations show that ΔGbind of the closed subunit with substrate (ternary complex) is positive whereas the closed subunit in the binary complex without substrate presents the highest CO2 affinity which makes it more than two times more probable to find a CO2 molecule in the active site than in the bulk (Fig. 6A). The open subunit in the ternary complex also shows a significantly increased CO2 affinity but the distance between E171 and H365 is larger in the open active site, and no μW molecule is observed suggesting a diminished catalytic activity. We then addressed the binding sites of CO2 in the closed active site without substrate where the affinity is highest. The binding sites connect active site interior and solvent, and the most buried ones are very close to H365, water molecule μW, and E171 (Fig. 6B). Notably, the substrate in the ternary complex occupies the same positions as the CO2 binding sites (Fig. 6C).
In summary, our computer simulations show that the binary complex has a higher CO2 binding affinity compared to the ternary complex. The CO2 binding sites in the closed active site are next to H365 and the conserved water molecule μW, so that the monoprotonated form of H365 will be able to abstract a proton from μW to form the nucleophilic hydroxyl ion. The absence of NADPH or NADP+ is not expected to affect CO2 binding or H365 protonation because the coenzyme does not bind directly to the substrate binding site.32 In contrast, the presence of C-CoA or B-CoA in the ternary complex increases the pKa of the putative proton acceptor H365 thereby eliminating its ability to activate μW water by proton transfer, and simultaneously diminishes CO2 binding. This can explain the experimentally observed reduction of CA-like activity and is in line with the fact that the active enzyme ternary complex promotes CO2 fixation,32 and not CO2 hydration.
Conclusions
In this study, we applied in situ ATR FTIR difference spectroscopy and computer simulations to investigate and understand the interaction of crotonyl-CoA carboxylase/reductase (KsCcr) with CO2. Our results show that KsCcr possesses a carbonic anhydrase-like activity, i.e., the interconversion of CO2 and HCO3− with water. This reaction is strongly suppressed in the presence of C-CoA, the natural substrate of KsCcr. Extensive MD simulations revealed how C-CoA suppresses CO2 binding and identified H365 as putative proton acceptor during CO2 hydration. Compared to wild-type KsCcr variant H365N indeed showed about 50% reduced anhydrase activity, similar to variant E171A. Our pKa calculations rationalize how either H365 or E171 can serve as ‘base’ in the CO2 hydration reaction explaining the relatively large anhydrase activity of the single-residue variants. In contrast, only slow and unspecific CO2 hydration is observed with double variant E171A/H365N. In wild-type KsCcr, H365 and E171 form a hydrogen-bonding complex through an interstitial, bridging water molecule (μW). The latter is in contact with a chain of water molecules that facilitate contact with bulk water. Upon CO2 hydration our FTIR data reveal the loss of a broad band at 3000 cm−1 (2280 cm−1 in D2O), which we assign to a strongly hydrogen-bonded water cluster, most likely including μW.Notably, we also observed very similar spectra for EcCA, which we used as a reference to validate the experimental setup and confirm our interpretation of KsCcr's CA-like activity. EcCA coordinates a zinc cofactor that catalyses the deprotonation of a bound water molecule to a hydroxide ligand (Zn2+–OH−) promoted by a nearby histidine base (Scheme 1). CO2 reacts with the ligand to HCO3−, which is clearly observed in our FTIR difference spectra as a positive contribution. In the following HCO3− leaves the active site and is replaced by another water molecule. Binding of water ‘re-activates’ the cofactor, resulting in a broad negative band in our FTIR difference spectra, similar to what we have observed with KsCcr. Reported here for the first time, these results establish a unique spectral signature of CA activity, i.e., the IR bands of bicarbonate and a strongly-hydrogen bonded cluster of ‘local’ water.
The role and importance of a metal ion in CA has been discussed intensively.8 However, in 2021 Hirakawa et al. reported metal-free CAs in cyanobacteria and microalgae that appear to catalyse CO2 hydration in a purely organic environment.34 These observations are in line with our experiments on KsCcr that also suggest metal-independent CA-like activity. Based on our combined experimental and theoretical investigation of CO2 hydration in KsCcr, we propose a mechanism related to carbonic anhydrase (Scheme 2): (i) Once the enzyme adopts the closed state, μW is deprotonated to a bridging hydroxide, μOH−, with the neutral H365 residue serving as base (our pKa calculations suggest that E171 may serve as base in H365 variants, see Table S1†). (ii) The carboxylate side chain of E171 accepts a hydrogen bond from μOH−, which itself is stabilized via a hydrogen bond from the imidazole side chain of protonated H365. When CO2 is present in the active site μOH− will form HCO3−via a nucleophilic attack (NA, the reaction may involve additional water species, see Fig. S11†). (iii) Bicarbonate leaves the active site – potentially triggered by a transition from the closed to the open state – and deprotonation of H365 toward bulk solvent. We speculate that the protonated imidazolium cation is not stable in the absence of an interstitial water species. (iv) This transient opening of the hydrogen-bonding complex will allow intake of water and CO2 and prime the system for a new round of CO2 hydration.
Summing up, in situ ATR FTIR difference spectroscopy allowed investigating the interaction of different enzymes with CO2, providing a simple yet powerful approach to directly identify CA activity for a given biological sample. Moreover, our method is also suited to identify and characterize water clusters and will serve as an important tool to analyze CO2 hydration in biocatalysis,35–38 homogenous or heterogeneous catalysts,39–41 and (de-)hydration reactions in general.42,43
Data availability
Data are available from the authors upon reasonable request.Author contributions
M. Tinzl, G. Stoffel, and H. Westedt produced and prepared the enzymes. A. Gomez performed the molecular dynamics simulations and pKa calculations. S. T. Stripp designed and performed the spectroscopy experiments. H. Grubmüller, T. J. Erb, E. Vöhringer-Martinez and S. T. Stripp discussed the data. E. Vöhringer-Martinez designed the computer simulations. E. Vöhringer-Martinez and S. T. Stripp wrote the manuscript.Conflicts of interest
There are no conflicts to declare.Acknowledgements
The authors acknowledge help from Mariafrancesca Greca and Federico Baserga at Freie Universität Berlin in buffer exchange experiments and UV/vis spectroscopy. EVM and AG are thankful for financial support provided by the Max-Planck Society (MPS) through the CONICYT Program of Int. Cooperation with the Max Planck for Terrestrial Microbiology in Marburg (MPG190003) and PhD scholarship “Doctorado Nacional” (21190262) provided by ANID. MT is thankful for a Postdoctoral Fellowship from the Swiss National Science Foundation (P500PB 203136). MT and TJE received support from the MPS the European Research Council (ERC 637675 ‘SYBORG’). STS thanks funding by the Deutsche Forschungsgemeinschaft DFG (priority program 1927 “Iron-Sulfur for Life”, STR1554/5-1).References
- S. Bierbaumer, M. Nattermann, L. Schulz, R. Zschoche, T. J. Erb, C. K. Winkler, M. Tinzl and S. M. Glueck, Chem. Rev., 2023, 123, 5702–5754 CrossRef CAS PubMed.
- R. Wolfenden, Chem. Rev., 2006, 106, 3379–3396 CrossRef CAS PubMed.
- R. J. DiMario, M. C. Machingura, G. L. Waldrop and J. V. Moroney, Plant Sci., 2018, 268, 11–17 CrossRef CAS PubMed.
- D. W. Christianson and C. A. Fierke, Acc. Chem. Res., 1996, 29, 331–339 CrossRef CAS.
- D. N. Silverman and R. McKenna, Acc. Chem. Res., 2007, 40, 669–675 CrossRef CAS PubMed.
- V. M. Krishnamurthy, G. K. Kaufman, A. R. Urbach, I. Gitlin, K. L. Gudiksen, D. B. Weibel and G. M. Whitesides, Chem. Rev., 2008, 108, 946–1051 CrossRef CAS PubMed.
- C. T. Supuran, Biochem. J., 2016, 473, 2023–2032 CrossRef CAS PubMed.
- J. K. Kim, C. Lee, S. W. Lim, A. Adhikari, J. T. Andring, R. McKenna, C. M. Ghim and C. U. Kim, Nat. Commun., 2020, 11, 1–10 CrossRef PubMed.
- T. J. Erb, I. A. Berg, V. Brecht, M. Müller, G. Fuchs and B. E. Alber, Proc. Natl. Acad. Sci. U. S. A., 2007, 104, 10631–10636 CrossRef CAS PubMed.
- T. J. Erb, V. Brecht, G. Fuchs, M. Müller and B. E. Alber, Proc. Natl. Acad. Sci. U. S. A., 2009, 106, 8871–8876 CrossRef CAS PubMed.
- R. G. Rosenthal, M.-O. Ebert, P. Kiefer, D. M. Peter, J. A. Vorholt and T. J. Erb, Nat. Chem. Biol., 2014, 10, 50–55 CrossRef CAS PubMed.
- G. M. M. Stoffel, D. A. Saez, H. DeMirci, B. Vögeli, Y. Rao, J. Zarzycki, Y. Yoshikuni, S. Wakatsuki, E. Vöhringer-Martinez and T. J. Erb, Proc. Natl. Acad. Sci. U. S. A., 2019, 116, 13964–13969 CrossRef CAS PubMed.
- M. Falk and A. G. Miller, Vib. Spectrosc., 1992, 4, 105–108 CrossRef CAS.
- A. R. Davis and B. G. Oliver, J. Solution Chem., 1972, 1, 329–339 CrossRef CAS.
- W. W. Rudolph, D. Fischer and G. Irmer, Appl. Spectrosc., 2006, 60, 130–144 CrossRef CAS PubMed.
- E. Garand, T. Wende, D. J. Goebbert, R. Bergmann, G. Meijer, D. M. Neumark and K. R. Asmis, J. Am. Chem. Soc., 2010, 132, 849–856 CrossRef CAS PubMed.
- A. Barth, Biochim. Biophys. Acta, Bioenerg., 2007, 1767, 1073–1101 CrossRef CAS PubMed.
- V. A. Lórenz-Fonfria, Chem. Rev., 2020, 120, 3466–3576 CrossRef PubMed.
- S. T. Stripp, ACS Catal., 2021, 11, 7845–7862 CrossRef CAS.
- J. Fahrenfort, Spectrochim. Acta, 1961, 17, 698–709 CrossRef CAS.
- F. N. Keutsch and R. J. Saykally, Proc. Natl. Acad. Sci. U. S. A., 2001, 98, 10533–10540 CrossRef CAS PubMed.
- L. F. Scatena, M. G. Brown and G. L. Richmond, Science, 2001, 292, 908–912 CrossRef CAS PubMed.
- H. Wang, J. C. Wagner, W. Chen, C. Wang and W. Xiong, Proc. Natl. Acad. Sci. U. S. A., 2020, 117, 23385–23392 CrossRef CAS PubMed.
- J. Duan, S. Mebs, K. Laun, F. Wittkamp, J. Heberle, T. Happe, E. Hofmann, U.-P. Apfel, M. Winkler, M. Senger, M. Haumann and S. T. Stripp, ACS Catal., 2019, 9, 9140–9149 CrossRef CAS.
- M. Senger, S. Mebs, J. Duan, O. Shulenina, K. Laun, L. Kertess, F. Wittkamp, U.-P. Apfel, T. Happe, M. Winkler, M. Haumann and S. T. Stripp, Phys. Chem. Chem. Phys., 2018, 20, 3128–3140 RSC.
- I. Yakimets, S. S. Paes, N. Wellner, A. C. Smith, R. H. Wilson and J. R. Mitchell, Biomacromolecules, 2007, 8, 1710–1722 CrossRef CAS PubMed.
- C. Ho and J. M. Sturtevant, J. Biol. Chem., 1963, 238, 3499–3501 CrossRef CAS PubMed.
- K. M. Wilbur and N. G. Anderson, J. Biol. Chem., 1948, 176, 147–154 CrossRef CAS PubMed.
- K. S. Smith and F. G. Smith, FEMS Microbiol. Rev., 2000, 24, 335–366 CrossRef CAS PubMed.
- D. M. Kern, J. Chem. Educ., 1960, 37, 14–23 CrossRef CAS.
- M. Löwe, M. Kalacheva, A. J. Boersma and A. Kedrov, FEBS J., 2020, 287, 5039–5067 CrossRef PubMed.
- H. DeMirci, Y. Rao, G. M. Stoffel, B. Vögeli, K. Schell, A. Gomez, A. Batyuk, C. Gati, R. G. Sierra, M. S. Hunter, E. H. Dao, H. I. Ciftci, B. Hayes, F. Poitevin, P.-N. Li, M. Kaur, K. Tono, D. A. Saez, S. Deutsch, Y. Yoshikuni, H. Grubmüller, T. J. Erb, E. Vöhringer-Martinez and S. Wakatsuki, ACS Cent. Sci., 2022, 8, 1091–1101 CrossRef CAS PubMed.
- R. L. Thurlkill, G. R. Grimsley, J. M. Scholtz and C. N. Pace, Protein Sci., 2006, 15, 1214–1218 CrossRef CAS PubMed.
- Y. Hirakawa, M. Senda, K. Fukuda, H. Y. Yu, M. Ishida, M. Taira, K. Kinbara and T. Senda, BMC Biol., 2021, 19, 105 CrossRef CAS PubMed.
- M. L. Zastrow, A. F. A. Peacock, J. A. Stuckey and V. L. Pecoraro, Nat. Chem., 2012, 4, 118–123 CrossRef CAS PubMed.
- L. A. Rettberg, M. T. Stiebritz, W. Kang, C. C. Lee, M. W. Ribbe and Y. Hu, Chem.–Eur. J., 2019, 25, 13078–13082 CrossRef CAS PubMed.
- M. Meneghello, A. R. Oliveira, A. Jacq-Bailly, I. A. C. Pereira, C. Leger and V. Fourmond, Angew. Chem., Int. Ed., 2021, 60, 9964–9967 CrossRef CAS PubMed.
- D. Shevela, H.-N. Do, A. Fantuzzi, A. W. Rutherford and J. Messinger, Biochemistry, 2020, 59, 2442–2449 CrossRef CAS PubMed.
- G. Parkin, Chem. Rev., 2004, 104, 699–768 CrossRef CAS PubMed.
- L. Koziol, C. A. Valdez, S. E. Baker, E. Y. Lau, W. C. Floyd, S. E. Wong, J. H. Satcher, F. C. Lightstone and R. D. Aines, Inorg. Chem., 2012, 51, 6803–6812 CrossRef CAS PubMed.
- S. J. Cobb, V. M. Badiani, A. M. Dharani, A. Wagner, S. Zacarias, A. R. Oliveira, I. A. C. Pereira and E. Reisner, Nat. Chem., 2022, 14, 417–424 CrossRef CAS PubMed.
- S. Kobayashi and K. Manabe, Acc. Chem. Res., 2002, 35, 209–217 CrossRef CAS PubMed.
- G. Li, B. Wang and D. E. Resasco, ACS Catal., 2020, 10, 1294–1309 CrossRef CAS.
Footnotes |
| † Electronic supplementary information (ESI) available. See DOI: https://doi.org/10.1039/d3sc04208a |
| ‡ Present address: Departamento de Ciencias Biológicas y Químicas, Facultad de Medicina y Ciencia, Universidad San Sebastián, Concepción, Chile. |
| § These authors contributed equally. |
| This journal is © The Royal Society of Chemistry 2024 |

