
 Open Access Article
 This Open Access Article is licensed under a Creative Commons Attribution-Non Commercial 3.0 Unported Licence
Matrix stiffness-dependent microglia activation in response to inflammatory cues: in situ investigation by scanning electrochemical microscopy†
Yulin
Liu
ab,
Junjie
Zhang
ab,
Yabei
Li
bc,
Yuxiang
Zhao
ab,
Shuake
Kuermanbayi
ab,
Jian
Zhuang
d,
Hua
Zhang
e,
Feng
Xu
 *ab and
Fei
Li
*ab
*ab and
Fei
Li
*ab
aThe Key Laboratory of Biomedical Information Engineering of Ministry of Education, School of Life Science and Technology, Xi'an Jiaotong University, Xi'an 710049, P. R. China. E-mail: fengxu@mail.xjtu.edu.cn; feili@mail.xjtu.edu.cn
bBioinspired Engineering and Biomechanics Center (BEBC), Xi'an Jiaotong University, Xi'an 710049, P. R. China
cSchool of Chemistry, Xi'an Jiaotong University, Xi'an 710049, P. R. China
dKey Laboratory of Education Ministry for Modern Design Rotor-Bearing System, School of Mechanical Engineering, Xi'an Jiaotong University, Xi'an 710049, P. R. China
eDepartment of Neurosurgery, The First Affiliated Hospital, Xi'an Jiaotong University, Xi'an 710061, P. R. China
First published on 28th November 2023
Abstract
Microglia play a crucial role in maintaining the homeostasis of the central nervous system (CNS) by sensing and responding to mechanical and inflammatory cues in their microenvironment. However, the interplay between mechanical and inflammatory cues in regulating microglia activation remains elusive. In this work, we constructed in vitro mechanical-inflammatory coupled microenvironment models of microglia by culturing BV2 cells (a murine microglial cell line) on polyacrylamide gels with tunable stiffness and incorporating a lipopolysaccharide (LPS) to mimic the physiological and pathological microenvironment of microglia in the hippocampus. Through characterization of activation-related proteins, cytokines, and reactive oxygen species (ROS) levels, we observed that the LPS treatment induced microglia on a stiff matrix to exhibit overexpression of NOX2, higher levels of ROS and inflammatory factors compared to those on a soft matrix. Additionally, using scanning electrochemical microscopy (SECM), we performed in situ characterization and discovered that microglia on a stiff matrix promoted extracellular ROS production, leading to a disruption in their redox balance and increased susceptibility to LPS-induced ROS production. Furthermore, the respiratory activity and migration behavior of microglia were closely associated with their activation process, with the stiff matrix-LPS-induced microglia demonstrating the most pronounced changes in respiratory activity and migration ability. This work represents the first in situ and dynamic monitoring of microglia activation state alterations under a mechanical-inflammatory coupled microenvironment using SECM. Our findings shed light on matrix stiffness-dependent activation of microglia in response to an inflammatory microenvironment, providing valuable insights into the mechanisms underlying neuroinflammatory processes in the CNS.
Introduction
Microglia play important roles in immune-regulation and maintaining the stability of the central nervous system (CNS).1,2 With the onset and progression of CNS diseases, there exist significant changes in mechanical and inflammatory cues in the cell microenvironment, which influence the immune-regulation function of microglia.3,4 For example, perturbation of the mechanical microenvironment can trigger a mechanotransduction process of microglia, leading to their transformation from a homeostasis to an activation state,5,6 upregulating the expressions of inflammatory factors and resulting in a change in the inflammatory microenvironment of the CNS.7 Microglia can also be activated by pro-inflammatory factors (e.g., lipopolysaccharides (LPSs)) in neurodegenerative diseases (e.g., Alzheimer's disease), resulting in their pathological state (i.e., over-activation state) accelerated disease progression.8 Thus, the mechanical-inflammatory microenvironment synergistically influences the state and physiological/pathological functions of microglia, while its effect mechanism remains elusive.In previous studies, microglia activation has been proven to be highly associated with the inflammatory microenvironment in neurological disorder.9 Recent evidence shows that mechanical cues in the CNS microenvironment such as the stiffness of the extracellular matrix (ECM) can also regulate the activation state of microglia.10,11 But the studies about the synergistic effect of an ECM stiffness-inflammatory coupled microenvironment on the activation state of microglia are still rare.12 In addition, microglia activation is a rapid dynamic process, where microglia sensitively and rapidly respond to cytokines with changes in the levels of released inflammatory factors,13 redox balance,14 respiratory activity15 and migration ability.16 However, the traditional characterization methods, such as enzyme-linked immunosorbent assay (ELISA) and fluorescence imaging methods, can only characterize the changes in these parameters at one time. Therefore, there is still an unmet need for the techniques capable of in situ monitoring the changes in the redox status, respiratory activity and migration behavior of microglia during their early activation process to reflect their activation states and physiological/pathological functions.
Scanning electrochemical microscopy (SECM), electrochemical principle-based scanning probe microscopy using a micro/nanoelectrode as its probe, can in situ and dynamically characterize the morphology and released/consumed species of cells through the recorded current/potential changes of redox mediators around cells in cell culture solution.17,18 For example, SECM can in situ characterize the height and diameter changes in cells during the migration process19 and monitor the reactive oxygen species (ROS) released from living cells after alteration of cellular homeostasis.20–22 In the neuroscience field, various physiological processes (e.g., endocytosis and release of neurotransmitters) of living nerve cells have been characterized by SECM.23,24 For instance, Matsue et al. used SECM to detect the release of neurotransmitters (e.g., catecholamine) from living PC12 cells.25 Recently, our group achieved in situ recording of the respiratory activity and extracellular ROS levels of neurons under different temperatures using SECM.26 Therefore, SECM can be an appropriate approach to characterize the dynamic changes in the redox balance and respiratory activity and to monitor the migration behavior of microglia during their early and over-activation states, which however has not been explored yet.
In this work, as illustrated in Scheme 1, we investigated the synergistic effect of a mechanical-inflammatory coupled microenvironment on the activation of microglia and its underlying mechanism. First, we cultured BV2 cells, a mouse microglia cell line, on polyacrylamide (PA) gels with tunable stiffness to mimic the mechanical microenvironment of microglia in the hippocampus under physiological and pathological stages. Then we added a lipopolysaccharide (LPS), a pro-inflammatory inducer of microglia activation, into the cell culture to construct the mechanical-inflammatory coupled microenvironment model of microglia. We characterized the expressions of proteins and cytokines, which are associated with the PIEZO1-related pathway (a mechanosensitive pathway), of the BV2 cells on the PA gels using immunofluorescence staining and western blotting methods. Subsequently, we applied SECM to in situ monitor the dynamic changes in the ROS levels, respiratory activity, and migration ability of BV2 cells under the mechanical-inflammatory microenvironment and found that microglia on the stiff ECM promoted the production of ROS to perturb redox balance and transformed into their early response states. And these microglia were more susceptible to the LPS and presented faster and severer activation responses than those on the soft ECM, indicating the synergistic effect of ECM stiffness and LPS treatment on microglia activation.
 | ||
| Scheme 1 Schematic diagram of investigation of the effect of the mechanical-inflammatory coupled microenvironment on microglia activation. (a) Culturing BV2 cells on the PA gels with three stiffness and adding a LPS to mimic the ECM stiffness-LPS microenvironment of the hippocampus. (b) Application of SECM to in situ monitor the ROS release, respiratory activity and migration ability of BV2 cells under a mechanical-inflammatory coupled microenvironment model. | ||
Results and discussion
Effect of ECM stiffness on microglia function
Considering that the migration and phagocytosis functions of microglia are the two key effect factors on their activation, we firstly studied the effect of the mechanical microenvironment on the morphology and proliferation of microglia. To mimic the ECM stiffness of the hippocampus at the physiological and pathological states (i.e., soft (∼100 Pa), intermediate (∼300 Pa) and stiff (∼1000 Pa) states12), we constructed the mechanical microenvironment models of microglia through culturing BV2 cells on the as-prepared PA gels with a stiffness of 96.2 ± 20.1, 297.2 ± 33.7 and 1059.4 ± 166.3 Pa, respectively (Fig. S1†). We observed that the BV2 cells cultured on the 96.2 Pa and 297.2 Pa PA gels presented actin-rich filopodia-like protrusions and round shapes (Fig. 1a), indicating that the microglia on the substrates with soft and medium stiffness were under weakly polarized and amoeboid states, respectively. In comparison, the BV2 cells on the 1059.4 Pa PA gels showed an elongated morphology and lamellipodia-like polarized phenotype. These results demonstrate that the stiff substrate may cause the rearrangement of the cytoskeleton and promote spreading and phenotypic polarization of microglia, which would affect their migration ability.12 We then studied the effect of substrate stiffness on the proliferative activity of BV2 cells using an EdU proliferation assay kit. We observed that the microglia on the 1059.4 Pa PA gels exhibited a rapid proliferative activity compared to those on the PA gels with a stiffness of 96.2 Pa and 297.2 Pa (Fig. 1a), indicating the enhanced proliferative activity of BV2 cells with increasing ECM stiffness. | ||
| Fig. 1 Characterization results of cytoskeletal actin, proliferation, ROS levels, and proteins of the PIEZO1-related pathway of BV2 cells on the PA gels with a stiffness of 96.2, 297.2 and 1059.4 Pa, respectively. (a) Fluorescence images of the cytoskeletal arrangement and morphology (F-actin: green and nuclei: blue) and EdU-and DAPI-stained images, (b) fluorescence images of intracellular ROS levels, (c) immunofluorescence images of PIEZO1 and fluorescence images of the Ca2+ label, and (d) western blotting analysis of PIEZO1, RAC1 and NOX2 expressions of BV2 cells on the PA gels with a stiffness of 96.2, 297.2 and 1059.4 Pa, respectively (n = 3). | ||
Under the pathological conditions such as neurodegenerative and acute inflammatory conditions, microglia tend to respond to changes in their microenvironment and release inflammatory factors and ROS.27 We thus studied the effect of substrate stiffness on the oxidative stress state of BV2 cells on PA gels with three stiffness through measuring their ROS production using the fluorescence imaging method. We did not observe an obvious fluorescence signal of ROS in the BV2 cells on the PA gels with three stiffness in the first 12 h (Fig. 1b), indicating that the BV2 cells on the PA gels did not obviously produce ROS in the first 12 h. After 24 h, the BV2 cells on the 1059.4 Pa PA gels started to exhibit upregulated ROS levels, which were higher than those on the PA gels with a stiffness of 96.2 Pa and 297.2 Pa. It indicates that the microglia on the stiff substrate were activated, leading to a change in their oxidative stress state. At 36 h, there were more microglia with upregulated ROS levels on the 1059.4 Pa PA gel compared to those at 24 h. The fluorescence intensities of the intracellular ROS of the BV2 cells on the 1059.4 Pa PA gels were significantly higher than those at 24 h, indicating that the microglia on the stiff ECM transformed into their activation state, while the microglia on the soft substrate remained in their resting state without activation. The microglia on the stiff substrate with the upregulated ROS levels may be due to the mechanically induced inflammation response of microglia, and the stiff ECM can induce oxidative stress and activation of microglia.3 These results demonstrate that the microglia on the stiff ECM had a morphological change, increased proliferation and higher ROS levels compared to those on the soft ECM, which may be related to the microglia activation induced by the stiff ECM.
Although the mechanosensitive protein-PIEZO1 has been reported to be expressed in glial cells to regulate their activation,10,28 the expression of PIEZO1 in microglia and the mechanotransduction process are not yet well understood. To investigate whether the microglia activation is affected by the PIEZO1-related signaling pathway, we characterized the expressions of PIEZO1 of the BV2 cells on the PA gels using the immunofluorescence staining method. We observed that the expressions of PIEZO1 in the BV2 cells increased with increasing substrate stiffness (Fig. 1c). Considering that PIEZO1 can activate the Ca2+ influx-RAC1-NOX2-ROS signaling pathway,29 we further characterized the intracellular Ca2+ concentrations and expressions of PIEZO1, RAC, and NOX2 of the BV2 cells on the PA gels using fluorescence imaging and western blotting methods (Fig. 1c and d). The intracellular Ca2+ concentrations in the microglia increased with increasing substrate stiffness, confirming that the over-expression of PIEZO1 can promote the intracellular Ca2+ influx. Moreover, the western blotting results demonstrated that the protein expressions of PIEZO1, RAC1 and NOX2 in microglia increased with increasing ECM stiffness, which may activate the signaling pathway of Ca2+ influx-Rac1-NOX2-ROS and result in the production of ROS.29 These results indicate that PIEZO1 is overexpressed in the microglia on the stiff substrate, which can be the reason for upregulation of ROS levels driven by the stiff ECM, and microglia present upregulated ROS levels with increasing ECM stiffness and transform into their activation state.
Synergistic effect of ECM stiffness and LPS treatment on microglia activation
Besides the mechanical microenvironment, the inflammatory microenvironment can also activate microglia into an activation state in a rapid and severe process, as reflected by the inflammatory factor release and ROS production.30,31 To explore the synergistic effect of the mechanical-inflammatory coupled microenvironment on the microglia activation, we treated microglia on the PA gels with a LPS, a typical pro-inflammatory inducer, to mimic their mechanical-inflammatory coupled microenvironment. Both mechanical and inflammatory cues can upregulate the ROS production of microglia to induce their activation by the over-expression of NOX2, which plays an important role in catalyzing molecular oxygen (O2) on the outer surface of the cell membrane to convert into a superoxide anion (O2−) and hydrogen peroxide (H2O2), and finally the cell produces H2O2 with high concentration.32,33 Hence, the over-expression of NOX2 can directly affect the ROS production and redox balance. We characterized the expressions of NOX2 in the BV2 cells on the PA gels using the western blotting method (Fig. 2a). We observed that the expressions of NOX2 in the BV2 cells increased with increasing substrate stiffness, and a more significant increase of NOX2 was obtained after LPS treatment. We further characterized the ROS levels of BV2 cells on the PA gels before and after LPS treatment using the fluorescence method (Fig. 2b). After the LPS treatment, the ROS levels of BV2 cells increased with increasing substrate stiffness, and the intracellular fluorescence signals of ROS of BV2 cells on the 1059.4 Pa PA gels were significantly enhanced compared with those on the 96.2 and 297.2 Pa PA gels, indicating that the microglia on the stiff substrate may transform into their over-activation states. | ||
| Fig. 2 Characterization results of proteins, ROS levels and cytokines of BV2 cells under the synergistic effect of ECM stiffness and LPS treatment. (a) Western blotting analysis of NOX2 expressions, (b) fluorescence images of intracellular ROS levels, and (c) relative protein expressions of TNF-α, IL-1β, IL-6 and NO levels of BV2 cells on the PA gels with a stiffness of 96.2, 297.2 and 1059.4 Pa, respectively, without and with LPS treatment (n = 3). Statistical significance: *P < 0.05, **P < 0.01, ***P < 0.001, and ****P < 0.0001 (one-way ANOVA). | ||
Since the over-production of ROS of microglia could promote their oxidative stress and neuroinflammation to produce pro-inflammation factors,34 we used ELISA and Griess reagent kits to measure the levels of pro-inflammation factors of microglia, including TNF-α, IL-1β, IL-6 and NO, on the PA gels before and after LPS treatment (Fig. 2c). After adding 1 μM LPS to the culture medium of BV2 cells, with increasing substrate stiffness from 96.2, 297.2 to 1059.4 Pa, the relative levels of TNF-α, IL-1β, IL-6 and NO of BV2 cells on the PA gels increased by (0.89 ± 0.11, 1.15 ± 0.23 and 1.25 ± 0.13), (0.55 ± 0.07, 0.59 ± 0.06 and 0.63 ± 0.04), (0.15 ± 0.02, 0.24 ± 0.02 and 0.32 ± 0.09) and (0.80 ± 0.10, 0.87 ± 0.07 and 0.59 ± 0.10), respectively. The results indicate that the pro-inflammatory factors and ROS levels were significantly upregulated with increasing substrate stiffness and after LPS treatment, proving that the expressions of the pro-inflammatory factors of microglia were the highest and an over-activation state occurred under the synergistic effect of stiff ECM and LPS treatment.
The production of ROS (e.g., H2O2) of microglia can reflect their immune-regulation and activation state, and microglia activation is accompanied by changes in their respiratory activity and migration behavior.35,36 Dynamic and in situ monitoring of the produced ROS, respiratory activity, and migration ability of microglia at early and over-activation states is thus important for understanding the physiological and pathological states of microglia. Next, we applied SECM to study the synergistic effect of the mechanical and inflammatory coupled microenvironment on the dynamic changes in the ROS levels, respiratory activity, and migration ability of microglia.
In Situ monitoring of ROS levels of activated microglia under the synergistic effect of ECM stiffness and LPS treatment
It has been reported that the upregulated ROS levels is a contributor to microglia activation, which may form a sustaining oxidative microenvironment to affect the inflammatory microenvironment of microglia.37 To further explore why microglia on the 1059.4 Pa PA gels presented upregulated ROS levels and the amount of the activated microglia gradually increased (Fig. 1b), we characterized both the intracellular and extracellular ROS levels of microglia on the 1059.4 Pa PA gels using the fluorescence imaging method and SECM. Before SECM measurements, we checked whether the pH values of solution would change during our experiments and whether [Ru(NH3)6]Cl3 as the redox mediator would affect the function of BV2 cells or not. First, the pH values of the cell culture medium and the advanced Tyrode's solution containing 1 mM [Ru(NH3)6]Cl3 without and with LPS treatment were measured by using a pH meter. From Fig. S2,† we can see that the pH values of both the cell culture medium and advanced Tyrode's solution containing 1 mM [Ru(NH3)6]Cl3 maintained nearly constant at around 7.0 during our experiments, indicating that the pH values of solution remained stable during our experiments and thus the function of BV2 cells would not be affected by the solution pH. Second, we measured the cell viability of BV2 cells on the PA gels with three stiffness and LPS treatment in the advanced Tyrode's solution with 1 mM [Ru(NH3)6]Cl3 using a CCK-8 detection assay kit. In Fig. S3,† there is no significant cell viability change of BV2 cells in either the culture medium or the advance Tyrode's solution containing [Ru(NH3)6]Cl3, indicating that [Ru(NH3)6]Cl3 had no obvious effect on the viability of BV2 cells. Therefore, we can monitor the ROS levels of microglia in the advanced Tyrode's solution containing [Ru(NH3)6]Cl3 in our SECM measurements.Next, from Fig. 3a, no obvious fluorescence signal of intracellular ROS of the BV2 cells on the 1059.4 Pa PA gels was observed after 24 h of cell cultivation. In comparison, we clearly observed H2O2 oxidation currents with periodic fluctuations as detected by the SECM probe (Fig. S4 and S5†), indicating the periodic release of H2O2 from microglia. It may be because the over-expression of NOX2 in the microglia accelerated the extracellular generation of H2O2, which gradually accumulated and led to the appearance of oxidative stress and thus increased the amount of the activated microglia.28 Then to explore the effect of ROS levels caused by the LPS-induced inflammation and oxidative stress in microglia, we monitored the changes in the intracellular ROS and extracellular H2O2 levels of the BV2 cells on the 1059.4 Pa PA gel after LPS treatment for 24 h using the fluorescence imaging method and SECM (Fig. 3b). Both the intracellular fluorescence signals of ROS and the extracellular H2O2 level monitored by SECM exhibited obvious increasing trends after LPS treatment. We can thus confirm that the microglia on the 1059.4 Pa PA gels could accelerate the production of H2O2, inducing more microglia to be activated by over-expression of NOX2, i.e., the microglia on the stiff substrate can transform into their early response state to trigger their oxidative stress.
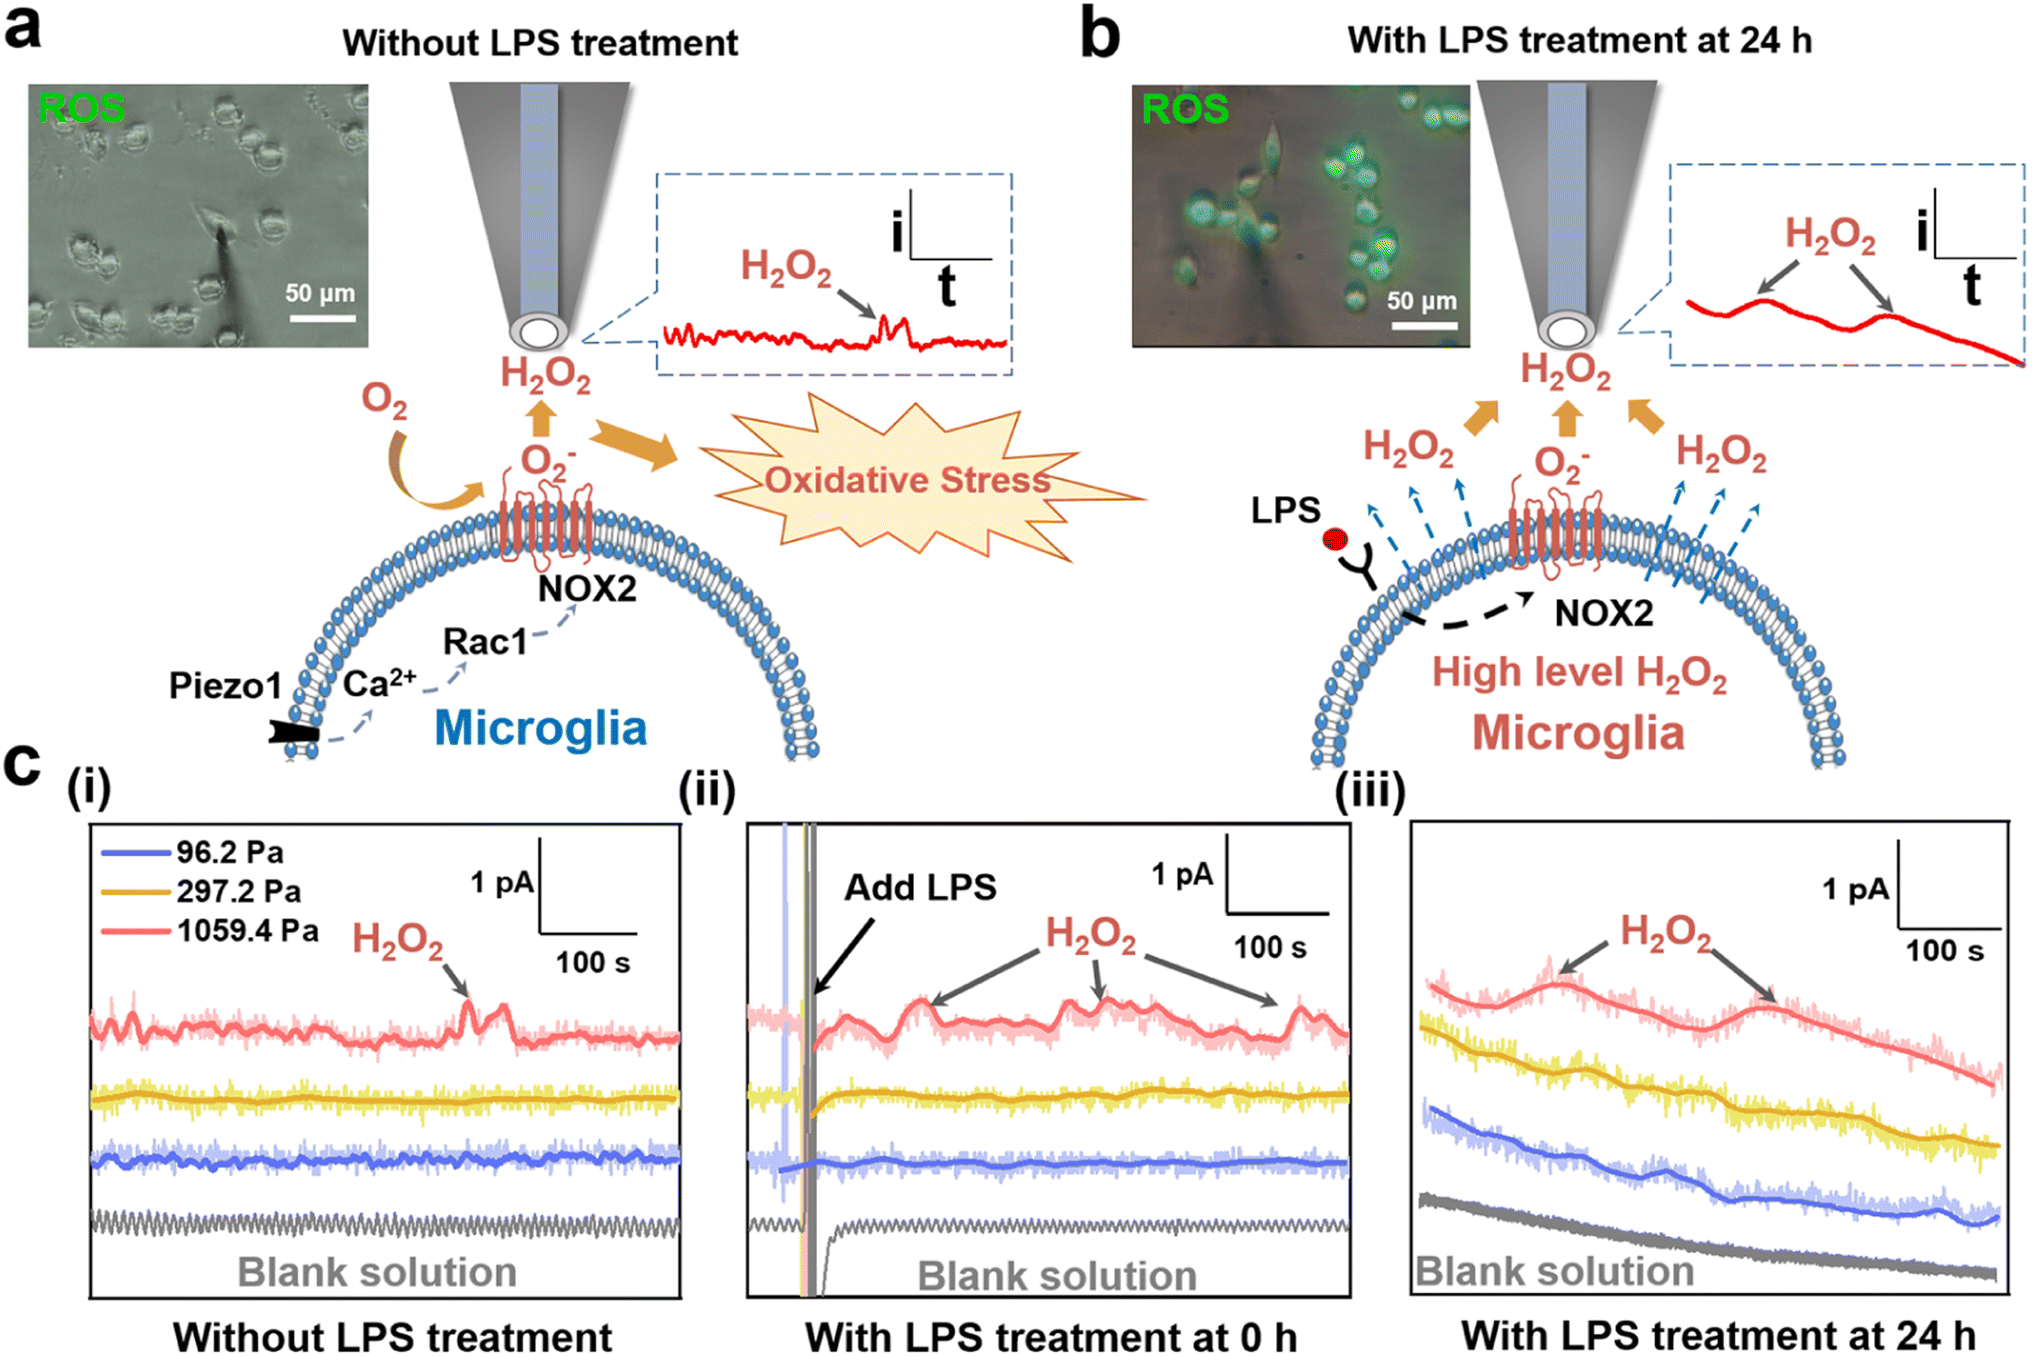 | ||
| Fig. 3 Monitoring of ROS levels of BV2 cells on the PA gels using the fluorescence imaging method and SECM. ROS fluorescence images and detection principle of SECM of H2O2 of the BV2 cells on the 1059.4 PA gels (a) without and (b) with LPS treatment. (c) Current–time curves of H2O2 oxidation of BV2 cells on the PA gels with a stiffness of 96.2, 297.2 and 1059.4 Pa, respectively, and with LPS treatment at 0 h and 24 h recorded by SECM (n = 3). All the SECM measurements were performed in an advanced Tyrode's solution containing 1 mM [Ru(NH3)6]Cl3 with using a 2 μm diameter Pt-modified carbon microelectrode as the SECM probe applied with a potential of 0.65 V (vs. Ag/AgCl RE). | ||
We further applied SECM to in situ record the dynamic changes in the H2O2 levels of BV2 cells on the PA gels after LPS treatment. As shown in Fig. 3c(i), the oxidation current of H2O2 generated from BV2 cells on the 1059.4 Pa PA gels was obviously higher than those on the 96.2 Pa and 297.2 Pa PA gels, respectively, indicating that the stiff substrate could upregulate the extracellular H2O2 level of microglia and may further perturb their redox balance. After LPS treatment, the oxidation current of H2O2 of the BV2 cells on the 1059.4 Pa PA gels continuously increased with more dramatic periodic fluctuation, and the H2O2 peak signal increased nearly threefold compared to that without LPS treatment (Fig. 3c(i) and (ii)). Meanwhile, the oxidation currents of H2O2 of the BV2 cells on the 96.2 Pa and 297.2 Pa PA gels did not show obvious change after LPS treatment, indicating that the microglia did not respond rapidly to the LPS treatment on the soft and medium substrates as that on the stiff substrate in a short period. We further utilized SECM to characterize the extracellular H2O2 of the BV2 cells on the PA gels with three stiffness after LPS treatment for 24 h. From Fig. 3c(iii), we observed that the oxidation currents of H2O2 generated from microglia on the PA gels after adding the LPS were higher than those without LPS treatment. The oxidation currents of H2O2 of the BV2 cells on the 1059.4 Pa PA gels were significantly higher than those on the 96.2 Pa and 297.2 Pa PA gels, respectively, indicating that the microglia on the 1059.4 Pa PA gel had the highest extracellular H2O2 level and severely disturbed redox balance among the three groups, which may lead to the production of oxidative stress.
To further reflect the changes of H2O2 levels of BV2 cells under different ECM stiffness and LPS treatment, we derived the charges of H2O2 of BV2 cells on the PA gels with three stiffness and LPS treatment with time through integrating the current signals and did the statistical analysis of charge. As shown in Fig. S6,† the charges of H2O2 of BV2 cells on the 1059.4 Pa PA gel without LPS treatment, and with LPS treatment at 0 h and 24 h were 39.8 ± 12.6 pC, 65.8 ± 17.1 pC, and 235.2 ± 22.8 pC, respectively, indicating that the stiff substrate can upregulate the extracellular H2O2 level of microglia and increased their susceptibility to the LPS-induced ROS production. The charges of H2O2 of BV2 cells on the 96.2 Pa and 297.2 Pa PA gels did not show obvious change either without or with LPS treatment at 0 h, while the charge of H2O2 of BV2 cells on the 96.2 Pa and 297.2 Pa PA gels increased to 127.3 ± 15.1 pC and 186.6 ± 19.7 pC after LPS treatment for 24 h. It indicates that the BV2 cells on the 96.2 and 297.2 Pa PA gels exhibited a less oxidative stress state compared to those on the PA gels with a stiffness of 1059.4 Pa. The above results confirm that the stiff ECM upregulated the extracellular ROS levels of microglia compared to those on the soft ECM and the microglia transformed into their early response state, which were more sensitive to the changes of the inflammatory microenvironment and further disrupted the redox balance of microglia to aggravate the neuroinflammation response.
In Situ monitoring of respiratory activity of microglia under the synergistic effect of ECM stiffness and LPS treatment
Considering that the respiratory activity of microglia is closely related to their activation, proliferation and metabolism states,38,39 we used SECM to in situ characterize the oxygen concentration around microglia on PA gels with different stiffness and after LPS treatment. First, to in situ characterize the concentration gradient of oxygen around the cell surface, we need to accurately control the distance between the cell surface and the SECM probe.40 In this case, to avoid the effect of cell surface and oxygen crossing the cell membrane during the process of positioning the SECM probe to approach the cell surface, we proposed a new retract curve mode of SECM to monitor the oxygen concentration around the BV2 cell surface on the PA gels. Briefly, we used a carbon microelectrode as the SECM probe and [Ru(NH3)6]Cl3 as the redox mediator in the SECM system. First, we approached the SECM probe applied with the reduction potential of [Ru(NH3)6]Cl3 (−0.35 V vs. Ag/AgCl RE) to the cell surface and found the highest point of the cell surface. Then we switched the SECM probe potential to the oxygen reduction potential (−0.8 V vs. Ag/AgCl RE) (Fig. S7†) and retracted the SECM probe away from the highest point of the cell surface to the bulk solution, during which the probe currents were recorded (Fig. 4a). To verify the accuracy of the SECM retract curve mode, we also recorded the approach curve with the probe applied with an oxygen reduction potential of −0.8 V (vs. Ag/AgCl RE) from the stop position of the retract curve to approach the highest point of the cell. Through comparing the obtained probe retract and approach curves, we found that the two curves exactly overlapped (Fig. 4b), indicating that the retract curve could also characterize the concentration gradient of oxygen around the BV2 cell surfaces. Moreover, the retract curve of SECM used in our work took less time to approach the cell surface compared to that of the approach curve mode, which is helpful for tracking the fast and dynamic change in the respiratory activity of microglia after LPS treatment. Thus, we used the retract curve mode of SECM to characterize the concentration gradient of oxygen around the microglia surface to assess their respiratory activity in this work. | ||
| Fig. 4 In situ monitoring of the synergistic effect of ECM stiffness and LPS treatment on the respiratory activity of BV2 cells using SECM. (a) Diagram of retract curve mode of SECM: the approach curve to determine the highest point of the cell (left) and the retract curve to determine the oxygen around cell (right). (b) Overlapped SECM approach curve and retract curve to/away from microglia from the same distance above the highest point of cell at the z position with a fixed x–y position (probe potential: 0.8 V vs. Ag/AgCl RE). (c) SECM retract curves to the BV2 cells on the PA gels with a stiffness of 96.2, 297.2 and 1059.4 Pa with and without LPS treatment. (d) Statistical results of (c) (n = 9). (e) Real-time changes in the oxygen concentrations of BV2 cell surfaces on the PA gels with a stiffness of 96.2, 297.2 and 1059.4 Pa after adding the LPS (n = 3). All the SECM measurements were performed in an advanced Tyrode's solution containing 1 mM [Ru(NH3)6]Cl3 using a 1.2 μm diameter carbon microelectrode as the SECM probe applied with an approach/retract speed of 0.2 μm s−1. The probe potentials were −0.35 or −0.8 V (vs. Ag/AgCl RE), respectively. | ||
Fig. 4c shows the obtained SECM experimental retract curves and the theoretical simulation curves to the highest points of BV2 cells on the PA gels with three stiffness and with/without LPS treatment. Then through fitting the experimental retraction curves with the theoretical model (Fig. S8a and b†), we obtained the quantitative information of the oxygen concentration gradient around the BV2 cell surface on the PA gels with different stiffness and after LPS treatment (Fig. S8c†). From Fig. 4c, we can obtain that the oxygen concentrations around the BV2 cell surfaces on the 96.2, 297.2 and 1059.4 Pa PA gels were 0.215, 0.208 and 0.200 mM, respectively, indicating that the respiratory activity of BV2 cells increased with increasing substrate stiffness. After LPS treatment for 24 h, the oxygen concentrations around the BV2 cell surfaces on the 96.2, 297.2 and 1059.4 Pa PA gels decreased to 0.195, 0.181 and 0.164 mM, respectively, indicating that the respiratory activity of BV2 cells on the PA gels all increased after LPS treatment, and the BV2 cells on the 1059.4 Pa PA gels exhibited the strongest respiratory activity compared to those on the PA gels with a stiffness of 96.2 and 297.2 Pa (Fig. 4c and d). It can be because microglia on the stiff substrate can transform into their early response state and become a more severe pathological activation state after LPS treatment, which upregulated the metabolism-related cytokines and enhanced the metabolism-related respiratory activity of microglia.
To further explore the effect of ECM stiffness on the sensitivity of microglia to the LPS, we used SECM to real-time monitor the respiratory activity of BV2 cells on the PA gels after LPS treatment (Fig. 4e). We observed that oxygen concentration around the BV2 cell surfaces on the 96.2 Pa PA gels did not show a significant change after LPS treatment immediately and then began to decrease after 10 min and finally became stable at 1 h. In comparison, the oxygen concentration around the BV2 cell surfaces on the 297.2 Pa and 1059.4 Pa PA gels rapidly changed after LPS treatment, indicating that the respiratory activities of microglia on the PA gels with medium and stiff stiffness increased. For example, the oxygen concentrations around the BV2 cell surfaces on the 1059.4 Pa PA gels rapidly decreased from 0.209 mM (0 min, without adding the LPS) to 0.201, 0.196, 0.196, 0.191 and 0.187 mM after LPS treatment at 5, 10, 20, 30 and 60 min, respectively. Thus, the LPS is more likely to affect the respiratory activity and then the activation state of microglia on the stiff ECM. From the above results, we can conclude that the respiratory activity of microglia increased with increasing ECM stiffness, and the respiratory activity of microglia on the stiff substrate was more sensitive to the LPS treatment, confirming that the respiratory activity of microglia was synergistically influenced by ECM stiffness and LPS treatment.
Synergistic effect of ECM stiffness and LPS treatment on microglia migration
Finally, considering that the activated microglia have greater migration ability than the resting microglia and actively play the phagocytic role in removing cellular debris,41 we used the fluorescence imaging method and SECM to characterize the migration ability of microglia on the stiff substrate. First, the fluorescence images of the intracellular ROS levels in the BV2 cells on the 1059.4 Pa PA gels showed that the BV2 cells were activated with upregulated ROS levels and presented an obvious migration behavior within 5 min, indicating the obvious oxidative stress and migration ability of microglia on the stiff substrate (Fig. 5a). Second, we used SECM to in situ record the morphology of BV2 cells on the PA gels based on the recorded reduction currents of [Ru(NH3)6]Cl3 at the SECM probe when scanning across the cell surface. To quantitatively compare the changes in the migration distance and cell height of microglia during migration, we normalized the reduction currents of [Ru(NH3)6]Cl3 by dividing them by the maximum background currents. From the SECM images (Fig. 5b), we observed that the BV2 cell tended to migrate randomly to the right, and the changes in the normalized reduction currents of BV2 cells at 0 and 5 min were 0.50 and 0.46, indicating that microglia on the stiff substrate exhibited obvious change in the cell height during migration. | ||
| Fig. 5 Synergistic effect of ECM stiffness and LPS treatment on microglia migration measured by fluorescence microscopy and SECM. (a) Fluorescence microscopy images (green: ROS) and (b) SECM images of BV2 cells on the 1059.4 Pa PA gels. (c) Wind-rose plots of BV2 cell trajectories (six randomly selected cell trajectories in 35 min for each set of conditions). Statistical diagram of migration distances of BV2 cells on the PA gels with a stiffness of 96.2, 297.2 and 1059.4 Pa, respectively, (d) without LPS treatment and (e) with LPS treatment. (f) Random motility coefficient of BV2 cells. (g) Cell heights of BV2 cells on the 96.2, 297.2 and 1059.4 Pa PA gels with and without adding the LPS. All the SECM measurements were performed in an advanced Tyrode's solution containing 1 mM [Ru(NH3)6]Cl3 using a 10 μm diameter Pt microelectrode as the SECM probe with an applied potential of −0.35 V (vs. Ag/AgCl RE) (scan range: 100 × 100 μm2 and scan rate: 5 μm s−1). **P < 0.01, ***P < 0.001, and ns: non-significant (one-way ANOVA). | ||
Third, to further explore the synergistic effect of the mechanical-inflammatory coupled microenvironment on the microglia migration, we applied SECM to in situ track the migration behavior of BV2 cells on the PA gels with different stiffness and after LPS treatment. From the SECM images of six randomly selected BV2 cells on the PA gels (Fig. S9†), we subtracted the cell positions, from which we drew the cell motion trajectories every seven minutes using an image segmentation algorithm following the protocol in the literature.42 The obtained wind-rose plots of real-time migration trajectories of BV2 cells on the PA gels with three stiffness and after adding the LPS showed that the BV2 cells on the 96.2 Pa PA gels did not show obvious migration behavior, while the BV2 cells on the 297.2 Pa and 1059.4 Pa PA gels showed migration ability with a random migration distances of 4.2 ± 1.13 and 8.2 ± 1.43 μm, respectively (Fig. 5c). The migration distances of the BV2 cells increased with increasing substrate stiffness within 35 min. After LPS treatment, the migration distances of the BV2 cells on the PA gels with three stiffness all increased with the longest distance of 15.2 ± 1.13 μm for the BV2 cells on the 1059.4 Pa PA gels, confirming that the LPS can significantly improve the migration ability of microglia on the stiff ECM.
To further evaluate the migration ability of microglia under different ECM stiffness and LPS treatment, we calculated the absolute migration distances of BV2 cells on the PA gels with three stiffness and with LPS treatment. The absolute migration distances of BV2 cells on the 1059.4 Pa PA gels were longer than those on the 96.2 Pa and 297.2 Pa PA gels, respectively (Fig. 5d and e). We observed a significant increase of the absolute migration distances of BV2 cells after LPS treatment, demonstrating that the migration ability of microglia on the stiff substrate rapidly enhanced after LPS treatment. To evaluate the change in the migration ability of BV2 cells on the PA gels, we also calculated the mean squared displacement of the BV2 cell center in a given time interval and obtained the random motility coefficients of BV2 cells (Fig. 5f). We observed that the random motility coefficients of microglia increased with the increased substrate stiffness. After LPS treatment, the random motility coefficients of microglia on the PA gels with a stiffness of 96.2 Pa and 297.2 Pa increased by 0.39 ± 0.157 and 0.69 ± 0.116, respectively, while the random motility coefficients of BV2 cells on the 1059.4 Pa PA gels only increased by 0.28 ± 0.251, indicating that the LPS could increase the random motion coefficient of microglia on the soft substrate. It can be because the microglia on the soft and medium substrates remained in their resting state without activation, which were more likely to respond to the LPS and then increased their random motility ability to monitor the microenvironment change.41 Moreover, since the cell migration process is also accompanied by cell height change, we also analyzed the height changes in BV2 cells on the PA gels and after LPS treatment during migration (Fig. 5g). The cell heights of BV2 cells on the 96.2 Pa and 297.2 Pa PA gels had no significant change after LPS treatment, while the cell heights on the 1059.4 Pa PA gels significantly decreased by 4.52 ± 2.124 μm after LPS treatment, which may be related to their increased migration ability and activation state.43 These results demonstrate that the stiff substrate can enhance the migratory ability of microglia to increase the migration distances, while the LPS could greatly enhance the surveillance capacity of microglia on the soft and medium substrates to monitor their response to the microenvironment change.
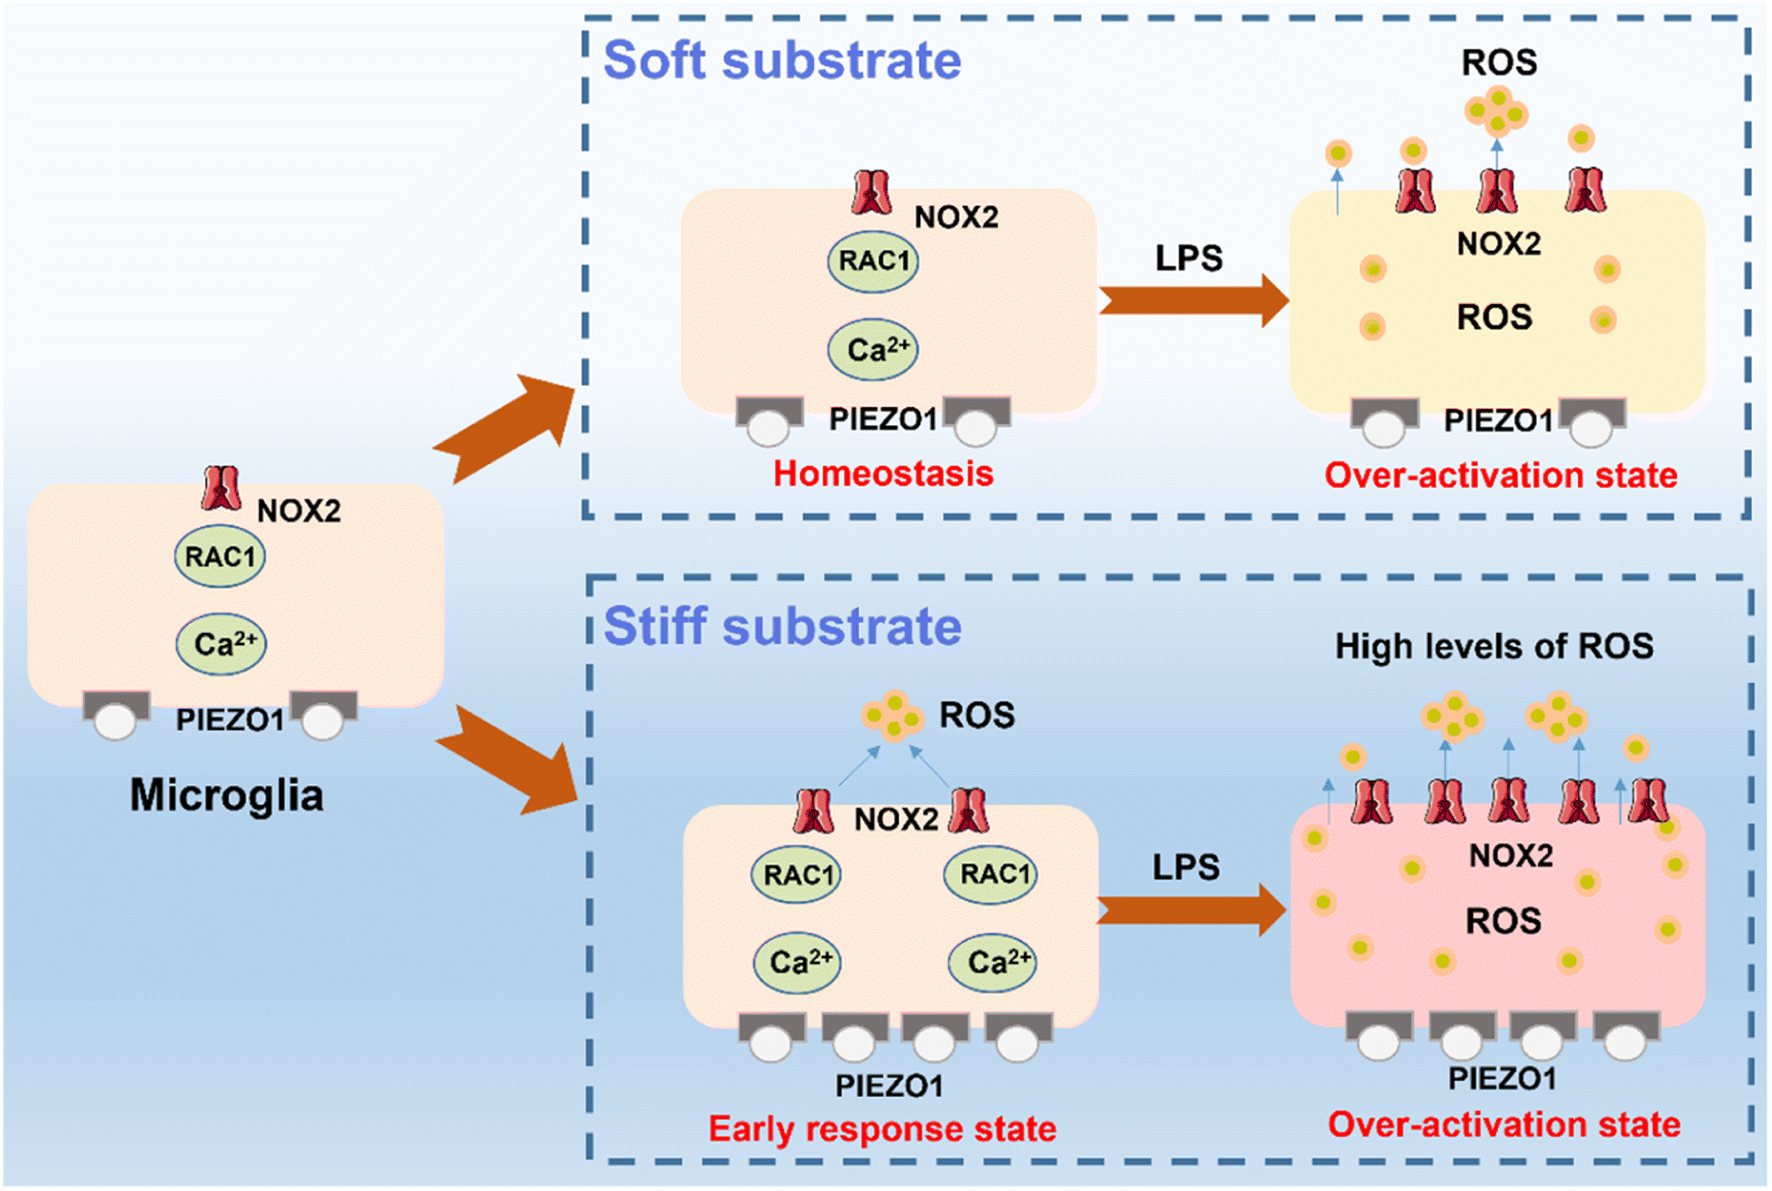
According to the above results, we can confirm the synergistic effect of ECM stiffness and LPS treatment on the activation of microglia. As schematically shown in Fig. 6, microglia on the stiff substrate transform into their early response state, which upregulates the extracellular ROS levels by the PIEZO1-Ca2+ influx-Rac1-NOX2-ROS related pathway to trigger the oxidative stress, demonstrating that the activation of microglia is closely related to the stiff ECM. Importantly, we found that the microglia on the stiff ECM are more sensitive to LPS treatment and produce more ROS and inflammatory factors, and have increased respiratory activity and migration ability. This is because microglia are disturbed by their own redox balance and easier to change to their activation state and then exacerbate the microglia-associated inflammatory response and transform into their over-activation state.
 | ||
| Fig. 6 Scheme of mechanisms of the synergistic effect of the mechanical and inflammatory microenvironment on microglia activation. | ||
Conclusions
In this work, we explored the matrix stiffness-dependent activation process of microglia in response to inflammatory cues. And we achieved the in situ monitoring of rapid changes in the activation of microglia under a mechanical-inflammatory coupled microenvironment. Firstly, through the constructed in vitro mechanical microenvironment model of microglia for mimicking the physiological and pathological mechanical states of the hippocampus and the characterization results of the PIEZO1-related pathway using immunofluorescence staining and western blotting methods, we found that microglia activation was associated with the mechanotransduction process of the PIEZO1-Ca2+ influx-Rac1-NOX2-ROS related pathway. Then through the in situ characterization results of SECM of the dynamic changes in the ROS levels, respiratory activity and migration ability of microglia on the PA gels with LPS treatment, we found that microglia on the stiff substrates exhibited increased ROS levels, respiratory activity and migration ability compared to those on the soft and medium substrates before and after LPS treatment. And microglia on the stiff ECM promoted extracellular production of ROS and transformed into their early response state, and these microglia were more susceptible to the LPS and transform into their over-activation states in a short time, promoting the synergistic effect of stiff ECM-LPS treatment on microglia activation. These results indicate the mechanism of matrix stiffness-dependent activation of microglia in response to an inflammatory microenvironment, whereby microglia on the stiff ECM are disturbed by their own redox balance and easier to change to their activation state and then exacerbate the microglia-associated inflammatory response and transform into their over-activation state. The finding in this work can contribute to a better understanding of the activation state and behavior of microglia and provides references for exploring the immune-regulation function of microglia in the mechanical-inflammatory microenvironment.Experimental
PA gel preparation
The PA gels for cultivation of microglia were prepared according to previous reports.44 In brief, the PA gels with different stiffness were obtained by tuning the proportions of 40% (w/v) acrylamide, 2% (w/v) N,N-methylene-bis-acrylamide, 10% (w/v) ammonium persulfate and 1% (w/v) N,N,N,N′-tetramethylethylenediamine. For obtaining the PA gels with stiffness around 100, 300 and 1000 Pa, the proportions of acrylamide (%)/ammonium persulfate (%) were regulated to 5/0.04, 5/0.07 and 7.5/0.06, and the volumes of ammonium persulfate and N,N,N,N′-tetramethylethylenediamine were maintained at 1/100 and 1/1000 of the overall volume, respectively. Then the premixed solution (45 μL) was placed in glass bottom dishes (NEST, 35 mm) and then covered with glass coverslips (NEST, 18 mm), which were functionalized with a 200 μL hydrophilic reagent (2% 3-(trimethoxysilyl)propyl methacrylate in ethyl alcohol) and hydrophobic reagent (dichloromethylsilane) beforehand to assure the adhesion of PA gels to the glass bottom dishes and easy removal of glass coverslips. After polymerization at 25 °C for 15 min, the PA gels and coverslips were soaked in PBS for 20 min, and then the coverslips were removed to obtain PA gels. The PA gels were soaked and washed with sterile PBS three times and functionalized with 300 μL hydrazine hydrate overnight, and then treated with 5% (w/v) acetic acid solution for 1 h, and subsequently soaked and rinsed in sterile PBS every five min three times. Then these PA gels were irradiated with UV light for 30 min to sterilize. Finally, the gels were treated with 1% poly-D-lysine solution for 30 min at 37 °C to enable conjugation to PA gels for cell adhesion, and washed with sterile PBS every five minutes three times. The stiffness of the prepared PA gels was measured using a Nanoindenter instrument (Optics 11, Netherlands).Cell culture and LPS treatment
The BV2 cells purchased from American Type Culture Collection ((ATCC), U.S.A.) were cultured with a complete medium containing 87% DMEM basic medium, 10% fetal bovine serum, 1% HEPES, 1% GlutaMAX-1 and 1% penicillin/streptomycin in an incubator at 37 °C with 5% CO2. In all the experimental groups, we used the BV2 cells of the logarithmic growth phase and digested them with trypsin (without phenol and EDTA) and then seeded them on the PA gels with a density of 5 × 104 cm−2. Then, the BV2 cells were cultured and incubated on the PA gels for 12, 24 and 36 h. For the LPS treatment experiments, the medium was replaced with fresh complete medium containing 1 μM LPS, and then cultured for 24 h before SECM experiments.SECM measurements
The SECM platform used in this work was constructed by integrating a SECM instrument (ElProScan PG618, HEKA Elektronik GmbH, Harvard Bioscience Inc.) with an inverted fluorescence microscope (Olympus-IX53, Olympus Co., Ltd, Japan). Moreover, a combination of a heated incubator on the SECM system was used to sustain the cell culture at a constant temperature of 37.0 ± 0.1 °C. A three-electrode system was used for all the SECM experiments, containing a 1.2 μm diameter carbon microelectrode (RG = 1.13, RG is the ratio of the surrounding glass sheath to the metal disk) or a 2 μm diameter Pt-modified carbon microelectrode (RG = 1.12) or a 10 μm diameter Pt electrode (RG = 2) as the working electrode, and a 0.6 mm diameter Ag/AgCl wire and a 0.5 mm diameter platinum wire as the reference electrode (RE) and counter electrode (CE), respectively.Before SECM experiments, the BV2 cells were seeded on the PA gels at a density of 2 × 10⁴ cells cm−2 and placed in an incubator (5% CO2, 37 °C) for 24 h. Then the culture medium of BV2 cells was replenished with an advanced Tyrode's solution containing 1 mM [Ru(NH3)6]Cl3 and equilibrated for 15 min. Subsequently, the SECM probe with an applied potential of −0.35 V (vs. Ag/AgCl RE) was approached to the cell surface and then raised by another 1 μm to move to the cell edge. Lastly, the probe currents across the BV2 cell surface along x-axis and y-axis directions with the fixed z direction were recorded to acquire the highest position of the cell.
For continuously monitoring the H2O2 generated from BV2 cells on the PA gels and after adding the LPS, the SECM probe was first approached to the BV2 cell surface at about 20 μm and then positioned 1 μm above the highest point of the cell. Subsequently, a potential of 0.65 V (vs. Ag/AgCl RE) was applied to the SECM probe and the current–time curve for H2O2 oxidation was recorded. For characterization of the concentration gradient of oxygen around the BV2 cells on the PA gels, the SECM probe applied with a potential of −0.35 V (vs. Ag/AgCl RE) was firstly placed about 20 μm above the BV2 cell surface and then approached to the highest point of the cell with an approach velocity of 0.2 μm s−1. Subsequently, the SECM probe applied with a potential of −0.8 V (vs. Ag/AgCl RE) was retracted to the highest point of the cell at about 10 μm with a velocity of 0.2 μm s−1. Then, the SECM retract curves were recorded and the real-time changes in the oxygen concentrations of BV2 cell surfaces on the PA gels after adding the LPS at different times were obtained. For characterization of the migration of BV2 cells, the SECM probe was first positioned approximately 2 μm above the highest point of the BV2 cell and then biased at −0.35 V (vs. Ag/AgCl RE). The constant height mode of SECM was used to scan across BV2 cells with scan areas of 100 μm × 100 μm and scan rates of 5 μm s−1.
SECM theoretical model
The changes in the respiratory activity of BV2 cells on the PA gels were acquired by simulating the retract curves of SECM experiments with the theoretical curves.45,46 In detail, dissolved oxygen was used as the redox mediator in the bulk solution, which is reduced to hydroxide (O2 + 2H2O + 4e− → 4OH−) at the SECM probe. The solution was air-saturated and thus the oxygen concentration in the bulk solution (∼0.25 mM) would not obviously change with the oxygen consumption of BV2 cells.40 The simulation model of the SECM system was established in a two-dimensional axisymmetric coordinate system using COMSOL Multiphysics software 5.5 (COMSOL Inc., Sweden). As shown in Fig. S8a,† the r-axis and z-axis are parallel and perpendicular to the carbon microelectrode surface, respectively. The origin of the coordinate axes is set at the center of the carbon microelectrode (0.6 μm in radius and RG = 1.13).Based on previous work,47 the definitions of the domain, diffusion and model boundary of the redox medium were determined (Table S1†). As shown in Fig. S8b,† the bulk solution and the cell are divided into two separate regions and the diffusion of dissolved oxygen in both regions follows Fick's second law of diffusion, which can be expressed by eqn (1) and (2).
 | (1) |
 | (2) |
The boundary of the cell membrane should be defined as the flux (eqn (3)). The coefficient (Qm) is defined as the speed of oxygen across the cell membrane, which is driven by the difference in concentration between the bulk solution and the cell.
| fin = Qm(CB − CC) | (3) |
The oxygen concentration around the cell surface is acquired by integrating the flux on the surface of the carbon disk at each simulated electrode position (Fig. S8c†). The current on the carbon disk surface can be calculated using eqn (4).
 | (4) |
![[thin space (1/6-em)]](https://www.rsc.org/images/entities/char_2009.gif) 485 C mol L−1), and a is the SECM probe radius (a = 0.6 μm in this work). The model geometry was finer meshed before computation. The cell geometry in the SECM experiments, the parameterized probe position, and Qm were used to obtain the theoretical retract curves using the parametric sweep function of COMSOL. Through adapting the Qm value and the distance between the SECM probe and the cell, theoretical retract curves with varied oxygen concentrations around the cell surface can be obtained.
485 C mol L−1), and a is the SECM probe radius (a = 0.6 μm in this work). The model geometry was finer meshed before computation. The cell geometry in the SECM experiments, the parameterized probe position, and Qm were used to obtain the theoretical retract curves using the parametric sweep function of COMSOL. Through adapting the Qm value and the distance between the SECM probe and the cell, theoretical retract curves with varied oxygen concentrations around the cell surface can be obtained.
Data availability
Experimental details (including chemicals and reagents, western blotting analysis, measurements of TNF-α, IL-1β, IL-6, NO and ROS levels of BV2 cells after LPS treatment, preparation of SECM probes, characterization of SECM probes, and cyclic voltammograms of dissolved oxygen in advanced Tyrode's solution), the parameters of the SECM theoretical model and the supporting experimental data are all provided in the ESI.†Author contributions
Y. L. L., F. X. and F. L. conceived the ideas and designed the experiments. F. X. and F. L. directed the cell and SECM experiments. Y. L. L., J. J. Z., Y. B. L., Y. X. Z., S. K., J. Z. and H. Z. conducted the experiments and analyzed the data. All authors interpreted data and contributed to the writing of the manuscript.Conflicts of interest
There are no conflicts to declare.Acknowledgements
This work was financially supported by the National Natural Science Foundation of China (22174106 and 22127803), the Natural Science Foundation of Shaanxi Province, China (2020JC-06) and the Fundamental Research Funds for the Central Universities (22127803HZ and SY6J007). We thank Dr Frank Wang from HEKA Elektronik GmbH for the technical support with the SECM instrument.Notes and references
- M. Colonna and O. Butovsky, Microglia function in the central nervous system during health and neurodegeneration, Annu. Rev. Immunol., 2017, 35, 441–468 CrossRef CAS.
- M. Prinz and J. Priller, Microglia and brain macrophages in the molecular age: from origin to neuropsychiatric disease, Nat. Rev. Neurosci., 2014, 15, 300–312 CrossRef CAS.
- L. Bruno, S. Karagil, A. Mahmood, A. Elbediwy, M. Stolinski and F. E. Mackenzie, Mechanosensing and the hippo pathway in microglia: A potential link to Alzheimer's Disease pathogenesis?, Cells, 2021, 10, 3144 CrossRef CAS.
- Y. Hu, G. Huang, J. Tian, J. Qiu, Y. Jia, D. Feng, Z. Wei, S. Li and F. Xu, Matrix stiffness changes affect astrocyte phenotype in an in vitro injury model, NPG Asia Mater., 2021, 13, 35 CrossRef.
- J. Hu, Q. Chen, H. Zhu, L. Hou, W. Liu, Q. Yang, H. Shen, G. Chai, B. Zhang, S. Chen, Z. Cai, C. Wu, F. Hong, H. Li, S. Chen, N. Xiao, Z. Wang, X. Zhang, B. Wang, L. Zhang and W. Mo, Microglial Piezo1 senses Aβ fibril stiffness to restrict Alzheimer's disease, Neuron, 2022, 111, 1–15 Search PubMed.
- C. M. Hall, E. Moeendarbary and G. K. Sheridan, Mechanobiology of the brain in ageing and Alzheimer's disease, Eur. J. Neurosci., 2021, 53, 3851–3878 CrossRef CAS.
- O. Garaschuk and A. Verkhratsky, in Microglia: Methods and Protocols, ed. O. Garaschuk and A. Verkhratsky, Springer, New York, NY, 2019, pp. 27–40, DOI:10.1007/978-1-4939-9658-2_3.
- T. Yang, Z. Zhu, E. Yin, Y. Wang, C. Zhang, H. Yuan, H. Zhang, S. Jin, Z. Guo and X. Wang, Alleviation of symptoms of Alzheimer's disease by diminishing Aβ neurotoxicity and neuroinflammation, Chem. Sci., 2019, 10, 10149–10158 RSC.
- T.-T. Ta, H. O. Dikmen, S. Schilling, B. Chausse, A. Lewen, J.-O. Hollnagel and O. Kann, Priming of microglia with IFN-γ slows neuronal gamma oscillations in situ, Proc. Natl. Acad. Sci. U. S. A., 2019, 116, 4637–4642 CrossRef CAS PubMed.
- P. Ayata and A. Schaefer, Innate sensing of mechanical properties of brain tissue by microglia, Curr. Opin. Immunol., 2020, 62, 123–130 CrossRef CAS.
- S. J. Blaschke, S. Demir, A. König, J.-A. Abraham, S. U. Vay, M. Rabenstein, D. N. Olschewski, C. Hoffmann, M. Hoffmann, N. Hersch, R. Merkel, B. Hoffmann, M. Schroeter, G. R. Fink and M. A. Rueger, Substrate elasticity exerts functional effects on primary microglia, Front. Cell. Neurosci., 2020, 14, 590500 CrossRef CAS.
- L. Bollmann, D. Koser, R. Shahapure, H. Gautier, G. Holzapfel, G. Scarcelli, M. Gather, E. Ulbricht and K. Franze, Microglia mechanics: immune activation alters traction forces and durotaxis, Front. Cell. Neurosci., 2015, 9, 363 Search PubMed.
- O. Garaschuk and A. Verkhratsky, in Microglia: Methods and Protocols, ed. O. Garaschuk and A. Verkhratsky, Springer, New York, NY, 2019, pp. 3–11, DOI:10.1007/978-1-4939-9658-2_1.
- N. G. Innamorato, I. Lastres-Becker and A. Cuadrado, Role of microglial redox balance in modulation of neuroinflammation, Curr. Opin. Neurol., 2009, 22, 308–314 CrossRef CAS.
- J. L. Wilson, F. Bouillaud, A. S. Almeida, H. L. Vieira, M. O. Ouidja, J.-L. Dubois-Randé, R. Foresti and R. Motterlini, Carbon monoxide reverses the metabolic adaptation of microglia cells to an inflammatory stimulus, Free Radical Biol. Med., 2017, 104, 311–323 CrossRef CAS.
- B. Arnò, F. Grassivaro, C. Rossi, A. Bergamaschi, V. Castiglioni, R. Furlan, M. Greter, R. Favaro, G. Comi, B. Becher, G. Martino and L. Muzio, Neural progenitor cells orchestrate microglia migration and positioning into the developing cortex, Nat. Commun., 2014, 5, 5611 CrossRef.
- F. P. Filice and Z. Ding, Analysing single live cells by scanning electrochemical microscopy, Analyst, 2019, 144, 738–752 RSC.
- S. Kuermanbayi, Y. Yang, Y. Zhao, Y. Li, L. Wang, J. Yang, Y. Zhou, F. Xu and F. Li, In situ monitoring of functional activity of extracellular matrix stiffness-dependent multidrug resistance protein 1 using scanning electrochemical microscopy, Chem. Sci., 2022, 13, 10349–10360 RSC.
- J. G. Ummadi, V. S. Joshi, P. R. Gupta, A. K. Indra and D. Koley, Single-cell migration as studied by scanning electrochemical microscopy, Anal. Methods, 2015, 7, 8826–8831 RSC.
- T.-E. Lin, S. Rapino, H. H. Girault and A. Lesch, Electrochemical imaging of cells and tissues, Chem. Sci., 2018, 9, 4546–4554 RSC.
- M. M. N. Zhang, Y.-T. Long and Z. Ding, Cisplatin effects on evolution of reactive oxygen species from single human bladder cancer cells investigated by scanning electrochemical microscopy, J. Inorg. Biochem., 2012, 108, 115–122 CrossRef CAS PubMed.
- S. E. Salamifar and R. Y. Lai, Use of Combined scanning electrochemical and fluorescence microscopy for detection of reactive oxygen species in prostate cancer cells, Anal. Chem., 2013, 85, 9417–9421 CrossRef CAS.
- Y. Zhou, Y. Takahashi, T. Fukuma and T. Matsue, Scanning electrochemical microscopy for biosurface imaging, Curr. Opin. Electrochem., 2021, 29, 100739 CrossRef CAS.
- T. M. Welle, K. Alanis, M. L. Colombo, J. V. Sweedler and M. Shen, A high spatiotemporal study of somatic exocytosis with scanning electrochemical microscopy and nanoITIES electrodes, Chem. Sci., 2018, 9, 4937–4941 RSC.
- Y. Takahashi, A. I. Shevchuk, P. Novak, B. Babakinejad, J. Macpherson, P. R. Unwin, H. Shiku, J. Gorelik, D. Klenerman, Y. E. Korchev and T. Matsue, Scanning electrochemical microscopy for biosurface imaging, Proc. Natl. Acad. Sci. U. S. A., 2012, 109, 11540–11545 CrossRef CAS.
- J. Zhang, Y. Liu, Y. Li, T. Zhu, J. Qiu, F. Xu, H. Zhang and F. Li, In situ and quantitatively imaging of heat-induced oxidative state and oxidative damage of living neurons using scanning electrochemical microscopy, Small Methods, 2022, 6, 2200689 CrossRef CAS.
- M. L. Block, L. Zecca and J.-S. Hong, Microglia-mediated neurotoxicity: uncovering the molecular mechanisms, Nat. Rev. Neurosci., 2007, 8, 57–69 CrossRef CAS PubMed.
- S. Chi, Y. Cui, H. Wang, J. Jiang, T. Zhang, S. Sun, Z. Zhou, Y. Zhong and B. Xiao, Astrocytic Piezo1-mediated mechanotransduction determines adult neurogenesis and cognitive functions, Neuron, 2022, 110, 2984–2999 CrossRef CAS PubMed.
- F. Jiang, K. Yin, K. Wu, M. Zhang, S. Wang, H. Cheng, Z. Zhou and B. Xiao, The mechanosensitive Piezo1 channel mediates heart mechano-chemo transduction, Nat. Commun., 2021, 12, 869 CrossRef CAS.
- M. Ramesh and T. Govindaraju, Multipronged diagnostic and therapeutic strategies for Alzheimer's disease, Chem. Sci., 2022, 13, 13657–13689 RSC.
- D. S. A. Simpson and P. L. Oliver, ROS generation in microglia: understanding oxidative stress and inflammation in neurodegenerative disease, Antioxidants, 2020, 9, 743 CrossRef CAS.
- D. Kim, B. You, E. K. Jo, S. K. Han, M. I. Simon and S. J. Lee, NADPH oxidase 2-derived reactive oxygen species in spinal cord microglia contribute to peripheral nerve injury-induced neuropathic pain, Proc. Natl. Acad. Sci. U. S. A., 2010, 107, 14851–14856 CrossRef CAS.
- D. Tu, R. Velagapudi, Y. Gao, J.-S. Hong, H. Zhou and H.-M. Gao, Activation of neuronal NADPH oxidase NOX2 promotes inflammatory neurodegeneration, Free Radical Biol. Med., 2023, 200, 47–58 CrossRef CAS.
- H.-M. Gao, H. Zhou and J.-S. Hong, in Neuroinflammation and Neurodegeneration, ed. P. K. Peterson and M. Toborek, Springer, New York, NY, 2014, pp. 81–104, DOI:10.1007/978-1-4939-1071-7_5.
- M. Kumar, P. Arora and R. Sandhir, Hydrogen sulfide reverses LPS-induced behavioral deficits by suppressing microglial activation and promoting M2 polarization, J. Neuroimmune Pharmacol., 2021, 16, 483–499 CrossRef.
- B. Chausse, A. Lewen, G. Poschet and O. Kann, Selective inhibition of mitochondrial respiratory complexes controls the transition of microglia into a neurotoxic phenotype in situ, Brain, Behav., Immun., 2020, 88, 802–814 CrossRef CAS.
- Y. Lu, Z. Guo, Y. Zhang, C. Li, Y. Zhang, Q. Guo, Q. Chen, X. Chen, X. He, L. Liu, C. Ruan, T. Sun, B. Ji, W. Lu and C. Jiang, Microenvironment remodeling micelles for Alzheimer's Disease therapy by early modulation of activated microglia, Adv. Sci., 2019, 6, 1801586 CrossRef.
- H. J. Forman and M. Torres, Reactive oxygen species and cell signaling: Respiratory burst in macrophage signaling, Am. J. Respir. Crit. Care Med., 2002, 166, 4–8 CrossRef PubMed.
- H. Kikuchi, A. Prasad, R. Matsuoka, S. Aoyagi, T. Matsue and S. Kasai, Scanning electrochemical microscopy imaging during respiratory burst in Human cell, Front. Physiol., 2016, 7, 25 Search PubMed.
- M. Nebel, S. Grützke, N. Diab, A. Schulte and W. Schuhmann, Visualization of oxygen consumption of single living cells by scanning electrochemical microscopy: The influence of the faradaic tip reaction, Angew. Chem., Int. Ed., 2013, 52, 6335–6338 CrossRef CAS.
- H. Kettenmann, U.-K. Hanisch, M. Noda and A. Verkhratsky, Physiology of microglia, Physiol. Rev., 2011, 91, 461–553 CrossRef CAS.
- B. L. Bangasser, G. A. Shamsan, C. E. Chan, K. N. Opoku, E. Tüzel, B. W. Schlichtmann, J. A. Kasim, B. J. Fuller, B. R. McCullough, S. S. Rosenfeld and D. J. Odde, Shifting the optimal stiffness for cell migration, Nat. Commun., 2017, 8, 15313 CrossRef CAS.
- S. van Helvert, C. Storm and P. Friedl, Mechanoreciprocity in cell migration, Nat. Cell Biol., 2018, 20, 8–20 CrossRef CAS.
- P. Moshayedi, L. da F Costa, A. Christ, S. P. Lacour, J. Fawcett, J. Guck and K. Franze, Mechanosensitivity of astrocytes on optimized polyacrylamide gels analyzed by quantitative morphometry, J. Phys.: Condens.Matter, 2010, 22, 194114 CrossRef PubMed.
- R. Mukomoto, Y. Nashimoto, T. Terai, T. Imaizumi, K. Hiramoto, K. Ino, R. Yokokawa, T. Miura and H. Shiku, Oxygen consumption rate of tumour spheroids during necrotic-like core formation, Analyst, 2020, 145, 6342–6348 RSC.
- Y.-s. Torisawa, H. Shiku, T. Yasukawa, M. Nishizawa and T. Matsue, Three-dimensional micro-culture system with a silicon-based cell array device for multi-channel drug sensitivity test, Sens. Actuators, B, 2005, 108, 654–659 CrossRef CAS.
- R. Zhu, S. M. Macfie and Z. Ding, Effects of cadmium on photosynthetic oxygen evolution from single stomata in brassica juncea (L.) Czern, Langmuir, 2008, 24, 14261–14268 CrossRef CAS.
Footnote |
| † Electronic supplementary information (ESI) available. See DOI: https://doi.org/10.1039/d3sc03504b |
| This journal is © The Royal Society of Chemistry 2024 |