
 Open Access Article
 This Open Access Article is licensed under a Creative Commons Attribution-Non Commercial 3.0 Unported Licence
Endogenous metal-ion dynamic nuclear polarization for NMR signal enhancement in metal organic frameworks†
Ilia B.
Moroz
 a,
Yishay
Feldman
b,
Raanan
Carmieli
b,
Xinyu
Liu
c and
Michal
Leskes
*a
a,
Yishay
Feldman
b,
Raanan
Carmieli
b,
Xinyu
Liu
c and
Michal
Leskes
*a
aDepartment of Molecular Chemistry and Materials Science, Weizmann Institute of Science, Rehovot 76100, Israel. E-mail: michal.leskes@weizmann.ac.il
bDepartment of Chemical Research Support, Weizmann Institute of Science, Rehovot 76100, Israel
cYusuf Hamied Department of Chemistry, University of Cambridge, Lensfield Road, Cambridge, CB2 1EW, UK
First published on 2nd December 2023
Abstract
Rational design of metal–organic framework (MOF)-based materials for catalysis, gas capture and storage, requires deep understanding of the host–guest interactions between the MOF and the adsorbed molecules. Solid-State NMR spectroscopy is an established tool for obtaining such structural information, however its low sensitivity limits its application. This limitation can be overcome with dynamic nuclear polarization (DNP) which is based on polarization transfer from unpaired electrons to the nuclei of interest and, as a result, enhancement of the NMR signal. Typically, DNP is achieved by impregnating or wetting the MOF material with a solution of nitroxide biradicals, which prevents or interferes with the study of host–guest interactions. Here we demonstrate how Gd(III) ions doped into the MOF structure, LaBTB (BTB = 4,4′,4′′-benzene-1,3,5-triyl-trisbenzoate), can be employed as an efficient polarization agent, yielding up to 30-fold 13C signal enhancement for the MOF linkers, while leaving the pores empty for potential guests. Furthermore, we demonstrate that ethylene glycol, loaded into the MOF as a guest, can also be polarized using our approach. We identify specific challenges in DNP studies of MOFs, associated with residual oxygen trapped within the MOF pores and the dynamics of the framework and its guests, even at cryogenic temperatures. To address these, we describe optimal conditions for carrying out and maximizing the enhancement achieved in DNP-NMR experiments. The approach presented here can be expanded to other porous materials which are currently the state-of-the-art in energy and sustainability research.
Introduction
Metal–Organic Frameworks (MOFs) are crystalline microporous materials that have attracted considerable interest in the last few decades due to their ultrahigh adsorption capacity, structure and composition tunability which can be tailored for various applications.1–4 The combination of these unique properties has made them promising candidates in green chemistry and alternative energy processes including CO2 capture,5–7 air and water purification,8–10 selective catalysis,11–14 conversion and storage of alternative fuels such as H2 and CH4.15–17The crystal structure of MOFs is commonly determined by diffraction techniques.18 However, diffraction methods do not provide information about the local structure of the metal centers or the functionalized organic linkers. They are also not suitable for probing interactions between the MOF and the chemical species within its pores (so-called host–guest interactions). Understanding host–guest interactions is essential for improving the performance of MOF-based materials. These questions have been successfully addressed by solid-state NMR spectroscopy as the nuclear resonance frequency and various magnetic interactions provide information on the local environment of the nuclei.19–26 Furthermore, as NMR does not require the presence of long-range order it is a great complementary tool to diffraction. Nevertheless, the use of solid-state NMR spectroscopy is limited due to its inherently low sensitivity.27 This hinders detection of nuclei that are present in small quantities (for example, in active sites or adsorbed gases), having low natural abundance (13C, 15N, 17O, etc.) or exhibiting broad NMR lines (such as the nuclei of many of the metal ions).
The sensitivity issue has been successfully addressed by the development of hyperpolarization techniques such as dynamic nuclear polarization (DNP).28,29 In DNP the high spin polarization of electrons is transferred to nuclei of interest through microwave irradiation and electron-nuclear couplings. This leads to significant enhancement of the NMR signals expanding the range of applications of NMR spectroscopy. In a standard DNP experiment, the investigated material is impregnated with a solution of an exogenous polarizing agent that is the source of unpaired electrons.30,31 Exogenous DNP has been utilized to characterize the surface functionalities of MOFs and probe their binding to metal ions or peptides.32–34 Moreover, DNP has enabled very challenging NMR experiments, such as acquisition of ultrawide-line 195Pt NMR spectra of Pt2+ sites in UiO-66 and MOF-253;35 detection of highly insensitive 17O nuclei at natural abundance (0.037%) for metal-oxo clusters representing nodes of MIP-206,36 and recording of 27Al–13C 2D correlations for Al-based MIL-100 with significantly reduced experimental time.37 The drawback of exogenous DNP is a possible alteration of the sample via reaction with the solvent or the polarization agent, resulting in lower DNP efficiency and changes to the sample's composition.38,39 Furthermore, exogenous DNP is not optimal for probing host–guest interactions in MOFs as the pores are impregnated and not available for guests.
We and others have recently demonstrated that paramagnetic metal ions introduced into the structure of inorganic and molecular solids40–48 can be used as efficient polarizing agents in magic angle spinning (MAS)-DNP. This alternative DNP approach called endogenous metal-ion DNP (MIDNP) has been applied to a broad range of technologically relevant solids used in batteries, catalysis and fuel cells. In contrast to exogenous DNP, the MIDNP approach can provide an alternative and powerful tool for boosting NMR sensitivity while enabling detection of host–guest interactions in MOFs as the pores would remain available for guests. Nevertheless, to date MIDNP applications have been mostly limited to condensed inorganic solids such as oxides and phosphates.
Here we describe the first implementation of MIDNP to a porous organic-inorganic system. We demonstrate how the endogenous MIDNP approach can be expanded to porous frameworks such as MOFs. As a test case we utilize Gd(III) ions introduced as dopants in a lanthanide-based MOF structure, LnBTB, where BTB stands for 4,4′,4′′-benzene-1,3,5-triyl-trisbenzoate. LnBTB MOFs were shown to have good moisture and chemical stability and applications in gas separation49,50 and catalysis.51,52 This structure has previously been obtained for eleven rare-earth metal ions, including diamagnetic La(III) and paramagnetic Gd(III) which have the same charge and similar ionic radius.53 Therefore, it seemed plausible to synthesize a bimetallic MOF, where some of the La(III) ions in the framework will be replaced by Gd(III), the latter playing the role of the polarizing agent. Moreover, LnBTB represents a rare example of the rare-earth-based coordination polymers with a permanent porosity, i.e. the pore structure does not collapse upon departure of guest molecules, allowing to study MOF interactions with guests.53
We provide detailed characterization of the Gd(III) dopants and discuss the underlying mechanism of DNP. We investigate the effects of Gd(III) concentration, molecular oxygen trapped in the pores, and the MOF mobility on the MIDNP performance. Furthermore, we describe protocols for maximizing MIDNP efficacy and enabling significant time saving in the detection of 13C spectra by increasing the sensitivity by 3 orders of magnitude. Finally, we explore the potential of MIDNP for polarizing guests introduced into the MOF and interacting with it.
Results and discussion
Synthesis of Gd-LaBTB MOF
Gd(III)-doped LaBTB samples were synthesized with various concentrations of Gd(III) dopant via solvothermal synthesis using cyclohexanol-water solvent mixture.53 Powder X-ray diffraction patterns (Fig. S1†) of the as-synthesized samples confirm the formation of a pure MOF phase. The obtained MOF crystals are micron-sized and have a needle-like shape (see Fig. S2†), in agreement with published results.53 The incorporation of Gd into the LaBTB structure had no discernible impact on the CO2 adsorption properties of the MOF, as nearly identical CO2 adsorption–desorption isotherms were obtained for both the undoped and Gd-doped LaBTB samples (see Fig. S3†). For electron paramagnetic resonance (EPR) and DNP NMR studies, as-synthesized samples were activated at 423 K in vacuum, and their X-ray diffraction patterns were recorded under Ar atmosphere showing no indication of structure decomposition upon activation (Fig. 1a). Note that an alternative synthetic route described in the literature,49 where a mixture of DMF, methanol and water solvents is used, was chosen at first due to a significantly faster synthesis (2 days vs. 5 days). However, this procedure led to formation of lanthanum formate La(HCO2)3 impurities (see Fig. S4†), with both the MOF and the formate phase doped with Gd(III), complicating the evaluation of the DNP performance. Therefore, unless otherwise stated, the following DNP NMR measurements were performed on the formate-free phase-pure MOF samples. | ||
| Fig. 1 (a) X-ray diffraction patterns acquired for undoped LaBTB (black) and Gd-doped LaBTB with 2.5 (red), 6 (blue), 10 (green), 23.5 (orange) and 47 mM (purple) Gd(III) concentration. Measurements were carried out under Ar atmosphere after activation of the samples at 423 K in vacuum. (b) CW-EPR spectra of the activated Gd-LaBTB samples with 2.5 (red), 6 (blue), 10 (green), 23.5 (orange) and 47 mM (purple) Gd(III) concentration measured on X-band at 100 K. Inset: the FSED spectrum of 23.5 mM Gd-LaBTB (black) acquired at Q-band at 100 K and a simulation (red) of the Gd(III) spectrum with S = 7/2, g = 1.99 and ZFS parameters of D = 312, E = 0 MHz with strains of 280 and 0 MHz, respectively. | ||
The exact La/Gd ratio in the formate-free Gd-LaBTB samples was determined by energy dispersive X-ray fluorescence (EDXRF) analysis. For all samples, the resulting La/Gd ratio was lower than the expected value, suggesting more Gd(III) was doped into the structure of LaBTB than was initially targeted (see Table S1†). The obtained La/Gd ratio was recalculated into the volumetric concentration taking into account the unit cell parameters reported for LaBTB,49 with the assumption that the low dopant concentration does not affect the unit cell volume. The results reported here refer to the experimentally determined Gd(III) concentrations, namely 2.5, 6, 10, 23.5 and 47 mM. The samples are labeled as X Gd-LaBTB, where X is the concentration of Gd(III) determined from EDXRF.
EPR studies of Gd(III) dopant
The Gd(III) dopant in LaBTB was characterized by continuous-wave (CW) EPR spectroscopy. The as-synthesized Gd-LaBTB samples measured in air exhibit a very weak EPR signal at 9.4 GHz (X-band), possibly due to the presence of paramagnetic molecular oxygen inside the pores causing increased relaxation and broadening of the EPR signal (Fig. S5†).54 Thus, the samples were activated at 423 K in vacuum and measured under Ar. The spectra of the activated samples exhibit a relatively sharp signal at g = 1.99 confirming the presence of Gd(III) ions in all samples (Fig. 1b). The signal intensity grows with increasing Gd(III) loading, consistent with homogenous doping of the samples. The homogeneity of the Gd(III) distribution is also supported by a monotonic change in the nuclear relaxation time T1 and the intensity of the NMR signal (see below). No change in the peak-to-peak width was observed as a function of Gd(III) concentration (Fig. S6†), likely due to the relatively low concentration of Gd(III) throughout the series of samples and/or dynamics in the MOFs which lead to averaging of the Gd(III)–Gd(III) dipolar interactions.54To determine the EPR parameters of the Gd(III) ions, we recorded a field sweep echo-detected (FSED) EPR spectrum at 34.2 GHz (Q-band) at 100 K for the 23.5 mM Gd-LaBTB sample activated at 423 K. The spectrum was fitted using EASYSPIN55 with a single-Gd species with electron spin S = 7/2, g = 1.99, and zero-field splitting (ZFS) parameters of D = 312, E = 0 MHz with strains of 280 and 0 MHz, respectively (Fig. 1b). Note that fitting was performed without considering motional averaging of the ZFS tensor (see below). The relatively low value of the ZFS parameter D suggests that all Gd(III) ions in the MOF sample are in a close to symmetric environment.56 These parameters were then used to simulate the EPR spectrum of Gd-LaBTB at 9.4 T and electron frequency of 263.5 GHz, corresponding to the conditions of the DNP NMR experiments (Fig. S7†).
Solid-state NMR of Gd-LaBTB samples
LaBTB samples were investigated using conventional solid-state NMR spectroscopy. The 1H MAS NMR spectrum of undoped LaBTB, recorded at 100 K with 9 kHz spinning rate, exhibits one broad unresolved signal at ca. 7 ppm, characteristic for the aromatic protons of the BTB linker (see Fig. S8†).53 At room temperature 1H MAS NMR measurements, performed at 60 kHz spinning rate, two signals could be resolved at 6–7 ppm, that can be assigned to protons of the central and side benzene rings of the BTB linkers (Fig. 2a).53 Doping of LaBTB with Gd(III) does not lead to the appearance of additional 1H NMR signals, suggesting that the MOF structure remains unchanged (Fig. S8 and S9†). | ||
| Fig. 2 (a) 1H MAS NMR spectrum of undoped LaBTB sample acquired at ambient temperature and 60 kHz MAS. Hydrogen atoms of the central benzene ring and side benzene rings of the BTB linker are highlighted in green and red, respectively. The signal at ca. 0 ppm is an impurity from the rotor. (b) 13C CPMAS NMR spectrum (black) of undoped LaBTB acquired at 100 K and 9 kHz MAS. The spectrum was deconvoluted in dmfit software92 and the obtained fit is shown in red. Carboxyl, substituted and non-substituted C–H aromatic carbon atoms of the BTB linker are highlighted in blue, orange and magenta, respectively. | ||
13C CPMAS NMR spectrum of the undoped LaBTB, recorded at 100 K with 9 kHz spinning rate, displays one resonance at 182.4 ppm and two sets of resonances - from 146 to 139 ppm and from 136 to 123 ppm – that are not fully resolved (Fig. 2b). These spectral regions are characteristic for carboxyl, substituted and non-substituted C–H aromatic carbon atoms, respectively.57 Deconvolution of the spectrum revealed four signals in the substituted carbon region and six signals in the C–H carbon region. Each BTB3− moiety contains one type of carboxyl carbon, three substituted and three C–H aromatic carbon sites that are chemically non-equivalent. However the equivalency of the carboxy groups is removed in the LaBTB crystal structure with one carboxyl group of the linker chelating one lanthanum ion and two other carboxyl groups bridging between two adjacent La(III) (Fig. S10†).49 This results in two, six and eight crystallographically non-equivalent carboxyl, substituted and C–H aromatic carbons, respectively. Some of the carbons likely have a very similar 13C chemical shift and are not resolved in the spectrum. As a result, only eleven resonances (1 + 4 + 6), instead of sixteen (2 + 6 + 8) expected from the crystal structure, are required to deconvolute the spectrum (Fig. 2b).
As in the 1H NMR, no new signals were observed in the 13C spectra of the Gd-doped samples, supporting the preservation of LaBTB structure (Fig. S11†). Note that while the presence of paramagnetic metal ions is known to significantly broaden and possibly shift the NMR resonances of nearby nuclei (via dipolar and Fermi contact interactions, respectively), these sites are not detected at low concentration of paramagnetic centers due to their fast nuclear T2 relaxation (so-called paramagnetic quenching).58 For 13C sites which are further away from the paramagnetic metal ions and are observed in the spectrum Gd doping results in decreased relaxation times and broadening.
Nuclear relaxation in LaBTB at 100 K
One of the parameters that is important for the efficiency of MIDNP in increasing NMR sensitivity is the longitudinal relaxation times of the nuclei that are to be hyperpolarized: increase in the T1 nuclear relaxation time is known to have a beneficial effect on the DNP enhancement.59,60 Long T1 is critical for polarizing nuclei that are further away from the paramagnetic metal ion, in particular for nuclei for which spin diffusion is negligible. Limited spin diffusion can be a result of weak dipolar couplings due to low gyromagnetic ratio, low natural abundance, and/or motional averaging of the dipolar couplings. In this case, polarization is transferred directly from the polarizing agent to all nuclei in the sample, and more distant nuclei require longer time to be polarized – a time limited by their intrinsic T1 relaxation. Therefore, careful control over nuclear relaxation is key for increasing MIDNP performance.DNP experiments are typically performed at 100 K which helps to slow down electron relaxation – another determinative parameter for DNP, and MIDNP in particular.58,61 Typically, in MAS-DNP experiments samples are packed into NMR rotors, introduced inside a cold (ca. 100 K) DNP probe and are spun with a cold N2 flow. Generally, the nuclear longitudinal relaxation time in solids is also expected to be longer at 100 K than at ambient temperature.62 However, in the case of LaBTB we observed an unusual behavior of nuclear relaxation: while T1 of 1H nuclei is only 0.2 s right after the sample is inserted inside the cold probe, over time T1(1H) monotonically increases reaching a plateau after ca. 4 hours at a value of ca. 2 s (Fig. 3a). An increase of T1(1H) with time was also observed for Gd-doped LaBTB samples (Fig. S12†).
 | ||
| Fig. 3 (a) 1H relaxation time T1 as a function of time from insertion of the undoped LaBTB sample into the cold (ca. 100 K) LT-DNP probe. (b) Effect of “freeze-thaw” cycles on 1H T1 relaxation time of undoped LaBTB: (a) – 1st “freeze-thaw” cycle with 5 min thaw; (b) – 2nd “freeze-thaw” cycle with 5 min thaw; (c) – 3rd “freeze-thaw” cycle with 10 min thaw; (d) – 4th “freeze-thaw” cycle with 60 min thaw. T1(1H) is plotted vs. time starting from the insertion of the sample into LT-DNP probe. | ||
We suggest two possible explanations for the surprisingly slow change in protons T1: (1) the presence of trapped molecular O2 in the pores of LaBTB, and (2) motion of the framework material. While the samples were activated in vacuum and packed into the rotor under inert atmosphere, some residual oxygen may be adsorbed or confined within the microporous structure. As O2 is paramagnetic it is known to enhance nuclear relaxation.63,64 Gradual changes in T1 relaxation can then occur if spinning the sample with N2 at 100 K leads to slow removal of O2, resulting in an increase in T1 with time.63,64 We note that this effect should be irreversible: after reaching a plateau, T1 should remain unchanged if the sample is warmed up under N2 and cooled down back to 100 K. The second plausible explanation for the initially short T1(1H) is the presence of motions in the LaBTB framework that are the source of nuclear relaxation. Indeed, the presence of molecular motions, such as rotation, flipping and small-angle librations of linkers is a known phenomenon for MOFs, even at temperatures lower than 100 K.65–69 We can expect changes in the framework mobility from the instant the sample is inserted into the cold probe due to gradual cooling of the sample as well as replacement of the argon gas filling the pores with the cold nitrogen molecules. It is well known that MOFs have low thermal conductivity,70–73 which would also depend on the gas filling the pores.74 Thus the framework may require relatively long times to equilibrate at 100 K, including both the thermal motion and gas displacement in the pores, which would lead to partially or completely freezing the motions that cause fast nuclear relaxation. This would also result in a non-instantaneous growth of T1(1H), assuming that the correlation time of the motions is longer than the inverse of the angular Larmor frequency (slow-motion regime). This effect is expected to be somewhat reversible if the sample is warmed up and then again inserted inside the cold probe.
To better understand the cause for the intriguing T1 behavior in LaBTB samples, we performed a “freeze-thaw” procedure for the undoped LaBTB and determined its effect on T1(1H). This procedure is proposed in the DNP literature as an efficient method to remove O2 from both solvent-impregnated samples and solvent-free solid powders, such as polymers.75,76 Indeed, the “freeze-thaw” process had a great impact on T1(1H) (Fig. 3b). After the first “freeze-thaw” cycle (a), the nuclear relaxation time changed from 0.2 s to more than 40 s, growing further to >50 s with time. Another “freeze-thaw” cycle (b) led to even higher T1(1H) value approaching 72 s after 30 min. When the “freeze-thaw” step was repeated the third time (c), instead of growing further, T1(1H) value dropped down to 22 s but after 1 h at 100 K again increased up to 71 s. To verify that this is reproducible, another “freeze-thaw” cycle with a long thaw step was carried out (d): indeed, T1(1H) first decreased to 18 s and over several hours grew back to >60 s. These results can be rationalized as follows: The first, and probably also the second, “freeze-thaw” cycles led to O2 removal from the sample which resulted in longer nuclear relaxation. The subsequent cycles did not lead to increase of T1(1H), likely because there was no O2 left after the first two cycles. The observed drop in T1(1H) could be explained by the sample warming up at the bottom of the probe leading to (i) increase in the thermal motions (vide infra) that enhance relaxation as well as (ii) relatively fast desorption of part of the argon/nitrogen gas filling the pores at non-cryogenic temperatures.77 Over time these motions slow down again (gradually due to the limited thermal conductivity and/or adsorption process of cold nitrogen gas), resulting in the subsequent growth in T1(1H). Thus, our results demonstrate that both the presence of O2 and the slow freezing of motions are very likely the reasons for the initially short T1(1H) and its temporal change in LaBTB sample. Note that without “freeze-thaw” cycles T1(1H) reached a value of only 2 s (Fig. 3a) which is much shorter than after the “freeze-thaw” experiment. We believe that O2 cannot be completely removed by flushing the sample with N2 at 100 K. To verify this, a quantitative measurement of the amount of O2 would be required inside the DNP probe, which is currently impossible.
To further confirm that the temporal changes in T1(1H) in oxygen-free (Gd)-LaBTB samples originate from the non-instantaneous freezing of motions, we took advantage of the high sensitivity of the ZFS anisotropy of the Gd(III) dopants to the motions of the framework.78 The 6 mM Gd-LaBTB sample, sealed in a capillary under Ar, was inserted into the EPR resonator pre-cooled to 100 K, and the EPR spectra were recorded every 10 min over a course of 2.5 h. The Gd(III) EPR signal clearly changes with time: the central transition resonance monotonously decreases in intensity and significantly broadens (Fig. 4), while the centres of the two Gd(III) satellite transitions (unresolved due to the strain in ZFS parameter D, see Fig. S7†) shift away from the centre (Fig. S13†). These observations indicate that the Gd(III) ZFS anisotropy increases with time at 100 K, further supporting the temporal changes in the MOF's dynamics. It is worth noting that the sensitivity of the ZFS anisotropy to the motional freezing at 100 K suggests that the timescale of these motions should be of the order of the inverse of the ZFS parameter D which is 108–109 Hz. Thus, the correlation time of these motions is ca. 10−8–10−9 s, close to the inverse of the 1H nuclear Larmor frequency, hence being an efficient source for the nuclear relaxation. Such fast molecular motions were previously observed for MOF-based materials, even at temperatures lower than 100 K.65,67
 | ||
| Fig. 4 CW-EPR spectra of the 6 mM Gd-LaBTB sample recorded every 10 min on a X-band spectrometer at 100 K. Blue arrows indicate the changes with time. Inset: the temporal change of the peak-to-peak intensity of the Gd(III)central transition. The sample was activated at 423 K in vacuum and measured under Ar. | ||
For obtaining consistent results in MIDNP experiments on Gd-LaBTB the nuclear relaxation time should be constant at 100 K. In the following experiments, samples were either kept inside the DNP probe until T1(1H) was stable or were subjected to several “freeze-thaw” cycles until no further increase in T1(1H) was observed. The stabilized T1(1H) was significantly shorter with the first approach, with more significant difference between the two approaches observed for samples with low Gd(III) concentration (Fig. S14†). The effect of the stabilization procedure (i.e. the process of stabilizing the MOF relaxation) on the DNP efficiency will be discussed below.
DNP field-sweep profiles
Next, we assessed the performance of Gd(III) as a polarizing agent for MIDNP. To find an optimal position of the magnetic field, which provides the maximal enhancement of NMR signal, we acquired field-sweep profiles for 1H and 13C nuclei.79,80 This is done by measuring the signal intensity of the corresponding nucleus as a function of the magnetic field during microwave irradiation.Field-sweep profiles for Gd-LaBTB sample with the target Gd(III) concentration of 6 mM are plotted on Fig. 5. Measurements were done after the sample was kept in the cold probe until a constant T1(1H) was observed without “freeze-thaw” cycles. The sweep profiles were collected for a material containing lanthanum formate impurities (see Fig. S4†). In 13C spectra, the MOF and the formate resonances were well-resolved, allowing us to selectively integrate the MOF signals. In contrast, in 1H NMR spectra, the signals of the two phases overlapped at 100 K, and the obtained 1H field-sweep profile has contributions from both phases. Nevertheless, comparison of the 13C field-sweep profiles for the MOF and the La(HCO2)3 phase shows that both profiles exhibit a negative and a positive lobe, and the maxima/minima of the lobes are at the same field position for both phases (Fig. S15†). This implies that the optimal position of the field in the reported 1H field-sweep profile (Fig. 5) corresponds to the optimal field position for 1H DNP in the MOF phase – which is the information we aimed to obtain from the sweep.
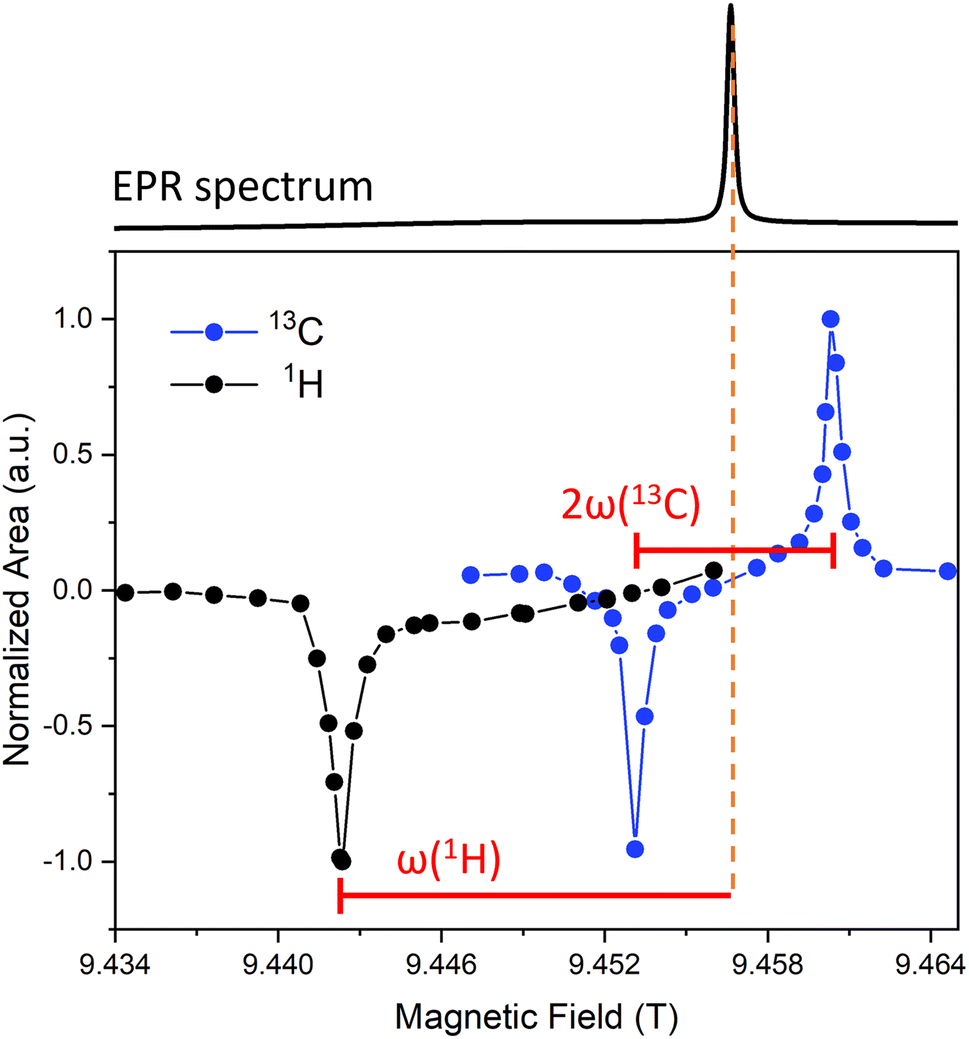 | ||
| Fig. 5 DNP field-sweep profiles acquired for 13C (blue) and 1H (black) nuclei in Gd-LaBTB sample with the target Gd(III) concentration of 6 mM. The sample was stabilized until a constant T1(1H) was measured without “freeze-thaw” cycles. Spectra were recorded with polarization times of 40 and 4.5 s for 13C and 1H, respectively. At the top, the simulated EPR spectrum of Gd-LaBTB at 9.4 T and electron frequency of 263.5 GHz is shown. | ||
The 13C field-sweep profile has distinct positive and negative lobes separated by ca. 7.2 mT (or 202 MHz) that is twice the nuclear Larmor frequency for 13C nuclei at 9.4 T. The center between the two lobes is at 9.457 T – corresponding to g = 1.99, matching perfectly the position of the Gd(III) EPR line. Therefore, the 13C field-sweep profile suggests that Gd(III) dopants transfer polarization to 13C nuclei via the solid effect mechanism.58 As can be seen in Fig. 5, the positive and negative maxima have nearly the same magnitude, thus any of the two corresponding field positions can be chosen to obtain maximal enhancement for 13C nuclei. Within the available range of the magnetic field we could only detect the negative lobe (at 9.442 T) in the 1H field-sweep profile. The 1H negative lobe is 15 mT (or 420 MHz) away from the center of the 13C sweep profile, which roughly corresponds to the nuclear Larmor frequency for 1H. This suggests that the solid effect mechanism is also dominant for 1H. As the positive lobe expected at 9.472 T cannot be reached on our spectrometer, 1H signal enhancement was determined at the field corresponding to the negative lobe.
Effect of relaxation on the DNP efficiency
We now turn to evaluate how the increase in T1 relaxation time due to either O2 removal or freezing of motions affects the DNP enhancement in Gd-LaBTB. The enhancement (εon/off), defined as the ratio between the integrated NMR signal recorded with and without microwave irradiation, was determined without and with “freeze-thaw” cycles at steady state conditions (acquired with a relaxation delay >5T1 corresponding to the instantaneous T1 value). As the measurements were performed for 1H nuclei (chosen because of their short acquisition time) at the negative lobe in the field-sweep profile an inverted signal is expected with microwaves if DNP is efficient.58 Following insertion of the 10 mM Gd-LaBTB into the cold DNP probe, the value of εon/off for 1H was 0.6 ± 0.1 (Fig. 6a). The DNP effect was lower than the 1H signal at thermal equilibrium, hence no inversion of the microwave-on signal is observed but only a partial decrease in intensity. However, after the first “freeze-thaw” cycle, the 1H resonance was inverted with an εon/off of −7 ± 1 (Fig. 6a). This was accompanied by an increase in T1(1H) from 0.3 s to >8 s. An additional “freeze-thaw” cycle did not change the T1(1H), and accordingly, εon/off remained unchanged within error. Therefore, the presence of O2 in the Gd-LaBTB samples has a significant negative impact on the MIDNP efficiency. We then let the O2-free sample thaw for 30 min under N2 flow (at the base of the DNP probe) and cooled it again. As was discussed above, this leads to a decrease in T1(1H) with a subsequent monotonous increase over a few hours up to the T1(1H) value obtained after removing O2 (see Fig. 3b). This observation was rationalized as an activation of motions and desorption of guest gas molecules by the higher temperature at the base of the DNP probe which leads to increased relaxation,62 followed by slowing down of the MOF dynamics at 100 K. During the time of T1(1H) growth, the microwave-on 1H NMR signal (inverted with respect to microwave-off signal) was increasing in intensity, approaching a plateau after >2.5 h (Fig. 6b and S16†). In the control experiment, the microwave-off 1H NMR signal intensity showed no time-dependence when it was acquired continuously by adjusting the relaxation delay to 5T1 (Fig. 6b). Thus, we conclude that 1H enhancement is sensitive to the changes in relaxation caused by motion. To summarize, the highest DNP enhancement can be achieved by O2 removal via the “freeze-thaw” procedure followed by a subsequent prolonged freezing of motions until T1(1H) reaches its maximum value.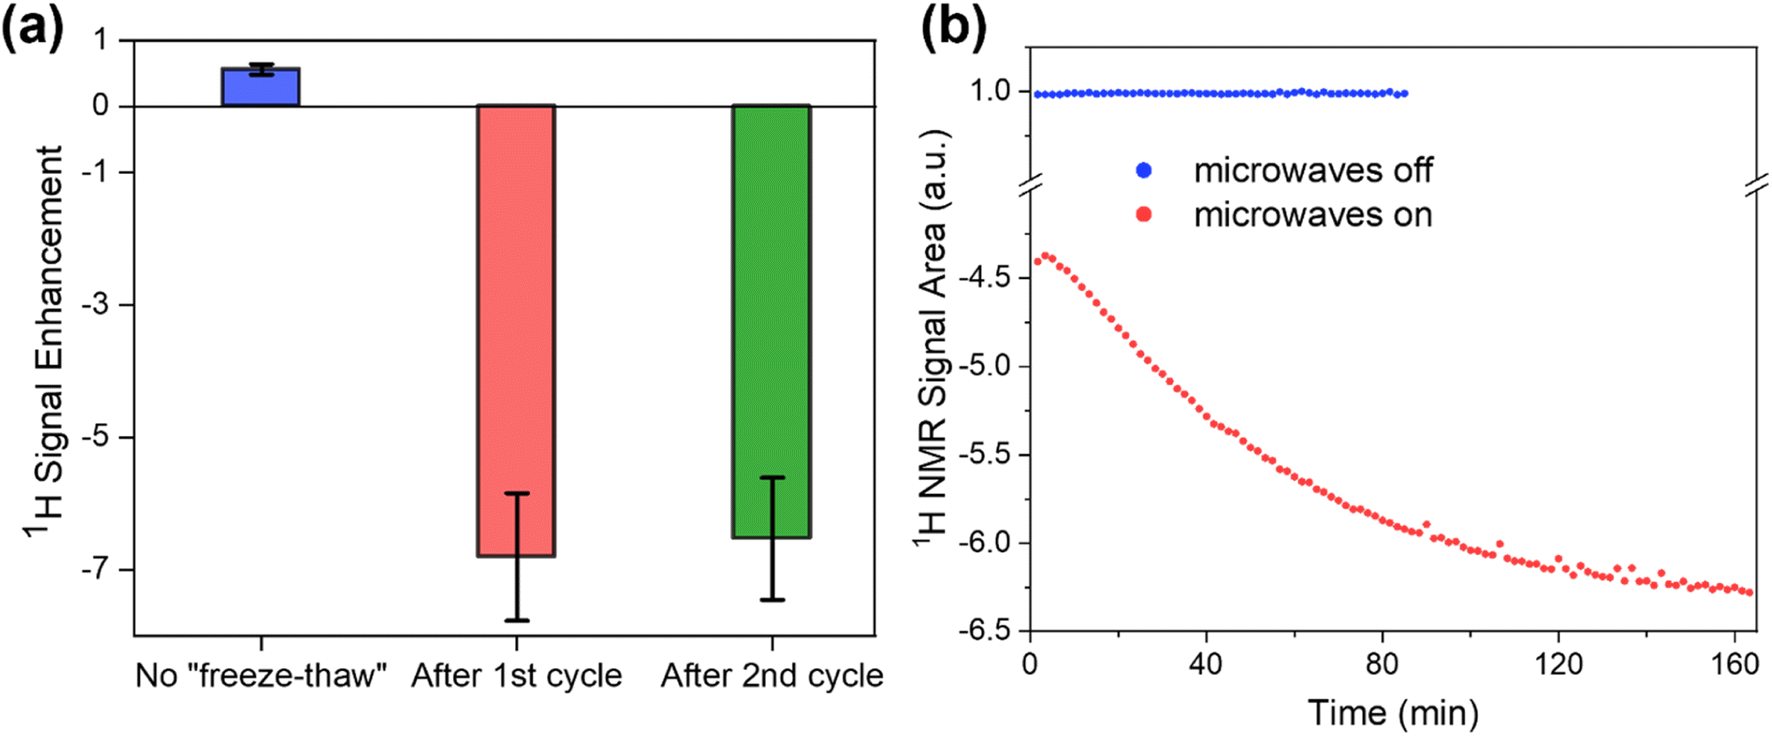 | ||
| Fig. 6 (a) 1H signal enhancement (εon/off) measured for 10 mM Gd-LaLOF at 100 K and the magnetic field corresponding to the negative lobe of the 1H field-sweep profile: before “freeze-thaw” cycles (blue), after subjecting the sample to one (red) or two subsequent (green) “freeze-thaw” cycles with 5 min thaw each. All spectra were recorded with >5T1 delay between signal saturation and the 90° excitation pulse. Tbu values were slightly shorter than corresponding T1; (b) Integrated area of the 1H NMR signal acquired for 2.5 mM Gd-LaLOF at 100 K at the negative lobe of the 1H field-sweep profile with microwaves off (blue) and on (red). The sample was subjected to two 5 min “freeze-thaw” cycles until T1(1H) was stabilized, thawed for 30 min, and then inserted back into the DNP probe stator kept at 100 K. From that point, 1H spectra were acquired every 1.7 min. The microwave-on signal area was normalized by the microwave-off signal area, and its negative sign indicates that the microwave-on signal is inverted with respect to the microwave-off signal. The microwave-off experiment was stopped after 80 min since there was no change over the time. | ||
Effect of Gd(III) concentration on the DNP performance
Next, we investigated how MIDNP efficiency in Gd-LaBTB depends on the concentration of the Gd(III) dopant. As mentioned above, the relaxation of 1H is significantly prolonged by removing O2via the “freeze-thaw” procedure (Fig. S14†), and this results in the substantial improvement of the DNP enhancement of the 1H NMR signal. Moreover, when the paramagnetic metal ions (in a small quantity used for MIDNP) are the main source of nuclear relaxation, higher concentration of the paramagnetic dopant leads to shorter T1. This effect is known as paramagnetic relaxation enhancement (PRE).81 However, without “purposely” deoxygenating the Gd-LaBTB samples, a random dependence of the stabilized T1(1H) on Gd(III) concentration was found. This indicates that O2 amount varies among samples and has an impact on relaxation. In contrast, after the “freeze-thaw” cycles, T1(1H) monotonously decreases with Gd(III) concentration, suggesting that Gd(III) ions are the main source of relaxation (Fig. S14†). Therefore, the effect of Gd(III) concentration on MIDNP performance can only be investigated after removing O2.We found that for the 1H nuclei εon/off acquired at steady state (polarization time >5Tbu, with Tbu the polarization build up time constant) depends on the Gd(III) concentration. The highest enhancement for 1H is 10 ± 1 fold in the sample with the lowest Gd(III) content, 2.5 mM Gd-LaBTB, and it decreases with higher concentrations of the Gd(III) dopant, being 4.4 ± 0.6 fold for 47 mM Gd-LaBTB (see Fig. S17†). To have a better assessment of the sensitivity gain, in addition to εon/off we must take into account effects of paramagnetic quenching by the Gd(III) ions58,82 and the change in the experimental time due to enhanced relaxation caused by Gd(III) doping.83 Paramagnetic quenching was estimated as the ratio (in %) between the 1H NMR signal of Gd(III)-doped and undoped LaBTB samples acquired with no microwave irradiation, detected with a relaxation delay of 5T1. For 2.5 mM Gd-LaBTB there was no change in the integrated signal intensity with respect to the undoped LaBTB (Fig. S18†). However, with higher concentration a vast decrease in the 1H signal was observed, with only 32 ± 3% of the signal of the undoped material left in the 47 mM Gd-LaBTB sample. Additionally, as the dopant concentration increased, the T1 value decreased (vide infra), and so did the Tbu. For the undoped LaBTB, T1(1H) is 86 ± 2 s, while for the highest Gd(III) concentration of 47 mM, Tbu(1H) is only 1.00 ± 0.02 s (Fig. S19†). The normalized enhancement (εnormx) corrected for the paramagnetic quenching (Θx) and the relaxation enhancement was calculated as εnormx = (εon/off)x × Θx × [(T1)undoped/(Tbu)x]1/2,64,83 where (T1)undoped is the relaxation time for the undoped LaBTB, measured with microwaves off and (Tbu)x is the build-up time for a given sample. Up to 10 mM, εnorm was 20 ± 2 fold, while for 47 mM its value dropped to 13 ± 1 fold (Fig. S17†). Thus, for 1H nuclei, the sensitivity is higher for lower Gd(III) concentrations.
While 1H NMR spectra with a good signal-to-noise ratio can be collected within a couple of minutes for a MOF sample, 13C nuclei are more challenging due to their low natural abundance (1%) and lower intrinsic sensitivity. The 13C field-sweep profile indicates that polarization can be transferred from Gd(III) sites directly to 13C nuclei via solid effect. We thus determined the enhancement factors εon/off that can be achieved for 13C nuclei and investigated how εon/off is changing with Gd(III) concentration. Note that as for 1H, relaxation (and build-up) times of 13C nuclei became several folds longer after the Gd-LaBTB samples were subjected to “freeze-thaw” cycles (Fig. S20†). Therefore, εon/off factors were compared for deoxygenated samples.
The 13C MAS NMR spectra of the 10 mM Gd-LaBTB sample, recorded with and without microwaves at the magnetic field corresponding to the negative lobe of 13C, are shown in Fig. 7a. For illustration purposes, the microwave-on spectrum is inverted. Signals of carboxyl, substituted and C–H aromatic carbons of the BTB linker are notably more intense with microwaves, hence all carbons of the MOF linker are hyperpolarized. For each Gd(III) concentration, we deconvoluted the microwave-off and microwave-on spectra, both recorded with a 5Tbu delay, and integrated each signal separately to estimate εon/off for different carbon species (see Table S2†). An average εon/off value over all signals vs. Gd(III) concentration is plotted in Fig. 7b. Within the range of concentrations investigated here εon/off is ca. 30 and is independent of the concentration within error. This εon/off translates to ca. 900-fold saving in experimental time.
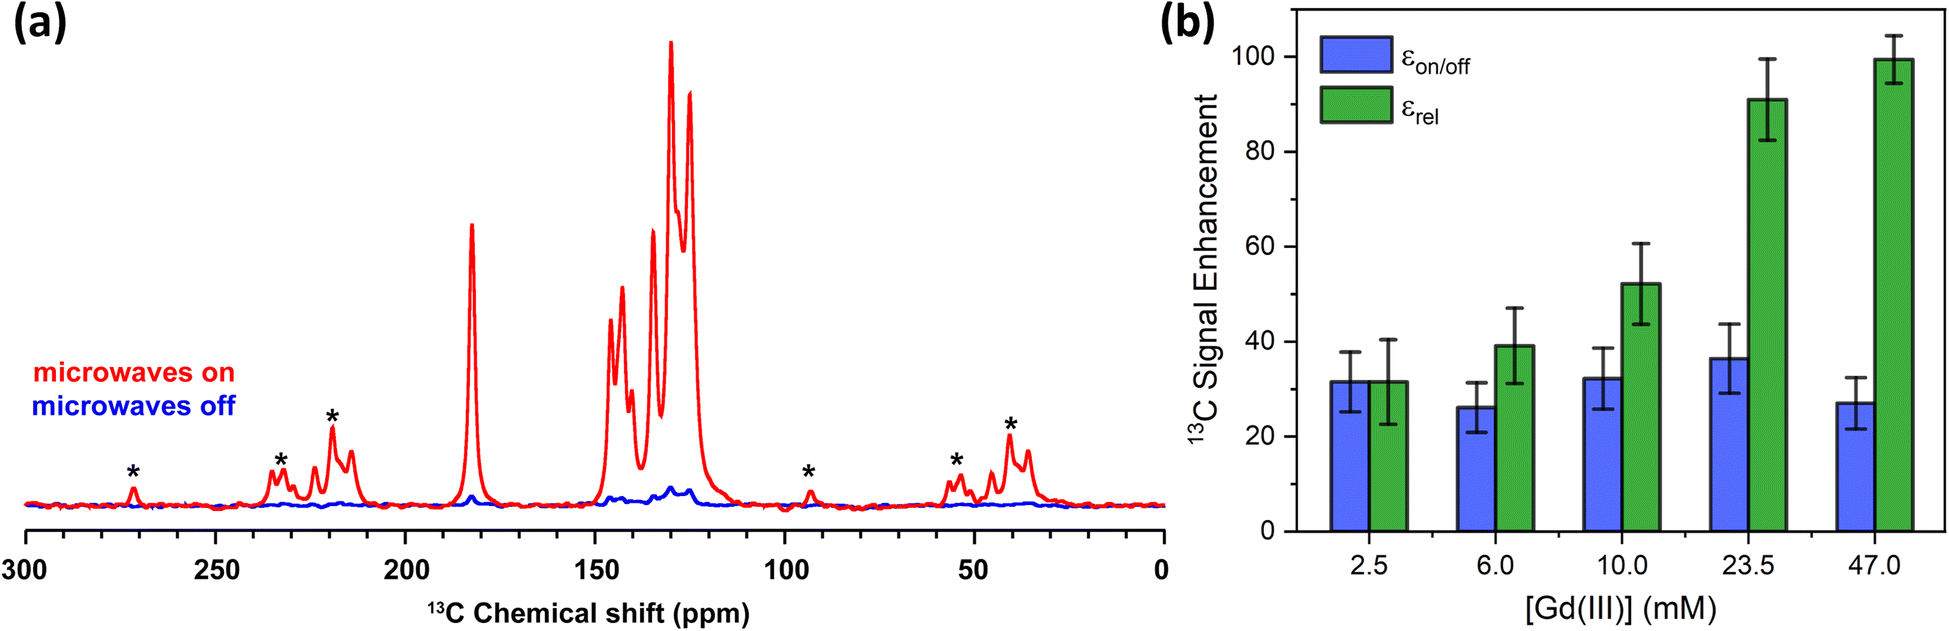 | ||
| Fig. 7 (a) 13C MAS NMR spectra acquired for 10 mM Gd-LaBTB at 100 K with (red) or without (blue) microwaves at the optimal field position (negative lobe in the 13C field-sweep profile shown in Fig. 5). Asterisks indicate spinning side bands. (b) Enhancement factors for 13C nuclei as a function of Gd(III) concentration in Gd-LaBTB. εon/off (blue) is determined as the ratio between integrated microwave-on and microwave-off signals at steady-state conditions (5Tbu). εrel (green) is the enhancement εon/off normalized by the paramagnetic quenching relative to 2.5 mM Gd-LaLOF (see Fig. S21†) and the change in the build-time Tbu(13C) with respect to the Tbu(13C) of 2.5 mM Gd-LaBTB (Fig. S20†). All samples were subjected to two 5 minutes long “freeze-thaw” cycles until stabilizing T1(1H). | ||
Although εon/off was found to be very similar across the samples, with increasing Gd(III) concentration, the intensity of all 13C NMR signals (with and without microwaves) decreases due to paramagnetic quenching (Fig. S11†), similarly to the 1H nuclei. Note that due to the very long 13C relaxation time in the undoped sample, we were not able to record a quantitative 13C MAS NMR spectrum of LaBTB and determine the quenching factor for 13C NMR signals. Nevertheless, we made an estimation of the relative quenching for Gd-doped samples: Θrelx = (Ax/A2.5 mM) × 100%, where Ax is the total area of the microwave-off 13C spectrum for the given concentration and A2.5 mM is the total area for the 2.5 mM Gd-LaBTB. Up to 10 mM, the integrated signal intensity is the same within the error, but with a higher amount of paramagnetic dopant a notable decrease down to 66 ± 11% for 47 mM is found (Fig. S21†). Considering the different quenching across the samples as well as a significant decrease in T1 and Tbu with Gd(III) concentration (Fig. S20†), we normalized the enhancement factors relative to the 2.5 mM sample: εrelx = (εon/off)x × Θrelx × [(Tbu)2.5 mM/(Tbu)x]1/2, where Θrelx is a relative quenching factor for a given sample as defined above and (Tbu)2.5 mM the build-up time for 2.5 mM sample. εrel grows monotonously with Gd(III) concentration, being >3 times higher for 47 mM sample compared to 2.5 mM (Fig. 7b). Therefore, among the samples studied in this work, the 47 mM Gd-LaBTB provides the highest sensitivity gain for 13C signals, when taking into account the effects caused by Gd(III) doping.
The above results demonstrate different dependence of the signal enhancement on Gd(III) concentration for 1H and 13C nuclei: while εon/off(1H) decreases with Gd(III) concentration, εon/off(13C) remains constant in the range of Gd(III) concentrations investigated here. This difference may originate from a combination of factors: (1) much shorter intrinsic T1 relaxation time for 1H with respect to T1(13C); (2) more severe quenching of the 1H signal at a given concentration of Gd(III) due to the stronger 1H-electron dipolar couplings at a given distance;81 and (3) the contribution of spin diffusion to the polarization transfer for 1H nuclei vs. nearly pure direct polarization for the low abundance 13C nuclei in the Gd-LaBTB samples.84 Indeed, for the oxygen-free undoped LaBTB sample, T1(1H) was measured to be 86 ± 2 s (Fig. S14†), while T1(13C) is longer than 2250 s (the value obtained for the lowest concentration Gd-LaBTB sample, see Fig. S20†). The long intrinsic T1(13C) in LaBTB ensures that upon doping the relaxation of 13C is most likely dominated by PRE. In this scenario, the MIDNP efficiency is distance-independent,61 and even nuclei that are far from Gd(III) ions will be hyperpolarized directly from the dopants.85 Another indication for the dominance of direct polarization transfer for 13C nuclei over spin-diffusion is the 13C build-up curves which can be described by a stretched exponential function (with stretching factor <1, see Fig. S20†). Such behavior is typically a result of the contribution from distribution of distances to the paramagnetic center, for all Gd(III) concentrations. The distant-independent MIDNP efficiency results in εon/off being independent of the Gd(III) concentration, under the assumption that increasing the concentration does not lead to significant change in electron relaxation times.61 Indeed the experimentally observed εon/off(13C) are nearly constant within the concentration range studied (2.5 to 47 mM).
In contrast, 1H nuclei exhibit much shorter intrinsic relaxation times which limit the distance covered by direct polarization from Gd(III) (for an intrinsic T1 of 80 s direct polarization is efficient up to about 0.7 nm from the metal ion).58 Furthermore, for 1H nuclei polarization transfer by spin-diffusion is likely very efficient, as indicated by the nearly mono-exponential-growth observed for the build-up curves (with stretching factor close to 1, see Fig. S14 and Table S4†). While with increasing Gd concentration there are more nuclei that can be polarized directly, it is likely that these nuclei are not contributing directly to the signal as they are found within the quenching sphere and it is unknown to what extent they contribute to the spin diffusion process. The interplay between the polarization transfer mechanisms, directly from metal ions vs. spin diffusion mediated polarization, can result in an overall lower enhancement with increasing dopant concentration.
It is worth noting that the removal of O2via “freeze-thaw” cycles led to a significant improvement in the MIDNP performance for 13C nuclei across all Gd-LaBTB samples (see Fig. S22†). While εon/off was 30 ± 5 after O2 was removed, in the presence of oxygen εon/off was ca. 3-times lower (ca. 10-fold enhancement). Thus, O2 trapped in the pores of MOF has a strong negative impact on the MIDNP efficiency for 13C nuclei, in line with the results for 1H. A higher εon/off(13C) of 19 ± 4 was found for oxygen-containing 6 mM Gd-LaBTB, which deviates from the average εon/off across the samples. This is most likely associated with the lower amount of O2 present in the sample, the latter being in line with the longer T1(1H) for this sample in comparison with the samples containing less Gd(III). (Fig. S14†).
Overall, the optimal enhancement factor obtained in this work, namely εon/off(13C) of 36 ± 7 for 23.5 mM Gd-LaLOF, is moderate in comparison with those previously reported for MIDNP in frozen solution86,87 and in nonporous solids.48,88,89 For instance, εon/off(13C) of 120 ± 20 (4.7% of the theoretical εon/off) was achieved for a 5 mM solution of [Gd(tpatcn)] complex in glycerol-water mixture. In solids, an optimal εon/off(29Si) of 110 ± 20 (3.4% of εon/off,theor) was found for 19 mM Gd-doped Li2CaSiO4; even higher εon/off(89Y) of 193 (1.4% of εon/off,theor) was observed for 40 mM Gd-doped Y–CeO2; and finally for 4.2 mM Gd-doped CeO2, an impressive εon/off(17O) of 652 ± 5 was obtained, reaching 13.4% of the theoretical enhancement. As was mentioned earlier, the efficiency of MIDNP is strongly affected by the electron relaxation properties of the polarizing agent, with higher product of longitudinal and transverse electron relaxation times (T1e × T2e) leading to more efficient saturation of the DNP-relevant transitions and higher DNP enhancements.58T1e and T2e were measured for 23.5 mM Gd-LaLOF at Q-band (∼1.2 T) at 100 K and their product is T1e × T2e = 0.24 × 0.11 = 0.026 μs2. For comparison, T1e × T2e of [Gd(tpatcn)] in a frozen solution was reported to be 0.22 μs2 at 100 K on a W-band (∼3.4 T).86 That is one order of magnitude higher than in our Gd-doped LaBTB system. We have also determined T1e × T2e products for 19 mM Gd–Li2CaSiO4 and 40 mM Gd-Y-CeO2 at the same conditions as for Gd-LaBTB and found that for 23.5 mM Gd-LaLOF the product is 5 times smaller than for 19 mM Gd–Li2CaSiO4 (0.086 μs2) and 13 times smaller than for 40 mM Gd-Y-CeO2 (0.344 μs2). Therefore, the obtained moderate enhancement factors obtained for Gd-LaBTB are likely a consequence of the relatively fast electron relaxation. Further optimization of the MIDNP efficacy for MOFs should thus include the design of the system with longer electron relaxation, e.g. by performing the MIDNP experiments at temperatures lower than 100 K.
DNP NMR of guest molecules in Gd-LaBTB
Having identified the optimal conditions for MIDNP in the Gd-LaBTB system, we sought to explore the applicability of this tool in elucidating host–guest interactions. To this end, we introduced ethylene glycol (EG) into the MOF pores. This was achieved through incipient wetness impregnation of an activated MOF sample with a THF solution of EG, followed by the subsequent solvent removal under vacuum. Attenuated total reflection infrared (ATR IR) spectroscopy revealed the appearance of IR bands at 2947–2870 cm−1 (stretching νCH vibrations), 1450–1400 cm−1 (bending δCH and δCOH vibrations) and 1080–1030 cm−1 (stretching νCO vibrations) regions, indicating a successful loading of the EG molecules into the Gd-LaBTB (Fig. S24†). The presence of additional bands at 2975 cm−1 and 908 cm−1 suggests that THF is not completely removed under vacuum, as was further supported by solid-state NMR measurements (see below). No changes in the X-ray diffraction pattern were observed upon EG loading into the Gd-LaBTB sample, implying that the MOF crystal structure was preserved (Fig. S25†). Nevertheless, the presence of the guest molecules in the MOF affects the EPR signal of Gd(III), suggesting interactions between EG (and/or THF) with the metal ions in the MOF (Fig. S26†).The introduction of EG/THF resulted in appearance of new resonances in the 13C NMR spectra of Gd-LaBTB (Fig. S27†). A signal at ca. 65 ppm has been assigned to the methylene (CH2) group of EG, whereas signals at ca. 70 and 28 ppm can be attributed to the –CH2CH2O– and –CH2CH2O– moieties, respectively, originating from residual THF solvent. Interestingly, additional resonances emerge within spectral regions characteristic of the carboxyl and aromatic carbons of the MOF. These resonances may be a result of the interactions between EG (and/or THF) and the framework, leading to alterations in the local environment of the MOF linkers and changes in their 13C chemical shift.90,91 This interpretation is supported by correlations observed in a 1H–13C HETCOR spectrum, wherein 13C NMR signals of the MOF and EG (as well as MOF and THF) correlate with the same 1H resonances (Fig. S28†). These results suggest a successful incorporation of guest molecules into the Gd-LaBTB structure while preserving its crystalline integrity.
We then investigated whether polarization could be transferred from the Gd(III) dopant in the MOF to the guest molecules within its structure. To this end, we recorded 13C MAS NMR spectra of the EG-loaded Gd-LaBTB sample with and without microwaves, at the magnetic field position corresponding to the negative lobe in the 13C field-sweep profile (Fig. 8). At this field position, it is expected that the signals of the hyperpolarized 13C nuclei in the microwave-on spectrum will be inverted with respect to the corresponding signals in the microwave-off spectrum. As illustrated in Fig. 8, apart from the MOF signals, the signal attributed to EG is inverted upon microwave irradiation. This observation suggests that the MIDNP approach can be employed to hyperpolarize guest molecules. Furthermore, the MOF signals emerging in the 13C NMR spectrum following EG/THF loading, are also inverted, indicating the potential of MIDNP for probing host–guest interactions in MOFs. Another intriguing observation is that the signals originated from the residual THF solvent maintain their phase in the microwave-on spectrum. This implies that, unlike EG, THF is not hyperpolarized by the Gd(III) ions. Such difference in the DNP response might be a result of the higher mobility of the THF molecules within the host structure, which impedes the transfer of polarization. The negligible absolute enhancement of the EG signal, together with the reduced enhancement factors for the MOF signals (εon/off of ca. 10 vs. 30 in the guest-free Gd-LaBTB) are likely also a consequence of the high mobility of the guest molecules within the MOF. The effect of the strength of the host–guest interactions on the DNP efficiency will be a subject of future investigations.
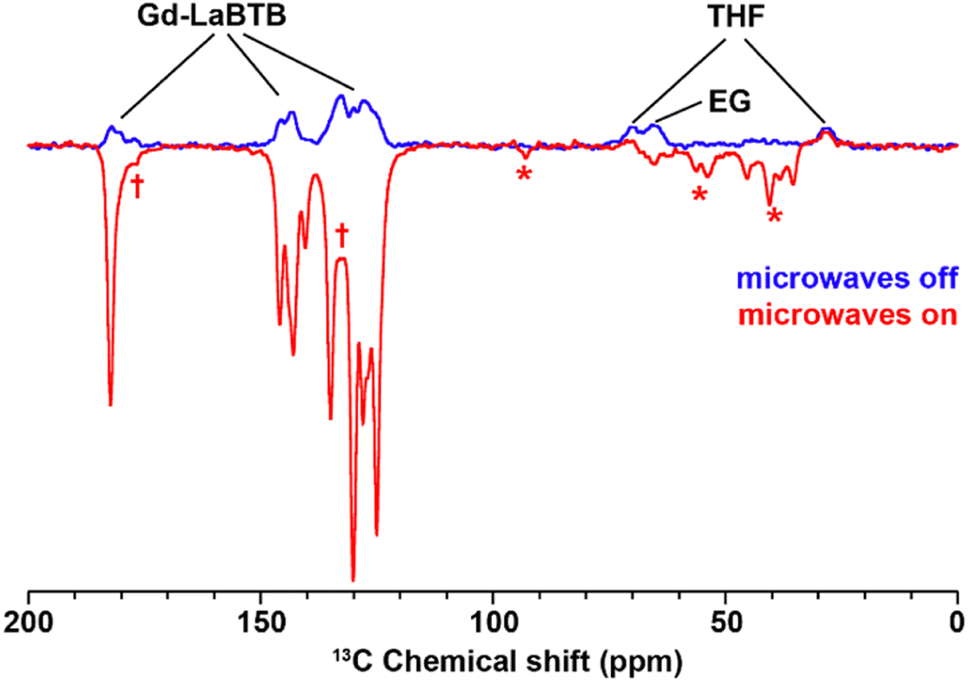 | ||
| Fig. 8 13C MAS NMR spectra acquired for 23.5 mM Gd-LaBTB loaded with EG/THF at 100 K with (red) or without (blue) microwaves at the optimal field position (negative lobe in the 13C field-sweep profile shown in Fig. 5). Asterisks indicate spinning side bands. Daggers indicate new MOF resonances appearing upon introduction of EG/THF. | ||
Conclusions
We have demonstrated that Gd(III) ions doped into a La-based metal–organic framework LaBTB can be successfully exploited as polarizing agents for endogenous metal-ion DNP. The polarization is transferred from the Gd(III) ions to the nuclei of the LaBTB linkers via solid effect. Signal enhancement factors of 10 and 36 were obtained for 1H and 13C nuclei, respectively, in Gd-LaBTB which translate to 2 and 3 orders of magnitude saving in experimental time, respectively. In contrast to conventional exogenous DNP, our approach provides sensitivity gains without the need to impregnate the MOF with the solution of organic radicals, thus it is not destructive and leaves the pores empty for the adsorption of guests. We were able to show that ethylene glycol, introduced into the MOF as a guest molecule, is also polarized from the Gd(III) ions, suggesting that our metal-ion DNP approach has potential for studying host–guest interactions in MOFs. We have also found that MIDNP efficiency in Gd-doped LaBTB is strongly influenced by the molecular oxygen present in the pores. When the MOF was subjected to “freeze-thaw” cycles, that is an established approach for removing O2 from samples measured at low temperature, the enhancement of both 1H and 13C nuclei drastically increased. Moreover, our results suggest that significant dynamics is present in LaBTB which has a negative effect on MIDNP. We found that the framework mobility requires up to several hours to slow down at 100 K, an essential step for maximizing the DNP efficacy in the studied MOF. During this time, nuclear relaxation times are monotonously increasing and so does the DNP enhancement. The presence of oxygen and the effect of motions are likely a general property of MOF materials and should be considered if one wishes to achieve the best MIDNP performance in this important class of materials.Data availability
Data is available upon request.Author contributions
I. B. M.: synthesis and characterization of materials, DNP experiments, EPR measurements at X-band, data analysis, writing – original draft. Y. F.: assistance and guidance with X-ray diffraction and X-ray fluorescence analysis of materials; R. C.: assistance and guidance with EPR measurements at Q-band; X. L.: CO2 adsorption measurements; M. L.: DNP experiments, supervision, methodology, funding acquisition, writing, and editing of the manuscript. All authors have contributed to, seen and approved the manuscript.Conflicts of interest
There are no conflicts to declare.Acknowledgements
We thank Dr Alexander C. Forse for access to the CO2 adsorption measurements. I. B. M. is grateful to the Sustainability and Energy Research Initiative (SAERI) fellowship for financial support. This research was funded by the European Research Council (MIDNP, Grant 803024), the European Union's Horizon 2020 research and innovation program (Pan-European Solid-State NMR Infrastructure for Chemistry-Enabling Access, PANACEA, Grant Agreement 101008500) and the Clore Institute for High Field Magnetic Resonance Spectroscopy and Imaging. Dr Daniel Jardón-Álvarez is acknowledged for valuable discussions and the help with data processing. We also thank Dr Ayan Maity for acquiring the SEM images. The work was made possible in part by the historic generosity of the Harold Perlman family.References
- O. M. Yaghi, M. O'Keeffe, N. W. Ockwig, H. K. Chae, M. Eddaoudi and J. Kim, Nature, 2003, 423, 705–714 CrossRef CAS PubMed.
- H. Furukawa, K. E. Cordova, M. O'Keeffe and O. M. Yaghi, Science, 2013, 341, 1230444 CrossRef PubMed.
- A. Schneemann, V. Bon, I. Schwedler, I. Senkovska, S. Kaskel and R. A. Fischer, Chem. Soc. Rev., 2014, 43, 6062–6096 RSC.
- A. Kirchon, L. Feng, H. F. Drake, E. A. Joseph and H.-C. Zhou, Chem. Soc. Rev., 2018, 47, 8611–8638 RSC.
- K. Sumida, D. L. Rogow, J. A. Mason, T. M. McDonald, E. D. Bloch, Z. R. Herm, T.-H. Bae and J. R. Long, Chem. Rev., 2012, 112, 724–781 CrossRef CAS PubMed.
- J.-R. Li, R. J. Kuppler and H.-C. Zhou, Chem. Soc. Rev., 2009, 38, 1477–1504 RSC.
- C. A. Trickett, A. Helal, B. A. Al-Maythalony, Z. H. Yamani, K. E. Cordova and O. M. Yaghi, Nat. Rev. Mater., 2017, 2, 17045 CrossRef CAS.
- D. T. Sun, L. Peng, W. S. Reeder, S. M. Moosavi, D. Tiana, D. K. Britt, E. Oveisi and W. L. Queen, ACS Cent. Sci., 2018, 4, 349–356 CrossRef CAS PubMed.
- U. Mueller, M. Schubert, F. Teich, H. Puetter, K. Schierle-Arndt and J. Pastré, J. Mater. Chem., 2006, 16, 626–636 RSC.
- D. Britt, D. Tranchemontagne and O. M. Yaghi, Proc. Natl. Acad. Sci. U. S. A., 2008, 105, 11623–11627 CrossRef CAS PubMed.
- M. Ranocchiari and J. A. van Bokhoven, Phys. Chem. Chem. Phys., 2011, 13, 6388–6396 RSC.
- J. Lee, O. K. Farha, J. Roberts, K. A. Scheidt, S. T. Nguyen and J. T. Hupp, Chem. Soc. Rev., 2009, 38, 1450–1459 RSC.
- A. Corma, H. García and F. X. Llabrés i Xamena, Chem. Rev., 2010, 110, 4606–4655 CrossRef CAS PubMed.
- Z. Wang, G. Chen and K. Ding, Chem. Rev., 2009, 109, 322–359 CrossRef CAS PubMed.
- L. J. Murray, M. Dincă and J. R. Long, Chem. Soc. Rev., 2009, 38, 1294–1314 RSC.
- Y. Peng, V. Krungleviciute, I. Eryazici, J. T. Hupp, O. K. Farha and T. Yildirim, J. Am. Chem. Soc., 2013, 135, 11887–11894 CrossRef CAS PubMed.
- H. Wu, J. M. Simmons, Y. Liu, C. M. Brown, X.-S. Wang, S. Ma, V. K. Peterson, P. D. Southon, C. J. Kepert, H.-C. Zhou, T. Yildirim and W. Zhou, Chem. – Eur. J., 2010, 16, 5205–5214 CrossRef CAS PubMed.
- A. J. Howarth, A. W. Peters, N. A. Vermeulen, T. C. Wang, J. T. Hupp and O. K. Farha, Chem. Mater., 2017, 29, 26–39 CrossRef CAS.
- B. E. G. Lucier, Y. Zhang, K. J. Lee, Y. Lu and Y. Huang, Chem. Commun., 2016, 52, 7541–7544 RSC.
- A. E. Khudozhitkov, S. S. Arzumanov, D. I. Kolokolov and A. G. Stepanov, J. Phys. Chem. C, 2021, 125, 13391–13400 CrossRef CAS.
- D. I. Kolokolov, A. G. Maryasov, J. Ollivier, D. Freude, J. Haase, A. G. Stepanov and H. Jobic, J. Phys. Chem. C, 2017, 121, 2844–2857 CrossRef CAS.
- Y. Xiao, Y. Chu, S. Li, Y. Su, J. Tang, J. Xu and F. Deng, J. Phys. Chem. C, 2020, 124, 3738–3746 CrossRef CAS.
- J. Li, S. Li, A. Zheng, X. Liu, N. Yu and F. Deng, J. Phys. Chem. C, 2017, 121, 14261–14268 CrossRef CAS.
- X. Kong, E. Scott, W. Ding, J. A. Mason, J. R. Long and J. A. Reimer, J. Am. Chem. Soc., 2012, 134, 14341–14344 CrossRef CAS PubMed.
- A. C. Forse, P. J. Milner, J.-H. Lee, H. N. Redfearn, J. Oktawiec, R. L. Siegelman, J. D. Martell, B. Dinakar, L. B. Zasada, M. I. Gonzalez, J. B. Neaton, J. R. Long and J. A. Reimer, J. Am. Chem. Soc., 2018, 140, 18016–18031 CrossRef CAS PubMed.
- S. Chen, B. E. G. Lucier, W. Luo, X. Xie, K. Feng, H. Chan, V. V Terskikh, X. Sun, T.-K. Sham, M. S. Workentin and Y. Huang, ACS Appl. Mater. Interfaces, 2018, 10, 30296–30305 CrossRef CAS PubMed.
- Y. Xiao, S. Li, J. Xu and F. Deng, Curr. Opin. Colloid Interface Sci., 2022, 61, 101633 CrossRef CAS.
- V. S. Bajaj, C. T. Farrar, M. K. Hornstein, I. Mastovsky, J. Vieregg, J. Bryant, B. Eléna, K. E. Kreischer, R. J. Temkin and R. G. Griffin, J. Magn. Reson., 2003, 160, 85–90 CrossRef CAS PubMed.
- T. R. Carver and C. P. Slichter, Phys. Rev., 1953, 92, 212–213 CrossRef CAS.
- A. Lesage, M. Lelli, D. Gajan, M. A. Caporini, V. Vitzthum, P. Miéville, J. Alauzun, A. Roussey, C. Thieuleux, A. Mehdi, G. Bodenhausen, C. Copéret and L. Emsley, J. Am. Chem. Soc., 2010, 132, 15459–15461 CrossRef CAS PubMed.
- A. J. Rossini, A. Zagdoun, M. Lelli, A. Lesage, C. Copéret and L. Emsley, Acc. Chem. Res., 2013, 46, 1942–1951 CrossRef CAS PubMed.
- A. J. Rossini, A. Zagdoun, M. Lelli, J. Canivet, S. Aguado, O. Ouari, P. Tordo, M. Rosay, W. E. Maas, C. Copéret, D. Farrusseng, L. Emsley and A. Lesage, Angew. Chem., Int. Ed., 2012, 51, 123–127 CrossRef CAS PubMed.
- T. K. Todorova, X. Rozanska, C. Gervais, A. Legrand, L. N. Ho, P. Berruyer, A. Lesage, L. Emsley, D. Farrusseng, J. Canivet and C. Mellot-Draznieks, Chem. – Eur. J., 2016, 22, 16531–16538 CrossRef CAS PubMed.
- Z. Guo, T. Kobayashi, L.-L. Wang, T. W. Goh, C. Xiao, M. A. Caporini, M. Rosay, D. D. Johnson, M. Pruski and W. Huang, Chem. – Eur. J., 2014, 20, 16308–16313 CrossRef CAS PubMed.
- T. Kobayashi, F. A. Perras, T. W. Goh, T. L. Metz, W. Huang and M. Pruski, J. Phys. Chem. Lett., 2016, 7, 2322–2327 CrossRef CAS PubMed.
- D. Carnevale, G. Mouchaham, S. Wang, M. Baudin, C. Serre, G. Bodenhausen and D. Abergel, Phys. Chem. Chem. Phys., 2021, 23, 2245–2251 RSC.
- F. Pourpoint, A. S. L. Thankamony, C. Volkringer, T. Loiseau, J. Trébosc, F. Aussenac, D. Carnevale, G. Bodenhausen, H. Vezin, O. Lafon and J. P. Amoureux, Chem. Commun., 2014, 50, 933–935 RSC.
- T. Iwamoto, H. Masuda, S. Ishida, C. Kabuto and M. Kira, J. Am. Chem. Soc., 2003, 125, 9300–9301 CrossRef CAS PubMed.
- K.-W. Huang and R. M. Waymouth, J. Am. Chem. Soc., 2002, 124, 8200–8201 CrossRef CAS PubMed.
- B. Corzilius, V. K. Michaelis, S. A. Penzel, E. Ravera, A. A. Smith, C. Luchinat and R. G. Griffin, J. Am. Chem. Soc., 2014, 136, 11716–11727 CrossRef CAS PubMed.
- P. Wenk, M. Kaushik, D. Richter, M. Vogel, B. Suess and B. Corzilius, J. Biomol. NMR, 2015, 63, 97–109 CrossRef CAS PubMed.
- M. A. Hope, D. M. Halat, P. C. M. M. Magusin, S. Paul, L. Peng and C. P. Grey, Chem. Commun., 2017, 53, 2142–2145 RSC.
- T. Wolf, S. Kumar, H. Singh, T. Chakrabarty, F. Aussenac, A. I. Frenkel, D. T. Major and M. Leskes, J. Am. Chem. Soc., 2019, 141, 451–462 CrossRef CAS PubMed.
- A. Harchol, G. Reuveni, V. Ri, B. Thomas, R. Carmieli, R. H. Herber, C. Kim and M. Leskes, J. Phys. Chem. C, 2020, 124, 7082–7090 CrossRef CAS PubMed.
- S. Haber, Rosy, A. Saha, O. Brontvein, R. Carmieli, A. Zohar, M. Noked and M. Leskes, J. Am. Chem. Soc., 2021, 143, 4694–4704 CrossRef CAS PubMed.
- A. Mishra, M. A. Hope, G. Stevanato, D. J. Kubicki and L. Emsley, J. Phys. Chem. C, 2023, 127, 11094–11102 CrossRef CAS PubMed.
- A. Karmakar, G. M. Bernard, A. Pominov, T. Tabassum, R. Chaklashiya, S. Han, S. K. Jain and V. K. Michaelis, J. Am. Chem. Soc., 2023, 145, 4485–4499 CrossRef CAS PubMed.
- B. Thomas, D. Jardón-Álvarez, R. Carmieli, J. van Tol and M. Leskes, J. Phys. Chem. C, 2023, 127, 4759–4772 CrossRef CAS PubMed.
- J. Duan, M. Higuchi, S. Horike, M. L. Foo, K. P. Rao, Y. Inubushi, T. Fukushima and S. Kitagawa, Adv. Funct. Mater., 2013, 23, 3525–3530 CrossRef CAS.
- Y. Hua, H. Wang, Q. Li, G. Chen, G. Liu, J. Duan and W. Jin, J. Mater. Chem. A, 2018, 6, 599–606 RSC.
- C. R. Kim, T. Uemura and S. Kitagawa, Microporous Mesoporous Mater., 2014, 195, 31–35 CrossRef CAS.
- C. R. Kim, T. Uemura and S. Kitagawa, Chem. Lett., 2014, 43, 1749–1751 CrossRef.
- T. Devic, V. Wagner, N. Guillou, A. Vimont, M. Haouas, M. Pascolini, C. Serre, J. Marrot, M. Daturi, F. Taulelle and G. Férey, Microporous Mesoporous Mater., 2011, 140, 25–33 CrossRef CAS.
- D. Goldfarb and S. Stoll, EPR Spectroscopy: Fundamentals and Methods, Wiley, 2018 Search PubMed.
- S. Stoll and A. Schweiger, J. Magn. Reson., 2006, 178, 42–55 CrossRef CAS PubMed.
- A. Abragam and B. Bleaney, Electron Paramagnetic Resonance of Transition Ions, Oxford University Press, 2012 Search PubMed.
- S. Bin Baek, D. Moon, R. Graf, W. J. Cho, S. W. Park, T.-U. Yoon, S. J. Cho, I.-C. Hwang, Y.-S. Bae, H. W. Spiess, H. C. Lee and K. S. Kim, Proc. Natl. Acad. Sci. U. S. A., 2015, 112, 14156–14161 CrossRef PubMed.
- D. Jardón-Álvarez and M. Leskes, in Reference Module in Chemistry, Molecular Sciences and Chemical Engineering, Elsevier Inc, 2021 Search PubMed.
- S. Björgvinsdóttir, B. J. Walder, A. C. Pinon and L. Emsley, J. Am. Chem. Soc., 2018, 140, 7946–7951 CrossRef PubMed.
- O. Lafon, M. Rosay, F. Aussenac, X. Lu, J. Trébosc, O. Cristini, C. Kinowski, N. Touati, H. Vezin and J.-P. Amoureux, Angew. Chem., Int. Ed., 2011, 50, 8367–8370 CrossRef CAS PubMed.
- D. Jardón-Álvarez, G. Reuveni, A. Harchol and M. Leskes, J. Phys. Chem. Lett., 2020, 5439–5445 CrossRef PubMed.
- M. H. Levitt, Spin Dynamics: Basics of Nuclear Magnetic Resonance, Wiley, 2nd edn, 2008 Search PubMed.
- W. Morris, C. J. Stevens, R. E. Taylor, C. Dybowski, O. M. Yaghi and M. A. Garcia-Garibay, J. Phys. Chem. C, 2012, 116, 13307–13312 CrossRef CAS.
- A. J. Rossini, A. Zagdoun, M. Lelli, D. Gajan, F. Rascón, M. Rosay, W. E. Maas, C. Copéret, A. Lesage and L. Emsley, Chem. Sci., 2012, 3, 108–115 RSC.
- J. Perego, S. Bracco, M. Negroni, C. X. Bezuidenhout, G. Prando, P. Carretta, A. Comotti and P. Sozzani, Nat. Chem., 2020, 12, 845–851 CrossRef CAS PubMed.
- D. I. Kolokolov, A. G. Stepanov and H. Jobic, J. Phys. Chem. C, 2015, 119, 27512–27520 CrossRef CAS.
- N. Y. Tan, M. T. Ruggiero, C. Orellana-Tavra, T. Tian, A. D. Bond, T. M. Korter, D. Fairen-Jimenez and J. Axel Zeitler, Chem. Commun., 2015, 51, 16037–16040 RSC.
- L. Samperisi, A. Jaworski, G. Kaur, K. P. Lillerud, X. Zou and Z. Huang, J. Am. Chem. Soc., 2021, 143, 17947–17952 CrossRef CAS PubMed.
- A. E. Khudozhitkov, D. I. Kolokolov and A. G. Stepanov, J. Phys. Chem. C, 2018, 122, 12956–12962 CrossRef CAS.
- H. Babaei, M. E. DeCoster, M. Jeong, Z. M. Hassan, T. Islamoglu, H. Baumgart, A. J. H. McGaughey, E. Redel, O. K. Farha, P. E. Hopkins, J. A. Malen and C. E. Wilmer, Nat. Commun., 2020, 11, 4010 CrossRef CAS PubMed.
- W. D. C. B. Gunatilleke, K. Wei, Z. Niu, L. Wojtas, G. Nolas and S. Ma, Dalton Trans., 2017, 46, 13342–13344 RSC.
- B. L. Huang, Z. Ni, A. Millward, A. J. H. McGaughey, C. Uher, M. Kaviany and O. Yaghi, Int. J. Heat Mass Transfer, 2007, 50, 405–411 CrossRef CAS.
- K. J. Erickson, F. Léonard, V. Stavila, M. E. Foster, C. D. Spataru, R. E. Jones, B. M. Foley, P. E. Hopkins, M. D. Allendorf and A. A. Talin, Adv. Mater., 2015, 27, 3453–3459 CrossRef CAS PubMed.
- M. Moayed Mohseni, M. Jouyandeh, S. Mohammad Sajadi, A. Hejna, S. Habibzadeh, A. Mohaddespour, N. Rabiee, H. Daneshgar, O. Akhavan, M. Asadnia, M. Rabiee, S. Ramakrishna, R. Luque and M. Reza Saeb, Chem. Eng. J., 2022, 449, 137700 CrossRef CAS.
- D. J. Kubicki, A. J. Rossini, A. Purea, A. Zagdoun, O. Ouari, P. Tordo, F. Engelke, A. Lesage and L. Emsley, J. Am. Chem. Soc., 2014, 136, 15711–15718 CrossRef CAS PubMed.
- D. Le, F. Ziarelli, T. N. T. Phan, G. Mollica, P. Thureau, F. Aussenac, O. Ouari, D. Gigmes, P. Tordo and S. Viel, Macromol. Rapid Commun., 2015, 36, 1416–1421 CrossRef CAS PubMed.
- C. Landaverde-Alvarado, A. J. Morris and S. M. Martin, J. CO2 Util., 2017, 19, 40–48 CrossRef CAS.
- R. Carmieli, P. Manikandan, B. Epel, A. J. Kalb (Gilbo, A. Schnegg, A. Savitsky, K. Möbius and D. Goldfarb, Biochemistry, 2003, 42, 7863–7870 CrossRef CAS PubMed.
- O. S. Leifson and C. D. Jeffries, Phys. Rev., 1961, 122, 1781–1795 CrossRef CAS.
- T. Chakrabarty, N. Goldin, A. Feintuch, L. Houben and M. Leskes, ChemPhysChem, 2018, 19, 2139–2142 CrossRef CAS PubMed.
- I. J. Lowe and D. Tse, Phys. Rev., 1968, 166, 279–291 CrossRef CAS.
- W. Li, Q. Zhang, J. J. Joos, P. F. Smet and J. Schmedt auf der Günne, Phys. Chem. Chem. Phys., 2019, 21, 10185–10194 RSC.
- R. Harrabi, T. Halbritter, F. Aussenac, O. Dakhlaoui, J. van Tol, K. K. Damodaran, D. Lee, S. Paul, S. Hediger, F. Mentink-Vigier, S. T. Sigurdsson and G. De Paëpe, Angew. Chem., Int. Ed., 2022, 61, e202114103 CrossRef CAS PubMed.
- N. Bloembergen, Physica, 1949, 15, 386–426 CrossRef CAS.
- A. A. Smith, B. Corzilius, A. B. Barnes, T. Maly and R. G. Griffin, J. Chem. Phys., 2012, 136, 15101 CrossRef PubMed.
- G. Stevanato, D. J. Kubicki, G. Menzildjian, A.-S. Chauvin, K. Keller, M. Yulikov, G. Jeschke, M. Mazzanti and L. Emsley, J. Am. Chem. Soc., 2019, 141, 8746–8751 CrossRef CAS PubMed.
- Y. Rao, C. T. Palumbo, A. Venkatesh, M. Keener, G. Stevanato, A.-S. Chauvin, G. Menzildjian, S. Kuzin, M. Yulikov, G. Jeschke, A. Lesage, M. Mazzanti and L. Emsley, J. Phys. Chem. C, 2022, 126, 11310–11317 CrossRef CAS PubMed.
- D. Jardón-Álvarez, N. Kahn, L. Houben and M. Leskes, J. Phys. Chem. Lett., 2021, 12, 2964–2969 CrossRef PubMed.
- M. A. Hope, S. Björgvinsdóttir, D. M. Halat, G. Menzildjian, Z. Wang, B. Zhang, J. L. MacManus-Driscoll, A. Lesage, M. Lelli, L. Emsley and C. P. Grey, J. Phys. Chem. C, 2021, 125, 18799–18809 CrossRef CAS.
- J. Xu, V. V Terskikh, Y. Chu, A. Zheng and Y. Huang, Magn. Reson. Chem., 2020, 58, 1082–1090 CrossRef CAS PubMed.
- M. Rauche, S. Ehrling, S. Krause, I. Senkovska, S. Kaskel and E. Brunner, Chem. Commun., 2019, 55, 9140–9143 RSC.
- D. Massiot, F. Fayon, M. Capron, I. King, S. Le Calvé, B. Alonso, J.-O. Durand, B. Bujoli, Z. Gan and G. Hoatson, Magn. Reson. Chem., 2002, 40, 70–76 CrossRef CAS.
Footnote |
| † Electronic supplementary information (ESI) available: X-ray diffraction patterns of as-synthesized samples, SEM images, additional EPR and NMR spectra, nuclear relaxation times, DNP enhancements and build-up times. See DOI: https://doi.org/10.1039/d3sc03456a |
| This journal is © The Royal Society of Chemistry 2024 |