 Open Access Article
Thermokinetic analyses of metal-sensitive reactions in a ceramic flow calorimeter
Soritz
S.
 *a,
Sommitsch
A.
b,
Irndorfer
S.
 b,
Brouczek
D.
c,
Schwentenwein
M.
c,
Priestley
I. J. G.
d,
Iosub
A. V.
e,
Krieger
J. P.
f and
Gruber-Woelfler
H.
 *ab
*ab
aInstitute of Process and Particle Engineering, Inffeldgasse 13/III, 8010 Graz, Austria. E-mail: s.soritz@tugraz.at
bResearch Center Pharmaceutical Engineering GmbH, Inffeldgasse 13, 8010 Graz, Austria
cLithoz GmbH, Mollardgasse 85a/64-69, 1060 Vienna, Austria
dSyngenta Ltd, Leeds Road, Huddersfield, West Yorkshire HD2 1FF, UK
eSyngenta Crop Protection AG, Schaffhauserstrasse, 4332 Stein, Switzerland
fSyngenta Crop Protection AG, Breitenloh 5, CH-4333 Münchwilen, Switzerland
First published on 5th April 2024
Abstract
Measuring the thermokinetic data of chemical reactions is an important part for chemical process development. However, some reactions are very sensitive to the presence of metals, limiting the use of standard materials for calorimeters. In this work we present a flow calorimeter employing a 3D printed ceramic reactor plate for the measurement of metal-sensitive reactions. The calorimeter was characterized by residence time measurements aided by mixing simulations, and was validated via a standard neutralization reaction, an aggressive nitration reaction, and a binary solvent system for mixing enthalpy, before being used for a nitrosylation reaction featuring a metal sensitive product.
Introduction
Developing novel chemical products via microreactor technology and subsequently transferring them onto a production scale benefits strongly from a thorough process understanding of reaction mechanisms and kinetics.1 One of the key factors for this development relates to assessing the safety of a given process by investigating factors such as a potential exothermic nature, especially in conjunction with very fast reaction rates.2Reaction calorimetry enables the examination of chemical reactions or physical processes while also providing crucial information about the process's safety, potential for scaling, and criticality. Factors of interest include the reaction kinetics (rate constants, activation energies, heat/mass transfer) as well as the thermodynamic aspects (reaction enthalpies and adiabatic temperature rise).2
Typical equipment for reaction calorimetric measurements comprise mainly batch-type calorimeters, such as the RC1 from Mettler Toledo3 or the microscale μRC from Thermal Hazard Technology.4 However, these batch calorimeters provide certain disadvantages, due to their comparatively large reaction volumes and inability to be used for continuous applications under extreme reaction conditions as seen in today's flow chemistry.5
As such, while the use of batch-mode calorimeters is still widespread, utilizing continuous flow microreactors for reaction calorimetry has seen an increase in popularity.6 Boasting a high surface to volume ratio due to the small channels used in microreactors, the transfer of mass and heat during reactions is significantly improved compared to batch vessels.7 These advantages also allow the execution of continuous flow reactions in harsh environments while maximizing safety, which would not be achievable in a batch setting. Additionally, limitations imposed by reactions, such as metal-sensitivity, fast reaction times, short-lived intermediates and the hazard of thermal decomposition reactions can be minimized, by manufacturing bespoke reaction equipment.8 It has already been demonstrated that flow calorimeters can achieve comparable9 or even superior results10 when matched against their batch counterparts.
While the comprehensive review of Frede et al.6 provides a detailed overview on state-of-the-art continuous flow calorimeters, such as the ones from Ladosz,11 Reichmann12 and Zhang,13 even more recent work has seen the integration of a FlowPlate® Lab microreactor into a calorimeter setup.14
Furthermore, while most flow calorimeters described in literature are set in micro-scale,11–13 scalable milli-scale calorimeters have also been described.10,15
As for the origin of the used reactors, different pre-designed microreactors can be purchased from various manufacturers, typically made from materials such as glass, stainless steel or Hastelloy, and silicon carbide ceramics.16,17
The majority of devices reported thus far have been created using fused deposition modeling,18–22 stereolithography23,24 and selective laser melting (SLM).5,25,26 While these methods are relatively inexpensive, they are currently limited to polymer-based materials, with the exception of SLM utilizing steel powders. Additionally, they can be used to design catalytically active structures, however, they are not stable in the presence of various reagents and common organic solvents (such as aromatic solvents).27,28
However, in recent years the development of photolithography-based techniques to manufacture 3D parts made of ceramic material has been reported.29,30 With excellent heat tolerance, high chemical resistance, as well as increasingly high durability,31 these materials have already seen some use in the field of chemical engineering, e.g. as solid supports for enzyme immobilization,32 or in high-temperature cracking processes.33 In the context of flow chemistry, this can allow for the execution of experiments not possible in conventional materials such as stainless steel or PEEK. For example, the use of strong acids and bases, often at elevated temperatures, is common in reactions typically evaluated through calorimeters, while often being aggressive enough to damage equipment without proper precautions. Some reaction types which fulfill these criteria are nitrations, nitrosylations or halogenations, among others.34,35
In this work we report the development of an isothermal heat flow calorimeter for the measurement of thermokinetic data of metal-corrosive reactions in continuous flow. Its main feature is a 3D-printed ceramic reactor plate made of aluminum oxide, and a full setup with all wetted parts made of either PTFE, PFA or aluminum oxide. The overall layout of the ceramic flow calorimeter is a continuation of our previous work36 and uses the same measurement principle, overall sensor layout, and heat balance calculations. Even though the inner geometry of the reactor plate is not new, we present here the investigation of the mixing behavior via fluid simulations, similar to the work of Fu et al.,37 as well as residence time measurements. This was carried out to gauge both mixing properties and possible reaction times possible in the calorimeter. The applicability of the calorimeter was subsequently validated against a standard neutralization reaction of acetic acid with sodium hydroxide, a very aggressive mononitration reaction of toluene using nitric and sulfuric acid and the mixing enthalpy of the binary methanol–water solvent system, with good agreement to different literature sources. Subsequently, it was used to determine the reaction enthalpy of a nitrosylation reaction in continuous flow, first validated in batch mode, then tested at in continuous flow at a temperature range of 10 to 50 °C in the calorimeter.
Materials and methods
Ceramic reactor plate
The ceramic reactor plate, which can be seen in Fig. 1, was developed via lithography-based ceramic manufacturing, a process belonging to the family of stereolithography techniques and was carried out by the company Lithoz. This technique had already been successfully utilized by our group to produce reactor inserts for enzyme immobilization.32The reactor plate features two inlets that enter a precooling segment followed by two reaction segments comprising split-and-recombine (SAR) elements. Each reaction segment has an internal volume of 111 μL, giving a total reactor volume of 222 μL, while featuring a channel diameter of 800 μm with a circular cross-section. The precooling sections volume of 98 μL brings the total reactor plate volume to 320 μL. Lastly, the outlet section comprises three slots, which from bottom to top are, one for a temperature sensor, one for a possible quenching pump, and finally the outlet channel of the reaction stream.
The printing process utilized the CeraFab S65 printer (see Fig. 2),29,31 which features a transparent vat where a slurry (LithaLox 360), which is composed of a combination of photoreactive monomers, aluminum oxide powder, and photoinitiator, is uniformly distributed. Subsequently, the movable building platform is submersed into the slurry, and selectively exposed to visible light emitted from beneath the vat, which triggers the photopolymerization reaction.
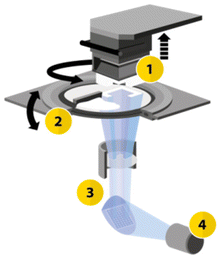 | ||
| Fig. 2 Schematic configuration of the CeraFab printers. (1) Movable build platform in the Z-direction; (2) rotatable vat for material deposition; (3) optical system transmitting light from the LED (4) to the projection surface, generating selective layer images.29,31 | ||
The optical system of the printer consists of a powerful blue 450 nm LED that emits a defined light spectrum onto a mirror array (digital micromirror device – DMD). Within this system, the individual mirrors can either transmit the light or direct it onto an absorption field. The transmitted light is then projected from below through a lens as a pixel pattern onto the transparent vat. This selective exposure of the photosensitive material causes curing at the exposed areas. In this way, a volumetric component is built up layer by layer in a bottom-up method. The pixel size, representing the lateral resolution, is 40 μm for the CeraFab S65 printer used, which enables the realization of minimal structure sizes such as the small channel diameters of the reactor plate. The layer thickness used for printing the microreactor was set at 25 μm.
Following the 3D printing process, the plate underwent a meticulous cleaning regimen involving the application of pressurized air and a cleaning solvent (LithaSol 20). Subsequently, a thermal postprocessing procedure was executed by subjecting the printed plate to elevated temperatures within a furnace. This entailed a drying step at 120 °C, followed by debinding and a sintering step conducted at 1650 °C for a duration of 2 hours.32
Calorimeter setup
A scheme of the experimental setup can be seen in Fig. 3. Two pumps (a HiTec Zang SyrDos and a Lambda VIT-FIT) are used to introduce the feed solutions into the calorimeter, and a third pump (Lambda VIT-FIT) can optionally be used to quench the reaction after the calorimetric measurement is concluded. This is done to contain all product generation to the reactor plate, since a continuing reaction outside of the calorimeter would distort the calculated reaction enthalpy per mol of generated product.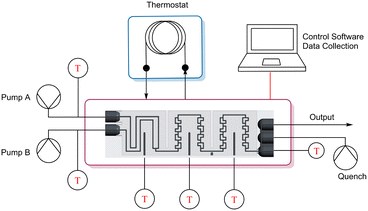 | ||
| Fig. 3 Experimental setup of the ceramic flow calorimeter including all necessary equipment to carry out continuous flow experiments. | ||
All wetted materials in the setup are composed of either aluminium oxide ceramics for the reactor plate, perfluoroalkoxy alkane (PFA) for the capillaries (I.D. 0.8 mm), and polypropylene and glass for the syringe pumps.
The sensors are controlled via an Arduino Mega 2560, which also handles the serial data transmission from the sensors to the PC.
The calorimeter is held at isothermal conditions via the use of a thermostat (Lauda Alpha RA 12), which has two functions. On one hand it provides a constant-temperature environment to allow precise measurements of heat fluxes in the reactor. On the other hand, it is used as a heatsink for the thermocouple elements (TEC1-12706, Diymore), which produce excess heat when counteracting generated reaction heat. These elements are positioned on top of the reactor plate, following the section division outlined in Fig. 1, with a size of 40 × 40 mm and a height of 3.6 mm, with two elements stacked on top of each other per section, for a total of 6 thermocouple elements. On this, the thermostat heatsinks are installed, with a 3D printed casing used both keep all used modules in place, as well as to isolate the calorimeter from its environment.
Measurement process
The flow calorimeter measures heat fluxes generated by chemical reactions or solvent mixing, utilizing the thermoelectric Seebeck effect via the thermocouple elements which are in direct contact with the reactor plate. The detected voltages are measured by an Arduino microcontroller system, which transmits the sensor data to a PC for further use. Via a calibration process detailed in the next section, the voltage can be converted into a heat flux, which, coupled with knowledge about the molar fluxes entering and leaving the reactor system, is used to calculate the final process enthalpies.Additionally, the Peltier effect is utilized, which allows for cooling of the reactor plate via an additional set of thermocouples, assisted by a thermostat and heat sinks to carry away excess heat. This allows for an isothermal operation of the calorimeter and ensures steady-state reaction conditions.
The enthalpy of a reaction during steady-state is then calculated utilizing the following eqn (1):
 | (1) |
![[Q with combining dot above]](https://www.rsc.org/images/entities/i_char_0051_0307.gif) tr denotes the heat flux measured by the Seebeck elements in the calorimeter during the reaction,
tr denotes the heat flux measured by the Seebeck elements in the calorimeter during the reaction, ![[Q with combining dot above]](https://www.rsc.org/images/entities/i_char_0051_0307.gif) in denotes the convective heat flux of each of the two inlet streams, and
in denotes the convective heat flux of each of the two inlet streams, and ![[Q with combining dot above]](https://www.rsc.org/images/entities/i_char_0051_0307.gif) out denotes the convective heat flux of the outlet stream.
out denotes the convective heat flux of the outlet stream.
![[Q with combining dot above]](https://www.rsc.org/images/entities/i_char_0051_0307.gif) tr is first calculated from a detected voltage via a calibration process, which will be discussed in the upcoming section “Calorimeter calibration”. The convective heat fluxes
tr is first calculated from a detected voltage via a calibration process, which will be discussed in the upcoming section “Calorimeter calibration”. The convective heat fluxes ![[Q with combining dot above]](https://www.rsc.org/images/entities/i_char_0051_0307.gif) in and
in and ![[Q with combining dot above]](https://www.rsc.org/images/entities/i_char_0051_0307.gif) out on the other hand, are calculated viaeqn (2):
out on the other hand, are calculated viaeqn (2):
 | (2) |
![[V with combining dot above]](https://www.rsc.org/images/entities/i_char_0056_0307.gif) denotes the volumetric stream, Tset and Ti the experiment temperature and the actual temperature at the specified section, and ρi, cp,i and MMi the density, specific heat capacity and molar mass of the respective substances or mixtures. For the final enthalpy, the resulting heat flux is then converted via the use of the starting concentration of the limiting substrate c0, the total flowrate of the experiment
denotes the volumetric stream, Tset and Ti the experiment temperature and the actual temperature at the specified section, and ρi, cp,i and MMi the density, specific heat capacity and molar mass of the respective substances or mixtures. For the final enthalpy, the resulting heat flux is then converted via the use of the starting concentration of the limiting substrate c0, the total flowrate of the experiment ![[V with combining dot above]](https://www.rsc.org/images/entities/i_char_0056_0307.gif) and the conversion X. For a more detailed description of all measurements and the associated heat balances see our previous work.36
and the conversion X. For a more detailed description of all measurements and the associated heat balances see our previous work.36
Chemicals and analysis
All chemicals were bought from the stated suppliers and used as-is unless otherwise indicated:tert-butyl nitrite (Sigma Aldrich, 90%), acetone (Sigma Aldrich, 99.9%), hydrochloric acid (Sigma Aldrich, 37%), acetic acid (Sigma Aldrich, 99%), sodium hydroxide (Sigma Aldrich, 98%), nitric acid (Sigma Aldrich, 65–67%), sulphuric acid (Sigma Aldrich, 95–98%), phosphoric acid (Sigma Aldrich, 85%), ammonium hydroxide (Sigma Aldrich, 28–30%), anti-pyruvic aldehyde 1-oxime (Sigma Aldrich, 98%), ethanol (Sigma Aldrich, 96%), methanol (Lactan, 99.8%).
HPLC analysis was carried out using an Agilent 1100 series HPLC system equipped with an online degasser, quaternary pump, autosampler, thermostated column compartment and UV-visible diode array detector. As mobile phases, MeOH and aq. phosphoric acid (H2O![[thin space (1/6-em)]](https://www.rsc.org/images/entities/char_2009.gif) :
:![[thin space (1/6-em)]](https://www.rsc.org/images/entities/char_2009.gif) H3PO4 = 300
H3PO4 = 300![[thin space (1/6-em)]](https://www.rsc.org/images/entities/char_2009.gif) :
:![[thin space (1/6-em)]](https://www.rsc.org/images/entities/char_2009.gif) 1 v
1 v![[thin space (1/6-em)]](https://www.rsc.org/images/entities/char_2009.gif) :
:![[thin space (1/6-em)]](https://www.rsc.org/images/entities/char_2009.gif) v) were used in the ratio of 60
v) were used in the ratio of 60![[thin space (1/6-em)]](https://www.rsc.org/images/entities/char_2009.gif) :
:![[thin space (1/6-em)]](https://www.rsc.org/images/entities/char_2009.gif) 40 v
40 v![[thin space (1/6-em)]](https://www.rsc.org/images/entities/char_2009.gif) :
:![[thin space (1/6-em)]](https://www.rsc.org/images/entities/char_2009.gif) v. Compounds were separated using a ThermoFisher Scientific Accucore™ C18 reversed phase column (50 × 4.6 mm; 2.6 μm) at 25 °C with a flow rate of 1 mL min−1 and detected by UV-absorption at 222 nm over the run time of 15 min.
v. Compounds were separated using a ThermoFisher Scientific Accucore™ C18 reversed phase column (50 × 4.6 mm; 2.6 μm) at 25 °C with a flow rate of 1 mL min−1 and detected by UV-absorption at 222 nm over the run time of 15 min.
Continuous UV-vis measurements for residence time distribution measurements were carried out using a UV-vis flow cell (Flow Cell-Z-10, Avantes). Spectral data was produced by passing the light from a UV light source (AvaLight-DS-DUV) through the flow cell and to a detector (AvaSpec-ULS2048).
Results and discussion
Calorimeter calibration
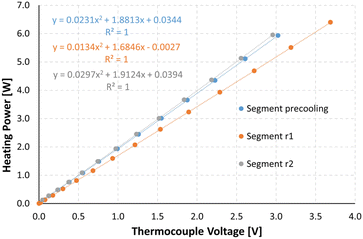
To be able to connect the Seebeck element measurements to actual enthalpies, a calibration needs to be carried out prior to the experiments. For this, heating foils (TSC0400040gR7.91, Pelonis Technologies, Inc.) are attached to the backside of the reactor plate, one for each of the 3 elements, which simulate heat being generated during a reaction, with the simulated heat increasing stepwise over time.The correlation of the heat flux of each foil and the thermoelectric voltage used by each Seebeck element needed to remain at the set temperature was found to be a polynomial of second order according to Reichmann et al.12 An example of a calibration process at 25 °C can be seen in Fig. 4 and 5, with the detected voltage of the Seebeck elements over time, and the polynomial calibration curves of each element, respectively.
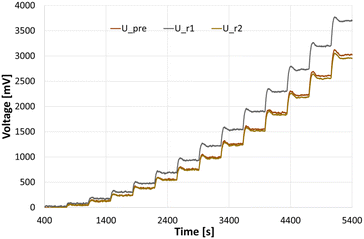 | ||
| Fig. 4 Measurements for a calibration at 25 °C, with U_pre, U_r1 and U_r2 referring to the voltage signals at the preheating/cooling section, and reaction segment 1 and 2, respectively. | ||
This calibration method is able to account for heat loss to the environment and was carried out at each reaction temperature as well as in the event of a significant environmental temperature change. Effects of this can be observed for the neutralization experiments in the upcoming section, see Table 2.
Reactor plate characterization
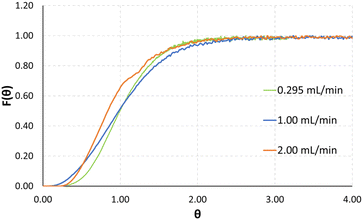
Exemplarily, a plot for the normalized signal measurements for the total flowrates of 0.295, 1.0 and 2.0 mL min−1 can be seen in Fig. 6. The normalized time of the x-axis θ is defined as experimental time divided by mean residence time.
The results of the theoretical and experimentally determined mean residence times (τ), as well as the resulting Bodenstein numbers (Bo) and Reynolds numbers (Re), can be seen in Table 1. The preheating section, as well as all connecting capillaries were factored out of the mean residence time, assuming plug flow behavior in these sections.
| Flowrate [mL min−1] | Experimental τ [s] | Theoretical τ [s] | Bo [−] | Re [−] |
|---|---|---|---|---|
| 0.295 | 47.93 | 45.15 | 12.47 | 10.48 |
| 1.00 | 13.72 | 13.32 | 9.85 | 35.51 |
| 2.00 | 7.67 | 6.66 | 9.73 | 71.02 |
| 4.00 | 3.59 | 3.33 | 9.45 | 142.04 |
| 6.00 | 2.39 | 2.22 | 9.23 | 213.06 |
Low Bo numbers of around 10 indicate strong backmixing, leading to increased residence times compared to the theoretical residence times, which are calculated by dividing the reactor volume by the total flowrate. Exemplarily, for a total flowrate of 2 mL min−1 the experimentally determined mean residence time is 7.67 seconds, compared to a theoretical value of 6.66 seconds. The Bodenstein numbers given in Table 1 were calculated from the UV-vis absorption data using an open–open model.38 As will be demonstrated by CFD simulations in the next section, specifically in Fig. 8 and 9, we assume recirculation effects through the two different-length channels in each split-and-recombine geometry, where the shorter channel causes an increase in fluid velocity, which in part recirculates into the longer channel section. Additionally, the generation of lateral fluid velocity changes through pressure differences caused by right-angled channel sections, are also assumed to generate vortices which slightly slow the overall fluid flow.39 Another possible contribution could be a slight increase in inner volume of the reactor plate due to minor distortion of the ceramic during the sintering process. A combination of these effects is posited to lead to the observed increase in mean residence time compared to the theoretical value.
Finally, taking a closer look at the F-curves seen in Fig. 6 the distribution of the tracer after the outlet of the reactor plate shows that the F-curve reaches values of around 0.55 after 1 theta. Looking at tailing effects in the reactor, it can be seen that the F-curve reaches 0.95 after 2 theta, and 0.99 after 2.5 theta. Finally, comparatively low Re numbers of 10–200 indicate laminar flow during all tested flowrates.
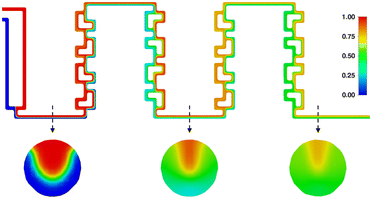
Fig. 7 shows details of the 3D mesh used for the simulation of a single SAR element. The mesh consists of roughly 1.5 million cells, with 8 SAR elements comprising one full section of the reactor plate.
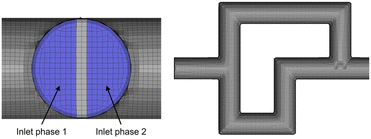 | ||
| Fig. 7 3D mesh of a single split-and-recombine element, also showcasing the division of the two streams at the inlet of the first element. | ||
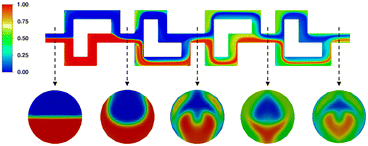
Firstly, the fluid velocity profile over one SAR row of 4 elements was determined, using two water phase streams entering at 2 mL min−1. It shows that both paths of the SAR geometry are equally favored over the total length, ensuring the best possible fluid mixing behavior overall. A showcase of this effect can be seen in Fig. 8.
 | ||
| Fig. 8 Fluid velocity profile of two water phase streams entering the SAR element at 2 mL min−1 each. | ||
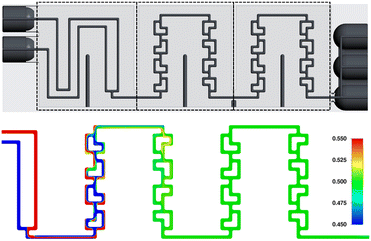
Next, the mixing behavior of the same phases, at again 2 mL min−1 each, over one SAR row was investigated. As can be seen in Fig. 9, phase composition close to the end of the first section approaches values between 0.3 and 0.7, while ideal mixing would be indicated by a composition of 0.5, i.e. both phases being present in equal proportion.
Finally, after concluding our initial studies of a single SAR row, the mixing behavior over the full reactor plate (4 SAR rows of 4 elements each, including the connecting channels) was simulated.
And as can be seen in Fig. 10, ideal mixing can be achieved already at the end of the first section (the first two SAR rows). In this figure, the phase mixing scale was condensed from the initial 0.0–1.0 from Fig. 8 and 9 to 0.45–0.55, clearly demonstrating the simulated mixing performance of the reactor plate.
Measurements
| CH3COOH + NaOH → H2O(aq) + CH3COONa(aq) | (3) |
| Entry | Flowrate [mL min−1] | Average detected signal [W] | Mean + SD ΔHR [kJ mol−1] | Mean deviation from literature40 [%] |
|---|---|---|---|---|
| 1a | 1.50 | −0.53 | −56.17 ± 1.41 | 2.15 |
| 1b | 1.50 | −0.54 | −59.54 ± 0.92 | 3.73 |
| 2a | 2.50 | −0.92 | −56.19 ± 3.28 | 2.11 |
| 2b | 2.50 | −0.87 | −55.65 ± 0.71 | 3.05 |
| 3 | 4.00 | −1.62 | −52.48 ± 2.78 | 7.9 |
| 4 | 5.00 | −2.16 | −57.09 ± 1.79 | 0.6 |
| 5 | 6.00 | −2.66 | −58.74 ± 2.00 | 2.3 |
| Literature value40 | −57.40 |
Entries 1a/1b and 2a/2b were performed on different days, to assess repeatability of entire experiment runs of 5 experiments each. This was done to also measure the impact of different temperatures in the laboratory, since these were observed to vary between 22 and 28 °C.
As can be seen in the graphical representation of the results in Fig. 11, both accuracy and reliability, measured by the absolute deviation to the literature values and the size of the standard deviation, are in good agreement to literature, while also being repeatable, accurate and precise.
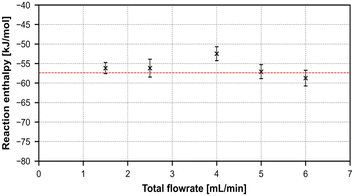 | ||
| Fig. 11 Graphical representation of the summarized reaction enthalpies of the neutralization reaction over 5 different total flowrates. | ||
Additionally, pumping water at room temperature into the calorimeter system, which was kept constant at 18 °C, was used to determine the overall mean error of the calorimeter. As can be seen in Table 3, the average detected signal that is being detected without any reaction present, comes in at around 0.2–2.3% of the heat that a neutralization at similar flowrates would generate.
| Entry | Flowrate [mL min−1] | Average detected signal [W] | Percentage of neutralization signal [%] |
|---|---|---|---|
| 1 | 1.50 | 0.0120 | 2.26 |
| 2 | 2.50 | 0.0045 | 0.49 |
| 3 | 4.00 | −0.0253 | 1.56 |
| 4 | 5.00 | 0.0047 | 0.21 |
| 5 | 6.00 | −0.0057 | 0.21 |
Therefore, the average equipment error of the ceramic calorimeter can be set at between 0.2 and 2.3%, with an overall trend to lower error with higher flowrates, i.e., higher detected signal.
Mixing enthalpy
To determine the calorimeter performance at lower enthalpy values, a solvent system of methanol (MeOH) and water was used. Due to the low enthalpy values of below 1.0 kJ mol−1, total flowrates were set to 6.0 mL min−1, compared to the range of 1.5–6.0 mL min−1 for the neutralization reaction.Instead of testing performance at different flowrates, the mixing enthalpies of the solvent system at 8 different compositions were chosen, which were measured 2 times each, at a system temperature of 25 °C. This was done to verify that the calorimeter can also detect very small differences in generated heat. Exemplarily, the mixing enthalpy of a mixture of xwater = 0.6 and xwater = 0.692 differs by only 0.009 kJ mol−1.
The full results from the experiments can be seen both in Table 4 and Fig. 12, where good agreement to an array of literature sources can be observed.
| Entry | x water | Mean ΔHM [kJ mol−1] |
|---|---|---|
| 1 | 0.900 | −0.580 |
| 2 | 0.840 | −0.746 |
| 3 | 0.771 | −0.826 |
| 4 | 0.692 | −0.855 |
| 5 | 0.600 | −0.846 |
| 6 | 0.491 | −0.793 |
| 7 | 0.360 | −0.688 |
| 8 | 0.200 | −0.475 |
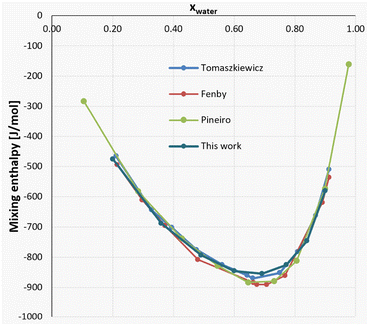 | ||
| Fig. 12 Mixing enthalpy of the MeOH–water system: comparison of literature values30–32 and our data. | ||
For a closer look, two compositions between around xwater = 0.75 and xwater = 0.65 were chosen for each literature source, showcasing both the differences in results for different literature sources, as well as the insertion of our results into the general consensus. The comparison of these values can be found in Table 5.
| Source | Mixture | Mixing enthalpy [kJ mol−1] |
|---|---|---|
| Piñeiro et al.41 | x water = 0.732 | −0.879 |
| Piñeiro et al.41 | x water = 0.646 | −0.882 |
| Tomaszkiewicz et al.42 | x water = 0.750 | −0.852 |
| Tomaszkiewicz et al.42 | x water = 0.662 | −0.870 |
| Fenby et al.43 | x water = 0.707 | −0.890 |
| Fenby et al.43 | x water = 0.675 | −0.890 |
| This work | x water = 0.771 | −0.826 |
| This work | x water = 0.694 | −0.885 |
Nitration reaction
A second reaction was chosen to test the calorimeter setup against very aggressive chemicals. The mono-nitration of toluene using concentrated nitric acid, with sulfuric acid as a homogenous catalyst, fulfills that criterion, while also being strongly exothermic and additionally a two-phase reaction, suitable to test the mixing capabilities of the split-and-recombine structure of the reactor plate (Scheme 1). | ||
| Scheme 1 Reaction scheme of the mononitration of toluene with nitric acid, showing the two main isomer products. | ||
The process enthalpy of the reaction is already known to be around −125.52 ± 2.56 kJ mol−1,44 and there has been extensive research on the reaction parameters and the kinetic behavior of the reaction.45–47
For our purposes, the reaction was carried out at a calorimeter temperature of 30 °C and a thermostat temperature of 33 °C. The two solutions, neat toluene and a HNO3![[thin space (1/6-em)]](https://www.rsc.org/images/entities/char_2009.gif) :
:![[thin space (1/6-em)]](https://www.rsc.org/images/entities/char_2009.gif) H2SO4 1
H2SO4 1![[thin space (1/6-em)]](https://www.rsc.org/images/entities/char_2009.gif) :
:![[thin space (1/6-em)]](https://www.rsc.org/images/entities/char_2009.gif) 1 v
1 v![[thin space (1/6-em)]](https://www.rsc.org/images/entities/char_2009.gif) :
:![[thin space (1/6-em)]](https://www.rsc.org/images/entities/char_2009.gif) v solution were pumped at varying total flowrates with a volumetric ratio of 1
v solution were pumped at varying total flowrates with a volumetric ratio of 1![[thin space (1/6-em)]](https://www.rsc.org/images/entities/char_2009.gif) :
:![[thin space (1/6-em)]](https://www.rsc.org/images/entities/char_2009.gif) 4 into the calorimeter, followed by a quench with 10 °C NaOH solution directly at the outlet with a ratio of 4
4 into the calorimeter, followed by a quench with 10 °C NaOH solution directly at the outlet with a ratio of 4![[thin space (1/6-em)]](https://www.rsc.org/images/entities/char_2009.gif) :
:![[thin space (1/6-em)]](https://www.rsc.org/images/entities/char_2009.gif) 1 against the combined flowrates of the 2 substrate solutions, to stop any additional toluene conversion. In terms of reaction products, HPLC analysis showed only the ortho and para variants of the monosubstituted toluene (as shown in the reaction scheme, meta- and di-substituted product was present at <1% of converted product), which were found at retention times of 4.3 and 4.8 minutes, respectively, with the unsubstituted toluene at 6.5 minutes.
1 against the combined flowrates of the 2 substrate solutions, to stop any additional toluene conversion. In terms of reaction products, HPLC analysis showed only the ortho and para variants of the monosubstituted toluene (as shown in the reaction scheme, meta- and di-substituted product was present at <1% of converted product), which were found at retention times of 4.3 and 4.8 minutes, respectively, with the unsubstituted toluene at 6.5 minutes.
Experiments were conducted in triplicates for 3 different total flow rates, the results of which are summarized in Table 6. Averaged over all experiments, we were able to reach an overall process enthalpy of −123.45 ± 24.34 kJ mol−1, compared to a reaction enthalpy of −125.52 ± 2.56 from literature.44
The relatively large standard deviation of our results can be attributed to the overall difficulty of the bi-phasic system at hand, which caused fluctuations in the conversion results of each individual sample measured by HPLC. This was alleviated by following stricter sample preparation procedures and preparing multiple samples for each of the experiments.
Nitrosylation reaction
Finally, to explore the advantages of the ceramic reactor plate, a nitrosylation reaction (see Scheme 2) was chosen due to its corrosive nature. Indeed, the reactive nitrosylation species, nitrosyl chloride, is able to corrode most metals, including nickel-based alloys or even gold.The overall reaction procedure was taken from the work of Godineau et al.48 and was adapted to be suitable for our calorimeter setup, since the coil reactor described in the original setup had a reaction volume of 2.0 mL, compared to the 222 μL of our ceramic reactor plate. This meant a decrease in overall flowrate from 2.8 mL min−1 to 0.296 mL min−1, allowing for a mean residence time of 48 seconds, which was determined by RTD, see Table 1.
The reaction was then carried out continuously at different temperatures for 30 minutes, to allow for the observation of temperature-dependent changes in overall reaction enthalpy. The reaction was quenched with ammonia solution directly after the calorimeter, and samples of the outflow were taken every 3 minutes starting at t = 5 min and were subsequently analyzed via HPLC. The product anti-pyruvic aldehyde 1-oxime was detected at 0.54 minutes retention time, while the limiting substrate tert-butyl nitrite was detected at 0.73 minutes.
The results can be seen in Table 7, showing a clear increase in reaction yield with increasing temperature, and a mean overall reaction enthalpy of −325.71 ± 15.97 kJ mol−1. However, taking only reactions with a yield higher than 20% leaves an average reaction enthalpy of −317.04 ± 11.11 kJ mol−1, since small deviations in yield caused by quench and analysis are much less likely to influence the overall reaction enthalpy in a major way. All results plotted against the second average reaction enthalpy can be seen in Fig. 13.
| Entry | T [°C] | Mean reaction yield [%] | ΔHR [kJ mol−1] |
|---|---|---|---|
| 1 | 10 | 7.49 | −308.77 |
| 2 | 18 | 10.36 | −341.28 |
| 3 | 25 | 13.09 | −344.40 |
| 4 | 40 | 23.84 | −328.15 |
| 5 | 50 | 43.25 | −305.93 |
| Mean ΔHR all entries [kJ mol−1] | −325.71 ± 15.97 | ||
| Mean ΔHR entries 4 + 5 [kJ mol−1] | −317.04 ± 11.11 | ||
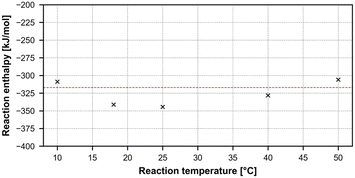 | ||
| Fig. 13 Graphical representation of the nitrosylation results, plotting reaction temperature versus calculated reaction enthalpy. | ||
Additionally, at the lowest temperature of 10 °C, an endothermic mixing process can be observed in the first of the two reaction segments. To showcase this finding, a measurement of a full reaction can be seen in Fig. 14.
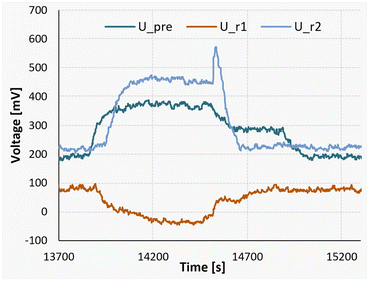 | ||
| Fig. 14 Measurement signals of the Peltier elements during a nitrosylation reaction at 10 °C, followed by a measurement pumping only pure solvent. | ||
The experiment was started at the time marker of 13![[thin space (1/6-em)]](https://www.rsc.org/images/entities/char_2009.gif) 700 seconds, initiating a gradual rise in the detected signal until reaching a state of equilibrium at approximately 14
700 seconds, initiating a gradual rise in the detected signal until reaching a state of equilibrium at approximately 14![[thin space (1/6-em)]](https://www.rsc.org/images/entities/char_2009.gif) 200 seconds. For the sake of comparison, between the time intervals of 14
200 seconds. For the sake of comparison, between the time intervals of 14![[thin space (1/6-em)]](https://www.rsc.org/images/entities/char_2009.gif) 500 and 14
500 and 14![[thin space (1/6-em)]](https://www.rsc.org/images/entities/char_2009.gif) 700 seconds, a stream of pure acetone was introduced in lieu of the substrate flow. Subsequently, from 14
700 seconds, a stream of pure acetone was introduced in lieu of the substrate flow. Subsequently, from 14![[thin space (1/6-em)]](https://www.rsc.org/images/entities/char_2009.gif) 700 seconds until 15
700 seconds until 15![[thin space (1/6-em)]](https://www.rsc.org/images/entities/char_2009.gif) 250 seconds, the pumps were deactivated to establish a baseline reference.
250 seconds, the pumps were deactivated to establish a baseline reference.
It can be seen that during the steady-state reaction phase (14![[thin space (1/6-em)]](https://www.rsc.org/images/entities/char_2009.gif) 200 to 14
200 to 14![[thin space (1/6-em)]](https://www.rsc.org/images/entities/char_2009.gif) 500 seconds), the signal observed in the first reaction segment (U_r1) is lower compared to both the solvent pumping stage and the stationary phase. This discrepancy indicates an endothermic mixing enthalpy of approximately +124 kJ mol−1. Nevertheless, when considering the comprehensive heat balance, the overall process enthalpy for the experiment still registers at −311 kJ mol−1.
500 seconds), the signal observed in the first reaction segment (U_r1) is lower compared to both the solvent pumping stage and the stationary phase. This discrepancy indicates an endothermic mixing enthalpy of approximately +124 kJ mol−1. Nevertheless, when considering the comprehensive heat balance, the overall process enthalpy for the experiment still registers at −311 kJ mol−1.
Fig. 15 on the other hand illustrates a reaction measurement conducted at a higher temperature of 40 °C. In this scenario, the absence of detectable endothermic mixing can be attributed to the heightened reaction rate experienced at elevated temperatures. Consequently, the reaction initiates already in segment 1, masking the initial stages of endothermic mixing. The experimental procedure was initiated at 8700 seconds, followed by the replacement of the substrate streams with pure acetone at 10![[thin space (1/6-em)]](https://www.rsc.org/images/entities/char_2009.gif) 700 seconds. Lastly, at 11
700 seconds. Lastly, at 11![[thin space (1/6-em)]](https://www.rsc.org/images/entities/char_2009.gif) 600 seconds, the pumps were deactivated to get the baseline reference.
600 seconds, the pumps were deactivated to get the baseline reference.
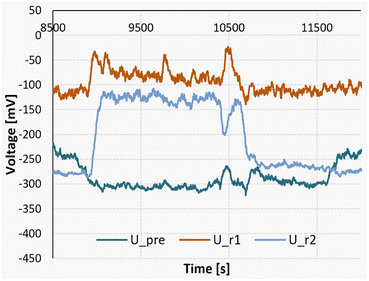 | ||
| Fig. 15 Measurement signals of the Peltier elements during a nitrosylation reaction at 40 °C, followed by a measurement pumping only pure solvent. | ||
Finally, to assess the mixing behavior specifically during the nitrosylation reactions, an additional mixing simulation has been carried out, the results of which can be seen in Fig. 16. It shows the mixing of two acetone phases, using the same flowrates as the real experiments, and showcasing their mixing behavior over both reaction segments. It can be seen that the higher flowrate of one the phases creates a tunnel of faster moving fluid at the top of the channel (see first cross-section), limiting mixing in this area, while the rest of the channel approaches ideal phase mixing at the end of the reactor (see second and third cross-section).
As such, using the determined residence time of 48 seconds as the only metric, does not fully capture reaction regime over the reactor plate. Instead, the simulation shows, that even if the reaction time of the nitrosylation were lower than the mean residence time, full conversion could not be reached. However, since the reaction is quenched at the outlet, and the process enthalpy is calculated taking the quenched reaction yield into account, our results regarding overall process enthalpy still hold up to scrutiny.
Conclusions
To tackle the challenges that are presented by highly exothermic reactions, which additionally require metal-free environments, we have developed a flow calorimeter featuring a 3D printed ceramic reactor plate and a metal-free continuous flow setup. We have characterized the system, specifically the split-and-recombine channel structure in the reactor plate, via residence time distribution studies as well as CFD simulations regarding mixing behavior.The capabilities of the calorimeter in terms of process enthalpy determination were successfully demonstrated by performing multiple reactions with known reaction and mixing enthalpies, namely a neutralization and a nitration reaction, as well as a binary solvent mixing system. All results show good agreement with literature sources, with percentage deviations in the low single-digits.
Finally, a challenging nitrosylation reaction which needs a metal-free environment was chosen from literature sources, adapted to suit the flow calorimeter setup, and characterized in terms of process enthalpy, at different reaction temperatures. Over the course of our measurements, we have discovered a strong endothermic mixing effect of the substrate streams of 120 kJ mol−1, followed by the determination of the overall process enthalpy of −317.04 ± 11.11 kJ mol−1.
Future work will focus on the determination of process enthalpies over the full course of reactions, to determine effects of interest such as mixing- and side reaction enthalpies, which can get masked by the usually high enthalpy of the main reaction at hand. Additionally, the thermokinetic measurements of reaction which predicate on the generation of unstable intermediates are also of interest, which would be carried out by the tandem combination of multiple flow calorimeters.
Conflicts of interest
There are no conflicts of interest to declare.Acknowledgements
The Research Center Pharmaceutical Engineering (RCPE) is funded within the framework of COMET – Competence Centers for Excellent Technologies by BMK, BMAW, Land Steiermark, and SFG. The COMET program is managed by the FFG.Notes and references
- X. Zhang, S. Stefanick and F. J. Villani, Org. Process Res. Dev., 2004, 8, 455–460 CrossRef CAS.
- M. A. Schneider, T. Maeder, P. Ryser and F. Stoessel, Chem. Eng. J., 2004, 101, 241–250 CrossRef CAS.
- Mettler-Toledo, RC1mx mit HFCal, https://www.mt.com/de/de/home/products/L1_AutochemProducts/reaction-calorimeters/RC1mx-Reaction-Calorimeter.html, (accessed January 25, 2023).
- Micro Reaction Calorimeter|Thermal Hazard Technology, https://www.thermalhazardtechnology.com/chemical-products/micro-reaction-calorimeter, (accessed January 25, 2023).
- M. C. Maier, M. Leitner, C. O. Kappe and H. Gruber-Woelfler, React. Chem. Eng., 2020, 5, 1410–1420 RSC.
- T. A. Frede, M. C. Maier, N. Kockmann and H. Gruber-Woelfler, Org. Process Res. Dev., 2022, 26, 267–277 CrossRef CAS.
- In Transport Phenomena in Micro Process Engineering, ed. N. Kockmann, Springer, Berlin, Heidelberg, 2008, pp. 163–224 Search PubMed.
- N. Kockmann and D. M. Roberge, Chem. Eng. Technol., 2009, 32, 1682–1694 CrossRef CAS.
- G. Glotz, D. J. Knoechel, P. Podmore, H. Gruber-Woelfler and C. O. Kappe, Org. Process Res. Dev., 2017, 21, 763–770 CrossRef CAS.
- F. Mortzfeld, J. Polenk, B. Guelat, F. Venturoni, B. Schenkel and P. Filipponi, Org. Process Res. Dev., 2020, 24, 2004–2016 CrossRef CAS.
- A. Ladosz, C. Kuhnle and K. F. Jensen, React. Chem. Eng., 2020, 5, 2115–2122 RSC.
- F. Reichmann, S. Millhoff, Y. Jirmann and N. Kockmann, Chem. Eng. Technol., 2017, 40, 2144–2154 CrossRef CAS.
- C. Zhang, J. Zhang and G. Luo, J. Flow Chem., 2020, 10, 219–226 CrossRef CAS.
- T. A. Frede, N. vom Hofe, R. Jasper Reuß, N. Kemmerling, T. Kock, F. Herbstritt and N. Kockmann, React. Chem. Eng., 2023, 8, 1051–1060 RSC.
- M. Moser, A. G. Georg, F. L. Steinemann, D. P. Rütti and D. M. Meier, J. Flow Chem., 2021, 11, 691–699 CrossRef CAS.
- R. M. Tiggelaar and J. G. E. Gardeniers, in Micro Process Engineering, John Wiley & Sons, Ltd, 2009, pp. 1–24 Search PubMed.
- J. J. Brandner, in Micro Process Engineering, John Wiley & Sons, Ltd, 2009, pp. 25–43 Search PubMed.
- P. J. Kitson, M. H. Rosnes, V. Sans, V. Dragone and L. Cronin, Lab Chip, 2012, 12, 3267–3271 RSC.
- P. J. Kitson, M. D. Symes, V. Dragone and L. Cronin, Chem. Sci., 2013, 4, 3099–3103 RSC.
- J. S. Mathieson, M. H. Rosnes, V. Sans, P. J. Kitson and L. Cronin, Beilstein J. Nanotechnol., 2013, 4, 285–291 CrossRef PubMed.
- G. Scotti, S. M. E. Nilsson, M. Haapala, P. Pöhö, G. B. af Gennäs, J. Yli-Kauhaluoma and T. Kotiaho, React. Chem. Eng., 2017, 2, 299–303 RSC.
- M. D. Symes, P. J. Kitson, J. Yan, C. J. Richmond, G. J. T. Cooper, R. W. Bowman, T. Vilbrandt and L. Cronin, Nat. Chem., 2012, 4, 349–354 CrossRef CAS PubMed.
- T. Monaghan, M. J. Harding, R. A. Harris, R. J. Friel and S. D. R. Christie, Lab Chip, 2016, 16, 3362–3373 RSC.
- O. Okafor, A. Weilhard, J. A. Fernandes, E. Karjalainen, R. Goodridge and V. Sans, React. Chem. Eng., 2017, 2, 129–136 RSC.
- G. Scotti, V. Matilainen, P. Kanninen, H. Piili, A. Salminen, T. Kallio and S. Franssila, J. Power Sources, 2014, 272, 356–361 CrossRef CAS.
- G. Scotti, P. Kanninen, V.-P. Matilainen, A. Salminen and T. Kallio, Energy, 2016, 106, 475–481 CrossRef CAS.
- J. S. Manzano, Z. B. Weinstein, A. D. Sadow and I. I. Slowing, ACS Catal., 2017, 7, 7567–7577 CrossRef CAS.
- E. Peris, O. Okafor, E. Kulcinskaja, R. Goodridge, S. V. Luis, E. Garcia-Verdugo, E. O'Reilly and V. Sans, Green Chem., 2017, 19, 5345–5349 RSC.
- M. Schwentenwein and J. Homa, Int. J. Appl. Ceram. Technol., 2015, 12, 1–7 CrossRef CAS.
- E. Zanchetta, M. Cattaldo, G. Franchin, M. Schwentenwein, J. Homa, G. Brusatin and P. Colombo, Adv. Mater., 2016, 28, 370–376 CrossRef CAS PubMed.
- A.-K. Hofer, A. Kocjan and R. Bermejo, Addit. Manuf., 2022, 59, 103141 CAS.
- A. Valotta, M. C. Maier, S. Soritz, M. Pauritsch, M. Koenig, D. Brouczek, M. Schwentenwein and H. Gruber-Woelfler, J. Flow Chem., 2021, 11, 675–689 CrossRef CAS PubMed.
- K.-W. Gyak, N. K. Vishwakarma, Y.-H. Hwang, J. Kim, H. Yun and D.-P. Kim, React. Chem. Eng., 2019, 4, 1393–1399 RSC.
- B. Gutmann, D. Cantillo and C. O. Kappe, Angew. Chem., Int. Ed., 2015, 54, 6688–6728 CrossRef CAS PubMed.
- D. Cantillo and C. Oliver Kappe, React. Chem. Eng., 2017, 2, 7–19 RSC.
- M. C. Maier, M. Leitner, C. O. Kappe and H. Gruber-Woelfler, React. Chem. Eng., 2020, 5, 1410–1420 RSC.
- G. Fu, J. Jiang, C. A. Hone and C. O. Kappe, React. Chem. Eng., 2023, 8, 577–591 RSC.
- O. Levenspiel, Chemical Reaction Engineering, John Wiley & Sons, New York, 3rd edn, 2019 Search PubMed.
- M. Rowe, J. Fluid Mech., 1970, 43, 771–783 CrossRef.
- E. Riedel and H.-J. Meyer, Allgemeine und Anorganische Chemie, De Gruyter, Berlin, Boston, 2018 Search PubMed.
- Á. Piñeiro, Á. Olvera, G. García-Miaja and M. Costas, J. Chem. Eng. Data, 2001, 46, 1274–1279 CrossRef.
- I. Tomaszkiewicz, Thermochim. Acta, 1986, 103, 281–289 CrossRef CAS.
- D. V. Fenby and A. Chand, J. Chem. Soc., Faraday Trans. 1, 1978, 74, 1768–1775 RSC.
- C. Y. Chen and C. W. Wu, J. Loss Prev. Process Ind., 1996, 9, 309–316 CrossRef.
- D. J. am Ende, P. J. Clifford and D. L. Northrup, Thermochim. Acta, 1996, 289, 143–154 CrossRef CAS.
- R. Halder, A. Lawal and R. Damavarapu, Catal. Today, 2007, 125, 74–80 CrossRef CAS.
- J. Antes, D. Boskovic, H. Krause, S. Loebbecke, N. Lutz, T. Tuercke and W. Schweikert, Chem. Eng. Res. Des., 2003, 81, 760–765 CrossRef CAS.
- E. Godineau, C. Battilocchio, M. Lehmann, S. V. Ley, R. Labes, L. Birnoschi, S. Subramanian, C. S. Prasanna, A. Gorde, M. Kalbagh, V. Khade, A. Scherrer and A. C. O'Sullivan, Org. Process Res. Dev., 2018, 22, 955–962 CrossRef CAS.
| This journal is © The Royal Society of Chemistry 2024 |


