 Open Access Article
Creative Commons Attribution 3.0 Unported Licence
Comparing SG1 and TEMPO for NMP of n-butyl acrylate in miniemulsion to optimize the average particle size for rate and molecular control†
Elnaz
Zeinali
a,
Yoshi W.
Marien
 *a,
Mariya
Edeleva
 b,
Sean R.
George
c,
Michael F.
Cunningham
c,
Dagmar R.
D'hooge
 ad and
Paul H. M.
Van Steenberge
 a
a
aLaboratory for Chemical Technology (LCT), Ghent University, Technologiepark 125, B-9052 Gent, Belgium. E-mail: yoshi.marien@ugent.be
bCentre for Polymer and Material Technologies (CPMT), Ghent University, Technologiepark 130, B-9052 Gent, Belgium
cDepartment of Chemical Engineering, Queen's University, Kingston, Ontario K7L 3N6, Canada
dCentre for Textile Science and Engineering (CTSE), Ghent University, Technologiepark 70a, B-9052 Gent, Belgium
First published on 9th February 2024
Abstract
Nitroxide mediated polymerization (NMP) in aqueous miniemulsion potentially offers both control over chain length and livingness, while reducing the reaction time compared to the NMP in bulk. However, the identification of the optimal average particle diameter (dp) to achieve these benefits remains elusive. In this work, for the NMP of n-butyl acrylate (nBuA), a deterministic population balance model, including 4D Smith–Ewart equations, is developed to find the optimal dp. It distinguishes nanoparticles according to their numbers of four radical types to calculate the monomer conversion and livingness and is coupled to moment equations to calculate average molar masses in a miniemulsion polymerization. This analysis is carried out for the first time for the two most important free nitroxides, being (N-(2-methyl-2-propyl)-N-(1-diethylphosphono-2,2-dimethylpropyl)-N-oxyl) (SG1) and (2,2,6,6-tetramethylpiperidine-1-oxyl) (TEMPO), using measured temperature-dependent free nitroxide partition coefficients, and accounting for backbiting and β-scission side reactions. This detailed and validated model reveals up to seven kinetic regimes (based on relative changes in rate acceleration and deceleration) in a wide dp range from 5 to 350 nm, featuring different NMP rates and levels of molecular control. It is shown that the SG1-based NMP needs a lower dp compared to TEMPO-based NMP to establish kinetic regimes different from the pseudo-bulk regime, hence, the so-called segregation effect (less termination in separate particles) and confined space effect (faster deactivation in small particles) are only active if dp is sufficiently decreased. It is further shown that the temperature needs to be sufficiently low to achieve a good balance between polymerization rate and control over average molar mass and livingness. A more industrially attractive higher solids content (e.g. 30%) can be employed if dp values below 120 nm for NMP with SG1, and below 150 nm for NMP with TEMPO, are aimed at. Higher TCL (targeted chain lengths, e.g. a TCL of 1000) reveal the beneficial effect of miniemulsion compared to bulk conditions specifically when employing a dp of ca. 50 nm for the SG1 case. Overall, the model enables the fine-tuning of reaction time, dispersity, and livingness, enabling the precision synthesis of a poly(n-butyl acrylate) latex with enhanced solids content and TCL.
1. Introduction
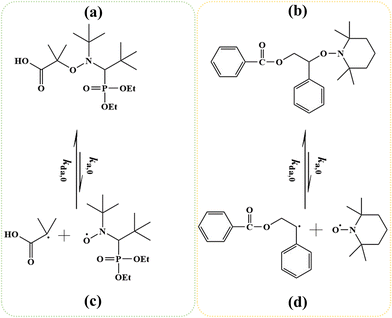
Reversible deactivation radical polymerization (RDRP) is powerful and versatile for the synthesis of well-defined macromolecules with controlled average chain length, dispersity, and livingness.1–11 One RDRP mechanism is nitroxide mediated polymerization (NMP), which uses NMP initiators such as 2-methyl-2-(N-tert-butyl-N-(1-diethylphosphono-2,2 dimethyl propyl))propanoic acid (MAMA-SG1; Fig. 1a), also known as BlocBuilder®, and 1-(benzoyloxy)-2-phenyl-2-(2′,2′,6′,6′-tetramethyl-1′-piperidinyloxy)ethane (BST, Fig. 1b).12–19 Upon activation at elevated temperature, these NMP initiators cleave to form (i) small (R0) radicals that can propagate, and (ii) nitroxides (denoted as X) e.g. N-(2-methyl-2-propyl)-N-(1-diethylphosphono-2,2-dimethylpropyl)-N-oxyl (SG1) in Fig. 1c and 2,2,6,6-tetramethylpiperidine-1-oxyl (TEMPO) in Fig. 1d, which can reversibly deactivate (macro)radicals.Popular monomers for NMP are acrylates. These acrylates are conventionally polymerized via free radical polymerization (FRP) under industrially relevant conditions of high rate well above room temperature in the absence of nitroxide (X). In this case, the FRP features two acrylic macroradical types, namely secondary end-chain radicals (ECRs) and tertiary mid-chain radicals (MCRs). These ECRs and MCRs are involved in acrylate-specific side reactions, e.g. backbiting, tertiary propagation and β-scission.20–26 The kinetic parameters of these side reactions were recently determined in a more reliable manner via a two-step pulsed laser polymerization.27 Based on these improved kinetic parameters, Edeleva et al.28 reported simulations of radical polymerization of acrylates in solution, demonstrating the relevance of these side reactions both in the absence and presence of the SG1-based alkoxyamine methyl-isopropionate-(N-tert-butyl-N-[1-diethylphosphono-(2,2-dimethylpropyl)]nitroxide). Despite these side reactions, SG1-mediated NMP provides acceptable molecular control and livingness for acrylate monomers at a polymerization temperature ranging from 363 to 393 K.29,30 The level of control is typically lower for BST-based NMPs because TEMPO-based activation is inherently slower so higher temperatures (>393 K) must commonly be employed, leading to more side reactions despite an increased NMP deactivation rate coefficient.31–34 Nonetheless, investigating TEMPO-mediated NMP of acrylates is interesting because TEMPO is more widely available and much less expensive than SG1.33
The present work studies NMP using both initiators in Fig. 1 under miniemulsion conditions, knowing that several studies have shown that NMP in dispersed phase media can provide better macromolecular control than NMP in homogeneous reaction media.4,5,35,36 In NMP in a so-called ideal aqueous miniemulsion, i.e. in a miniemulsion characterized by a monomodal population of monomer droplets and polymer particles in the absence of homogeneous nucleation, coalescence/coagulation, and Ostwald ripening, the polymer particles act as reaction loci, containing in many cases at most 2 propagating radicals each, thereby limiting the relative importance of termination and thus minimizing unwanted dead polymer formation.4,37–41 Although it has been demonstrated that factors such as the homogenization system, surfactant and initiator formulation, and reactor design affect the droplet/particle size distribution (evolution),42–47 the majority of kinetic modeling studies have assumed a constant average droplet/particle size in an ideal miniemulsion. For example, Zetterlund et al.48 used a TEMPO macroinitiator for NMP of styrene in miniemulsion at 398 K at various average particle sizes (dp = 70–200 nm) and found that sufficiently small particles (dp< 70 nm) lead to a higher polymerization rate with excellent control and livingness compared to NMP in homogeneous media.
However, polymerization in miniemulsion is more complicated than in solution or bulk due to the so-called (kinetic) compartmentalization effect.35,49–55 This effect encompasses two sub-types: (i) the “segregation effect” preventing two radicals from reacting with each other if they are in different particles,49,54 and (ii) the “confined space effect” expressing that two radicals inside the same (nano)particle react faster if dp is smaller,56,57 at least if the number of radicals in the nanoparticles is low. In this case, a limiting radical concentration is the reciprocal of the product of the Avogadro constant (NA) and the (average) particle volume (vp), from which Tobita58 defined the “single molecule concentration effect”. Additionally, Tobita58–60 proposed the “fluctuation effect” for particles containing less than ca. 10 free nitroxides. In that case, just one nitroxide more or less in a particle significantly changes the NMP rate.
Next to compartmentalization effects, an additional complication for polymerization in miniemulsion is phase transfer of small (reactive) molecules. These small molecules, e.g. nitroxides, can exit the nanoparticles and thus perturb the regular activation-growth-deactivation pattern. The resulting exit rate depends on dp, the molecular diffusivity, and the thermodynamics of the phase partitioning between the aqueous and organic phase. Recently, Zeinali et al.55 were the first to measure SG1 partitioning coefficients for acrylates under non-reactive conditions at different temperatures. Specifically, at a temperature of 385 K, a free SG1 partitioning coefficient of 144 was obtained.
Hence, many chemical and physical phenomena influence the kinetics of NMP in miniemulsion so that its engineering design requires the use of more detailed models featuring (i) an extensive reaction scheme, (ii) population balances for the various types of nanoparticles (depending on which radicals and how many radicals they contain), and (iii) phase transfer between the organic and aqueous phase. This is a cumbersome task, explaining why most (older) kinetic studies have investigated compartmentalization effects in the absence of phase transfer.33,61 For example, Maehata et al.62 reported an experimental study for NMP of styrene initiated by a TEMPO macroinitiator in miniemulsion at 408 K, and investigated the confined space effect on deactivation at varying dp (e.g. 50, 90, and 180 nm). They concluded that smaller particles exhibit lower rates of polymerization compared to larger particles. The fraction of dormant chains, i.e. the livingness, decreased to 50% as dp increased to 180 nm at 60% monomer conversion. Another example is the work of Zetterlund,33 who performed simulations for TEMPO-based NMP of n-butyl acrylate (nBuA) in miniemulsion at 403 K up to low monomer conversions (i.e. 20%). Using (2D) Smith–Ewart equations tracking NMP initiator radicals and macroradicals per particle and a dp between 30 and 200 nm, he showed that the confined space effect boosts the deactivation rate, and the segregation effect reduces the termination rate, at least when particles are adequately small and phase transfer is ignored. As a result, both compartmentalization effects synergistically lead to enhanced control and livingness. Bentein et al.63 showed the effect of nitroxide partitioning on SG1-mediated NMP of styrene in miniemulsion at 396 K and a dp of 70 nm up to high monomer conversion. They used 3D Smith–Ewart and rescaled pseudo-bulk moment equations to track the potential compartmentalization effect for (NMP) initiator radicals, ECRs and nitroxide radicals. Later on, Van Steenberge et al.64 extended the model of Bentein et al.63 using 4D Smith–Ewart equations, to describe the potential (extra) compartmentalization of MCRs in NMP of nBuA in miniemulsion. Their model featured nitroxide partitioning, backbiting, and MCR (tertiary) propagation for NMP of nBuA initiated by a SG1-macroinitiator in miniemulsion at 393 K. The use of a macroinitatior allowed to neglect exit/entry of the NMP macroinitiator radical. The authors simulated the short chain branching (SCB) fraction up to high conversion in a dp range of 20 to 80 nm for a SG1 partition coefficient theoretically ranging from 50 to 5000. Very recently, Zeinali et al.,55 upgraded the Smith–Ewart-based model by Van Steenberge et al.64 by using experimentally determined SG1 partitioning coefficients, adding exit/entry of small (R0) NMP initiator radicals and the key β-scission side reaction to properly predict the livingness.
To the best of the authors' knowledge, Zeinali et al.55 reported the most extensive and validated deterministic model for SG1-based NMP of nBuA in miniemulsion. Their model not only predicts SG1-based NMP experiments at 385 K reported by Nicolas et al.,13 but also predicted the higher branching levels65–68 under FRP conditions (i.e. in the absence of alkoxyamine or nitroxide). Zeinali et al.55 performed a sensitivity analysis for NMP of nBuA initiated by MAMA-SG1 at 385 K in miniemulsion using a broad dp range between 5 and 300 nm. If (for simplicity) phase transfer is neglected, then pseudo-bulk kinetics (kinetic regime 1) emerge at the highest dp, the segregation effect limiting termination (kinetic regime 2) dominates at intermediate dp, and the confined space effect enhancing NMP deactivation (kinetic regime 3) dominates at lower dp, which corroborates many other works.49,50,59,60,63 In contrast, in the presence of unavoidable phase transfer of small NMP initiator radicals and of the free nitroxide, seven (instead of three conventional) kinetic regimes are predicted by their model. In this case, the first two kinetic regimes remain but exit of NMP initiator radicals creates a third kinetic regime. Exit of free SG1 delivers a fourth kinetic regime, after which the confined space effect first takes place for the deactivation of NMP initiator radicals (kinetic regime 5) and then for free SG1 radicals (kinetic regime 6). Ultimately, for the lowest dp, a kinetic regime 7 is defined and characterized by fast entry and exit of radicals.
The present work explores this intriguing emergence of multiple kinetic regimes by not only investigating SG1 but also TEMPO mediated NMP in miniemulsion, again using experimentally measured partitioning coefficients. The effect of different nitroxides on compartmentalization effects has only been investigated theoretically for NMP of styrene in miniemulsion by Zetterlund et al.61 They used either TEMPO or 2,2,5-trimethyl-4-phenyl-3-azahexane-3-oxy (TIPNO) at 398 K up to monomer conversions of only 10% in a dp range between 20 to 100 nm. In contrast, a dedicated modelling study of the kinetic impact of different nitroxides on NMP of acrylates in miniemulsion has never been reported.
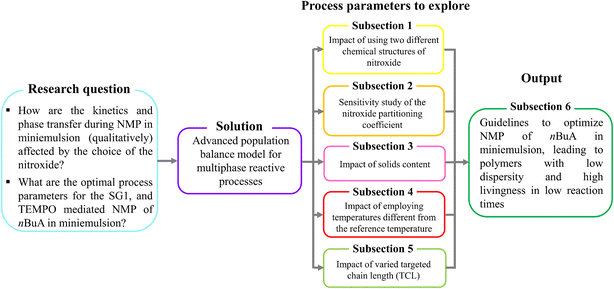
We aim at determining optimal process parameters for both nitroxides (Fig. 2, sky blue box) by applying the 4D Smith–Ewart model from Zeinali et al.55 (Fig. 2, purple box), spanning a wide dp range from 5 to 350 nm. After explaining the model development and validating the model against experiments, we investigate the effect of using a different NMP initiator on the relative positions of the kinetic regimes (section 3.1), anticipating that either a different (de)activation reactivity or phase transfer will affect the relative positions of the regimes. Secondly, because the partitioning behavior of both nitroxides differs, the effect of the nitroxide partitioning coefficient is theoretically investigated, covering both low (measured) room temperature partitioning coefficients (ΓSG1 = 65.8 and ΓTEMPO = 76.3) and high (theoretical) values (ΓX = 2000) corresponding to almost no partitioning (section 3.2). Thirdly, the effect of the solids content is studied by varying the volume fraction of the organic phase (section 3.3). Fourthly, we investigate the effect of temperature, distinguishing between the effect of temperature-dependent rate coefficients on the one hand, and the effect of temperature-dependent nitroxide partitioning coefficients on the other hand (section 3.4). Fifthly, the impact of varying the targeted chain length (TCL), which is defined as the initial molar ratio of monomer to NMP initiator, on the batch time, dispersity, and livingness is discussed (section 3.5).
Finally, the aforementioned five-step approach allows us to build comprehensive guidelines (section 3.6) to tailor the reaction time, dispersity and livingness for NMP of nBuA in miniemulsion (Fig. 2, dark green box).
2. Modeling methodology and validation
In a first subsection, NMP-specific reactions and side reactions for NMP of nBuA initiated by either MAMA-SG1 at 385 K or BST at 408 K in miniemulsion are described, including the reaction conditions and literature-based rate coefficients. A second subsection covers the Smith–Ewart (SE), continuity, and moment equations. The same subsection defines the SE rates required for the kinetic analysis and reports the measured nitroxide partitioning coefficients at different temperatures. The last subsection presents the model validation for both nitroxides.2.1. Reactions, rate coefficients and initial conditions
Table 1 lists the NMP-specific reactions, i.e., NMP activation and deactivation, and side reactions for acrylate radical polymerization, i.e. intramolecular chain transfer to polymer (backbiting), propagation by tertiary radicals, and β-scission, as well as Arrhenius parameters and rate coefficients for the NMP of nBuA initiated by MAMA-SG1 at 385 K and by BST at 408 K in miniemulsion.| Reaction | Equation | A [(L mol−1) s−1] | E A [kJ mol−1] | k [(L mol−1) s−1] | Nitroxide | Ref. |
|---|---|---|---|---|---|---|
| a Assumed critical chain length for entry is 4. b Assumed equal to ka,s. c Assumed equal to kda,s. d This rate coefficient has the unit of s−1. | ||||||
| Organic phase | ||||||
| NMP activation |

|
2.4 × 10¹⁴ | 130.8 | 10–4d | SG1 | 69 |
| 1 × 10¹⁴ | 139 | 9.6 × 10⁻⁵d | TEMPO | 70 | ||

|
2.4 × 10¹⁴ | 130.8 | 10–4d | SG1 | 69 | |
| 1 × 10¹⁴ | 139 | 9.6 × 10⁻⁵d | TEMPO | 70 | ||

|
2.4 × 10¹⁴ | 112.3 | 0.28d | SG1 | 69 | |
| 1.8 × 10¹⁴ | 119.8 | 5.3 × 10⁻²d | TEMPO | 70 | ||
| NMP deactivation |

|
8.8 × 10⁸ | 0 | 8.8 × 10⁸ | SG1 | |
| 2.3 × 10⁹ | 0 | 2.3 × 10⁹ | TEMPO | |||

|
8.8 × 10⁸ | 0 | 8.8 × 10⁸ | SG1 | 71 | |
| 2.3 × 10⁹ | 0 | 2.3 × 10⁹ | TEMPO | |||

|
2.6 × 10⁶ | 0 | 2.6 × 10⁶ | SG1 | ||
| 5.9 × 10⁸ | 0 | 5.9 × 10⁸ | TEMPO | |||
| Backbiting (i ≥ 3) |

|
5.38 × 10⁷ | 30.6 | 3.79 × 10³d | SG1 | 27 |
| 6.50 × 10³d | TEMPO | |||||
| β-Scission |

|
7.92 × 10¹² | 81.1 | 78.5d | SG1 | |
| 3.28 × 10²d | TEMPO | |||||

|
7.92 × 10¹² | 81.1 | 78.5d | SG1 | ||
| 3.28 × 10²d | TEMPO | |||||
| MCR propagation |

|
1.94 × 10⁶ | 30.1 | 1.60 × 10² | SG1 | 72 |
| 2.72 × 10² | TEMPO | |||||
| Other polymerization reactions, i.e., chain initiation, ECR propagation, chain transfer to monomer, and termination | See Section S.1 of the ESI,† for termination, the apparent termination rate coefficients are based on the composite kt model | |||||
| Interphase transport | ||||||
| Entry of R4a |

|
Entry and exit rate coefficients have been calculated based on eqn (S.1) and (S.2),† for which the parameters are summarized in Table S.2 of the ESI† | ||||
| Entry of R0 |

|
|||||
| Exit of R0 |

|
|||||
| Entry of X |

|
|||||
| Exit of X |

|
|||||
The initial MAMA-SG1 and BST concentrations are 2.73 × 10⁻² and 3.5 × 10⁻² mol Lor−1 (“or” denotes organic phase) and the reference initial monomer-to-water volume ratios are respectively 21 to 79 and 20 to 80. The complete table of rate coefficients, i.e. also including the rate coefficients and Arrhenius parameters for the free radical polymerization reactions, i.e., chain initiation, (ECR) propagation,72 chain transfer to monomer73 and termination, is given in Section S.1 of the ESI.†
Intermolecular chain transfer to polymer and macromonomer addition are not taken into account because they have a smaller kinetic impact,20 especially at low to intermediate monomer conversions. It is also assumed that NMP activation only takes place in the organic phase, since the considered NMP initiators are (quasi-)insoluble in water under neutral conditions.13,55 Consistent with our previous modeling work,55 NMP initiator radicals can undergo exit and propagate with monomer in the aqueous phase until a critical chain length of 4 (R4,aq) is reached, upon which fast irreversible entry into the particles is assumed, due to the limited solubility of these oligoradicals in the aqueous phase. Nitroxide degradation is neglected due to its slow nature (e.g. rate coefficient of 4.9 × 10⁻⁶ s−1 at 383 K for SG1).74,75
In the model, ECRs are formed by chain initiation of NMP initiator radicals or monomeric radicals, which are formed by chain transfer to monomer. Both radical types are formally grouped in the R0 population for simplicity. Because up to intermediate conversions the fraction of monomeric radicals formed through chain transfer to monomer is expected to be considerably lower than R0 radicals formed via NMP initiation, its contribution to the overall behavior becomes less pronounced. Therefore, in our analysis, we will for simplicity refer to R0 radicals as NMP initiator radicals. The ECRs can undergo backbiting to become MCRs, which can propagate, thereby forming ECRs that have a short chain branch (SCB), or alternatively undergo β-scission, forming macromonomers and shorter ECRs. Both ECRs and MCRs can undergo termination by recombination and disproportionation reactions with themselves and each other. The composite kt model76–78 is employed to describe chain length and monomer conversion dependent diffusional limitations on termination (Section S.1 of the ESI†).
The NMP equilibrium coefficients (KX; X = SG1 or TEMPO) for ECRs and MCRs, which are accompanied with the subscripts “s” and “t” to denote “secondary” and “tertiary” radicals, are given by:
 | (1) |
2.2. Populations balances and measured nitroxide partitioning coefficients
In line with previous modeling studies,55,63,64,79 the present population balance model is composed of three sets of ordinary differential equations (ODEs), namely (i) Smith–Ewart (SE), (ii) continuity, and (iii) rescaled (pseudo-bulk) moment equations. All equations and a description of the rescaled (pseudo-bulk) moment equations are given in Section S.2 of the ESI.†The 4D SE equations (eqn (2)) are the continuity equations for the particles possessing k secondary macroradicals (ECRs), l nitroxide radicals, m (NMP) initiator radicals, and n tertiary macroradicals (MCRs), Nk,l,m,n, for a unique monodisperse or constant average particle diameter dp, in the absence of homogeneous nucleation, Ostwald ripening, and coalescence/coagulation, and considering an oil-soluble alkoxyamine initiator. Mass conservation of non-compartmentalized, elementary species in both the organic phase and the aqueous phase is described by continuity equations. The rescaled (pseudo-bulk) moment equations originate from applying the method of moments (MoM) and allow prediction of the average chain length and molar mass distribution properties (e.g., number average molar mass (Mn), mass average molar mass (Mm), livingness, and dispersity) in the organic phase for the five macrospecies types, which are ECRs, MCRs, secondary-capped dormant chains, tertiary-capped dormant chains, and dead chains.
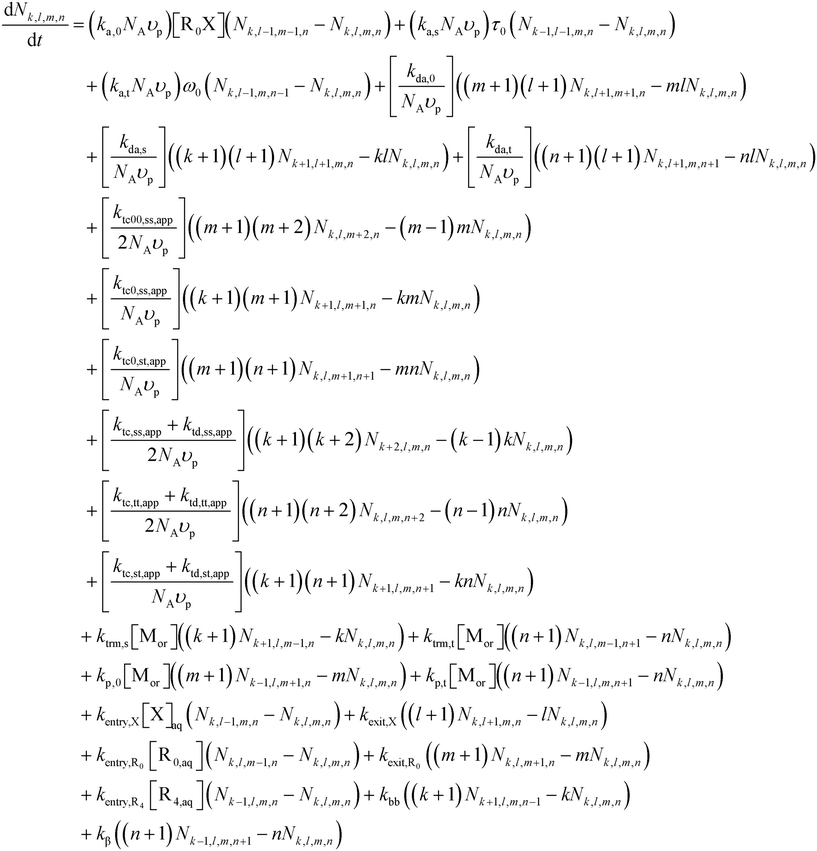 | (2) |
Special terms in the SE equations describe phase transfer kinetics of free nitroxide (X) and (NMP) initiator radicals (R0). The overall entry rates of those two species, thus for all nanoparticles together (whose number amount is Np), are given by:
| rentry,z = Npkentry,z[z]aq; z = X or R0 (s−1) | (3) |
Substituting the definition of the number of particles,  , and eqn (S.1)† into eqn (3) leads to eqn (3a):
 | (3a) |
The overall exit rate of R0 and X are given by:
| rexit,z = kexit,znz,tot = Cexit,zDzordp−2nz,tot; z = X or R0 (s−1) | (4) |
If the phase partitioning of free nitroxide and (NMP) initiator radicals is equilibrated, then they have equal entry and exit rates, so that the partitioning coefficient may be defined as:
 | (5) |
The temperature dependent partitioning coefficients for SG1 and TEMPO (Fig. 3a) have been determined under non-reactive conditions using a UV-vis spectrometer. The associated experimental protocol from Zeinali et al.55 is included in Section S.3 of the ESI.† The partitioning coefficient for TEMPO is higher than for SG1 at temperatures below 344 K, which is the intersection of the green and yellow line in Fig. 3a. However, once the temperature rises above 344 K, the partitioning coefficient of SG1 surpasses that of TEMPO. These changes occur due to differences in the enthalpy and entropy, which were derived from the Van't Hoff equation,80–82 for which the results are shown in Fig. 3b. Specifically, the phase transfer of both SG1 and TEMPO from water to BP requires an enthalpy increase of respectively 8.4 kJ mol−1 and 5.8 kJ mol−1, inducing an unfavorable enthalpic effect that pushes the phase equilibrium towards the water phase. However, the entropy increase of the phase transfer from water to BP of both free nitroxides, ΔS, is respectively 63.2 J mol−1 K−1 for SG1 and 55.5 J mol−1 K−1 for TEMPO, which dominates the enthalpic effect at typical temperatures, leading to a negative ΔG and, hence, a phase equilibrium tilted towards the organic phase. With increasing temperature, the entropic effect of SG1 phase transfer grows stronger than that of TEMPO, pushing the phase equilibrium of SG1 more towards the organic phase than TEMPO. Interestingly, at a polymerization temperature of 385 K (corresponding to 1/T = 0.0026, as indicated by the green box in Fig. 3a; SG1) and 408 K (corresponding to 1/T = 0.00245, as indicated by the yellow box in Fig. 3a; TEMPO) both partitioning coefficients are nearly equal because in both cases the ln values are close to 4.9. Hence, for the two polymerization temperatures selected, a reference partitioning coefficient of ca. 144 is defined.
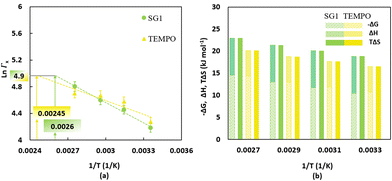 | ||
| Fig. 3 (a) Temperature-dependent partitioning coefficients of SG1 (filled green circles) and TEMPO (filled yellow triangles) determined by non-reactive partitioning experiments with butyl-propionate (BP), the nonpolymerizable (saturated) analogue of nBuA; the trendlines for the measured data points are shown by the dashed lines; average error bars are 5%;16 the intersections with the horizontal grey line allow to determine temperatures at which SG1 and TEMPO have the same reference partitioning coefficient (namely ΓX equal to ca. 144 at 385 K and 408 K, respectively). (b) Gibbs free energy, enthalpy and entropy differences for the phase transfer of SG1 (yellow bars) and TEMPO (green bars) from water to BP; enthalpy and entropy values are determined using the Van't Hoff equation.80–82 | ||
For the partitioning coefficient of R0, the value proposed in the work of Zeinali et al.55 is utilized for both NMP initiators. For entry and exit of R0, a literature-based value of Cexit,R0 = 1.5 × 10⁻¹ is used,83 and Centry,R0 is calculated from eqn (5) assuming for simplicity a partitioning coefficient of R0 equal to 10.83,84 Furthermore, a literature value of Centry,X = 6 × 10⁻⁶ is used,64 and Cexit,X is calculated from substituting this Centry,X value and the measured partitioning coefficient(s) into eqn (5).
The exit probabilities of free nitroxide and NMP initiator radicals, which are employed for the kinetic analysis in this work, are given by:
 | (6) |
 | (7) |
2.3. NMP model validation under miniemulsion conditions and emerging kinetic regimes
In our earlier modeling work,55 we validated the model against literature experimental data on NMP of nBuA initiated by the water-soluble sodium salt of MAMA-SG1, simply denoted as MAMA-SG1-Na. We employed experimental data from Nicolas et al.13 who used a dp of 370 nm, an initial monomer-to-water volume ratio of 29 to 71 and a TCL of 262, to validate the rate coefficients in Table 1 (SG1 case; measured ΓSG1 of 144.6 in Fig. 3). In the present work, we also validate the model for initiation by BST at 408 K at a TCL of 197 using the experimental data of Georges et al.85 and the kinetic parameters from Table 1 (TEMPO case; measured ΓTEMPO of 143.4 in Fig. 3). Fig. 4d depicts the comparison of experimental and modeled monomer conversion data. The comparison between simulated and experimental data for Mn and dispersity is illustrated in Fig. S.2e and f.† The kinetic parameters were sourced from prior literature, validated through the modeling of a large number of data points. This validation process involved the initial validation under FRP and NMP in solution/bulk conditions, followed by further validation under NMP in miniemulsion conditions, as detailed in Fig. S.1 of the ESI.† The unreported experimental value of dp is assessed to be 200 nm (blue lines vs. blue points), which is explained in detail in Section S.4 of the ESI.†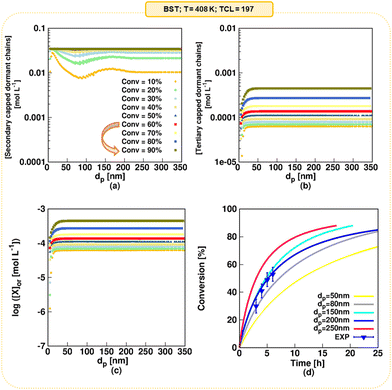 | ||
| Fig. 4 Model predictions as a function of dp for NMP initiated by BST; (a) secondary-capped dormant chains concentration, which coincide in the monomer conversion range of 60 to 90% (the arrow in the legend emphasizes that a plateau is formed above a monomer conversion of 60% because of TEMPO accumulation) (b) tertiary-capped dormant chains concentration, (c) (organic phase average) nitroxide concentration, and (d) monomer conversion profile for dp values of 50, 80, 150, 200, and 250 nm; in subplot d the experimental data from Georges et al.85 is included (symbols); T = 408 K; [nBuA]0/[BST]0 = 197; solids content = 20 vol% (reverse engineering delivers a dp of 200 nm); for the model validation of the SG1-based NMP, the reader is referred to Zeinali et al.55 | ||
NMP of nBuA initiated by MAMA-SG1 in miniemulsion generally reaches high monomer conversion.55 In contrast, NMP initiated by BST features TEMPO accumulation, which shifts the NMP equilibrium to the side of the dormant chains, slowing down the polymerization.85 To prove that the present model predicts this, the (organic) secondary-capped dormant chains concentration, tertiary-capped dormant chains concentration, nitroxide concentration, and the monomer conversion profile for dp values of 50, 80, 150, 200, and 250 nm are shown in Fig. 4. In a monomer conversion range between 60% and 90%, the secondary-capped dormant chains concentration becomes constant at any dp (Fig. 4a), while the tertiary-capped dormant chains concentration keeps increasing with increasing monomer conversion (Fig. 4b). Consistently, and accounting for phase partitioning, the (average) organic-phase nitroxide concentration increases three-fold from 1.4 × 10⁻⁴ mol Lor−1 at a monomer conversion of 60% to 4.5 × 10⁻⁴ mol Lor−1 at a monomer conversion of 90% (Fig. 4c). Finally, for all dp, at higher monomer conversions (e.g. above 60%), Fig. 4d shows a plateau in the monomer conversion versus time profile (see e.g. pink line for 250 nm). Hence, this model prediction demonstrates TEMPO accumulation in accordance with experimental findings,85 highlighting the challenge of attaining monomer conversions (well) exceeding 60% in NMP initiated by BST.
To further illustrate the different behavior between NMP using MAMA-SG1 and BST, Fig. S.5 of the ESI† displays the absolute reaction time predicted at monomer conversions of 60% and 90%. In particular, the reaction time to reach a 90% monomer conversion in NMP in the presence of BST, is notably high for average particle diameters in the small and middle range. For example, simulations show that achieving a 90% monomer conversion takes a long time when using BST. Instead, employing NMP initiated by MAMA-SG1 leads to a significant decrease in the reaction time.
The model validation for both NMPs was carried out with a complete, so-called “realistic”, model, while our comparison with earlier reported models will be carried out in the present work using an idealized model in which phase transfer is theoretically neglected. In our previous work, which dealt only with SG1,55 such idealized conditions led to the emergence of three literature kinetic regimes (kinetic regime 1, 2 and 3) with a transition regime (denoted “23”) featuring the fluctuation effect. In contrast, the realistic model for the SG1-based NMP revealed seven kinetic regimes, conserving the prediction of the pseudo-bulk regime at a dp larger than 350 nm.
3. Results and discussion
We use the developed model to predict how changes in dp from 5 to 350 nm affect the rate of NMP in miniemulsion, as well as the dispersity and livingness, ultimately aiming at design (Fig. 1). Average particle sizes as small as 5 nm are simulated theoretically, to anticipate further experimental advances, e.g. the recent achievement of particles as small as 20 nm.86 The upper dp limit of 350 nm is used to demonstrate that the model predicts the pseudo-bulk regime.In what follows, firstly we explain how the nitroxide type in NMP of nBuA affects compartmentalization for idealized and realistic miniemulsions, i.e. in miniemulsions without and with radical entry/exit, respectively. Then we perform a sensitivity analysis on the values of the nitroxide partitioning coefficients to study the effect on reaction time, dispersity, and livingness. We subsequently investigate the effect of the solids content, temperature and TCL on the same three average polymer properties to finally optimize several reaction conditions. Lastly, we present a comprehensive set of guidelines to optimize the reaction conditions for NMP of nBuA in miniemulsion, especially the ideal dp for either MAMA-SG1 or BST.
3.1. Comparing kinetic regimes and the dynamic behavior for both nitroxides for the idealized and realistic model
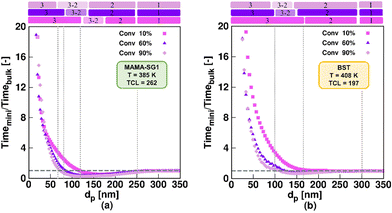
Fig. 5 shows the ratio of the time to reach 10%, 60% and 90% monomer conversion in an idealized miniemulsion to the time needed to reach these monomer conversions in pseudo-bulk (350 nm) for MAMA-SG1 (subplot a) and BST (subplot b) as NMP initiator. For both nitroxides, three well-known kinetic regimes49,50,59,60 are identified depending on dp: pseudo-bulk kinetics (kinetic regime 1) at large dp, the segregation effect (kinetic regime 2) at intermediate dp, and the confined space effect on NMP deactivation (kinetic regime 3) at small dp.Interestingly, going from large to small dp, the segregation effect (kinetic regime 2) only starts to dominate at a smaller dp for SG1-mediated NMP than for TEMPO-mediated NMP. NMP (activation–deactivation) equilibrium coefficients for SG1 are larger than for TEMPO, leading to higher macroradical concentrations in MAMA-SG1-initiated NMP at high dp (Fig. S.4a of the ESI†) so that smaller dp are needed for the segregation effect to dominate. Similarly, for kinetic regime 3, the dominance of the confined space effect shifts to smaller dp in SG1-mediated NMP. This shift is attributed to higher SG1 concentrations in the particles compared to TEMPO concentrations (Fig. S.4b of the ESI†), which implies that the low nitroxide numbers needed for the confined space effect to manifest are obtained only at lower dp.
The comparison between TEMPO and SG1 in idealized miniemulsion can also be made by evaluating the intensity of compartmentalization effects. This is done by examining the distance between (one of) the purple lines and the horizontal grey dashed line. In TEMPO-mediated NMP, this distance is significantly smaller compared to SG1-mediated NMP, because the SG1-mediated NMP is more active and contains more radicals per particle, as explained above. This causes the segregation effect to become operative at lower dp (e.g. 250 nm) for SG1 than for BST (e.g. 300 nm) and implies that the deceleration in kinetic regime 3 and acceleration in kinetic regime 2 are less pronounced for TEMPO-mediated NMP compared to SG1-mediated NMP.
A closer inspection of Fig. 5 reveals that significantly more time is needed to reach 60% monomer conversion in kinetic regime 3 (dp < 80 nm for MAMA-SG1; dp < 100 nm for BST), compared to the pseudo-bulk regime (kinetic regime 1). This can be attributed to a strong confined space effect on deactivation for such small particles. In contrast, in kinetic regime 2 (ca. 80 nm < dp < 250 nm for SG1-mediated NMP and ca. 100 nm < dp < 300 nm for TEMPO-mediated NMP), where the segregation effect dominates, NMP in miniemulsion is faster than NMP under pseudo-bulk conditions. Conveniently, the dp range of kinetic regime 2 broadens for an increasing monomer conversion, irrespective of the choice of nitroxide, facilitating experimental execution of such NMPs to high conversion in kinetic regime 2. For completeness, we mention that the segregation effect in TEMPO-mediated NMP can be neglected at 10% monomer conversion (light purple squares in Fig. 5b), because NMP initiator conversions are too low and, hence, also the radical concentrations are too low at such early stages of the NMP.
For the idealized model predictions in Fig. 5, additional results are shown in Fig. 6 (purple downward-pointing triangles). The purple downward-pointing triangles in Fig. 6 do not account for phase transfer and show the effect of dp on (i) the (absolute) NMP time to reach 60% monomer conversion, (ii) the dispersity and (iii) livingness of NMP initiated by MAMA-SG1 (top subplots) and BST (bottom subplots) at 60% monomer conversion. As expected, the three kinetic regimes described in Fig. 5 are observed. Specifically, in kinetic regime 1, the pseudo-bulk limit is identified from the constant values for reaction time, dispersity, and livingness for dp > 250 nm and dp > 300 nm in NMP initiated by MAMA-SG1 and BST, respectively. This is in line with the observations of Li et al.,87 who stated that compartmentalization effects are absent at ca. 250 nm for ATRP of n-butyl methacrylate in miniemulsion. In kinetic regime 3 (idealized model) the NMP time to reach 60% monomer conversion increases dramatically with decreasing dp due to the confined space effect. Similar findings have been reported by Zetterlund et al.50 for NMP of styrene with TEMPO in miniemulsion for dp < 70 nm. Furthermore, the idealized model using MAMA-SG1 (Fig. 6a) predicts a larger gap between the purple symbols and the dotted grey horizontal line compared to the smaller gap when using BST (Fig. 6d), again confirming the difference in intensity of compartmentalization effects for SG1 and TEMPO.
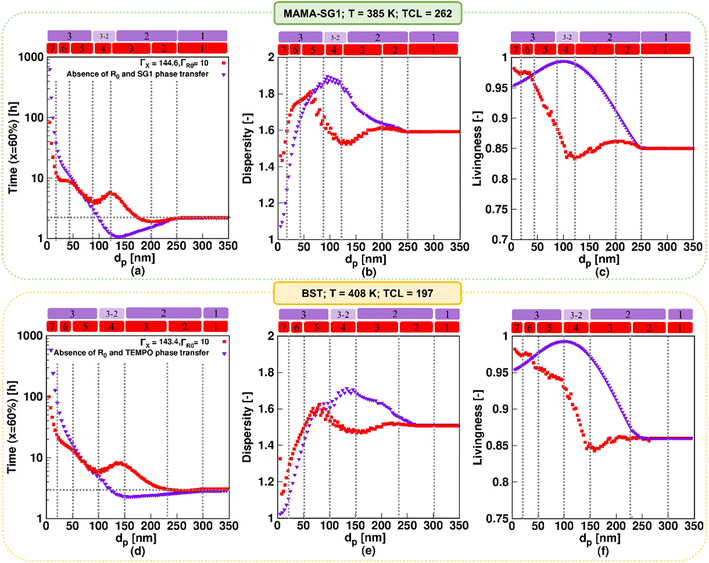 | ||
| Fig. 6 Effect of nitroxide in NMP of nBuA in miniemulsion on the three well-known kinetic regimes in “idealized” miniemulsion (▼) and the seven kinetic regimes in “realistic” miniemulsion (■) on (a and d) time to reach 60% monomer conversion, (b and e) dispersity, and (c and f) livingness at a monomer conversion of 60%; the top subplots show the NMP initiated by MAMA-SG1 at 385 K, while the bottom subplots show the NMP initiated by BST at 408 K. Analogous results at lower monomer conversions for subplot a and d are given in Fig. S.6 of the ESI.† | ||
Fig. 6b, c, e and f show that the segregation effect (kinetic regime 2; idealized model) reduces termination, leading to a higher dispersity and livingness. This is consistent with the theoretical work of Zetterlund et al.33 on TEMPO-mediated NMP of nBuA in miniemulsion at 403 K, where the segregation effect accelerates the NMP for dp between 110 and 180 nm in the absence of phase transfer. Notably, the dispersity reaches a maximum around the lower dp boundary of kinetic regime 2 (Fig. 6b and e), which is corroborated in the work of Thomson et al.53 on ATRP of n-butyl methacrylate.
Our previous work55 predicted a transition regime between kinetic regime 3 and kinetic regime 2 in the idealized model, which is consistent with the work of Tobita.58–60 This transition regime is indicated with the “3–2” notation in Fig. 6, and features a faster polymerization, caused by fluctuations in the number of free nitroxides inside the particles. This enhancement takes place for dp between 100 and 135 nm in NMP initiated by MAMA-SG1, and between 125 and 150 nm in NMP initiated by BST. The fluctuation effect is thus observed at a lower dp in SG1-mediated NMP in contrast to TEMPO-mediated NMP. This indicates again that the more active SG1-mediated NMP (higher equilibrium coefficient) requires a stronger confinement (smaller dp) to approach the single molecule effect, leading to the presence of less than 10 free nitroxides in the particles at a dp of 135 nm (Fig. S.4c of the ESI†).
The trends for the idealized miniemulsions described in the previous paragraph change for both NMPs when phase transfer becomes active, i.e. in the realistic miniemulsions where phase transfer is operative. This can be observed from the red squares in Fig. 6 deviating from the purple symbols (idealized model). Despite that the MAMA-SG1 initiated NMP is carried out at 385 K and the BST initiated NMP at 408 K, the nitroxide partitioning coefficients remain nearly equal, as depicted in Fig. 3a. Interestingly, even with these equal nitroxide partitioning coefficients, variations emerge in the intensity of confined space effects, segregation effects, and phase transfer dynamics when comparing the two realistic NMPs in miniemulsion. In agreement with our earlier work on the SG1-based NMP,55 seven kinetic regimes emerge as a function of dp in both NMP time plots under realistic miniemulsion conditions (Fig. 6a and d). These regimes have been demarcated based on significant trend changes in the slope of the (extrapolated) lines through the red squares.
In more detail, the first kinetic regime predicted by the realistic model in Fig. 6 (red squares), corresponding to pseudo-bulk kinetics, is positioned in the same dp range as the first regime predicted by the idealized model, i.e. for dp > 250 nm (MAMA-SG1 initiated) and dp > 300 nm (BST initiated). The second kinetic regime, featuring a dominant segregation effect, is positioned in a smaller dp range in the realistic model than in the idealized model. For instance, for MAMA-SG1 initiated NMP, the kinetic regime 2 is positioned in the range 120 < dp < 250 nm in the idealized model, compared to 200 < dp < 250 nm in the realistic model (Fig. 6a). For BST-initiated NMP, this kinetic regime 2 is positioned at 150 < dp < 300 nm in the idealized model and at 230 < dp < 300 nm in the realistic model (Fig. 6d). Similar to the idealized miniemulsion, the segregation effect is again less pronounced in BST-initiated NMP than in MAMA-SG1-initiated NMP, due to the inherently lower NMP equilibrium coefficient for TEMPO.
In addition, the NMP deceleration in kinetic regime 3 for the realistic model in Fig. 6 (red squares), which is caused by NMP initiator radical exit, occurs between 120 and 200 nm for MAMA-SG1 and between 150 and 230 nm for BST. Fig. 6a depicts a more pronounced deceleration compared to Fig. 6d, indicating more exit of NMP initiator radicals for MAMA-SG1. Both NMPs share a R0 partitioning coefficient of 10 but the deactivation in the BST-initiated NMP is stronger so that R0 has a lower exit probability at lower monomer conversions (e.g. 10%) (Fig. 7d) compared to the MAMA-SG1-initiated NMP (Fig. 7b) in kinetic regime 3. However, the decreases in dispersity are still somewhat similar: the dispersity for BST diminishes from ca. 1.52 (at 230 nm) to a minimum dispersity of ca. 1.48 (at 150 nm), whereas in MAMA-SG1 the dispersity decreases from ca. 1.6 (at 200 nm) to a minimum dispersity of ca. 1.5 (at 120 nm).
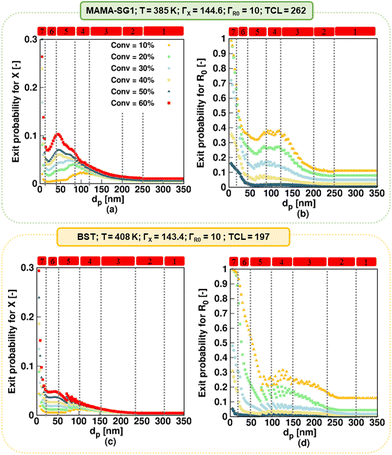 | ||
| Fig. 7 (a and c) Nitroxide exit probability (eqn (6)), and (b and d) R0 exit probability (eqn (7)) for specific monomer conversions as a function of dp. Simulations using the realistic model for NMP of nBuA initiated by MAMA-SG1 at 385 K in the top subplots and initiated by BST at 408 K in the bottom subplots. | ||
Kinetic regime 4 in the realistic model, in which the NMP accelerates (Fig. 6; red squares), is also positioned at lower dp for the SG1-based NMP. The dp range ranges from 120 to 80 nm compared to the BST-mediated NMP for which a range from 150 to 100 nm holds. Moreover, the reaction rate variation within this kinetic regime is steeper for MAMA-SG1 (Fig. 6a) compared to BST (Fig. 6d). Despite the similar partitioning coefficients of the two nitroxides, the intrinsically higher deactivation rate for ECRs (rda,s) and R0 (rda,0) by TEMPO reduces nitroxide exit probabilities more, as shown in Fig. 7a and c. However, for both free nitroxides, their exit cannot be avoided, leading to a lower control over chain length. By decreasing dp in kinetic regime 4, the control over chain length decreases and the dispersity increases from 1.5 to 1.8 in Fig. 6b (for MAMA-SG1) but only from 1.48 to 1.6 in Fig. 6e (for BST) because of a lower nitroxide exit probability.
The difference in dp-shifts between both NMPs also holds for kinetic regime 5 in Fig. 6 (realistic model; red squares), showing that the confined space effect on NMP deactivation of R0 leads to an increase in reaction time and a decrease in dispersity, i.e. for MAMA-SG1 for dp between 80 and 40 nm and for BST between 100 and 50 nm. This difference between both NMPs can again be attributed to the lower deactivation rate coefficients of SG1 compared to TEMPO. Fig. S.8 of the ESI† confirms this by showing that a smaller particle size is required in NMP initiated by MAMA-SG1 to achieve the same number of nitroxides per particle as in NMP initiated by BST, indeed suggesting that the confined space effect becomes operational at smaller dp for SG1.
Fig. 7c shows that, in kinetic regime 6 (red squares), TEMPO exit becomes constant for dp between 20 and 50 nm, due to a weaker confined space effect. In contrast, SG1 exit slows down due to a strong confined space effect for dp between 20 and 40 nm. Consistent with the dp shift, a lower dp is needed in NMP initiated by MAMA-SG1 (ca. dp < 40 nm) at 385 K than initiated by BST (ca. dp < 50 nm) at 408 K to achieve a high control over chain length and a livingness value as high as 0.95.
Finally, in kinetic regime 7 in the realistic model (Fig. 6; red squares), for which the confined space effect is strong and exit-entry is rapid, NMP deceleration is observed below a dp of 20 nm for both NMP of nBuA initiated by MAMA-SG1 and BST. Better control over chain length and livingness is observed due to high reaction times and very slow termination (Fig. 6b, c, e and f). Because phase transfer is now twice very fast, the dp shift is less important.
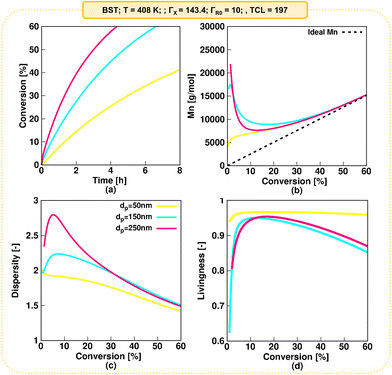
In addition to investigating the NMP time and polymer properties at a fixed monomer conversion of 60% as a function of dp, it is interesting to study the dynamic behavior of these characteristics at a few well-selected dp values. Since the dynamic behavior of the monomer conversion, Mn, dispersity, and livingness at various dp in NMP of nBuA initiated by MAMA-SG1 at 385 K in miniemulsion have already been extensively addressed in our prior work (see Fig. S.17 of the ESI† showing the results for a dp of 50, 150, and 200 nm),55 our current focus is on exploring the dynamic behavior of these properties at three well-selected dp values (50, 150, and 200 nm) in the NMP of nBuA initiated by BST at 408 K. The results are presented in Fig. 8 and the subsequent paragraphs. Additionally, the dynamic behavior of the average number of R0, ECR, MCR, and nitroxide radicals per particle are shown in Fig. S.18 of the ESI† for both NMPs.
A typical monomer conversion profile is observed in Fig. 8a. Consistent with the previous discussion, increasing the dp from 50 nm (kinetic regime 5) to 150 nm (kinetic regime 3) and 250 nm (kinetic regime 2) leads to a faster NMP. As shown by Fig. 8b, at all three dp values a deviation of Mn from the ideal linear increase (dashed line) is observed at low monomer conversions, which is attributed to slow NMP initiation on a monomer conversion basis. This is confirmed in Fig. S.19,† where the NMP initiator is only fully converted at ca. 40% monomer conversion for a low dp of 50 nm. The slow initiation is even more pronounced for a dp of 150 and 250 nm (complete R0X conversion at a monomer conversion of ca. 55 and 60% respectively), explaining the larger discrepancies from the ideal Mn values at low monomer conversions for these dp values. For all dp values, as depicted in Fig. 8b, Mn approaches close to ideal Mn values for monomer conversion higher than 50%.
Consistent with the deviations from the ideal Mn at low monomer conversions due to slow NMP initiation on a monomer conversion basis, higher dispersities are predicted at low monomer conversions, with the higher values predicted for the highest dp. As shown in the Fig. 8c, the dispersity eventually reaches a value of 1.5 at a monomer conversion of 60%. Finally, Fig. 8d shows the evolution of the livingness. Also here one observes that slow NMP initiation on a monomer conversion basis leads to lower values of the livingness at low monomer conversions. Consistent with Fig. 6, larger livingness values are observed at a dp of 50 nm, while a similar livingness is observed at 150 and 250 nm, although with slightly lower values observed at a dp of 150 nm.
3.2. Theoretical deviation of the nitroxide partitioning coefficient from the measured values
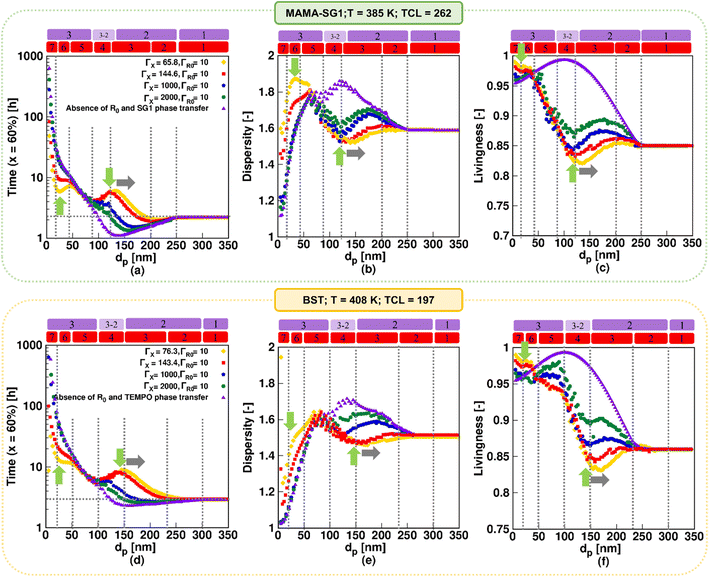
Fig. 9 shows the impact of theoretically varying the nitroxide partitioning coefficient on the reaction time, dispersity, and livingness as a function of dp for MAMA-SG1 at 385 K (top row) and for BST at 408 K (bottom row) for dp values between 5 and 350 nm. The simulations for ΓSG1 = 65.8 and ΓTEMPO = 76.3 (both in yellow) are used to demonstrate how large the error is if a ΓX recorded at ambient temperature is (erroneously) used in a simulation with a significantly higher polymerization temperature. The investigation also delves into hypothetical situations in which free nitroxide is less water-soluble by conducting simulations employing larger values, namely ΓX of 1000 (dark blue) and 2000 (dark green). Note that the simulations with ΓSG1 = 144.6 and ΓTEMPO = 143.4 (red) and the one in the absence of phase transfer (purple) are the same as in Fig. 6.For the results based on ambient-temperature partitioning coefficients, seven kinetic regimes result again. When increasing ΓX, the peak intensities (indicated by two green arrows) weaken, and only the conventional three kinetic regimes are predicted for the very high ΓX of 1000 and 2000, in line with previous work.55,64 Through the comparison of various colors depicting the influence of ΓX across the top and bottom subplots in Fig. 9, it becomes evident that the rates of acceleration and deceleration within kinetic regime 3, 4, 6, and 7 are more pronounced in the NMP initiated by MAMA-SG1 in contrast to NMP initiated by BST. For instance, in NMP initiated by MAMA-SG1, more than 40 hours are required to achieve a monomer conversion of 60% for a negligibly low nitroxide solubility in water (ΓX = 2000) at a dp of 20 nm, despite acceptable chain length control (dispersity = 1.35) and livingness of 0.96. A time reduction of a factor 8, requiring only ca. 5 hours, results for a low ΓSG1 of 65.8 to achieve the same monomer conversion with a dispersity above 1.7 and a nearly equal livingness. This time reduction factor becomes 5 for NMP initiated by BST, at the same dp of 20 nm and a ΓX of 2000, despite having a dispersity close to 1 and a livingness of 0.96, taking nearly 70 hours. However, for the lowest ΓTEMPO of 76.3, 12 hours are needed, with a dispersity of 1.4 and a livingness of 0.98.
For a better comprehension of why the influence of nitroxide partitioning is more theoretically noticable in NMP initiated by MAMA-SG1, we examine the probabilities of nitroxide and R0 exit, which are depicted in Fig. S.10 of the ESI.† The difference between both NMPs arises due to lower NMP equilibrium coefficients (KX) in TEMPO compared to SG1, resulting in lower probabilities of nitroxide and R0 exit in NMP of nBuA initiated by BST. Hence, the NMP initiated by BST exhibits lower sensitivity to ΓX, which is confirmed by the closely clustered colors in Fig. 9(d)–(f), resulting in less variation and reduced acceleration and deceleration in kinetic regimes 3, 4, 6, and 7 compared to NMP initiation by MAMA-SG1.
Fig. 9a shows the fastest NMP in kinetic regime 6 (at dp < 50 nm) when using ΓX at ambient temperature (yellow line at the first green vertical arrow). This is caused by slower deactivation due to a very high exit probability of free nitroxide (Fig. S.10 of the ESI†) weakening the confined space effect, thereby causing the highest dispersity (indicated by the first green vertical arrow in Fig. 9b). This trend is consistent with the findings of Van Steenberge et al.64 for NMP of nBuA and Charleux for NMP of styrene.88 When going from the highest ΓX (purple) to lowest ΓX (yellow), kinetic regime 4 also broadens, due to the increasing leakage of nitroxide (decreasing ΓX) over NMP initiator leakage (at constant ΓR0). A horizontal rightward shift (indicated by the gray horizontal arrow) of the peak maximum in Fig. 9 can therefore be observed for the NMP initiated by MAMA-SG1 and BST, at dp of 130 nm and 150 nm, respectively.
Concluding, inaccurately applying partitioning coefficients in the model can lead to large errors in dispersity and livingness, particularly for the dp range associated with kinetic regimes 3, 4, 6, and 7. The errors are the largest when SG1 is employed and when ambient-temperature ΓX values or values closer to idealized behavior (i.e. very little leakage) are utilized.
3.3. Variation of solids content
For the realistic model, Fig. 10 shows the evolutions of NMP time, dispersity and livingness for solids contents of 10% (blue), 20% (red), and 30% (yellow) for the same dp values as in Fig. 6 for NMP initiated by MAMA-SG1 at 385 K (top plots) and for BST at 408 K (bottom plots). The simulations with solids content of 20% (red symbols) correspond to the reaction conditions of the experimental data.13,15,85,89 However, industry typically desires higher solids contents, justifying the investigation of 30% solids content.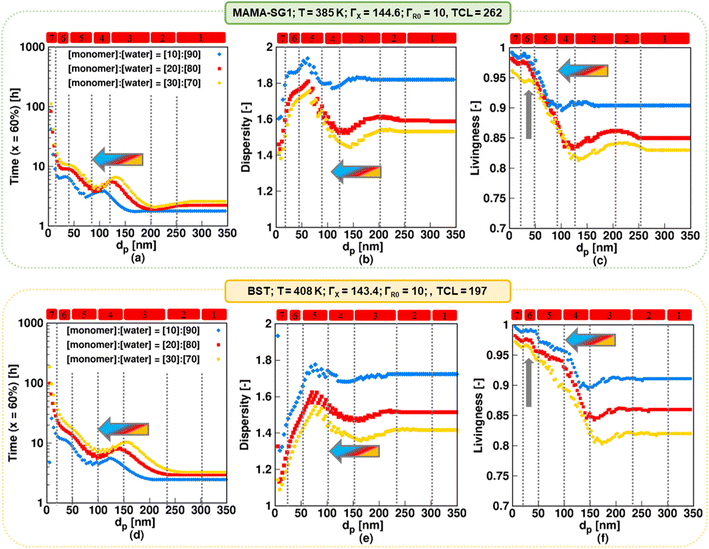 | ||
| Fig. 10 The impact of solids content (10%; filled blue rhombus, 20% filled red square, and 30%; filled yellow circle) in NMP of nBuA (realistic model) initiated by MAMA-SG1 at 385 K (top subplots) and initiated by BST at 408 K (bottom subplots) on (a and d) time to reach 60% monomer conversion, (b and e) dispersity, and (c and f) livingness (fraction of dormant chains) at a monomer conversion of 60%; the filled red squares represent the same simulations as in Fig. 6 for the top and bottom subplots. Regime demarcations are only shown for the case of 20% solids content. | ||
For both nitroxides, decreasing the solids content (blue rhombus symbols in Fig. 10) results in a less controlled polymerization with a higher livingness. For all dp the NMP time decreases (Fig. 10a and d) at the expense of a higher dispersity (Fig. 10b and e) and to the benefit of a higher livingness (Fig. 10c and f). By decreasing the solids content, the volume fraction of the aqueous phase increases, leading to a lower free nitroxide concentration in the organic phase. This is caused by the lower number of moles of R0X at the start in the case of a lower solids content (since R0X is only present in the organic phase), leading to a lower free nitroxide concentration in both the aqueous and organic phase, as shown in Fig. S.20 in the ESI.† This leads to higher R0 and ECR concentrations in the organic phase (Fig. S.11 of the ESI†), which results in a faster polymerization (thus lower NMP times), higher dispersities (due to slower NMP initiation on a monomer conversion basis), and higher livingness values (due to lower NMP times). Specifically, Fig. 10b (SG1) shows that at the lowest solids content of 10%, the dispersity reaches its highest value of ca. 1.95 at a dp of ca. 65 nm in kinetic regime 5, which is dominated by the confined space effect on deactivation of R0. Similarly, as depicted in Fig. 10e (TEMPO), the dispersity reaches the highest value of ca. 1.8 at a higher dp of ca. 80 nm. Improved molecular control can be obtained by working at a higher solids content of 30%. Notably, such a solids content can still yield a favorable livingness in kinetic regimes 5–7 (Fig. 10c and f; vertical arrow).
For each solids content, the dp boundaries for the seven kinetic regimes increase to larger values when using BST instead of MAMA-SG1 as NMP initiator, again highlighting the inherently lower NMP equilibrium coefficient involving TEMPO. For example, Fig. 10a shows that for MAMA-SG1 kinetic regime 4 ranges between 80 nm and 120 nm, whereas in NMP with a solids content of 30%, it ranges only between ca. 100 nm and 150 nm.
For each nitroxide, an increase in solids content from 10% (blue) to 30% (yellow) also results in a shift of the regime boundaries to larger dp values in kinetic regime 3–7, which can be explained by the changing exit probabilities of R0 and X, as shown in Fig. S.11 of the ESI†. Additionally, in the NMP time plots (Fig. 10a and d), kinetic regime 1 occurs at dp above 200 nm for the lowest solids content of 10% (blue) in NMP initiated by both MAMA-SG1 and BST, whereas it only occurs at dp above 270 nm for the highest solids content of 30% (yellow). This indicates that when the solids content is reduced, NMP in miniemulsion achieves the pseudo-bulk condition at a lower dp, because (dominant) compartmentalization and phase transfer phenomena take place at smaller dp values.
Overall, the predictions in the present subsection show that a higher (more industrially relevant) solids content of 30% as opposed to 20% is feasible, due to an acceptable dispersity and high livingness for a moderate reaction time. This is especially true for dp values below 120 nm for NMP initiated by MAMA-SG1 and smaller than 150 nm for NMP initiated by BST.
3.4. Variation of polymerization temperature
Consistent with experimental studies, the MAMA-SG1-initiated13,89 NMP has been carried out at 385 K and the BST15,85 initiated NMP at 408 K. One can wonder if these two polymerization temperatures can be changed, e.g. switched around, to find a more suitable temperature. Hence, simulations at 385 and 408 K are performed for both NMPs in Fig. 11, in which the top row pertains to MAMA-SG1 and the bottom row to BST. For SG1 (top row), the results for the reference 385 K with a ΓX value of 144.6 are depicted using red squares, consistent with Fig. 6, while those for the higher temperature of 408 K are shown using brown triangles, employing an experimentally determined ΓX value of 168.2 (Fig. 3). Similarly, for NMP initiated by BST (bottom row), the simulation results at 408 K correspond to a ΓX value of 143.4 and are the same as the simulation results in Fig. 6 (represented by red squares), whereas those at 385 K are indicated using blue triangles, using a ΓX value of 129.5, determined experimentally at that temperature (Fig. 3).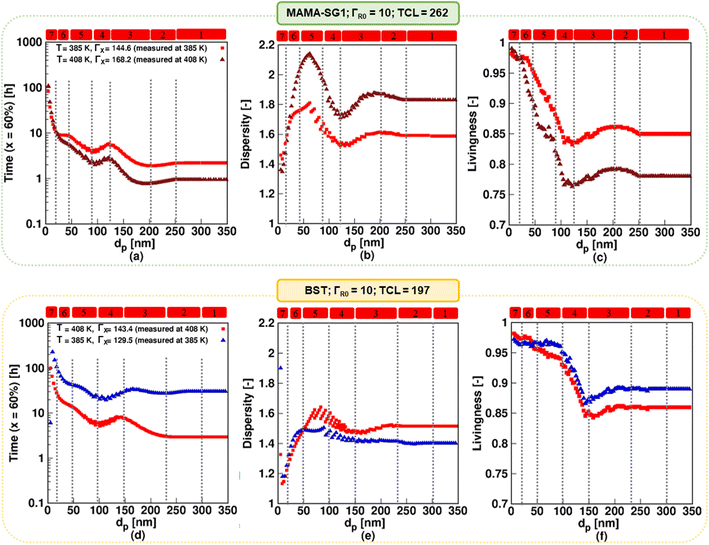 | ||
| Fig. 11 Top subplots display the impact of increasing the temperature to 408 K in NMP of nBuA (realistic model) initiated by MAMA-SG1 with a measured SG1 partitioning coefficient ΓX = 168 at 408 K (filled brown triangles); the reference case with ΓX = 144 and a reaction temperature of 385 K is also depicted by the filled red squares (same as in Fig. 6). The bottom subplots display the impact of reducing the temperature in NMP of nBuA initiated by BST to 385 K with a measured TEMPO partitioning coefficient ΓX = 129.5 at 385 K (filled blue triangles); the filled red squares (the same as in Fig. 6) shows the reference case with ΓX = 143.5 and reaction temperature of 408 K. (a and d) Time to reach 60% monomer conversion; (b and e) dispersity and (c and f) livingness at a monomer conversion of 60%. | ||
Fig. 11a–c (SG1) reveals that a higher reaction temperature accelerates the NMP across all dp but the control over chain length and livingness decreases. The dispersity, for instance, increases at 408 K (brown) from 1.7 at 35 nm to 2.1 at 60 nm, whereas at 385 K (red) it rises from 1.6 at 35 nm to only 1.75 at 60 nm. Moreover, the livingness decreases from 0.98 at 35 nm to 0.85 at 60 nm for a temperature of 408 K (brown), while at 385 K (red) it decreases slightly from 0.98 at 35 nm to 0.93 at 60 nm. Similarly, Fig. 11d–f (TEMPO) highlights that lowering the reaction temperature results in improved control over chain length and livingness but at the expense of longer NMP reaction time.
This control over chain length and dispersity in particular is affected by how fast the NMP initiator is depleted on a monomer conversion basis. Fig. S.13b of the ESI† shows that at a low temperature of 385 K, the NMP initiator (BST) is fully converted at ca. 30% monomer conversion for a large dp of 150 nm. In contrast, at a higher temperature of 408 K for the same average dp, the NMP initiator is present inside the particles up to ca. 55% monomer conversion. This confirms that the faster NMP initiation on a monomer conversion basis contributes to the dispersity being lower at a lower temperature at a dp of 150 nm.
As shown in Fig. S.14 in the ESI,† the free SG1 and NMP initiator radical exit probabilities decrease with a rising temperature for all dp. Consistently, the ECRs and R0 concentrations increase with increasing temperature, as shown in Fig. S.14c and d of the ESI.† In contrast, switching only the ΓX values (as opposed to also switching the reaction temperatures) has no detectable impact on either of the two NMPs, as shown in Fig. S.12 of the ESI† (top row; ΓX value of 144.6 instead of 168.2 at 408 K) and Fig. S.12 of the ESI† (bottom row; ΓX value of 143.4 instead of 129.5 at 385 K). Hence, temperature dependencies affect chemical reactivities more than phase transfer. However, note that the use of ΓX values at room temperature does induce a large error, as previously shown in Fig. 9.
Overall, the experimentalist must strike a compromise with respect to the reaction temperature and molecular property design. For instance, the temperature must be high to achieve a low reaction time for NMP initiated by BST, at the expense of a higher dispersity and lower livingness. In this balance of NMP characteristics, the selected temperatures taken from the original experimental works were optimized towards molecular control rather than reducing reaction time.
3.5. Varying targeted chain length
In this section, we explore the impact of TCL on the NMP rate, dispersity, and livingness for the realistic model. TCL values ranging from 50 to 1000 are considered, with 1000 being the maximum value reported.90,91 The higher TCLs are achieved using smaller initial amounts of R0X, which is advantageous from an industrial perspective, primarily driven by the high cost of R0X. In contrast, for lower TCLs, a higher proportion of oligomeric polymer chains result, likely resulting in weaker material properties, which is less desirable from an industrial perspective.Fig. 12a and d show dp variations between 5 and 350 nm using MAMA-SG1 (top subplots) and BST (bottom subplots) and illustrate that the NMP slows down if TCL increases from 50 (gray filled circle) to 1000 (yellow filled rhombus). A higher TCL results in lower radical concentrations, leading to a slower NMP. This is in line with the findings of Toloza Porras et al.,92 who noted that the reaction time of bulk ATRP of nBuA increases with the TCL.
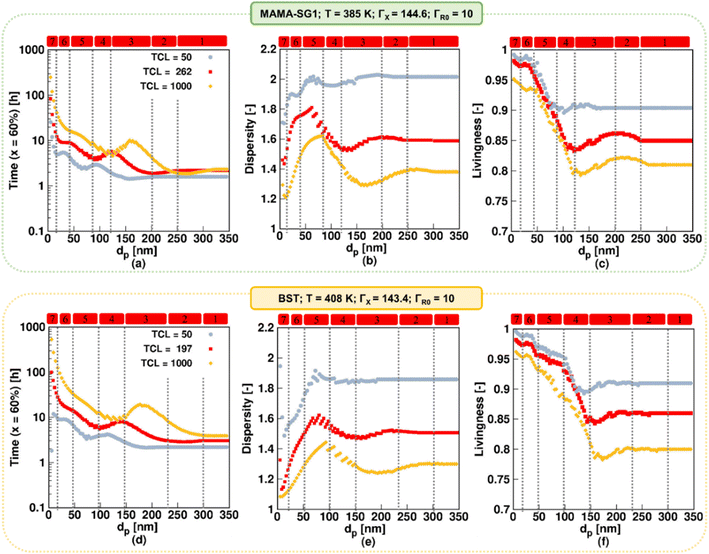 | ||
| Fig. 12 The impact of changing TCL (TCL = 50; filled gray circle and TCL = 1000; filled yellow rhombus) in NMP of nBuA (realistic model) initiated by MAMA-SG1 at 385 K (top subplots) and initiated by BST at 408 K (bottom subplots) on (a and d) time to reach 60% monomer conversion, (b and e) dispersity, and (c and f) livingness (fraction of dormant chains) at a monomer conversion of 60%; the filled red squares are the same as in Fig. 6 for the top and bottom subplots. | ||
Fig. 12b (SG1) and 12e (TEMPO) show that dispersity is lower when TCL is higher, regardless of dp. For example, for SG1, the maximum dispersity value spikes to ca. 2 for dp = 60 nm at the lowest TCL and decreases to a value close to 1.6 at dp = 90 nm for the highest TCL (Fig. 12b). This is because the NMP initiator is consumed faster on a monomer conversion basis. At a high TCL, the NMP initiator is already fully converted at ca. 20% monomer conversion, whereas for a lower TCL of 50 the NMP initiator is still present at 60% monomer conversion (Fig. S.15 of the ESI†). Despite this, an inverse relationship between livingness and TCL exists, which is shown in Fig. 12c and f. A larger TCL requires a longer time to reach monomer conversion of 60%, and in this longer timeframe more termination will occur.
Building upon the prior discussion on the significant impact of TCL on NMP rate, dispersity and livingness, we now focus on how TCL influences the relevance of the seven kinetic regimes. An increase in TCL leads to a notable shift in the maximum and minimum values in the time plots, dispersity, and livingness in Fig. 12, causing them to shift horizontally to a higher dp. For example, as depicted in Fig. 12a, in the kinetic regime 2 for NMP initiated by MAMA-SG1, a pronounced segregation effect is observed at exceptionally high dp values, particularly when the TCL is at its maximum of 1000, ranging between 260 and 320 nm compared to 200 < dp < 250 nm at the TCL of 262. This phenomenon can be attributed to the reduced concentrations of ECRs and R0 at a TCL of 1000, aligning with the research conducted by Bentein et al.63 Moving to kinetic regimes 3 and 4, where R0 and X exit are particularly significant, the exit probabilities shown in Fig. S.16a and e† (X species) and Fig. S.16b and f† (R0 species) indicate that the associated exit probabilities increase with increasing TCL. As a result, the intensity of deceleration and acceleration in the NMP rate is more pronounced when the TCL is set to 1000. Notably, at a dp of 120 nm in NMP initiated by MAMA-SG1 and of 150 nm in NMP initiated by BST, the NMP time for the TCL of 1000 (yellow rhombus) equals that of the reference TCL (red).
To conclude, the TCL has a significant impact on how dp affects the NMP, specifically at lower dp. When dp exceeds 120 nm for SG1 and 150 nm for TEMPO, increasing the TCL results in a slightly increased influence of dp on reaction time, dispersity, and livingness. However, at smaller dp values, increasing the TCL results in a more pronounced increase of the influence of dp on reaction time, dispersity, and livingness. Across the entire dp range, increasing the TCL leads to stronger fluctuations in the NMP polymer properties. This highlights the crucial role of carefully adjusting dp to achieve the desired results, particularly when using higher TCL, which is advantageous from an industrial perspective.
3.6. Guidelines for optimization
The previous subsections have highlighted that the nitroxide type, temperature, solids content and TCL are important process variables. The most important individual effects of these process variables are summarized in Fig. 13, but they can be combined towards an overarching interpretation. The observed fluctuations in reaction time, dispersity, and livingness in different kinetic regimes, especially notable in particles with (average) diameters below 120 nm for NMP initiated by MAMA-SG1 and below 150 nm for NMP initiated by BST, underscore the significance of fine tuning dp for optimal results in NMP in miniemulsion.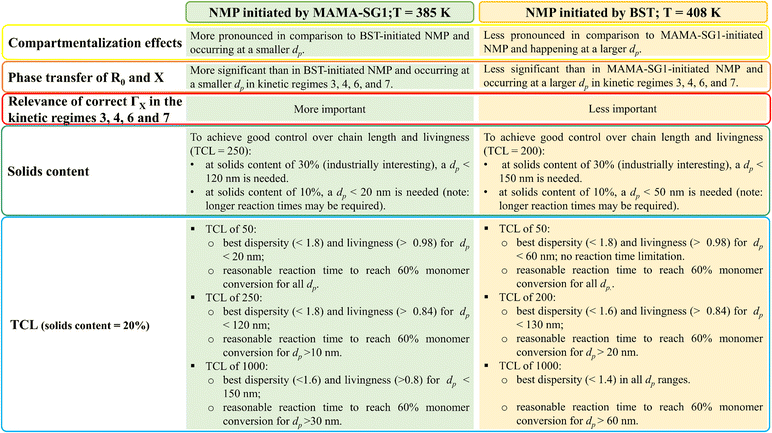 | ||
| Fig. 13 Guidelines for optimization by summarizing the effect of process conditions according to the realistic model, differentiating between two NMP initiators, as covered in Fig. 6–12; the TCL of 250 corresponds to approximately 262 (reference case in this work) for MAMA-SG1-initiated NMP, while the TCL of 200 corresponds to around 197 (reference case in this work) for BST-initiated NMP. | ||
More in detail, good molecular control and livingness within a reasonable reaction time can be achieved by maintaining a dp range between 10 nm and 120 nm in NMP initiated by MAMA-SG1. Selecting a dp within this range is particularly important when opting for a higher solids content (e.g. 30%) or TCL (e.g. 1000), since increasing the solids content and TCL makes it more difficult to achieve a high livingness. For NMP initiated by BST, where the lower NMP equilibrium coefficient comes into play, it becomes feasible to operate within a dp range shifted to larger diameters, specifically from 30 to 150 nm. Within this range, good control and livingness within a reasonable reaction time can be achieved, even when employing a high TCL and a solids content of 30%. These findings also highlight the relevance of microfluidic mixing devices to enable the synthesis of nanoparticles with a lower dp. Especially in applications in which achieving good molecular control and livingness takes precedence over low reaction time, e.g. in biomedical applications, one could for example even aim at dp values below the 30 nm boundary put forward for BST-initiated NMP.
4. Conclusions
This modeling study presents a systematic investigation of the NMP of nBuA mediated by SG1 and TEMPO in miniemulsion, employing an advanced deterministic population balance model featuring experimentally determined partitioning coefficients of both nitroxides at the actual polymerization temperature and accounting for important side reactions involving MCRs such as backbiting and β-scission.The modeling outputs of both SG1- and TEMPO-mediated polymerizations have been benchmarked against experimental data. The two mediating agents resulted in different model predictions of the NMP kinetics and control over molecular properties, but both predicted seven kinetic regimes as a function of dp. More importantly, our findings provide valuable insights into the complex interplay between reaction conditions and thermodynamics and kinetics of phase partitioning. The significance of phase transfer is evident, particularly in kinetic regime 3 and 4 with dp ranging from 80 to 200 nm (SG1-mediated NMP) and 100 to 230 nm (TEMPO-mediated NMP). Neglecting this phase transfer leads to notable discrepancies between the idealized and realistic model, underscoring the importance of describing phase transfer for accurate model predictions, especially in the specified dp range.
Additionally, we have demonstrated that reaction conditions such as solids content, temperature, and TCL can significantly influence the exit probability of both nitroxide and NMP initiator (R0) radicals. Our research thus advances the state of the art by modeling the interaction of phase transfer with the segregation and confined space effect for the two most important nitroxides and various reaction conditions, to accurately predict complicated regime behavior featuring an oscillatory NMP rate as a function of dp.
A sensitivity analysis revealed that the literature polymerization temperatures are suitable for NMP of both nitroxides but not designed to facilitate a fast NMP nor extrapolatable to a wide range of TCLs. In general, robust models are needed to predict the optimal temperature for the chosen NMP initiator, in which the largest optimization factors are the kinetic parameters for the (de)activation equilibrium rather than the phase transfer of the small radicals, with the important caveat that one should never use partitioning coefficients measured at room temperature in models for NMP at elevated temperature.
Furthermore, when designing the NMP of nBuA in miniemulsion, the specific dp boundaries of 120 nm for SG1-mediated NMP and 150 nm for TEMPO-mediated NMP are crucial. By adhering to these upper dp boundaries, one can effectively optimize the reaction time, dispersity, and livingness, leading to enhanced performance of poly (n-butyl acrylate) latexes with higher solids content and higher TCL, which are particularly beneficial for industrial applications.
Overall, the kinetic model can be used to determine the ideal average particle size and reaction conditions (e.g. temperature and the solids content) to design advanced materials on a laboratory scale in view of industrialization. The results present new insights into the NMP of nBuA in miniemulsion, which can be further explored for different monomers and mediating agents. The effect of a polydisperse (initial) droplet size distribution can also be investigated in future work.
Conflicts of interest
There are no conflicts to declare.Acknowledgements
P. H. M. V. S. acknowledges Ghent University for a Special Research Fund Grant. D. R. D. acknowledges financial support from the Fund for Scientific Research Flanders (FWO; G.0H52.16N). D. R. D. and Y. W. M. acknowledge financial support from the MSCA Doctoral Network CINEMA (grant number: 101072732). Y. W. M. also acknowledges support from the FWO through a senior postdoctoral grant (project number: 12B3Y24N).References
- N. Corrigan, K. Jung, G. Moad, C. J. Hawker, K. Matyjaszewski and C. Boyer, Prog. Polym. Sci., 2020, 111, 101311 CrossRef CAS.
- K. Parkatzidis, H. S. Wang, N. P. Truong and A. Anastasaki, Chem, 2020, 6, 1575–1588 CAS.
- Y.-N. Zhou, J.-J. Li, T.-T. Wang, Y.-Y. Wu and Z.-H. Luo, Prog. Polym. Sci., 2022, 101555 CrossRef CAS.
- M. F. Cunningham, Prog. Polym. Sci., 2008, 33, 365–398 CrossRef CAS.
- M. J. Monteiro and M. F. Cunningham, Macromolecules, 2012, 45, 4939–4957 CrossRef CAS.
- P. B. Zetterlund, S. C. Thickett, S. Perrier, E. Bourgeat-Lami and M. Lansalot, Chem. Rev., 2015, 115, 9745–9800 CrossRef CAS PubMed.
- P. A. Lovell and F. J. Schork, Biomacromolecules, 2020, 21, 4396–4441 CrossRef CAS.
- M. Edeleva, G. Audran, S. Marque and E. Bagryanskaya, Materials, 2019, 12, 688 CrossRef CAS PubMed.
- G. Audran, E. Bagryanskaya, M. Edeleva, S. R. Marque, D. Parkhomenko, E. Tretyakov and S. Zhivetyeva, Aust. J. Chem., 2018, 71, 334–340 CrossRef CAS.
- G. Audran, E. G. Bagryanskaya, P. Brémond, M. V. Edeleva, S. R. Marque, D. A. Parkhomenko, O. Y. Rogozhnikova, V. M. Tormyshev, E. V. Tretyakov and D. V. Trukhin, Polym. Chem., 2016, 7, 6490–6499 RSC.
- M. Edeleva, D. Morozov, D. Parkhomenko, Y. Polienko, A. Iurchenkova, I. Kirilyuk and E. Bagryanskaya, Chem. Commun., 2019, 55, 190–193 RSC.
- K. De Smit, Y. W. Marien, M. Edeleva, P. H. Van Steenberge and D. R. D'hooge, Ind. Eng. Chem. Res., 2020, 59, 22422–22439 CrossRef CAS.
- J. Nicolas, B. Charleux, O. Guerret and S. Magnet, Macromolecules, 2004, 37, 4453–4463 CrossRef CAS.
- J. Nicolas, B. Charleux and S. Magnet, J. Polym. Sci., Part A: Polym. Chem., 2006, 44, 4142–4153 CrossRef CAS.
- J. W. Ma, J. A. Smith, K. B. McAuley, M. F. Cunningham, B. Keoshkerian and M. K. Georges, Chem. Eng. Sci., 2003, 58, 1163–1176 CrossRef CAS.
- S. K. Fierens, D. R. D'hooge, P. H. Van Steenberge, M.-F. Reyniers and G. B. Marin, Chem. Eng. J., 2015, 278, 407–420 CrossRef CAS.
- A. R. Szkurhan and M. K. Georges, Macromolecules, 2004, 37, 4776–4782 CrossRef CAS.
- M. Edeleva, S. R. Marque, D. Bertin, D. Gigmes, Y. Guillaneuf, S. V. Morozov and E. G. Bagryanskaya, J. Polym. Sci., Part A: Polym. Chem., 2008, 46, 6828–6842 CrossRef CAS.
- M. Edeleva, S. R. Marque, K. Kabytaev, Y. Guillaneuf, D. Gigmes and E. Bagryanskaya, J. Polym. Sci., Part A: Polym. Chem., 2013, 51, 1323–1336 CrossRef CAS.
- M. Edeleva, Y. W. Marien, P. H. Van Steenberge and D. R. D'hooge, Polym. Chem., 2021, 12, 2095–2114 RSC.
- N. Ballard and J. M. Asua, Prog. Polym. Sci., 2018, 79, 40–60 CrossRef CAS.
- M. Drache, M. Stehle, J. Mätzig, K. Brandl, M. Jungbluth, J. C. Namyslo, A. Schmidt and S. Beuermann, Polym. Chem., 2019, 10, 1956–1967 RSC.
- A. N. Nikitin, R. A. Hutchinson, W. Wang, G. A. Kalfas, J. R. Richards and C. Bruni, Macromol. React. Eng., 2010, 4, 691–706 CrossRef CAS.
- A. B. Vir, Y. Marien, P. H. Van Steenberge, C. Barner-Kowollik, M.-F. Reyniers, G. B. Marin and D. R. D'hooge, React. Chem. Eng., 2018, 3, 807–815 RSC.
- M. Soroush and A. M. Rappe, in Computational Quantum Chemistry, Elsevier, 2019, pp. 135–193 Search PubMed.
- W. Wang, A. N. Nikitin and R. A. Hutchinson, Macromol. Rapid Commun., 2009, 30, 2022–2027 CrossRef CAS PubMed.
- A. B. Vir, Y. W. Marien, P. H. Van Steenberge, C. Barner-Kowollik, M.-F. Reyniers, G. B. Marin and D. R. D'hooge, Polym. Chem., 2019, 10, 4116–4125 RSC.
- M. Edeleva, P. H. Van Steenberge and D. R. D'hooge, Ind. Eng. Chem. Res., 2021, 60, 16981–16992 CrossRef CAS.
- F. Chauvin, P.-E. Dufils, D. Gigmes, Y. Guillaneuf, S. R. Marque, P. Tordo and D. Bertin, Macromolecules, 2006, 39, 5238–5250 CrossRef CAS.
- C. Dire, B. Charleux, S. Magnet and L. Couvreur, Macromolecules, 2007, 40, 1897–1903 CrossRef CAS.
- K. Matyjaszewski, Comparison and classification of controlled/living radical polymerizations, ACS Publications, 2000 Search PubMed.
- V. Sciannamea, R. Jerome and C. Detrembleur, Chem. Rev., 2008, 108, 1104–1126 CrossRef CAS PubMed.
- P. B. Zetterlund, Macromol. React. Eng., 2010, 4, 663–671 CrossRef CAS.
- G. S. Ananchenko, M. Souaille, H. Fischer, C. Le Mercier and P. Tordo, J. Polym. Sci., Part A: Polym. Chem., 2002, 40, 3264–3283 CrossRef CAS.
- P. B. Zetterlund and D. R. D'hooge, Macromolecules, 2019, 52, 7963–7976 CrossRef CAS.
- M. F. Cunningham, Prog. Polym. Sci., 2002, 27, 1039–1067 CrossRef CAS.
- Y. W. Marien, P. H. Van Steenberge, D. R. D'hooge and G. B. Marin, Macromolecules, 2019, 52, 1408–1423 CrossRef CAS.
- Y. W. Marien, P. H. Van Steenberge, A. Pich and D. R. D'hooge, React. Chem. Eng., 2019, 4, 1935–1947 RSC.
- N. Ballard, M. Aguirre, A. Simula, J. R. Leiza, S. van Es and J. M. Asua, Polym. Chem., 2017, 8, 1628–1635 RSC.
- C. Farcet, J. Belleney, B. Charleux and R. Pirri, Macromolecules, 2002, 35, 4912–4918 CrossRef CAS.
- M. F. Cunningham, C. R. Chim., 2003, 6, 1351–1374 CrossRef CAS.
- A. M. Medeiros, E. Bourgeat-Lami and T. F. McKenna, Polymer, 2020, 12, 1476 CAS.
- K. Ouzineb, C. Graillat and T. McKenna, J. Appl. Polym. Sci., 2004, 91, 115–124 CrossRef CAS.
- U. El-Jaby, M. Cunningham, T. Enright and T. F. McKenna, Macromol. React. Eng., 2008, 2, 350–360 CrossRef CAS.
- U. El-Jaby, M. Cunningham and T. F. McKenna, Macromol. Rapid Commun., 2010, 31, 558–562 CrossRef CAS PubMed.
- M. B. Casey, E. D. Sudol and M. S. El-Aasser, J. Polym. Sci., Part A: Polym. Chem., 2014, 52, 1529–1544 CrossRef CAS.
- M. S. El-Aasser and E. D. Sudol, JCT Res., 2004, 1, 21–31 Search PubMed.
- P. B. Zetterlund, T. Nakamura and M. Okubo, Macromolecules, 2007, 40, 8663–8672 CrossRef CAS.
- P. B. Zetterlund, Polym. Chem., 2011, 2, 534–549 RSC.
- P. B. Zetterlund and M. Okubo, Macromolecules, 2006, 39, 8959–8967 CrossRef CAS.
- P. B. Zetterlund and M. Okubo, Macromol. Theory Simul., 2007, 16, 221–226 CrossRef CAS.
- P. B. Zetterlund, Y. Kagawa and M. Okubo, Macromolecules, 2009, 42, 2488–2496 CrossRef CAS.
- M. E. Thomson and M. F. Cunningham, Macromolecules, 2010, 43, 2772–2779 CrossRef CAS.
- R. W. Simms and M. F. Cunningham, Macromolecules, 2008, 41, 5148–5155 CrossRef CAS.
- E. Zeinali, Y. W. Marien, S. R. George, M. F. Cunningham, D. R. D'hooge and P. H. Van Steenberge, Chem. Eng. J., 2023, 144162 CrossRef CAS.
- P. B. Zetterlund, Y. Kagawa and M. Okubo, Chem. Rev., 2008, 108, 3747–3794 CrossRef CAS PubMed.
- Y. Kagawa, P. B. Zetterlund, H. Minami and M. Okubo, Macromol. Theory Simul., 2006, 15, 608–613 CrossRef CAS.
- H. Tobita, Macromol. Theory Simul., 2007, 16, 810–823 CrossRef CAS.
- H. Tobita, Macromol. React. Eng., 2010, 4, 643–662 CrossRef CAS.
- H. Tobita, Macromol. Theory Simul., 2011, 20, 179–190 CrossRef CAS.
- P. B. Zetterlund and M. Okubo, Macromol. Theory Simul., 2009, 18, 277–286 CrossRef CAS.
- H. Maehata, C. Buragina, M. Cunningham and B. Keoshkerian, Macromolecules, 2007, 40, 7126–7131 CrossRef CAS.
- L. Bentein, D. D'hooge, M.-F. Reyniers and G. Marin, Polymer, 2012, 53, 681–693 CrossRef CAS.
- P. H. Van Steenberge, D. R. D'hooge, M.-F. o. Reyniers, G. B. Marin and M. F. Cunningham, Macromolecules, 2014, 47, 7732–7741 CrossRef CAS.
- N. M. Ahmad, B. Charleux, C. Farcet, C. J. Ferguson, S. G. Gaynor, B. S. Hawkett, F. Heatley, B. Klumperman, D. Konkolewicz, P. A. Lovell, K. Matyjaszewski and R. Venkatesh, Macromol. Rapid Commun., 2009, 30, 2002–2021 CrossRef CAS PubMed.
- D. Konkolewicz, S. Sosnowski, D. R. D'hooge, R. Szymanski, M.-F. Reyniers, G. B. Marin and K. Matyjaszewski, Macromolecules, 2011, 44, 8361–8373 CrossRef CAS.
- D. Konkolewicz, D. R. D'hooge, S. Sosnowski, R. Szymanski, M.-F. Reyniers, G. B. Marin and K. Matyjaszewski, in Progress in Controlled Radical Polymerization: Mechanisms and Techniques, ACS Publications, 2012, pp. 145–169 Search PubMed.
- D. Konkolewicz, P. Krys and K. Matyjaszewski, Acc. Chem. Res., 2014, 47, 3028–3036 CrossRef CAS PubMed.
- S. Marque, C. Le Mercier, P. Tordo and H. Fischer, Macromolecules, 2000, 33, 4403–4410 CrossRef CAS.
- D. Bertin, D. Gigmes, S. R. Marque and P. Tordo, Macromolecules, 2005, 38, 2638–2650 CrossRef CAS.
- J. Sobek, R. Martschke and H. Fischer, J. Am. Chem. Soc., 2001, 123, 2849–2857 CrossRef CAS PubMed.
- J. M. Asua, S. Beuermann, M. Buback, P. Castignolles, B. Charleux, R. G. Gilbert, R. A. Hutchinson, J. R. Leiza, A. N. Nikitin and J. P. Vairon, Macromol. Chem. Phys., 2004, 205, 2151–2160 CrossRef CAS.
- S. Maeder and R. G. Gilbert, Macromolecules, 1998, 31, 4410–4418 CrossRef CAS.
- P. Lacroix-Desmazes, J.-F. Lutz, F. Chauvin, R. Severac and B. Boutevin, Macromolecules, 2001, 34, 8866–8871 CrossRef CAS.
- F. Aldabbagh, P. B. Zetterlund and M. Okubo, Eur. Polym. J., 2008, 44, 4037–4046 CrossRef CAS.
- C. Barner-Kowollik and G. T. Russell, Prog. Polym. Sci., 2009, 34, 1211–1259 CrossRef CAS.
- P. Derboven, D. R. D'hooge, M.-F. Reyniers, G. B. Marin and C. Barner-Kowollik, Macromolecules, 2015, 48, 492–501 CrossRef CAS.
- J. Barth, M. Buback, P. Hesse and T. Sergeeva, Macromolecules, 2010, 43, 4023–4031 CrossRef CAS.
- A. Butté, G. Storti and M. Morbidelli, Macromol. Theory Simul., 2002, 11, 37–52 CrossRef.
- D. Grant, M. Mehdizadeh, A.-L. Chow and J. Fairbrother, Int. J. Pharm., 1984, 18, 25–38 CrossRef CAS.
- R. Krug, W. Hunter and R. Grieger, J. Phys. Chem., 1976, 80, 2335–2341 CrossRef CAS.
- J. H. van't Hoff, Recl. Trav. Chim. Pays-Bas, 1885, 4, 424–427 CrossRef.
- D. J. Devlaminck, P. H. Van Steenberge, M.-F. Reyniers and D. R. D'hooge, Macromolecules, 2018, 51, 9442–9461 CrossRef CAS.
- Y. Shang and G. R. Shan, AIChE J., 2012, 58, 3135–3143 CrossRef CAS.
- M. K. Georges, J. L. Lukkarila and A. R. Szkurhan, Macromolecules, 2004, 37, 1297–1303 CrossRef CAS.
- Y. Guo and P. B. Zetterlund, Macromol. Rapid Commun., 2011, 32, 1669–1675 CrossRef CAS PubMed.
- M. Li, K. Min and K. Matyjaszewski, Macromolecules, 2004, 37, 2106–2112 CrossRef CAS.
- B. Charleux, Macromolecules, 2000, 33, 5358–5365 CrossRef CAS.
- R. Mchale, F. Aldabbagh and P. B. Zetterlund, J. Polym. Sci., Part A: Polym. Chem., 2007, 45, 2194–2203 CrossRef CAS.
- Y. Kwak, A. J. Magenau and K. Matyjaszewski, Macromolecules, 2011, 44, 811–819 CrossRef CAS.
- K. Matyjaszewski and T. P. Davis, Handbook of radical polymerization, 2002 Search PubMed.
- C. Toloza Porras, D. R. D'hooge, M. F. Reyniers and G. B. Marin, Macromol. Theory Simul., 2013, 22, 136–149 CrossRef CAS.
Footnote |
| † Electronic supplementary information (ESI) available. See DOI: https://doi.org/10.1039/d3re00656e |
| This journal is © The Royal Society of Chemistry 2024 |

