 Open Access Article
Creative Commons Attribution 3.0 Unported Licence
Development of an open-source flow-through cyclic voltammetry cell for real-time inline reaction analytics†
Eduardo
Rial-Rodríguez
ab,
Jason D.
Williams
 ab,
Hans-Michael
Eggenweiler
c,
Thomas
Fuchss
 c,
Alena
Sommer
c,
C. Oliver
Kappe
c,
Alena
Sommer
c,
C. Oliver
Kappe
 ab and
David
Cantillo
 *ab
*ab
aInstitute of Chemistry, NAWI Graz, University of Graz, Heinrichstrasse 28, 8010 Graz, Austria. E-mail: david.cantillo@uni-graz.at
bCenter for Continuous Flow Synthesis and Processing (CCFLOW), Research Center Pharmaceutical Engineering GmbH (RCPE), Inffeldgasse 13, 8010 Graz, Austria
cMedicinal Chemistry and Drug Design, Merck Healthcare KGaA, Frankfurter Strasse 250, 64293 Darmstadt, Germany
First published on 18th November 2023
Abstract
Cyclic voltammetry is a powerful and versatile analytical technique for the quantitative analysis of organic and inorganic compounds in solution. Despite the recent advances in process analytical technologies for flow processing, electroanalytical techniques have received only minimal attention. Herein we present the design and development of an open-source flow-through voltammetry cell and its performance for the inline monitoring of electrochemical reactions.
Over the past few years, the development of process analytical technologies (PAT) suitable for the monitoring of continuous flow processes has become increasingly important.1 The combination of PAT and flow reactors enables the generation of real-time reaction data which, in turn, provides the basis for chemical process automation, including self-optimizing reactions and automated process control.2 These data-rich strategies to improve the performance of manufacturing processes are the cornerstone for the implementation of industry 4.0 in the chemical and pharmaceutical sector.3,4
A wide range of PAT tools for the inline, online or atline monitoring of chemical transformations in flow mode have been reported during the past two decades, including nuclear magnetic resonance (NMR), infrared (IR), Raman and UV-vis spectroscopy,5 as well as chromatographic instruments such as online/atline HPLC or UHPLC.6 Simpler and more cost-effective PAT tools, based on flow-through conductimetry, have also been applied for continuous flow processes,7 despite typically providing less detailed information about the system.
Electroanalytical methods comprise a series of techniques based on the measurement of electrochemically-generated currents or potentials from redox active species in solution.8 These analytical methods are highly versatile and very sensitive, with sufficient resolution to detect analytes in the micromolar concentration range. One of the best-known electroanalytical methods is cyclic voltammetry (CV). It provides both qualitative and quantitative information about the electrochemical properties of compounds in solution.9 It can be used to provide evidence for redox mechanisms,10 as well as data on reaction kinetics or equilibria.11 From the reaction monitoring standpoint, CV is a powerful and straightforward technique. The concentration of a compound in solution can be readily determined from the current generated during the potential scan.12 Indeed, the peak current response is directly proportional to concentration of the compound following the Randles–Ševčík equation (eqn (1)),
 | (1) |
Despite the capabilities of CV and other electroanalytical techniques, reports on flow cells for the inline analysis of chemical reactions are rare. Flow-through cells, in which a solution containing the analyte passes through a channel, have been reported, although they are typically used for injection analysis13 or electrode calibration.14 They are typically fabricated using custom designs that require machining techniques. Jensen and coworkers have recently described a microliter-volume CV cell for the monitoring of electrochemical transformations.15 However, the method used a stop-flow mechanism that collects samples of reaction mixture and discards them after analysis “atline”. Thus, it is not considered an inline monitoring technique.
Electrochemical reactions are ideal for demonstrating the implementation of electroanalytical PAT tools. Electrochemical transformations most often involve changes in the redox state of the organic compounds. For example, in an anodic oxidation, the reaction product has an oxidation state higher than the starting material, while the opposite occurs during cathodic reductions. This feature facilitates selective analysis of an individual reaction component using CV or other electroanalytical techniques. Given the recent resurgence in electrochemical methods,16 particularly for the green synthesis of organic compounds,17 progress in dedicated PAT tools is highly desirable.
Herein, we present a microliter-volume flow cell for inline cyclic voltammetry analysis. The cell is made of simple commercially available fluidic components. Thus, it can be easily assembled from inexpensive parts without the need for machining or 3D-printing techniques. The cell is powered by a low cost, open-source potentiostat, enabling easy customization and automation of the analyses. The cell performance for inline monitoring has been assessed for a model electrochemical alcohol oxidation, providing good linear responses for current against alcohol concentration in reaction mixtures. As a result, the capabilities of inline CV could be demonstrated as a convenient technique to enable reaction optimization and monitoring.
The design concept of the flow cell was elaborated with two aims in mind: (1) the device should be assembled from commercially available parts to ensure reproducibility and wide availability of the technology and (2) the system should be modular, enabling facile exchange of the electrodes and configuration. To fulfil these goals, the cell was constructed using commercially available fluidic fittings that are typically available in flow chemistry laboratories. In particular, a 5-port connector was utilized as the body of the flow cell (Fig. 1). This strategy has the advantage that the electrodes, made of standard size rods (1 mm diameter), can be assembled in flat-bottom fluidic fittings and easily inserted in the cell. For a 3-electrode cell arrangement, 3 of the fluidic ports were used for this purpose, while the two remaining ports were used as inlet and outlet for the solution or reaction mixture (additional pictures and a comprehensive list of components are collected in the ESI†). As fluidic fittings can be easily attached or removed from the port, electrode materials can be readily exchanged or removed for polishing if needed.
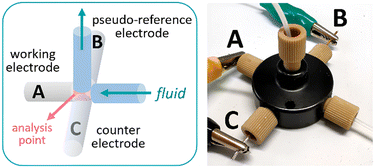 | ||
| Fig. 1 Schematic view of the flow cell for cyclic voltammetry (left) and photograph of the device (right). A: Pt wire; B: Ag wire; C: Pt wire. | ||
The cell can be assembled with a choice of two working electrodes (WEs), made of either glassy carbon or platinum. As counter electrode, platinum was selected as material. A pseudo-reference electrode consisting of a silver wire was also installed. Pseudo-reference electrodes are simple wires in contact with the solution.18 They are easy to set up compared to standard reference electrodes but, as they do not provide a constant, known potential, they need to be calibrated. Ferrocene was used as a reference for calibration in this case. Additional features of the flow cell are: a small distance between the working and the pseudo-reference electrodes (<1 mm), which reduces the ohmic drop and improves the signal, and a very low internal volume of 14 μL, ensuring that steady state is rapidly reached. The cell was powered by an open-source potentiostat based on a Teensy 3.2 development board (Rodeostat, IO Rodeo).19 Notably, the potentiostat software source code is available, which enables customization and automation of the measurements.
To test the performance of the flow CV cell for inline monitoring of continuous flow reactions, the electrochemical oxidation of alcohols was selected as a model. The selective oxidation of alcohols to aldehydes, ketones or carboxylic acids is a highly demanded transformation. Electrochemical methods can realize alcohol oxidations without the need for an external oxidant. Redox mediators are commonly used, including halides,20 TEMPO,21 or NiOOH species.22 Recently, Lei and co-workers have reported a mediator-free electrochemical method for the oxidation of alcohols using graphite electrodes.23
The evaluation of the flow CV cell performance began with an assessment of its capability to record voltammograms from solutions passing through the device. Cyclic voltammetry is usually carried out without mixing, as the characteristic current peak appears due to mass transfer limitations. Thus, successful CV measurements require either low flow rates or high potential scan rates. Gratifyingly, analysis of a flowing solution containing 1-phenylethanol (1a) using a potential scan rate of 0.4 V s−1 provided the expected voltammogram, indicating an irreversible oxidation at ca. +1.9 V vs. Fc/Fc+ (Fig. 2). Furthermore, when a solution of acetophenone 2a was analyzed under the same conditions, no signal peak was observed (Fig. 2, orange line). Indeed, the voltammogram generated for 2a overlaps with the background signal. Acetophenone (2a) is the anticipated oxidation product from 1-phenylethanol (1a). Further oxidation of 2a would require significantly higher potentials (>+2.5 V vs. Fc/Fc+). Thus, the concentration of 1a in solution could in principle be selectively monitored by CV irrespective of the concentration of 2a. Next, a series of solutions with variable concentrations of 1a were flowed through the cell. For each concentration, the potential scan was carried out up to the value of Ep/2 for 1a (+1.9 V vs. Fc/Fc+). Importantly, a linear relation between the peak current values and the concentration of 1a was obtained (Fig. 3), demonstrating that the cell can be utilized for quantitative determination of compound concentrations. Importantly, very low deviations (<3%) in the signal occurred when the flow rate was modified by approximately 10-fold.
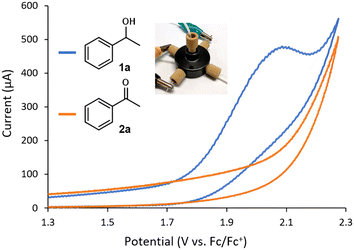 | ||
| Fig. 2 Cyclic voltammograms of 1a and 2a measured in flow mode using the cell. Conditions: 8 mM substrate in MeCN with 0.1 M Et4NBF4, flow rate = 70 μL min−1, scan rate = 0.4 V s−1. | ||
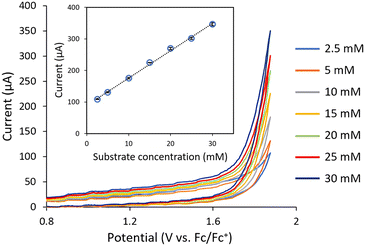 | ||
| Fig. 3 Inline cyclic voltammetry measurements of a series of solutions 1-phenylethanol (1a) with variable concentrations flowing through the system. Flow rate: 70 μL min−1. | ||
We next turned our attention into the implementation of the flow CV cell at the output of a flow electrochemical reactor (Fig. 4) for inline monitoring of preparative scale alcohol oxidation reactions. The flow electrolysis cell was an undivided parallel plate reactor previously described,24 equipped with a 5 × 5 cm impervious graphite plate as the anode and a nickel cathode with the same dimensions. As the anodic oxidation of alcohols releases hydrogen gas bubbles at the counter electrode, which might interfere with the CV cell, a length of gas-permeable tubing (Teflon AF-2400, 1 mm i.d., 20 cm length) was installed after the reactor. Thus, as the reaction mixture, consisting of a gas–liquid biphasic mixture, exited the reactor, it was degassed in the semipermeable tube. Before entering the CV cell for inline monitoring, the reaction mixture passed through a T-mixer connected to an MeCN feed, which was utilized only for cleaning purposes after measurements (a photograph of the complete setup is shown in Fig. S4†).
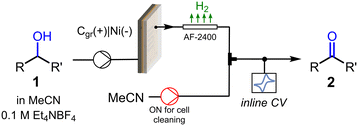 | ||
| Fig. 4 Schematic view of the setup utilized for the inline CV monitoring of electrochemical alcohol oxidations in flow. | ||
The continuous flow electrolysis and inline analysis setup was validated by collecting electroanalytical data during the reaction optimization of the bulk oxidation of 1a to 2a, and then comparing it with the measured HPLC results. Thus, a stock solution of 1a (0.05 M) containing Et4NBF4 as the supporting electrolyte was passed through the system. The flow rate of the input stream was set to 124 μL min−1. Once the system was filled with solution, electrolysis was initiated under constant current. Several currents were consecutively applied to optimize the current density and the amount of charge (F mol−1) passed. Currents ranging from 13.5 mA to 22 mA (3.3 mA cm−2 to 5.4 mA cm−2) were applied, resulting in amounts of charge of 1.5 F mol−1 to 2.2 F mol−1. For each current value, electrolysis was carried out under steady state conditions. CV data was then collected inline and a HPLC sample was collected at the reactor output for offline analysis. All reaction and analytical data are tabulated in Table S2.†
The inline CV data, obtained using the methodology described above, was compared with calibrated HPLC values for the reaction conversion (Fig. 5A). Importantly, an excellent linear fit for the values was obtained (r2 = 0.985), confirming that inline CV analysis provided accurate reaction conversion data for the flow electrochemical reaction. The linear equation obtained by regression could therefore be used to calibrate the CV response for direct quantitative inline monitoring of the reaction conversion without further need for offline analysis. An additional advantage of this inline analytical technique is that its sensitivity can be readily tuned without any changes in the hardware. For example, for optimization in the range of 95–99% conversion, where the concentration of the substrate 1a is very low, high signal intensities can be obtained by simply incrementing the scan rate. According to the Randles–Ševčík equation, the peak current intensity is proportional to v1/2.
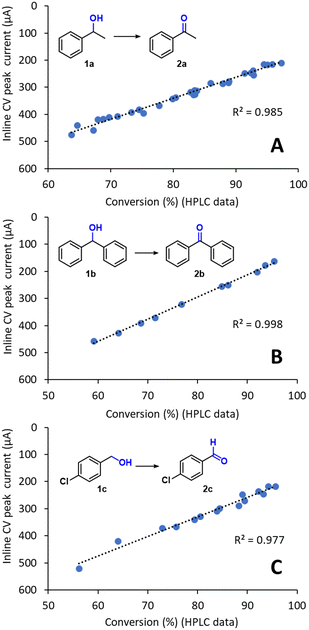 | ||
| Fig. 5 Comparison of the inline CV response with offline HPLC conversion data for the preparative-scale oxidation of (A) 1a, (B) 1b and (C) 1c. The setup shown in Fig. 4 was used in all cases. The R2 for linear regression is also shown. | ||
Importantly, when the methodology was repeated for the preparative-scale flow electrochemical oxidation of two additional substrates, the inline CV monitoring technique also provided excellent results. In particular, a secondary alcohol, which is more oxidation sensitive, diphenylmethanol 1b, and the primary alcohol 1c were evaluated (Fig. 5B and C). Excellent fitting between the inline CV data and the offline HPLC values for the conversion were again achieved, demonstrating the reliability of the inline CV cell for the monitoring of this type of reaction. As mentioned above, the linear fits acquired in Fig. 5A–C can be used to calibrate the CV response toward reaction conversion and then used as a fast and reliable quantitative inline monitoring technique. Indeed, measurements under the conditions developed only required 11 s, which enables acquisition of relatively large amounts of reaction data over short periods of time. Furthermore, due to the low currents generated during analysis (in the μA range), negligible quantities of material were consumed during analysis, which effectively makes inline CV monitoring a ‘non-destructive’ PAT tool. For example, monitoring a continuous electrolysis that resulted in ≥90% conversion of the substrate, generated a peak current of ca. 200 μA during inline analysis. As the peak current was only generated during a short period of time (<1 s), the overall amount of material consumed was insignificant with respect to the overall amount of material being flowed.
Given the very low amount of material consumed during analysis and the high reliability shown by the inline CV to monitor real time reaction conversion, this PAT tool can be used for a wide range of applications, including reaction optimization or monitoring stability of continuous flow reactions over time. In this context, during the electrochemical oxidation of 1b to 2b, a decrease of the reaction performance over time was observed. The original reaction efficiency could be regained by polishing the anode, pointing to possible fouling of the material with some degradation product. This effect was only observed during the generation of 2b and might be aided by the higher affinity of the planar structure of 2b with the graphite surface. Thus, to showcase the inline CV as a useful tool for reactor performance monitoring, a ‘long-run’ experiment was carried out. Using a standard set of reaction conditions for the electrolysis (124 μL min−1, 9.0 mA), the reactor was operated for 90 min. As expected, a gradual increase in the CV signal was observed after approximately 20 min, which indicates a decrease in the reaction conversion (i.e., a higher amount of remaining starting material 1b), was observed (Fig. 6). Remarkably, HPLC analysis of aliquots of the reaction mixture that had been collected from the reactor output revealed exactly the same trend as observed via inline CV. These results further emphasize the excellent reliability of the flow CV cell presented in this work as an inline reaction monitoring technique.
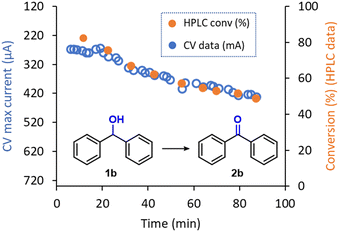 | ||
| Fig. 6 Inline CV monitoring of the decrease in performance in the electrochemical oxidation of 1b into 2b and comparison with offline HPLC data. | ||
In summary, we have developed a simple and easy-to-assemble flow cell for inline electroanalytics. The cell is based on commercially available fluidic components and 1 mm rods as electrodes. It is powered by a low-cost open-source potentiostat, enabling facile customization and automation of the analysis. The capabilities of the cell to quantify compounds in solution has been demonstrated. Its performance for the inline monitoring of flow reactions has also been shown, using the electrochemical oxidation of primary and secondary alcohols to their corresponding aldehydes or ketones as a model. The results have validated the flow CV cell as a fast and reliable process analytical technology, with results in agreement with those obtained via offline HPLC analyses.
Conflicts of interest
There are no conflicts to declare.Acknowledgements
The Research Center Pharmaceutical Engineering (RCPE) is funded within the framework of COMET – Competence Centers for Excellent Technologies by BMK, BMDW, Land Steiermark and SFG. The COMET program is managed by the FFG.Notes and references
- (a) C. N. Talicska, E. C. O'Connell, H. W. Ward, A. R. Diaz, M. A. Hardink, D. A. Foley, D. Connolly, K. P. Girard and T. Ljubicica, React. Chem. Eng., 2022, 7, 1419–1428 RSC; (b) A. Chanda, A. M. Daly, D. A. Foley, M. A. LaPack, S. Mukherjee, J. D. Orr, G. L. Reid III, D. R. Thompson and H. W. Ward II, Org. Process Res. Dev., 2015, 19, 63–83 CrossRef CAS; (c) J. Workman, B. Lavine, R. Chrisman and M. Koch, Anal. Chem., 2011, 83, 4557–4578 CrossRef CAS PubMed; (d) C. Minnich, S. Hardy and S. Krämer, Chem. Ing. Tech., 2016, 88, 694–697 CrossRef CAS.
- (a) M. A. Morin, W. Zhang, D. Mallik and M. G. Organ, Angew. Chem., Int. Ed., 2021, 60, 20606–20626 CrossRef CAS PubMed; (b) P. Sagmeister, J. D. Williams and C. O. Kappe, Chimia, 2023, 77, 300 CrossRef CAS.
- S. Caron and N. M. Thomson, J. Org. Chem., 2015, 80, 2943–2958 CrossRef CAS PubMed.
- (a) N. S. Arden, A. C. Fisher, K. Tyner, L. X. Yu, S. L. Lee and M. Kopcha, Int. J. Pharm., 2021, 602, 120554 CrossRef CAS PubMed; (b) I. C. Reinhardt, J. C. Oliveira and D. T. Ring, J. Ind. Inf. Integr., 2020, 18, 100131 Search PubMed.
- For recent reviews, see: (a) J. Li, H. Šimek, D. Ilioae, N. Jung, S. Bräse, H. Zappe, R. Dittmeyer and B. P. Ladewig, React. Chem. Eng., 2021, 6, 1497–1507 RSC; (b) M. Rodriguez-Zubiri and F.-X. Felpin, Org. Process Res. Dev., 2022, 26, 1766–1793 CrossRef CAS.
- P. Sagmeister, R. Lebl, I. Castillo, J. Rehrl, J. Kruisz, M. Sipek, M. Horn, S. Sacher, D. Cantillo, J. D. Williams and C. O. Kappe, Angew. Chem., Int. Ed., 2021, 60, 8139–8148 CrossRef CAS PubMed.
- Pharmaceutical Online, https://www.pharmaceuticalonline.com/doc/how-gsk-launched-a-continuous-manufacturing-pilot-plant-and-what-it-learned-0001?vm_tId=2013612&user=7af6e7b1-db3c-46ed-8fac-e02218d89cba&sthash.4tAReGcq.mjjoJ, (accessed September 2023).
- A. J. Bard, L. R. Faulkner and H. S. White, Electrochemical Methods: Fundamentals and Applications,. John Wiley & Sons, NY, 2nd edn, 2001 Search PubMed.
- (a) P. T. Kissinger and W. R. Heineman, J. Chem. Educ., 1983, 60, 702 CrossRef CAS; (b) N. Elgrishi, K. J. Rountree, B. D. McCarthy, E. S. Rountree, T. T. Eisenhart and J. L. Dempsey, J. Chem. Educ., 2018, 95, 197–206 CrossRef CAS.
- C. Sandford, M. A. Edwards, K. J. Klunder, D. P. Hickey, M. Li, K. Barman, M. S. Sigman, H. S. White and S. D. Minteer, Chem. Sci., 2019, 10, 6404–6422 RSC.
- K. J. Lee, N. Elgrishi, B. Kandemir and J. L. Dempsey, Nat. Rev. Chem., 2017, 1, 0039 CrossRef CAS.
- C. Batchelor-McAuley, E. Kätelhön, E. O. Barnes, R. G. Compton, E. Laborda and A. Molina, ChemistryOpen, 2015, 4, 224–260 CrossRef CAS PubMed.
- (a) P. Norouzi, M. R. Ganjali and L. Hajiaghababaei, Anal. Lett., 2006, 39, 1941–1953 CrossRef; (b) P. Norouzi, F. Faridbod, B. Larijani and M. R. Ganjali, Int. J. Electrochem. Sci., 2010, 5, 1213–1224 CrossRef CAS; (c) E. Sinkala, J. E. McCutcheon, M. J. Schuck, E. Schmidt, M. F. Roitmanb and D. T. Eddington, Lab Chip, 2012, 12, 2403–2408 RSC; (d) P. Masawat, S. Liawruangrath, Y. Vaneesorn and B. Liawruangrath, Talanta, 2002, 58, 1221–1234 CrossRef CAS PubMed.
- L. M. Delong, Y. Li, G. N. Lim, S. G. Wairegi and A. E. Ross, Anal. Bioanal. Chem., 2020, 412, 6287–6294 CrossRef CAS PubMed.
- Y. Mo, G. Rughoobur, A. M. K. Nambiar, K. Zhang and K. F. Jensen, Angew. Chem., Int. Ed., 2020, 59, 20890–20894 CrossRef CAS PubMed.
- (a) P. G. Echeverria, D. Delbrayelle, A. Letort, F. Nomertin, M. Perez and L. Petit, Aldrichimica Acta, 2018, 51, 3–19 Search PubMed; (b) S. R. Waldvogel and B. Janza, Angew. Chem., Int. Ed., 2014, 53, 7122–7123 CrossRef CAS PubMed.
- (a) B. A. Frontana-Uribe, D. R. Little, J. G. Ibanez, A. Palma and R. Vasquez-Medrano, Green Chem., 2010, 12, 2099–2119 RSC; (b) D. Cantillo, Chem. Commun., 2022, 58, 619–628 RSC.
- G. Inzelt, Pseudo-reference electrodes, in Handbook of Reference Electrodes, ed. G. Inzelt, A. Lewenstam and F. Scholz, Springer, Berlin, Heidelberg, 2013, pp. 331–332 Search PubMed.
- Rodeostat Product Guide, https://blog.iorodeo.com/rodeostat-product-guide, accessed on Sep 13, 2023 Search PubMed.
- (a) J.-I. Yoshida, R. Nakai and N. Kawabata, J. Org. Chem., 1980, 45, 5269–5273 CrossRef CAS; (b) T. Shono, Y. Matsumura, J. Hayashi and M. Mizoguchi, Tetrahedron Lett., 1979, 20, 165–168 CrossRef; (c) F. Sommer, C. O. Kappe and D. Cantillo, Synlett, 2021, 33, 166–170 Search PubMed; (d) Y. Demizu, H. Shiigi, T. Oda, Y. Matsumura and O. Onomura, Tetrahedron Lett., 2008, 49, 48–52 CrossRef CAS.
- (a) J. E. Nutting, M. Rafiee and S. S. Stahl, Chem. Rev., 2018, 118, 4834–4885 CrossRef CAS PubMed; (b) R. Ciriminna, M. Ghahremani, B. Karimi and M. Pagliaro, ChemistryOpen, 2017, 6, 5–10 CrossRef CAS PubMed.
- (a) M. T. Bender, Y. Choi Lam, S. H. Schiffer and K.-S. Choi, J. Am. Chem. Soc., 2020, 142, 21538–21547 CrossRef CAS PubMed; (b) W. Jud, C. A. Salazar, J. Imbrogno, J. Verghese, S. M. Guinness, J.-N. Desrosiers, C. O. Kappe and D. Cantillo, Org. Process Res. Dev., 2022, 26, 1486–1495 CrossRef CAS; (c) H.-J. Schäfer, Top. Curr. Chem., 1987, 142, 101–129 CrossRef.
- D. Wang, P. Wang, S. Wang, Y. Chen, H. Zhang and A. Lei, Nat. Commun., 2019, 10, 2796 CrossRef PubMed.
- W. Jud, C. O. Kappe and D. Cantillo, Chem.: Methods, 2021, 1, 36–42 CAS.
Footnote |
| † Electronic supplementary information (ESI) available. See DOI: https://doi.org/10.1039/d3re00535f |
| This journal is © The Royal Society of Chemistry 2024 |
