
 Open Access Article
 This Open Access Article is licensed under a Creative Commons Attribution-Non Commercial 3.0 Unported Licence
Precision phenylalanine sensing in blood with nanomaterial-enhanced electrodes†
Ipek Akyilmaza,
Naim Yagiz Demir a,
Deniz Basb and
Memed Duman*a
a,
Deniz Basb and
Memed Duman*a
aHacettepe University, Institute of Science, Nanotechnology and Nanomedicine Division, Ankara, Turkey. E-mail: memi@hacettepe.edu.tr
bDepartment of Food Engineering, Faculty of Engineering, Cankiri Karatekin University, Cankiri, Turkey
First published on 19th September 2024
Abstract
Phenylketonuria (PKU) is a genetic disorder associated with the metabolic dysfunction of the phenylalanine hydroxylase enzyme, which catalyses the conversion of L-phenylalanine (Phe) to L-tyrosine. Elevated levels of phenylalanine disrupt the central nervous system by impairing the myelination process and leading to mental retardation. Currently, commonly used diagnostic methods for PKU include the Guthrie test, liquid chromatography, and tandem mass spectrometry, all of which necessitate sophisticated infrastructure and costly equipment. Conversely, electrochemical detection methods hold promise in clinical diagnosis due to their high accuracy, rapid response time, and user-friendly nature. The choice of electrodes in electrochemical methods significantly influences sensitivity and analytical performance. In this study, we evaluated the performance of various nanomaterial-modified electrodes and compared their responses to the redox reaction of phenylalanine, focusing on detection capabilities in blood samples. Specifically, we examined carbon nanotube-gold nanoparticle modified carbon electrode (C-CNT-GNP), graphene-gold nanoparticle modified carbon electrode (C-GPH-GNP), electrochemically reduced graphene oxide (ERGO) modified carbon electrode (C-ERGO), bare carbon electrode (C-BARE), ERGO modified gold electrode (Au-ERGO), and bare gold electrode (Au-BARE) using amperometric detection. The performance of these electrodes was compared in terms of their limit of detection (LOD), limit of quantification (LOQ), and sensitivity. Among all electrodes, ERGO gold electrode showed the lowest LOD, LOQ, and highest sensitivity. This study highlights the potential of ERGO-modified gold electrodes for enhancing electrocatalytic activity, thus offering promising prospects for further diagnostic applications.
Introduction
Phenylketonuria (PKU) is a congenital disorder resulting from a mutation in the gene encoding phenylalanine hydroxylase (PAH). PAH enzyme catalyses the hydroxylation of phenylalanine (Phe) to tyrosine. Deficiency in this enzyme leads to an accumulation of phenylalanine in the bloodstream, causing irreversible damage to nerve cells. Elevated phenylalanine levels in bodily fluids, such as blood and urine, adversely affect the central nervous system by disrupting the myelination process, ultimately resulting in mental retardation.1Various methods are employed to quantify phenylalanine levels in the blood, including the bacterial growth inhibition test (Guthrie),2 a fluorometric immunoassay,3 enzymatic colorimetric test,4 HPLC (for direct amino acid analysis), and tandem mass spectrometry (MS/MS).2
Nevertheless, the first two approaches are not suitable for routine screening since antibiotic use compromises their accuracy, potentially yielding misleading results such as false negatives or positives. While HPLC and MS/MS offer high sensitivity and are fully automated, they require complex and costly equipment/devices, as well as internal controls.2 Alternatively, electroanalytical methods present a promising alternative for phenylalanine detection in clinical setup, offering advantages such as detection accuracy, short response period, and ease of use.5
Electroanalytical methods utilized in PKU detection rely on the electrochemical oxidation of beta-nicotinamide adenine dinucleotide (β-NADH) generated during the deamination of phenylalanine to phenylpyruvate; a reaction catalysed by the phenylalanine dehydrogenase enzyme (PheDH).6–8 The efficiency of using a bare electrode in these applications might be inadequate for diagnostic use, as the direct oxidation of the target molecule necessitates a high overpotential (0.6–0.8 V). However, operating at such a high overpotential can lead to the formation of undesired oxidation products, contaminating the electrode surface and consequently resulting in measurements with low sensitivity.9–11 To mitigate this issue, various surface modification methods employing nanomaterials have been proposed to decrease the high overpotential associated with NADH oxidation.11,12 Electrode modifications using polymers,13 biopolymers,14 and carbon-based nanomaterials are commonly employed to enhance the selectivity and sensitivity of electrochemical sensors.15–17
Carbon-based nanomaterials play a pivotal role in sensor applications, particularly in the electrochemical detection of biological analytes. These materials offer numerous advantages, leveraging their unique characteristics such as high surface-to-volume ratio, biocompatibility, excellent electrical conductivity, chemical stability, robust mechanical strength, porous structure, cost-effectiveness, and electrocatalytic activity. Owing to their favourable electrochemical properties, including a broad potential window and minimal background current, they are extensively employed in the modification of electrochemical sensors.18
Among carbon-based nanomaterials, carbon nanotubes and graphene have garnered significant attention in electrochemical modification methods.19 Graphene (GPH) is prominently featured in electrochemical biosensor research due to its outstanding properties, including high electrical conductivity, biocompatibility, and mechanical durability. Reduction of graphene oxide (GO) results in the formation of a conjugated sp2 carbon structure with enhanced electrical conductivity, achieved by the removal of oxygen groups from its structure. Recently, the electrochemical reduction of GO has gained prominence due to its environmental-friendly and non-toxic nature, simple instrumental setup, low cost, particularly in electrochemical biosensor applications.15,20 Carbon nanotubes (CNTs), the cylindrical form of graphene layers, also find widespread use in electrochemical biosensor applications.21,22 With similar chemical and physical properties to graphene, carbon nanotubes serve as an alternative material in various studies. Furthermore, carbon-based nanostructures can be tailored with gold nanoparticles to enhance conductivity and surface area.23
In this study, we aimed to examine how electrode modifications impacted the detection efficiency of PKU in a complex blood matrix using six different electrodes. Among these, two were bare carbon and gold electrodes, while the other two consisted of both carbon and gold electrodes modified with electrochemically reduced graphene oxide (ERGO). The remaining two electrodes were carbon paste electrodes modified with gold nanoparticle-tailored graphene (C-GPH-GNP) and carbon nanotubes (C-CNT-GNP), which are commercially available. The electrocatalytic properties of these sensors were assessed by measuring NADH formation in the human blood matrix in the presence of phenylalanine dehydrogenase and L-phenylalanine through amperometric detection.
Experimental
Reagents
L-Phenylalanine (Phe, 98%), β-Nicotinamide adenine dinucleotide sodium salt (NAD+, 95%), glycine, hydrochloric acid (HCl), sodium hydroxide (NaOH), graphene oxide (GO) (4 mg mL−1 dispersion in H2O, average number of layers = 1, average flake diameter = 400 nm),24 sulfuric acid (H2SO4), potassium ferricyanide/ferrocyanide (K3Fe(CN)6), potassium chloride (KCl), sodium phosphate monobasic (Na2HPO4), and potassium phosphate monobasic (KH2PO4) were purchased from Sigma-Aldrich (Germany). Phenylalanine dehydrogenase from Rhodococcus species was obtained from ASA Spezialenzyme GmbH (Germany). Ethanol, used for electrode cleaning, was obtained from Isolab (Germany). The electrochemical reduction of GO was conducted in a phosphate buffer (PB) solution. β-Nicotinamide adenine dinucleotide, reduced disodium salt hydrate (NADH, Grade I), was purchased from Roche (Germany), and its solutions were prepared in a glycine buffer (pH 10.5). Human blood sample from healthy individual were collected from Hacettepe University Hospital (Ankara, Turkey). All sample preparations were approved by the institution and followed hospital usage guidelines with relevant regulations and standard procedures. All solutions utilized in the experiments were freshly prepared immediately prior to use and with ultra-pure water (18.2 MΩ cm) generated by the Aqua Max-Ultra ultra-pure water purification system (Youngling, Dongan-gu, South Korea).Instruments
All electrochemical measurements were carried out using a potentiostat, 910 PSTAT Mini model from Metrohm (Switzerland), controlled by PSTAT software. Disposable carbon screen-printed electrodes (SPE) (DRP 110), disposable gold SPE (DRP 220 AT), carbon nanotube-gold nanoparticle modified carbon electrodes (DRP-110CNT-GNP), graphene-gold nanoparticle modified carbon electrodes (DRP-110GPH-GNP) were purchased from Metrohm DropSens (Switzerland). The working electrode (WE) reference material was silver, and the geometric areas of the WEs were 0.11 cm2. Information regarding the material, LOD, LOQ and sensitivity of WEs are provided in Table 1. Detection measurements were performed utilising an amperometric method at room temperature (25 °C). Blood plasma samples were prepared using a high-speed mini centrifuge device from Isolab (Germany). The surface morphologies of both unmodified and modified electrodes were examined using scanning electron microscopy (SEM) (Tescan, GAIA3+Oxford XMax 150 EDS, Czech Republic) and electrochemical impedance spectroscopy (EIS) (Autolab-PGSTAT 204, Metroohm, Switzerland).| Electrode | LOD (mol L−1) | LOQ (mol L−1) | Sensitivity (μA/(mol L−1)) | WE material | Equation of calibration curve and R2 |
|---|---|---|---|---|---|
| Au-BARE | 26.0 × 10⁻⁶ | 78.8 × 10⁻⁶ | 6.34 × 10⁻⁶ | Gold AT | y = 0.1048x + 0.1439 |
| 0.9447 | |||||
| Au-ERGO | 3.17 × 10⁻⁶ | 9.61 × 10⁻⁶ | 20.2 × 10⁻⁶ | Gold AT | y = 0.3338x + 0.0643 |
| 0.9955 | |||||
| C-BARE | 24.0 × 10⁻⁶ | 72.7 × 10⁻⁶ | 4.41 × 10⁻⁶ | Carbon | y = 0.0729x + 0.1129 |
| 0.9741 | |||||
| C-ERGO | 3.46 × 10⁻⁶ | 10.5 × 10⁻⁶ | 6.47 × 10⁻⁶ | Carbon | y = 0.1069x + 0.0408 |
| 0.9886 | |||||
| C-GPH- GNP | 32.1 × 10⁻⁶ | 97.2 × 10⁻⁶ | 13.3 × 10⁻⁶ | GPH-GNP/Carbon | y = 0.2200x + 0.0655 |
| 0.9898 | |||||
| C-CNT-GNP | 25.1 × 10⁻⁶ | 75.9 × 10⁻⁶ | 9.53 × 10⁻⁶ | CNT-GNP/Carbon | y = 0.1574x + 0.0375 |
| 0.9932 |
Preparation and surface characterization of electrodes
The same characterization techniques (SEM, EIS, and CV) were applied to all electrode surfaces used in the study to assess their physical and electrical properties. Cleaning, modification, and characterization methods were elaborated in detail for each electrode utilized in the detection process.For Au-BARE and C-BARE electrodes, a pre-treatment procedure was conducted. Both electrodes were initially immersed in pure ethanol for 5 minutes and subsequently rinsed with ultra-pure water. Subsequently, they underwent electrochemical cleaning with 0.5 mol L−1 H2SO4 through 15 cycles of cyclic voltammetry (CV) between 0.0–1.6 V at a scanning rate of 100 mV s−1. Surface characterisation was performed through SEM, EIS, and CV. EIS and CV measurements employed a solution consisting of 5 mmol L−1 Fe(CN)63−/4− in 100 mmol L−1 KCl. Impedimetric measurements were conducted within the frequency range of 100 kHz to 0.1 Hz at an open circuit potential (OCP). NOVA software facilitated the adaptation of impedance results to the equivalent circuit model (Randles Circuit). In the Randles equivalent circuit depicted in the inset of Fig. 2, Rs represents the resistance of the electrolyte in solution, Cdl denotes the double-layer capacitance, Zw represents the Warburg impedance, and Rct signifies the charge transfer resistance. CV was performed within the range of −0.2 V to 0.5 V at a scan rate of 100 mV s−1.
Before the modification of Au-ERGO and C-ERGO electrodes, all electrodes underwent the same cleaning process which was described above. Following electrode cleaning, CV was utilised to obtain electrochemically reduced graphene oxide (ERGO) and deposit it onto the electrode surface. A mixture containing 2 mg mL−1 GO and 0.1 mol L−1 PB (v/v 70%) at pH 6 was prepared and 40 μL of the mixture was pipetted onto the electrode. The optimum ERGO deposition cycle was determined by applying 25, 50 and 75 cycles at 100 mV s−1 between 0.1 and −1.5 V. The area between CV curves was the least after 75 cycles, indicating the successful reduction of GO (Fig. S1†). The extent of GO reduction following cyclic voltammetry was further characterised by Raman Spectroscopy (Fig. S2†). The D and G bands, located in the 1200–1450 cm−1 and 1460–1650 cm−1 regions, respectively, were identified. The GO exhibited broad D and G bands, characteristic of a typical GO Raman spectrum. Post-treatment with cyclic voltammetry, these peaks became more defined, with a reduction in the full width at half-maximum for both bands, indicating increased graphitization in the reduced graphene oxide (ERGO). The increase in ID/IG ratio from 1.16 to 1.43 for GO and ERGO, respectively, indicates that while the reduction process creates smaller sp2 domains, it also introduces more defects. This observation also can be attributed to the formation of new, smaller graphitic domains that contribute to the overall defect density (Fig. S2†). Prior to the use of C-GPH-GNP and C-CNT-GNP, electrodes were immersed in pure ethanol for 5 minutes and subsequently rinsed with ultra-pure water.
Electrochemical determination of phenylalanine in blood matrix with modified and unmodified electrodes
The oxidised and reduced forms of NAD (NAD+ and NADH, respectively) play important roles in cellular energy metabolism. The NAD+/NADH pair functions in numerous enzymatic reactions catalysed by dehydrogenases. Therefore, detecting these substances enables the researchers to study oxidation and reduction reactions and identify different enzyme substrates.25 The system designed and presented in this study relies on the detection of Phe as a result of the following reactions:(1) The phenylalanine dehydrogenase (PheDH) converts Phe into phenylpyruvate and NADH when NAD+ is present.

(2) NADH produced on the electrode surface oxidizes and produces the oxidized form of the cofactor NAD+. The biochemical recognition is achieved through the following electrochemical redox reaction:26
| NADH → NAD+ + H+ + 2e |
Blood plasma samples were obtained from volunteers and utilised without any pre-treatment, except for dilution. The final concentration of phenylalanine (Phe) in the samples was adjusted to 2, 4, 10, and 20 mg dL−1 by adding the appropriate amount of Phe solutions in deionized water (DI water).
An important factor in system design was the effect of pH. A preliminary study was conducted to test the phenylalanine dehydrogenase (PheDH) activity at different pH values (7.0, 9.0 and 10.5). Our results suggested that pH had a prominent effect on enzyme activity, which was determined to be optimum at pH: 10.5 (data not shown). Since electrochemical readout directly depends on the efficiency of the enzymatic activity, the subsequent studies were carried out at pH: 10.5. Therefore, the samples were diluted with 200 mmol L−1 glycine buffer (pH: 10.5) at a ratio of 1![[thin space (1/6-em)]](https://www.rsc.org/images/entities/char_2009.gif) :3 (blood to buffer) to achieve a pH of 10.5. The samples were centrifuged at 5500 rpm for 3 minutes to separate the plasma from red blood cells.
:3 (blood to buffer) to achieve a pH of 10.5. The samples were centrifuged at 5500 rpm for 3 minutes to separate the plasma from red blood cells.
An appropriate potential was determined for each electrode surface by measuring the oxidation of a 1200 mmol L−1 NADH solution in glycine buffer using cyclic voltammetry (CV) (one cycle, 0–1 V at a scan rate of 100 mV s−1). Amperometric measurements were initiated after loading 46 μL of plasma samples onto the electrodes. The specified potentials for each electrode surface were applied for 2000 s. The reaction commenced between 600-800 s after adding 4 μL of a mixture of PheDH and NAD+ solutions. The final concentrations of PheDH and NAD+ in the working solution were adjusted to 1.6 U mL−1 and 2.5 mmol L−1, respectively.
Results and discussion
Characterisation of modified and unmodified screen-printed electrodes
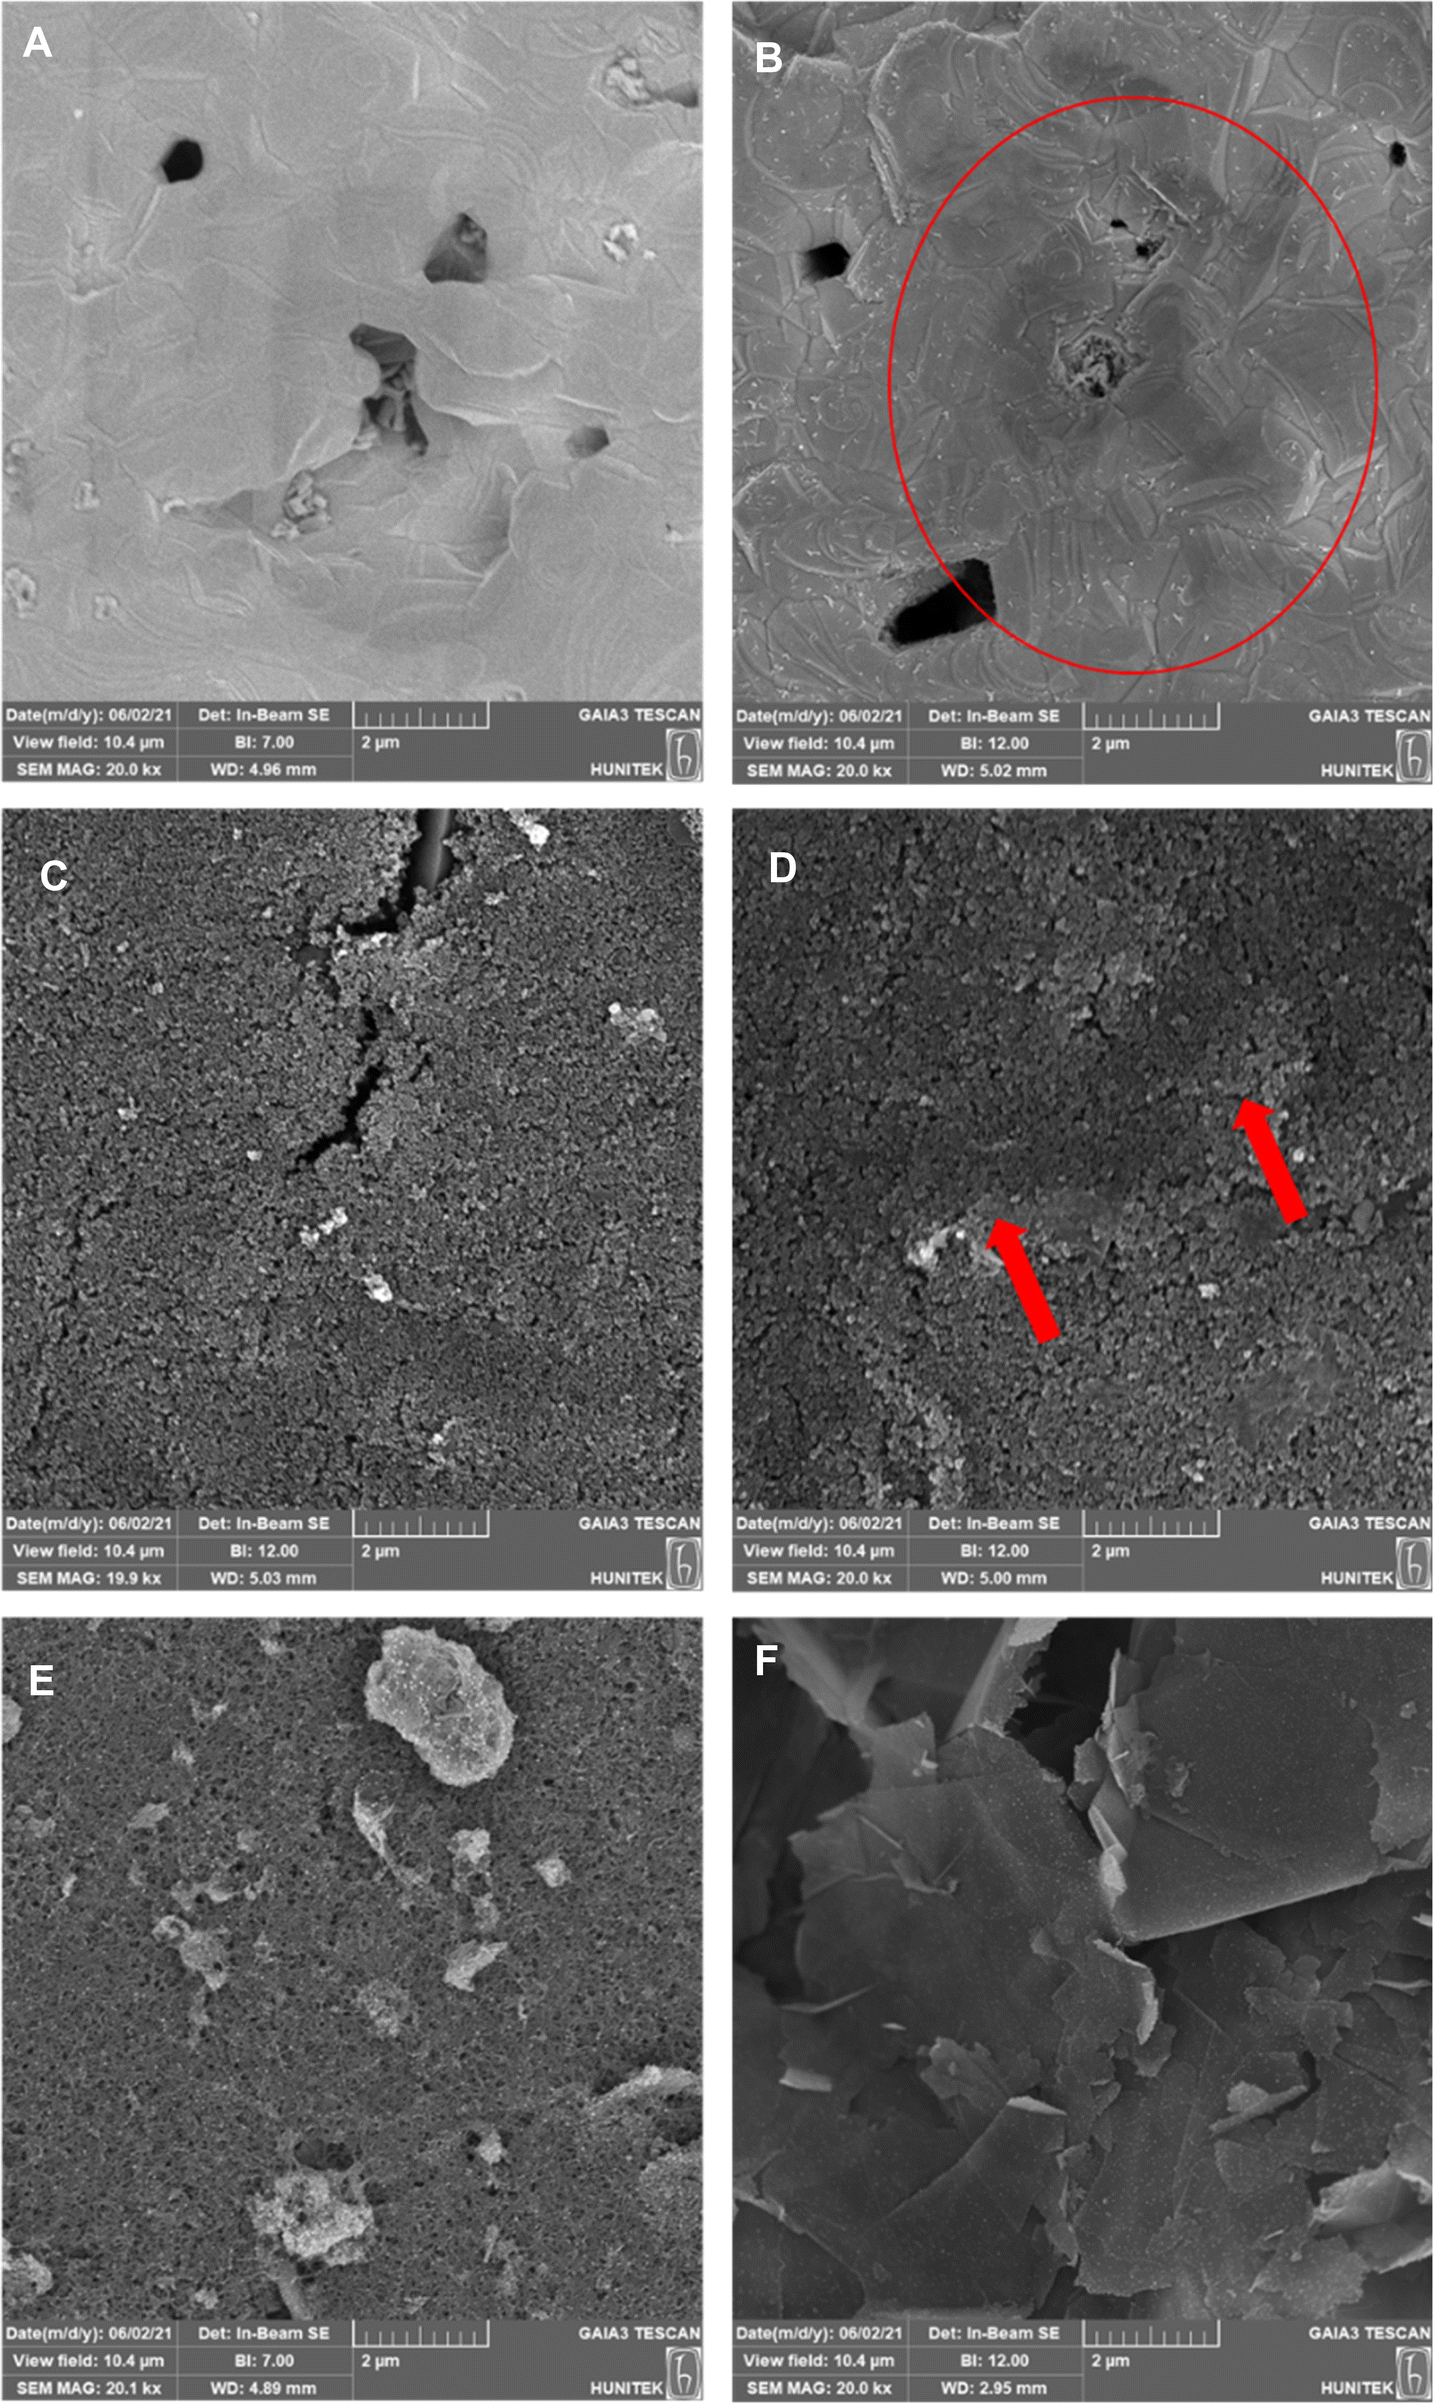 | ||
| Fig. 1 SEM images of modified and unmodified electrodes. (A) Bare gold, (B) ERGO-modified gold electrode, (C) bare carbon (D) ERGO-modified carbon electrode, (E) carbon nanotube and gold nanoparticle-modified carbon electrode, (F) graphene and gold nanoparticle-modified carbon electrode. | ||
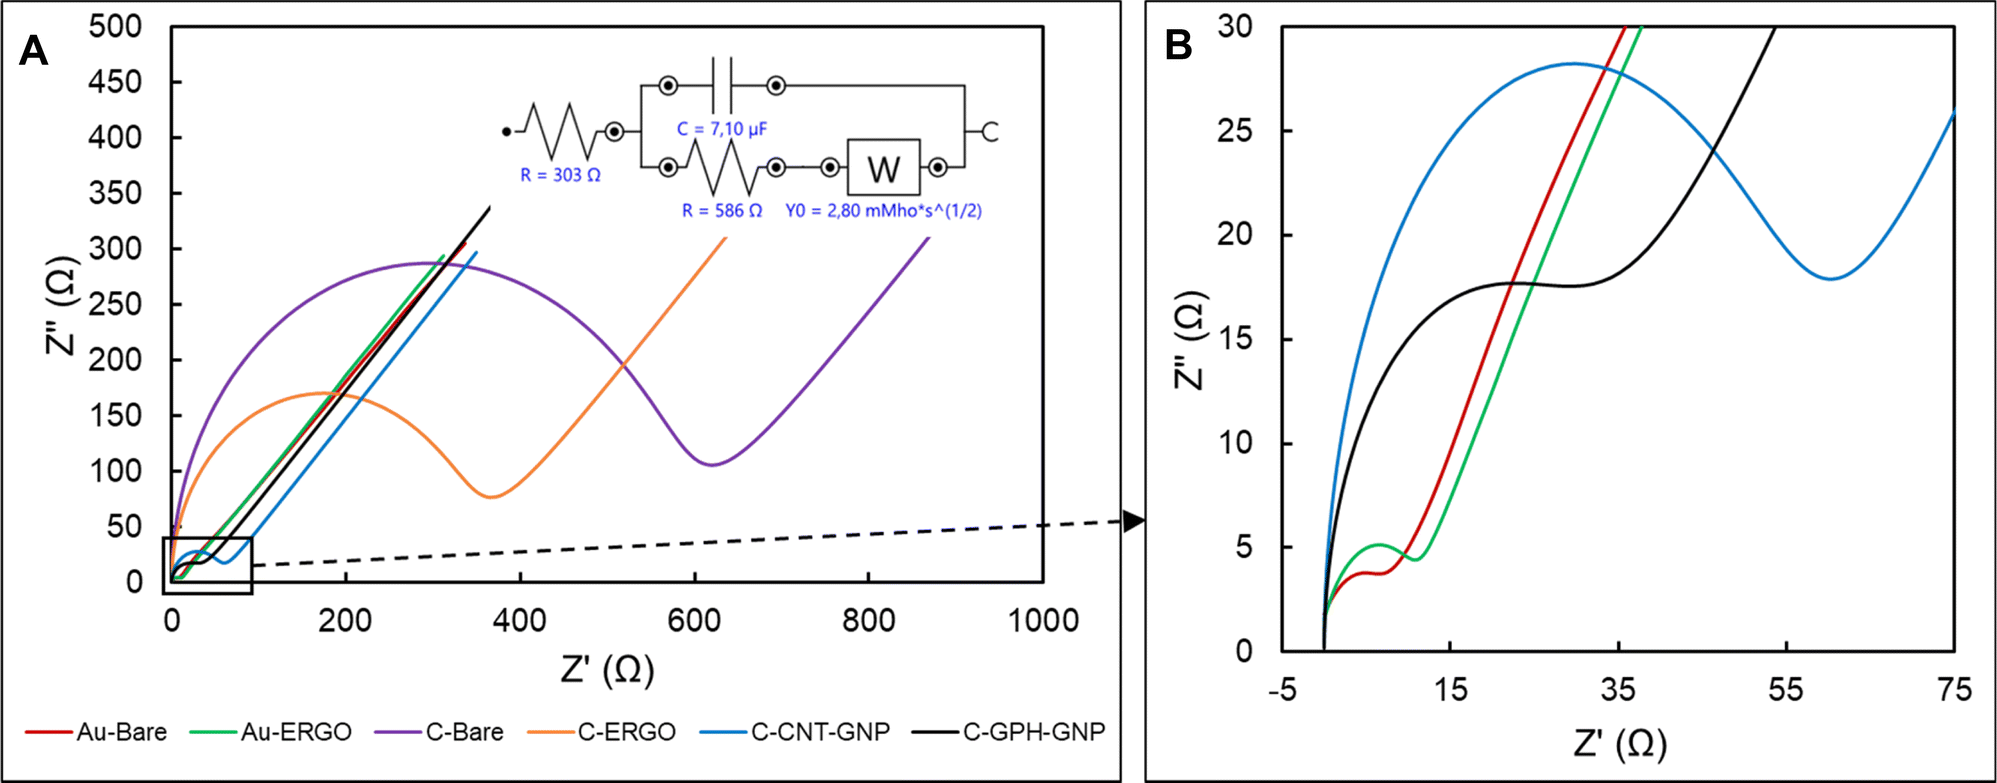 | ||
| Fig. 2 Electrochemical impedance spectra of modified and unmodified electrodes. (A) Red: bare gold, green: ERGO modified gold electrode, purple: bare carbon, orange: ERGO modified carbon electrode, blue: carbon nanotube and gold nanoparticle modified carbon electrode, black: graphene and gold nanoparticle modified carbon electrode, inset: equivalent circuit of electrodes, (B) magnified chart of Au-Bare, Au-ERGO, C-CNT-GNP, and C-GPH-GNP. | ||
The diameter of the semi-circle in the high frequency represents the charge transfer resistance (Rct), which is inversely proportional to the conductivity.30 The lowest average Rct value was evaluated in Au-BARE as 12.75 Ω. Due to the higher resistance of reduced GO compared to Au, the Rct value increased to 14.79 Ω after the ERGO modification. On the other hand, due to the lower resistance of reduced GO than graphite, the Rct value in C-BARE was evaluated as 563 Ω while it was 328 Ω in C-ERGO as a result of the modification. When the commercially available modified electrodes, C-GPH-GNP and C-CNT-GNP, were examined, it was observed that the Rct value decreased significantly due to the high conductivity of the gold nanoparticles. Rct values were 29.74 Ω and 53.63 Ω in C-GPH-GNP and C-CNT-GNP, respectively. Impedance spectroscopy results showed that higher conductivity was achieved with the bare gold electrode and ERGO modification on the gold electrode while the lowest conductive surface was observed at the C-BARE electrode. ERGO modification to the bare carbon electrode increased conductivity, however commercially available modified carbon electrodes were found to have significantly lower Rct values which mean higher conductivity than the C-ERGO electrode.
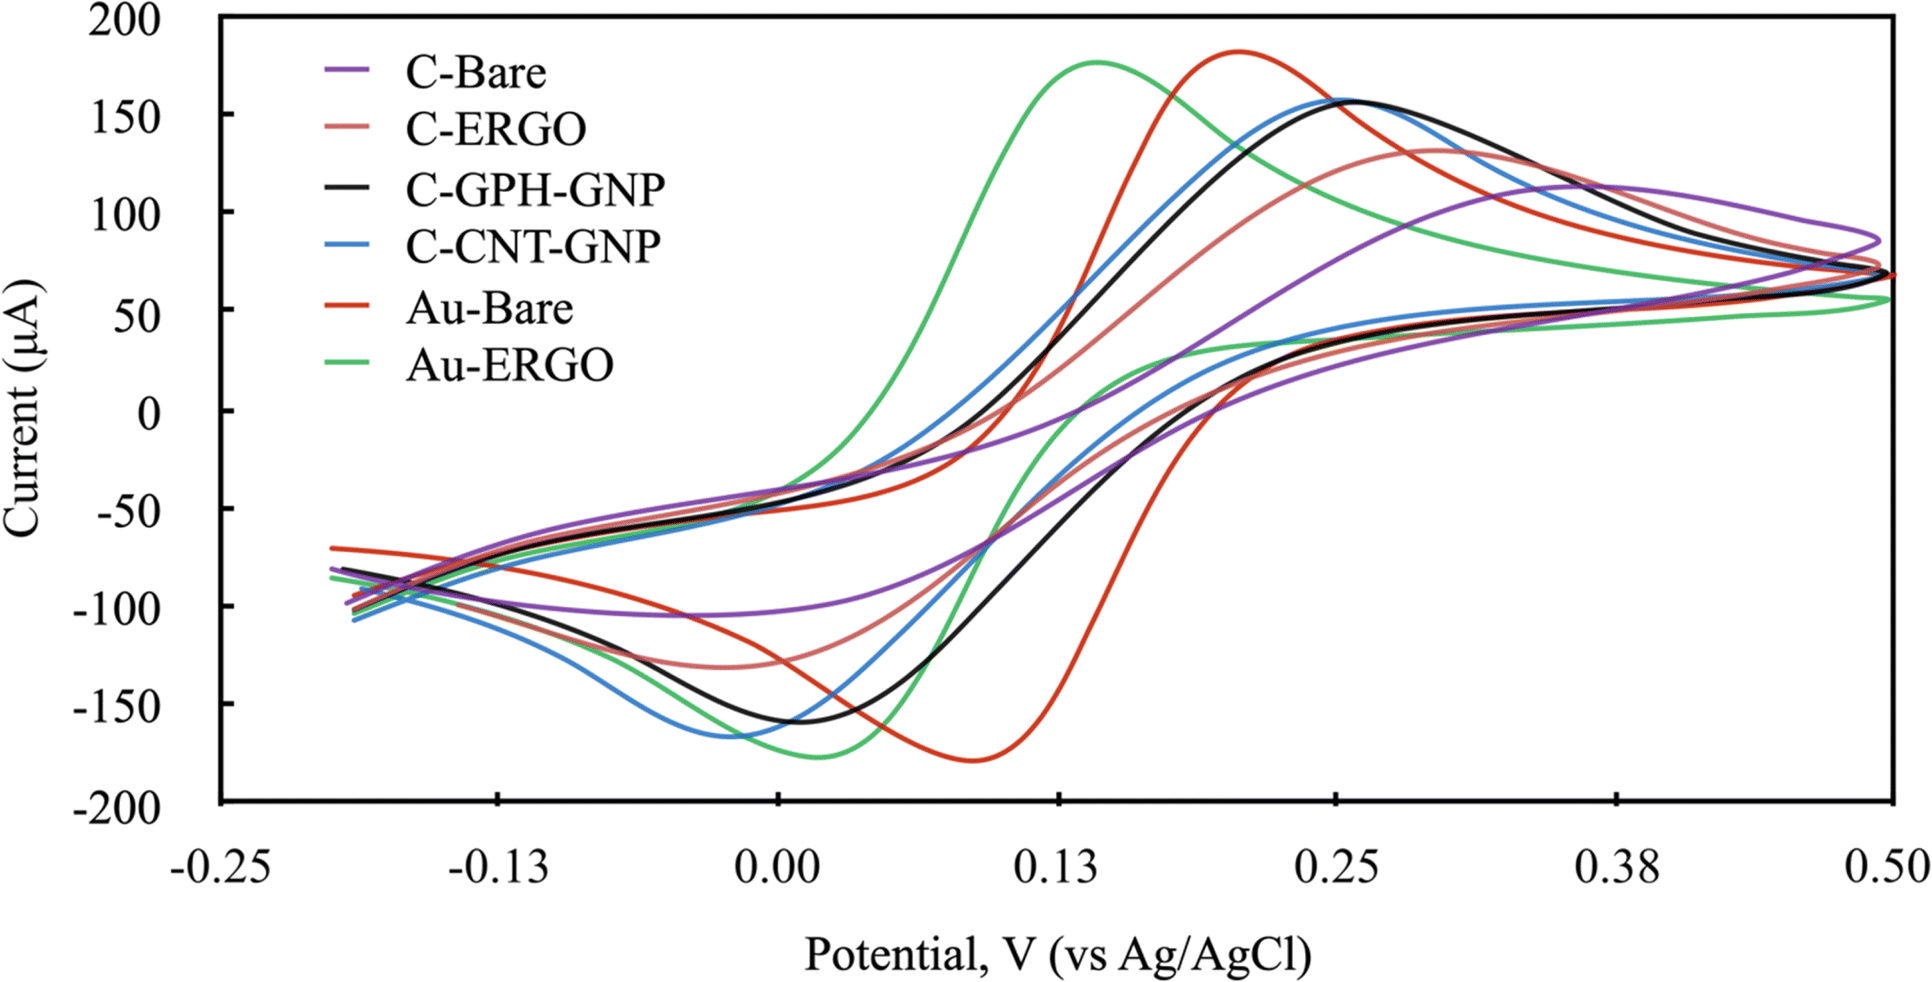 | ||
| Fig. 3 Cyclic voltammograms (scan rate: 100 mV s−1) of modified and unmodified electrodes in 0.1 mmol L−1 KCl containing 1 mmol L−1 Fe(CN)63−/4−. (red: bare gold, green: ERGO modified gold electrode, purple: bare carbon, orange: ERGO modified carbon electrode, blue: carbon nanotube and gold nanoparticle modified carbon electrode, black: graphene and gold nanoparticle modified carbon electrode). | ||
To calculate the electrode area of SPEs, electrochemical experiments were performed using 2 mM ferricyanide in 0.1 M KCl as redox probe with a range of various scan rates (10, 20, 50, 100 and 200 mV s−1). The appropriate Randles–Ševćik equation was used to determine the electrode areas.31 The resulting surface areas of Au-BARE, Au-ERGO, C-BARE, C-ERGO, C-GPH-GNP and C-CNT-GNP were 0.1629 cm2, 0.1604 cm2, 0.1253 cm2, 0.1403 cm2, 0.1566 cm2 and 0.1578 cm2, respectively. Based on the obtained values, it can be generally concluded that modifying electrodes with nanomaterials increases the electroactive area compared to bare electrodes. As noted by other authors, this increase can improve sensitivity to some extent, it may also reduce the signal-to-background ratio, leading to lower analytical sensitivity.32
The electrochemical behaviour of Phe enzymatic reaction with the amperometric method on different electrode surfaces were studied after the optimisation of the reaction parameters. To select the right potential value to be applied during the analysis, the cyclic voltammetry method was carried out with NADH molecule which is the product of the Phe enzymatic reaction (Fig. 4). The electrochemical behaviour of the 1200 mmol L−1 NADH solution in the glycine buffer was examined by applying LSV (0–1 V, 100 mV scan rate). The potential values at which the highest peak current was obtained were selected for each electrode, and these were 0.6, 0.55, 0.5, 0.5, 0.65, 0.6 V for C-BARE, C-ERGO, C-CNT-GNP, C-GPH-GNP, Au-BARE, Au-ERGO electrodes respectively (Fig. 4).
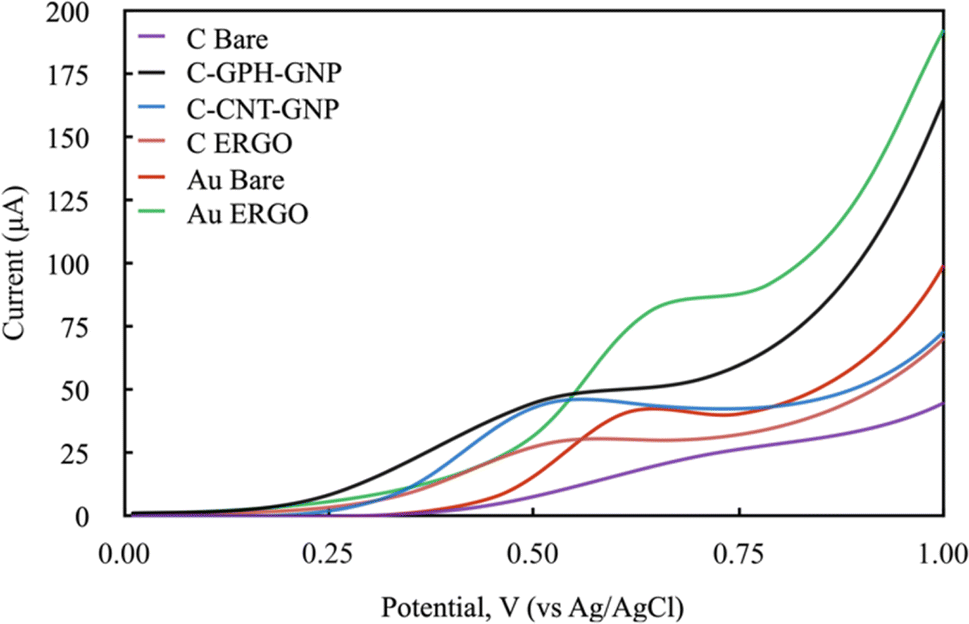 | ||
| Fig. 4 Linear sweep voltammograms of modified and unmodified electrodes in 1200 mmol L−1 NADH solution in glycine buffer 200 mmol L−1, pH 10.5. (Scan rate: 100 mV s−1 and potential range: 0–1 V). | ||
Blood samples containing Phe between 0-20 mg dL−1 concentration were first loaded onto the electrode surface, and then the selected potentials were applied for approximately 600–800 s prior to the initiation of the enzymatic reaction. During this period, various electroactive components in the real sample were allowed to stabilise to eliminate noise. Then the reaction was started by adding the enzyme and NAD+ together in a solution to the sample on the electrode surface. The reaction current increased with the rise of the concentration on each electrode surface. The linear dependence of the current increment and the concentrations are shown in Fig. 5 and Table 1.
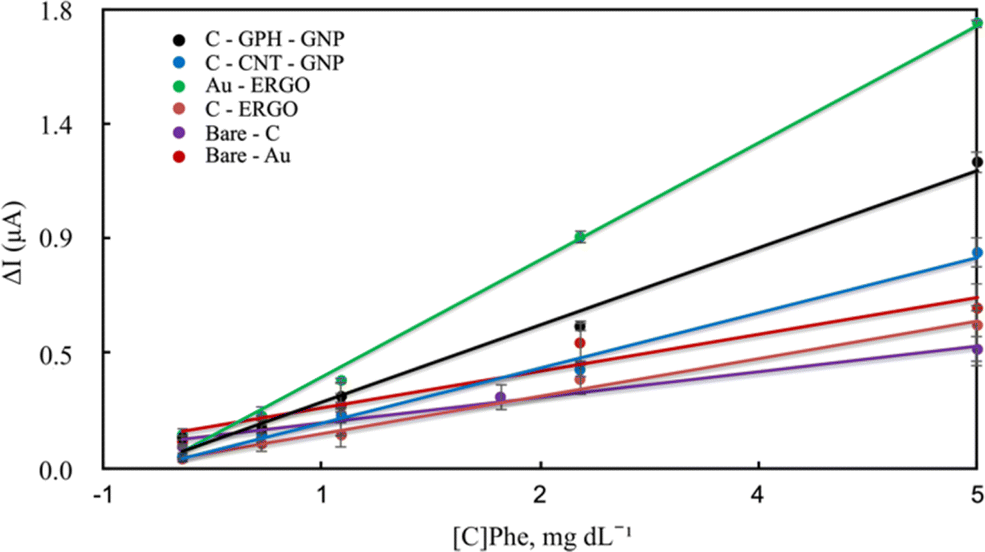 | ||
| Fig. 5 Calibration curves of modified and unmodified electrodes for the quantitative determination of Phe in blood. | ||
Under optimal conditions, the linearity was established in all electrodes at the Phe concentrations between 0-20 mg dL−1 (Fig. 5). The linearity and sensitivity were significantly higher on the Au-ERGO electrode surface. Fig. 6 shows the real data of increased current peaks of the blood samples containing 20 mg dL−1 Phe obtained by each electrode. Based on these results, the LOD, LOQ, and sensitivity values of the measurements performed on all electrodes are given in Table 1.
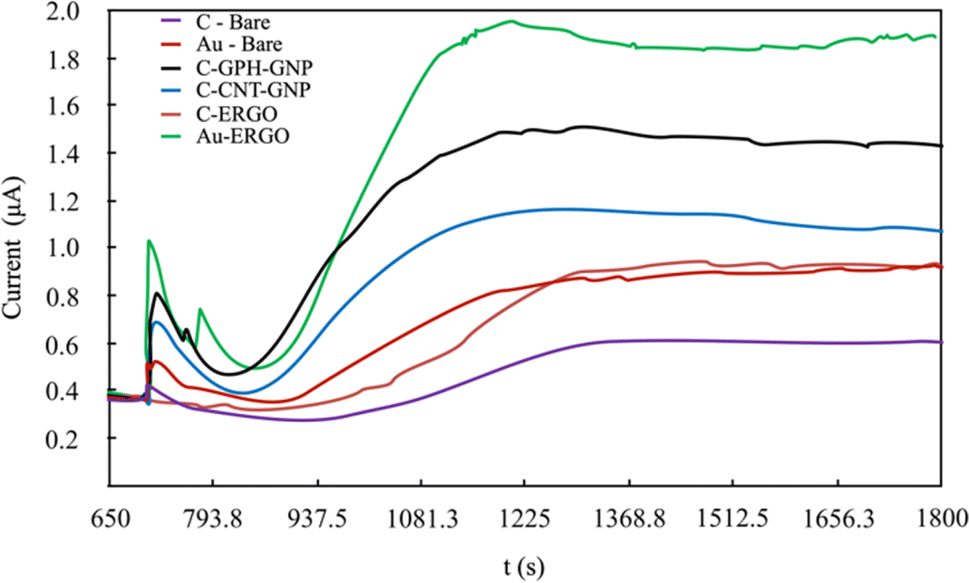 | ||
| Fig. 6 Real data comparison of modified and unmodified electrodes for the determination of 20 mg dL−1 Phe in blood. | ||
According to the EIS results, no significant conductivity change was observed between Au-ERGO and Au-BARE with very close Rct values. The Rct value of Au-ERGO was slightly lower than that of Au-BARE due to graphene's lower conductivity compared to gold. However, a remarkable observation from the CV measurements was that the required potential has been reduced with the ERGO modification. This prevented interference caused by undesired electroactive species in real sample measurements.
The ERGO treatment applied to the carbon electrode significantly increased the conductivity contrary to the gold electrode and reduced the potential as in the gold electrode. However, the gold working electrode has an advantage in the use of Phe sensors due to its biocompatibility and higher conductivity than carbon. Although gold nanoparticles were added to the commercially modified C electrodes, the peak current values achieved with the gold electrode could not be reached. The reduction of the potential with the ERGO modification on the gold electrode provided superiority to the other electrodes used in the study.
Table 2 compares the various electrochemical sensors used for PKU detection. The sensor system that gave the best results in our study showed several advantages compared to other sensor systems in the literature. The electrode developed in this study achieved a better detection limit than several studies. Although below detection limits were reached in various studies that detected the buffer solution, the results may differ when the real sample is tested. In addition, low LODs have been obtained using real samples in the literature, but with complex and time-consuming modified methods. Although Moreira et al. reported a lower LOD value of 2 × 10⁻⁷ mol L−1, a significant comparison could not be made due to the use of excess enzyme amount, complicated and multiple sample preparation steps, and unspecified current value in the measurements.17 On the other hand, in our work, a sensor that is capable of identifying the disease detection range (2–10 mg dL−1) has been developed. Moreover, the current sensor is user-friendly and low-cost, which can be easily modified with accessible materials and has a short assay time (approx. 20 min, including sample preparation and measurement), emerging as a superior alternative to existing technologies.
| Electrode | Detection method | LOD (mol L−1) | Sample type | Linear range | Reference |
|---|---|---|---|---|---|
| Gold/ERGO | Amperometry | 3.17 × 10⁻⁶ | Real sample (blood) | 0–20 mg dL−1 | Present study |
| Carbon/ZIF-67 encapsulated PtPd alloy nanoparticle (PtPd@ZIF-67) | Amperometry | 20 × 10−9 | Buffer | 20 nM–200 μM | 33 |
| Carbon/MIP/β-CD-MWNTs/PAN | Amperometry | 1 × 10⁻⁹ | Real sample (blood) | 5.0 × 10⁻⁷–1 × 10⁻⁴ mol L−1 | 16 |
| Carbon/3,4-DHB-modified | CV | 5 × 10⁻⁴ | Real sample (urine) | 8 mM–80 mM | 34 |
| Carbon/Cellulose membrane | Amperometry | 2.5 × 10⁻⁵ | Buffer | 0–9.1 mM | 35 |
| Gold/GO-chitosan | DPV | 4.16 × 10⁻⁷ | Real sample (blood) | 500 nM–15 mM | 36 |
| Carbon/PAD/ERGO | DPA | 2 × 10⁻⁷ | Real sample (blood) | 1–600 μmol L−1 | 17 |
Conclusions
In this study, quantification of Phe in blood samples has been performed utilising two different unmodified carbon and gold screen-printed electrodes and four modified C-ERGO, C-GPH-GNP, C-CNT-GNP, Au-ERGO, and C-ERGO electrodes. The unmodified and modified electrode surfaces have been characterised using SEM EIS, and CV. Electrochemical detection of Phe was performed using the amperometric method in all electrodes compared in the study. Among all electrodes, the Au-ERGO electrode displayed much more convenient properties for Phe determination with the lowest LOD (3.17 × 10⁻⁶ mol L−1), LOQ (9.61 × 10⁻⁶ mol L−1), and highest sensitivity (2.02 × 10⁻⁵ μA (mol L−1)−1). Electrochemical reduction of graphene oxide on gold screen-printed electrode considerably improved the reversibility and enhanced electrocatalytic activity towards NADH oxidation. This study revealed that ERGO modified gold electrodes can be utilised in the early diagnosis of PKU disease in human whole blood samples. Thus, the proposed sensor system offers a rather easy-to-use, cost-effective, and time-efficient preparation process and most importantly sensitive, selective and highly accurate sensing method.Data availability
Data are available upon request from the authors.Author contributions
Ipek Akyilmaz: investigation, methodology, validation, data curation, formal analysis, writing – original draft. Naim Yagiz Demir: investigation, validation, formal analysis, writing – original draft. Deniz Bas: writing – review & editing, conceptualization. Memed Duman: conceptualization, funding acquisition, writing – review & editing, resources, supervision, project administration.Conflicts of interest
There are no conflicts to declare.Acknowledgements
This study was supported by The Scientific and Technological Research Council of Turkey (TUBITAK, Ankara, Turkey), ARDEB 1003, Project No: 118S047.References
- T. Arakawa, T. Koshida, T. Gessei, K. Miyajima, D. Takahashi, H. Kudo, K. Yano and K. Mitsubayashi, Microchim. Acta, 2011, 173, 199–205, DOI:10.1007/s00604-010-0536-5.
- C. M. Mak, H. C. H. Lee, A. Y. W. Chan and C. W. Lam, Crit. Rev. Clin. Lab. Sci., 2013, 50, 142–162, DOI:10.3109/10408363.2013.847896.
- H. Naruse, Y. Y. Ohashi, A. Tsuji, M. Maeda, K. Nakamura, T. Fujii, A. Yamaguchi, M. Matsumoto and M. Shibata, Screening, 1992, 1, 63–66, DOI:10.1016/0925-6164(92)90030-9.
- H. Shahbaz Mohammadi and E. Omidinia, J. Sci., Islamic Repub. Iran, 2011, 22, 15–20 Search PubMed.
- J. Wang, Biosens. Bioelectron., 2006, 21, 1887–1892, DOI:10.1016/j.bios.2005.10.027.
- E. Omidinia, N. Shadjou and M. Hasanzadeh, IEEE Sens. J., 2014, 14, 1081–1088, DOI:10.1109/JSEN.2013.2292875.
- D. G. Pijanowska and E. Remiszewska, Sensors, 2006, 6, 428–434, DOI:10.3390/s6040428.
- R. Robinson, L. Wong, R. J. Monnat and E. Fu, Micromachines, 2016, 7, 2–11, DOI:10.3390/mi7020028.
- O. M. Istrate, L. Rotariu, V. E. Marinescu and C. Bala, Sens. Actuators, B, 2016, 223, 697–704, DOI:10.1016/j.snb.2015.09.142.
- A. Radoi and D. Compagnone, Bioelectrochemistry, 2009, 76, 126–134, DOI:10.1016/j.bioelechem.2009.06.008.
- M. Sahin and E. Ayranci, Electrochim. Acta, 2015, 166, 261–270, DOI:10.1016/j.electacta.2015.03.030.
- K. Délécouls-Servat, A. Bergel and R. Basséguy, J. Appl. Electrochem., 2001, 31, 1095–1101, DOI:10.1023/A:1012228232202.
- G. Aydoğdu Tığ, Talanta, 2017, 175, 382–389, DOI:10.1016/j.talanta.2017.07.073.
- X. Hu and S. Dong, J. Mater. Chem., 2008, 18, 1279–1295, 10.1039/b713255g.
- A. Gevaerd, E. Y. Watanabe, K. Fernandes, M. A. P. Papi, C. E. Banks, M. F. Bergamini and L. H. Marcolino-Junior, Electroanalysis, 2020, 32, 1689–1695, DOI:10.1002/elan.201900699.
- Y. F. Hu, Z. H. Zhang, H. Bin Zhang, L. J. Luo and S. Z. Yao, Talanta, 2011, 84, 305–313, DOI:10.1016/j.talanta.2011.01.010.
- C. M. Moreira, S. V. Pereira, J. Raba, F. A. Bertolino and G. A. Messina, Clin. Chim. Acta, 2018, 486, 59–65, DOI:10.1016/j.cca.2018.07.016.
- B. R. Adhikari, M. Govindhan and A. Chen, Sensors, 2015, 15, 22490–22508, DOI:10.3390/s150922490.
- R. Kour, S. Arya, S.-J. Young, V. Gupta, P. Bandhoria and A. Khosla, J. Electrochem. Soc., 2020, 167, 037555, DOI:10.1149/1945-7111/ab6bc4.
- S. Jampasa, W. Siangproh, K. Duangmal and O. Chailapakul, Talanta, 2016, 160, 113–124, DOI:10.1016/j.talanta.2016.07.011.
- C. Boero, S. Carrara, G. Del Vecchio, L. Calz and G. De Micheli, Sens. Actuators, B, 2011, 157, 216–224, DOI:10.1016/j.snb.2011.03.053.
- S. Carrara, C. Baj-Rossi, C. Boero and G. De Micheli, Electrochim. Acta, 2014, 128, 102–112, DOI:10.1016/j.electacta.2013.12.123.
- M. L. Mena, P. Yáñez-Sedeño and J. M. Pingarrón, Anal. Biochem., 2005, 336, 20–27, DOI:10.1016/j.ab.2004.07.038.
- C. Y. Chen, P. H. Tsai, Y. H. Lin, C. Y. Huang, J. H. Y. Chung and G. Y. Chen, Mater. Today Bio, 2022, 15, 100326, DOI:10.1016/j.mtbio.2022.100326.
- O. M. Istrate, L. Rotariu, V. E. Marinescu and C. Bala, Sens. Actuators, B, 2016, 223, 697–704, DOI:10.1016/j.snb.2015.09.142.
- E. Omidinia, N. Shadjou and M. Hasanzadeh, IEEE Sens. J., 2014, 14, 1081–1088, DOI:10.1109/JSEN.2013.2292875.
- T. C. Liu, C. Y. Chu, Y. Y. Chen and S. Y. Chen, RSC Adv., 2016, 6, 27614–27622, 10.1039/c6ra01016d.
- M. Eryiğit, E. Çepni, B. Kurt Urhan, H. Öztürk Doğan and T. Öznülüer Özer, Synth. Met., 2020, 268, 116488, DOI:10.1016/j.synthmet.2020.116488.
- A. García-Argumánez, I. Llorente, O. Caballero-Calero, Z. González, R. Menéndez, M. L. Escudero and M. C. García-Alonso, Appl. Surf. Sci., 2019, 465, 1028–1036, DOI:10.1016/j.apsusc.2018.09.188.
- B. A. Mei, J. Lau, T. Lin, S. H. Tolbert, B. S. Dunn and L. Pilon, J. Phys. Chem. C, 2018, 122, 24499–24511, DOI:10.1021/acs.jpcc.8b05241.
- R. D. Crapnell and C. E. Banks, Talanta, 2021, 4, 100065, DOI:10.1016/j.talo.2021.100065.
- A. S. Calvo, C. Botas, D. Martín-Yerga, P. Álvarez, R. Menéndez and A. Costa-García, J. Electrochem. Soc., 2015, 162, B282, DOI:10.1149/2.1021510jes.
- X. Xu, D. Ji, Y. Zhang, X. Gao, P. Xu, X. Li, C. C. Liu and W. Wen, ACS Appl. Mater. Interfaces, 2019, 11, 20734–20742, DOI:10.1021/acsami.9b05431.
- D. J. Weiss, M. Dorris, A. Loh and L. Peterson, Biosens. Bioelectron., 2007, 22, 2436–2441, DOI:10.1016/j.bios.2006.09.001.
- R. Villalonga, A. Fujii, H. Shinohara, S. Tachibana and Y. Asano, Sens. Actuators, B, 2008, 129, 195–199, DOI:10.1016/j.snb.2007.07.097.
- S. M. Naghib, M. Rabiee and E. Omidinia, Int. J. Electrochem. Sci., 2014, 9, 2341–2353 CrossRef.
Footnote |
| † Electronic supplementary information (ESI) available. See DOI: https://doi.org/10.1039/d4ra05045b |
| This journal is © The Royal Society of Chemistry 2024 |