DOI:
10.1039/D4RA05036C
(Paper)
RSC Adv., 2024,
14, 31183-31192
Study on the imbibition production mechanism and main controlling factors of low-permeability reservoir
Received
12th July 2024
, Accepted 17th September 2024
First published on 30th September 2024
Abstract
With high water cuts and high permeability reservoirs entering the middle and late stage, many old oil fields in China are facing the dilemma of oil and gas resource exhaustion, while low-permeability reservoir resources remain very rich. As an oil recovery technology, imbibition displacement plays an important role in the exploitation of low-permeability reservoirs and prolongs the production cycle of old oil fields. Based on the imbibition kinetic equation, the mechanism and process of oil displacement in imbibition recovery are explained in this paper. Based on the characteristics of small particle size and high activity, the influence of temperature, viscosity, permeability, and salinity on the degree of imbibition recovery was studied. The results show that the imbibition production of low-permeability reservoirs mainly depends on capillary force, which firstly drains oil from small pores to large pores, and then drains it by buoyancy. Using nanofluids for imbibition oil recovery, a higher recovery effect of up to 45.59% can be achieved. The change in different external conditions will affect the imbibition recovery effect. The imbibition recovery efficiency increases with the increase in temperature, decreases with the increase in oil viscosity, and increases with the increase in core permeability. The increase in salinity has an inhibiting effect on the imbibition recovery efficiency. Based on the multivariate analysis of variance, the change in permeability has the greatest influence on the degree of imbibition recovery, and the change in viscosity has the least influence on the degree of imbibition recovery.
1. Leading edge
As a non-renewable resource, oil plays an irreplaceable role in China's economy.1 With deepening petroleum exploration and development, due to the limited distribution of conventional oil and gas fields in China, the proportion of exploration and development of low-permeability reservoir resources is increasing. In recent years, the newly discovered reserves of ultra-low-permeability reservoirs have been known to be especially rich. For example, the proved reserves of the ultra-low-permeability reservoir in the Changqing Oilfield of PetroChina account for 70% of the proven reserves of Changqing Oilfield, and the proved ultra-low-permeability reservoir of a Sinopec is mainly distributed in Zhangjiaduo and Ordos areas.2 The exploitation of a tight low-permeability reservoir mainly aims to transfer the crude oil in the matrix from small pores to large fractures and then flow from the fractures to the well. However, due to the low permeability of the matrix, the complexity of the pore throat, and the small pore radius, conventional oil recovery methods cannot meet the requirements. Meanwhile, due to the huge difference in seepage capacity between the matrix and the fracture, traditional water (gas) flooding is prone to cross-flow. The sweep efficiency is reduced, and it is difficult to extract oil.3,4 Therefore, finding and optimizing new technologies and methods suitable for the development of low-permeability tight reservoirs has become an important direction for current research.
Imbibition oil recovery is an important oil recovery technology that plays a significant role in the development of low-permeability tight reservoirs.5 Imbibition oil recovery occurs mainly through the introduction of wetting phase fluid in the matrix. The molecular radius of the fluid must be very small, such as that of nanofluids, to displace the non-wetting phase in it. The wetting phase fluid introduced can not only improve the fluidity and wettability of the crude oil in the pore fractures, but also reduce the interfacial tension of oil and water. This strips the oil droplets off the rock and improves the recovery efficiency. Many scholars across the globe have studied imbibition methods. For example, Zhang and Ge6 studied the influence of contact angle and water absorption rate on the imbibition in shale. Jadhunandan and Morrow7 compared shale cores from different beds and found that the core with a higher oil-wetting angle has a stronger imbibition displacement ability. Li et al.8 studied the law of influence of water saturation, oil–water interfacial tension, wettability, and other factors on imbibition production efficiency through spontaneous imbibition experiments. Through numerical analysis, the dynamic equation of imbibition was derived to explore the mechanism of imbibition oil recovery in a low permeability reservoir. In addition, molybdenum disulfide (MoS2) was selected as the matrix to synthesize a nanomaterial with small particle size and double-sided activity that was higher than that of the conventional spherical, single-sided nanomaterials. An imbibition oil recovery experiment was carried out in a low-permeability reservoir. Based on the analysis of multiple factors of variance, the law of the change in imbibition oil recovery under different external conditions was explored. It provided data support and a theoretical basis for the subsequent field application of low-permeability tight reservoirs.
2. Study of the imbibition mechanism
2.1 Imbibition mechanism
Imbibition refers to the process in which the liquid in the wetting phase displaces the liquid of the non-wetting phase by relying on the pressure difference of the two contact surfaces in the absence of the external pressure difference of the porous medium.9
The pores of the rock blocks in the formation are simulated by capillary tubes. If there is only a two-phase fluid of oil and water in the capillary tubes, a curved interface will be generated between the oil and water. As most rocks in underground reservoirs are hydrophilic but very few of them are oil-wet, the curvature of the oil–water interface is dictated by the different wettability of rocks to oil and water.10,11 Water is the wetting phase, oil is the non-wetting phase, the oil–water interface will be concave to the oil phase side or convex to the water phase side, and the pressure on the oil phase side is higher than that on the water phase side, that is, the higher part is just balanced by the capillary pressure to ensure that the oil–water interface remains static. The capillary pressure is directed toward the non-wetting phase,12 and the mechanical conditions of oil–water interface equilibrium are shown in eqn (1).
where
po is the oil phase side pressure;
pw is the water phase side pressure, and
pc is the capillary pressure (
Fig. 1).
 |
| | Fig. 1 Distribution of oil and water in the capillary tubes. | |
2.2 Capillary force
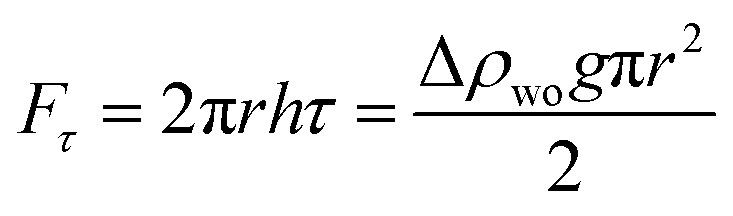
Capillary force is a non-negligible force involved in the imbibition process, which is generated by the additional pressure caused by the difference between the liquid levels of the two phases.13 The relationship between the additional pressure, interfacial tension, and radius of the curvature can be determined from the Young–Laplace equation. The equation for the capillary pressure can be obtained as follows:| |
 | (2) |
where pc is the capillary force, MPa; σ is the oil–water interfacial tension, mN m−1; r is the capillary force radius, m; θ is the contact angle, °.
It can be seen from the above eqn (2) that the capillary force is inversely proportional to the pore radius. Low-permeability tight reservoirs have a small pore radius. Under the same wetting phase and interfacial tension, the capillary force in tight reservoirs has a stronger effect and can be several times that of atmospheric pressure.14,15 For example, at the pore scale of a low-permeability tight reservoir, assuming that the oil–water interfacial tension is 0.5 mN m−1 and the capillary force radius is 20 nm, the capillary force can reach 0.05 MPa when substituted into eqn (2). Similarly, when the capillary radius is 500 nm, the capillary force can reach 0.002 MPa, as shown in Table 1 below. The capillary force plays an important role in the whole imbibition oil recovery process and cannot be ignored (Fig. 2).
Table 1 Data table of capillary pressure variation with capillary radius
| Capillary radius (×10−9 m) |
Capillary pressure (MPa) |
| 20 |
0.05 |
| 30 |
0.033333333 |
| 40 |
0.025 |
| 50 |
0.02 |
| 60 |
0.016666667 |
| 80 |
0.0125 |
| 100 |
0.01 |
| 120 |
0.008333333 |
| 140 |
0.007142857 |
| 160 |
0.00625 |
| 180 |
0.005555556 |
| 200 |
0.005 |
| 220 |
0.004545455 |
| 240 |
0.004166667 |
| 260 |
0.003846154 |
| 280 |
0.003571429 |
| 300 |
0.003333333 |
| 320 |
0.003125 |
| 340 |
0.002941176 |
| 360 |
0.002777778 |
| 380 |
0.002631579 |
| 400 |
0.0025 |
| 420 |
0.002380952 |
| 440 |
0.002272727 |
| 460 |
0.002173913 |
| 480 |
0.002083333 |
| 500 |
0.002 |
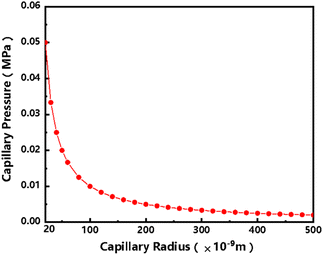 |
| | Fig. 2 Relationship between capillary radius and capillary pressure. | |
In imbibition-based oil production in low-permeability tight reservoirs, under the rock formation, oil is mainly driven from small pores to large pores through capillary forces. At this time, the upper and lower ends of the large pores are in contact with water, and the capillary forces at both ends are equal in magnitude but opposite in direction, canceling each other and preventing the movement of oil. Oil moves upward under the action of buoyancy and eventually flows to the oil well,16–18 as illustrated in Fig. 3 below. In actual imbibition oil production, the pre-imbibition process does not occur, because rock blocks cannot be 100% saturated with oil; there is little or no oil in small pores, but bound water exists and thus, most of the oil is in large pores, and the post-imbibition process becomes the initial state of imbibition.19,20
 |
| | Fig. 3 Schematic diagram of the imbibition oil recovery process. | |
2.3 Imbibition stage division
During the whole process of imbibition in low-permeability tight oil reservoirs, four forces are experienced: inertia, gravity, viscous force, and capillary force. The imbibition process can be divided into the early stage and the late stage by dividing the time before and after the imbibition process.21
① Early stage: at this stage, the wetting phase fluid has just entered the capillary, and the viscous force is small. At this time, the wetting phase fluid flows under the action of the capillary force and inertia.22 With the gradual deepening of the wetting phase fluid in the matrix pores, the capillary force increases, while the viscous force produced by the contact between the fluid and the pore wall also increases gradually, and the inertial force weakens. At this time, the wetting phase fluid flows under the combined action of the capillary force and the viscous force.23 These two flow states are collectively referred to as the early stage.
② Late stage: during this stage, the imbibition height increases. The action of gravity on the wetting phase fluid itself cannot be ignored, whose influence can exceed the viscous force. The wetting phase fluid flows under the combined action of viscous force, gravity, and capillary force.24 When the gravity and capillary force generated by the imbibition height reach the equilibrium height of hydrostatic pressure, the liquid level fluctuates up and down at the hydrostatic height h, and finally, reaches the state of static equilibrium.25 These two flow states are collectively referred to as the late stage.
2.4 Imbibition dynamic equation
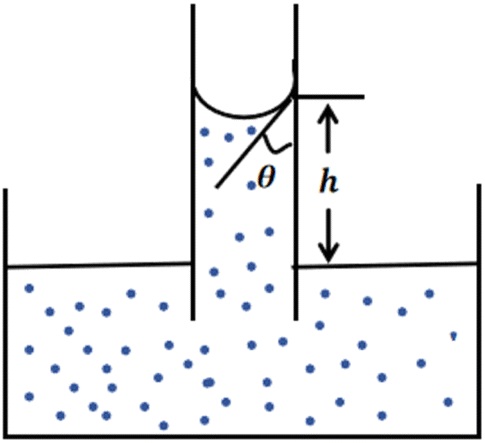
In the imbibition process, the capillary force can be either the driving force or the resistance. When the wetting phase is used to displace the non-wetting phase, the capillary force is the driving force, which constitutes the imbibition process. When the non-wetting phase is used to displace the wetting phase, the capillary force is the resistance, constituting the displacement process.26 In this paper, only the process of capillary force as the driving force has been explored, i.e., the imbibition process. Assuming that a single capillary structure is shown in Fig. 4, the wetting phase fluid will be subjected to four forces during the imbibition process, including the capillary force, inertial force, viscous resistance, and its own gravity. The analysis of these forces is as follows.
 |
| | Fig. 4 Vertical capillary imbibition model. | |
According to the Young–Laplace equation, the capillary driving force Fc that is generated in a hydrophilic capillary with radius r can be expressed as follows:
| |
Fc = πr2pc = 2πrσ![[thin space (1/6-em)]](https://www.rsc.org/images/entities/char_2009.gif) cosθ cosθ
| (3) |
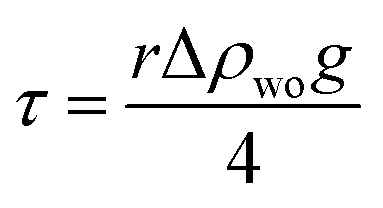
According to Newton's law of internal friction, the shear friction generated by the fluid on the capillary wall is:
| |
 | (4) |
where
τ is the frictional shear force;
v is the imbibition velocity;
μ is the proportional coefficient of fluid viscosity; and
r is the capillary radius.
According to Hagen–Poiseuille's law, when a fluid moves in a horizontal tube, the imbibition velocity is:
| |
 | (5) |
where
v is the imbibition velocity;
μ is the proportional coefficient of fluid viscosity; Δ
p is the pressure difference (Δ
p = Δ
ρwogh);
h is the imbibition height; and Δ
ρwo is the difference in oil–water phase density.
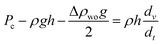
Substituting (5) into formula (4), the frictional shear force of the tube wall came out to be  . Therefore, the viscous resistance of the tube wall fluid is:
| |
 | (6) |
The gravity of the fluid itself is expressed as follows:
Imbibition of oil production by incompressible fluid in capillaries satisfies Newton's second law: ∑F = ma, so the imbibition kinetic equation is:
where
m =
ρπ
r2h, the above formula
(2),
(3),
(6), and
(7) into the formula
(8), sorting can be obtained
| |
 | (9) |
In
eqn (9), from left to right, there is capillary force, gravity, viscous resistance, and inertial force, where the capillary force is the imbibition force, and gravity and viscous force are the imbibition resistance.
We can see from eqn (5) and (9) that the imbibition rate is related to fluid viscosity and pore radius in the imbibition process. The effect of imbibition power is related to the difference in oil–water density. The smaller the radius, the larger the viscosity, the smaller the flow speed, and the longer the imbibition time. The greater the difference between oil and water density, the greater the viscous resistance, the lower the overall imbibition force, and the lower the imbibition recovery effect.
In practice, the imbibition recovery process of a low-permeability tight reservoir can be regarded as a collection of the above several capillary single-tube imbibition effects. According to the imbibition dynamic equation, the capillary force is the essential dynamic force behind imbibition, and the changes in other parameters in the equation affect the imbibition process. In the actual oil recovery process, external forces can often be used to improve the imbibition recovery efficiency. There are many methods to increase the imbibition recovery efficiency, such as water injection (gas) to increase the two-phase pressure difference or reduce the viscosity to improve the recovery efficiency.27 At the same time, there are many factors affecting the imbibition recovery efficiency. No matter how it is changed, the recovery efficiency is affected by changing some parameter factor in the imbibition dynamic equation. The main controlling factors affecting imbibition recovery are discussed in four ways.
3. Research on the main factors controlling imbibition oil recovery
It can be seen from the imbibition kinetic equation that the change in any of the influencing factors will certainly impact imbibition, such as temperature change, molecular movement intensification, altered flow rate, changed viscosity and permeability, increase in pore radius, and altered capillary force. Changes in salinity and fluid concentration affect the efficiency of oil washing.28 In a word, imbibition recovery efficiency is comprehensively affected by the reservoir, environmental conditions, operating parameters, and other factors.29 The following is a detailed discussion and study of these four aspects, including temperature, crude oil viscosity, permeability, and salinity. The factor with the greatest weight as an influencing factor is analyzed to provide certain theoretical guidance to subsequent research on other influencing factors in imbibition experiments.
3.1 Experimental materials
3.1.1 Experimental reagents. Nanofluids: self-made (the experiment utilized 0.05% nano black card material, 2% stabilizer, and 2% curing agent, mixed with deionized water to prepare the nanofluid. First 2% stabilizer and 2% curing agent were mixed and stirred by the magnetic agitator until the solution was mixed evenly. After the addition of 0.05% nano black card material, the mixture was stirred again until it was completely mixed). Deionized water, Chengdu Synanxingye Chemical Co., LTD; sodium chloride (analytical pure), Aladdin Biochemical Technology Co., LTD; calcium chloride (analytical pure), Aladdin Biochemical Technology Co., LTD; Kerosene, Ankfrei Fluid Technology Co., LTD; crude oil, Xi'an Petroleum Big Oil and Gas Technology Co., LTD
3.1.2 Experimental instruments. Imbibition bottle: customized, Lubei Glass Factory, Hubei County; HJ-2 Multi-head magnetic stirrer, Shanghai Fangrui Instrument Co., LTD; 2XZ type electrode rotary vane vacuum pump, Dongguan Bolide Instrument Equipment Co., LTD; 2PB type advection pump, Beijing Star Technology Development Co., LTD; 101 types electric blast drying oven, Beijing Kewei Yongxing Instrument Co., LTD; DQT-2 high-pressure micro displacement device, Nantong Tenghua Petroleum Technology Co., LTD; BSA124S electronic balance, Wuxi Ling'en Electromechanical Equipment Co., LTD; vernier caliper; glass rod, beaker: several.
3.1.3 Experimental core. This study dealt with natural outcrop sandstone. The lithology was silt-fine sandstone, and its composition is lithic feldspar sandstone. The sandstone particles are closely arranged, and the pores are mainly intergranular and dissolution pores. The reservoir has good physical properties and strong hydrophilicity (Table 2).
Table 2 Basic physical property parameters of the experimental core
| Number |
Core length/cm |
Core diameter/cm |
Oil quality before saturation/g |
Oil after saturation quality/g |
Pore volume/cm3 |
Void ratio/% |
Permeability/10−3 μm2 |
| 1# |
5 |
2.5 |
57.38 |
59.90 |
2.74 |
11.17 |
2.5 |
| 2# |
5 |
2.5 |
57.90 |
60.12 |
2.41 |
9.82 |
2.5 |
| 3# |
5 |
2.5 |
56.59 |
59.16 |
2.79 |
11.37 |
2.5 |
| 4# |
5 |
2.5 |
57.14 |
59.78 |
2.87 |
11.70 |
2.5 |
| 5# |
5 |
2.5 |
57.24 |
59.80 |
2.78 |
11.33 |
2.5 |
| 6# |
5 |
2.5 |
58.79 |
61.41 |
2.85 |
11.62 |
2.5 |
| 7# |
5 |
2.5 |
58.71 |
61.69 |
3.24 |
13.21 |
2.5 |
| 8# |
5 |
2.5 |
58.57 |
61.69 |
3.39 |
13.82 |
2.5 |
| 9# |
5 |
2.5 |
58.35 |
61.36 |
3.27 |
13.33 |
2.5 |
| 10# |
5 |
2.5 |
58.70 |
61.41 |
2.95 |
12.03 |
2.5 |
| 11# |
5 |
2.5 |
58.52 |
61.54 |
3.28 |
13.37 |
0.5 |
| 12# |
5 |
2.5 |
58.58 |
61.60 |
3.28 |
13.37 |
1.0 |
| 13# |
5 |
2.5 |
58.45 |
61.45 |
3.26 |
13.29 |
2.50 |
| 14# |
5 |
2.5 |
58.81 |
61.61 |
3.04 |
12.39 |
10.0 |
| 15# |
5 |
2.5 |
58.25 |
61.28 |
3.29 |
13.41 |
25.0 |
| 16# |
5 |
2.5 |
58.52 |
61.54 |
3.28 |
13.37 |
2.5 |
| 17# |
5 |
2.5 |
58.58 |
61.60 |
3.28 |
13.37 |
2.5 |
| 18# |
5 |
2.5 |
58.45 |
61.45 |
3.26 |
13.29 |
2.5 |
| 19# |
5 |
2.5 |
58.81 |
61.61 |
3.04 |
12.39 |
2.5 |
| 20# |
5 |
2.5 |
58.72 |
61.69 |
3.23 |
13.17 |
2.5 |
3.2 Experimental methods
The Amott imbibition bottle method was used to carry out the core imbibition oil recovery experiment, as shown in Fig. 5. Imbibition experiments were carried out under different conditions to observe and record the volume of crude oil discharged through imbibition in the imbibition bottle at different times. The imbibition recovery rate was calculated at different times, and then the weight of each influencing factor was determined based on a multivariate analysis of variance.
 |
| | Fig. 5 Amott imbibition bottle method. | |
Specific experimental steps of imbibition oil recovery were as follows: ① the core was pretreated and dried, and its length, diameter, and dry weight were recorded.30 ② The saturated oil was vacuumed, and the saturated oil amount was calculated and denoted as V. ③ The core saturated with crude oil was placed into the imbibition bottle, and nanofluid was added to the imbibition bottle above the 0 scale line. ④ After tying the hose of the imbibition bottle with a rubber band, it was placed in the oven at a preset temperature, and the output of imbibition was recorded at regular intervals.31 ⑤ After one week, the imbibition bottle was removed and the final imbibition recovery was recorded as V1. ⑥ Data were sorted out and the imbibition recovery rate was calculated by eqn (10).
| |
 | (10) |
where
Ior represents the imbibition recovery rate, %;
V1 represents imbibition production fluid volume, mL;
V stands for core saturated oil, mL.
3.3 Results and discussion
3.3.1 Imbibition harvest effect at different temperatures. The experimental conditions are as follows: Cores 1# to 5# were selected in the experiment, and the completed inverted nanofluid imbibition bottles were placed on the 0 scale line in a constant temperature equipment at 40 °C, 60 °C, 70 °C, 80 °C, and 90 °C, respectively. The experiment was managed according to the method described in Section 2.2; the imbibition recovery was observed and recorded, and the experimental results were obtained as shown in Fig. 6 below.
 |
| | Fig. 6 Core imbibition recovery curve under different temperature conditions. | |
As shown in Fig. 6, when the temperature is 40 °C, the imbibition recovery rate reaches 24.8%. When the temperature rises to 90 °C, the ultimate imbibition recovery efficiency reaches 41.8%, indicating that the imbibition recovery efficiency increases gradually with an increase in temperature. In the initial 3 days, the imbibition rate is the fastest; in addition, the higher the temperature, the faster the initial rate and the slower the imbibition rate becomes. Finally, the imbibition rate becomes stable until there is no oil precipitation. The analysis shows that under the same core matrix condition, oil droplets in the core pores precipitate rapidly around the surface of the matrix at the initial stage under the action of gravity and elastic potential energy. The higher the temperature, the faster the migration rate of small molecular oil droplets. Therefore, the higher the initial temperature, the faster the initial rate. Combined with the reference imbibition kinetic equation, multiple parameters change with an increase in temperature. First of all, as we all know, rock is a poor thermal conductor, heat expands it and cold contracts it. When the temperature changes, the internal skeleton of the core undergoes slight deformation, resulting in a rupture and formation of a smaller gap, that is, the pore radius decreases, the capillary pressure increases, and the imbibition power is enhanced, improving the imbibition effect. Secondly, with the increase in temperature, the polymer hydrocarbons adsorbed on the surface of the oil-wet rock are desorbed from the rock surface, leaving a large amount of water adsorbed on the rock surface. At the same time, the surface energy of the water-wet rock will be reduced, the contact angle will become smaller, the rock will be wetter, and the hydrophilicity of the rock will be enhanced, making the crude oil in the pores easier to be extracted.32 Finally, with the increase in temperature, the viscosity of crude oil in pores decreases, the flow capacity increases, the molecular migration rate of the oil droplets accelerates, and the imbibition efficiency increases.
3.3.2 Harvest effect of imbibition under different viscosity. The experimental conditions are as follows: Cores 6# to 10# were selected for the experiment, and the configured nanofluids were poured into the imbibition bottle saturated with crude oil of different viscosities (i.e., 2 mPa s, 5 mPa s, 10 mPa s, 15 mPa s, 30 mPa s). The solution was inverted on the 0 scale line and placed in the constant temperature equipment at 60 °C. The experiment was conducted according to the method described in Section 2.2. The imbibition recovery was observed and recorded, and the experimental results are shown in Fig. 7.
 |
| | Fig. 7 Core imbibition recovery curve under different viscosity conditions. | |
It can be seen from the experimental results in Fig. 7 that when the core saturated crude oil viscosity is 2 mPa s, the imbibition recovery rate is 35.7%. When the core saturated crude oil viscosity is 10 mPa s, the imbibition recovery rate is 30.2%. When the viscosity of saturated crude oil is 30 mPa s, the imbibition recovery rate is 24.5%, indicating that with the increase in oil viscosity, the imbibition recovery rate decreases. In the initial 3 days, the imbibition recovery rate is faster, and the viscosity is lower. The faster the rate, the slower the imbibition rate gradually becomes, and finally, it tends to stabilize until there is no oil precipitation. These trends show that the increase in viscosity of crude oil makes the removal of oil droplets from pores more difficult, and the migration resistance is increased. In addition, the entrance of nanofluids into the small pores also becomes difficult, and the role of capillary force is reduced. The effective swept area of the fluid is reduced, and the recovery efficiency is reduced. Therefore, reservoirs with low permeability and large viscosity are not conducive to imbibition recovery methods, and appropriate recovery methods should be selected.
3.3.3 Imbibition recovery effect under different permeability. The experimental conditions are as follows: Cores 11# to 15# were selected in the experiment, and the configured nanofluids were poured into imbibition bottles containing cores with different permeabilities, respectively. The solution was placed above the scale line of the imbibition bottle in a constant temperature device at 60 °C for the experiment. The experiment was conducted according to the method described in Section 2.2. The imbibition recovery was observed and recorded, and the experimental results were obtained as shown in Fig. 8 below.
 |
| | Fig. 8 Core imbibition recovery curve under different permeability conditions. | |
As shown in Fig. 8, when the core permeability is 0.5 mD, the imbibition recovery rate is 29.57%. When the core permeability is 2.5 mD, the imbibition recovery rate is 33.74%. When the core permeability is 25 mD, the imbibition recovery rate is 45.57%. These trends show that the imbibition recovery rate increases with an increase in core permeability. In the initial 3 days, the imbibition effect is faster with a higher core permeability and a faster imbibition rate. Later, the imbibition rate gradually slows down, and eventually, it tends to stabilize until there is no oil precipitation. The analysis shows that, at the beginning, oil droplets around the core surface precipitate rapidly under the action of gravity and elastic potential energy. As more oil is stored around the core with high permeability, the initial precipitation becomes faster. Secondly, the higher the permeability, the more oil is saturated. With the passage of imbibition time, the volume of crude oil self-imbibes and discharged by the buoyancy caused by capillary pressure and gravity differentiation, increasing the imbibition recovery rate. However, some scholars have shown that the smaller the permeability, the higher the degree of imbibition recovery. The main reason for the analysis presented in this study is that the imbibition recovery is affected by the pore throat radius. The lower the permeability, the smaller the pore throat radius of the rock, the greater the capillary pressure, and thus, the higher the imbibition recovery efficiency. However, this result is because the radius of the wetting phase fluid entering the pore of the rock is small enough under the ideal pore radius. It can spread to the reservoir in the smallest pore radius of the rock and displace the oil droplets in it. However, under actual conditions, the depth of the wetting phase fluid that enters is limited, and most of it cannot reach the reservoir via the smallest pore radius. Most of the minimum radius under the actual formation stores the bound water, and thus, there is basically no oil. Even if the oil enters the pores with a small radius, the capillary force increases. Under such conditions, the oil is difficult to extract. Therefore, for normal imbibition recovery, the higher the permeability, the better the imbibition recovery effect.
3.3.4 Imbibition recovery effect under different salinity. The experimental conditions are as follows: Cores No. 16# to 20# were selected for the experiment, and the nano-fluids with different mineralizations (1000, 3000 mg L−1, 5000 mg L−1, 7000 mg L−1, 10000 mg L−1) were poured into the imbibition bottle above the 0 scale line. They were then placed in a constant temperature equipment at 60 °C for the experiment. The experiment was conducted according to the method mentioned in Section 2.2, and the imbibition recovery was observed and recorded. The experimental results are shown in Fig. 9.
 |
| | Fig. 9 Curve of the core imbibition recovery under different salinity conditions. | |
As shown in Fig. 9, when the salinity is 1000 mg L−1, the imbibition recovery rate is 36.5%. When the salinity is 5000 mg L−1, the imbibition recovery rate is 29.45%. When the salinity is 10000 mg L−1, the imbibition recovery rate is 23.4%, indicating that with the increase in salinity, the imbibition recovery rate decreases, and the increase in salinity is not conducive to imbibition recovery. This is because the increased salinity worsens the stability of the nanofluid solution and reduces the electrostatic repulsion between the hydrophilic groups of the nanofluid solution. In addition, it enhances the accumulation of the nanofluid at the pore interface, which is not conducive to the further diffusion of the nanofluid into the deeper pore channels. Therefore, overall, the imbibition recovery effect becomes worse. In addition, with an increase in salinity, inorganic salt ions accumulate in the solution, preventing the contact between the oil phase and the nanofluid molecules, reducing the wetting effect of the nanofluid, which is not conducive to the precipitation of oil droplets from the core it also reduces the imbibition efficiency.
3.3.5 Weight analysis of influencing factors based on multivariate analysis of variance. Multivariate analysis of variance is an analytical method to study whether multiple control variables have an impact on observed variables, as well as consider the total variation in the observed variables and each influencing factor as the sub-variation to find the proportion of each sub-variation in the total variation.33In multifactor analysis of variance, the change in the observed variable value is mainly affected by three aspects. First, the influence of the independent action of the control variable refers to the influence of the independent action of a single control variable on the observed variable. The second is the influence of the interaction of control variables, which refers to the influence of multiple control variables on the observed variables after collocation; the third is the influence of random factors, which mainly refers to the influence brought by sampling error.34 However, this paper only analyzes the independent influence of each factor and does not consider the influence of interaction. Based on the above principles, this paper takes four aspects of temperature, viscosity, permeability, and salinity as sub-variation. In addition, we consider imbibition recovery efficiency as the total variation, but do not consider the influence of interaction error. We use the multivariate analysis of variance to carry out a weight analysis of each influencing factor and summarize the influence of each factor on the imbibition rule of the low-permeability reservoir. There are three steps to determine the weight of each factor.
Step 1: identify the factors.35 The imbibition rule of low-permeability reservoir was analyzed to determine the observation factors. With imbibition recovery as the observation variable and each influencing factor as a sub-variable, there are four groups of sub-variables with 5 observation values in each group. This means that there was an observation value in the sample, and the corresponding series were formed from the experimental data. The reference series were formed by the imbibition recovery and the comparative series by influencing factors. The influencing factors are divided into four groups: A, B, C, and D in a sequence. The formulas of the reference series and the comparison series are as follows:
| | |
y1 = {y11, y12, y13, … y1j}
| (11) |
| | |
yi = {yi1, yi2, yi3,…, yij
| (12) |
i = 1,2,3,4;
j = 1,2,3,3,5.
Step 2: analysis of variance.35 The degrees of freedom and the decomposition of the sum of squares were determined for the observed values of each group. Imbibition efficiency was considered as the total variation. There were nk observed values with nk − 1 degree of freedom. The degree of freedom of each influencing factor was k − 1. Random error, as error variation, has a degree of freedom of n(k − 1). Decomposition of the sum of squares: total sum of squares = sum of squares between groups + sum of squares within groups were expressed as follows:
| | |
SST = SSA + SSB + SSC + SSD + SSe
| (13) |
Among them, the formula to calculate the sum of squares was as follows:
| |
 | (14) |
| |
 | (19) |
where SS
T is the total variance; SS
A, SS
B, SS
C, and SS
D are sub-variables caused by the independent action of control variables
A,
B,
C, and
D, respectively; SS
e is the error variable caused by random factors;
ȳ1,
ȳ2,
ȳ3, and
ȳ4 is the mean value of each group;
ȳ is the total mean of each group;
yij represents the observation at the
ith level at the
jth level;
T is the sum of all observations.
Step 3: F-test.35 That is the test of statistics that compares the inter-group and the intra-group variance by calculating F-values. It judges the proportion of each sub-variation in the total weight of observations.
| |
 | (20) |
where
x represents each control variable
A,
B,
C,
D;
sx2 is the mean square between groups;
se2 is the mean square within groups.
According to the above analysis, the results of the inter-agent effect test are obtained, as shown in Table 3 and Fig. 10 below.
Table 3 Test results of the inter-agent effecta
| Source of variation |
Sum of squares (SS) |
Degrees of freedom (DF) |
Mean square (MS) |
F-Value |
| A stands for temperature, B stands for viscosity, C stands for permeability, and D stands for salinity. |
| A |
151 |
3 |
50.33 |
2.362 |
| B |
73.48 |
3 |
24.49 |
1.149 |
| C |
217 |
3 |
72 |
3.379 |
| D |
90.35 |
3 |
30.12 |
1.413 |
| Error value |
147.17 |
7 |
21.31 |
|
 |
| | Fig. 10 Results of the F-value test. | |
According to the test results of the F-value in Fig. 10, the changes in all the factors have an impact on the imbibition recovery efficiency. Additionally, the degree of influence of the change in each single factor on the imbibition recovery efficiency is in the order of C > A > D > B from the largest to the smallest. In other words, in the imbibition recovery of a low-permeability reservoir, permeability holds the greatest proportion of weight and the largest influence on the degree of imbibition recovery, which is higher than that of temperature, salinity, and viscosity. Therefore, in the process of imbibition oil recovery, permeability is the main influencing factor.
4. Conclusion
(1) Imbibition is one of the most effective methods in the production of oil from low-permeability tight reservoirs. It was determined from the imbibition kinetic equation that the capillary force is the main driving force in the imbibition process, and the change in any parameter in the equation impacts the imbibition recovery effect. In the imbibition production that occurs in rock, oil droplets in small pores are first discharged to large pores by capillary force, and then, they are discharged through fractures by buoyancy force.
(2) In the process of imbibition recovery in a low-permeability tight reservoir, a nanofluid is used for imbibition recovery. Under different influencing factors, a better imbibition recovery effect can be obtained. The maximum imbibition recovery rate is 45.59%, and the minimum imbibition recovery rate is 23.4%.
(3) In the process of imbibition production in a low-permeability tight reservoir, the change in various influencing factors affects the imbibition. The imbibition recovery efficiency increases with an increase in temperature. The oil viscosity increases and the imbibition recovery efficiency decreases. With the increase in core permeability, the imbibition recovery effect is improved. The change in salinity has an inhibitory effect on imbibition efficiency, and the higher the salinity, the worse the imbibition effect.
(4) Based on the multivariate analysis of variance, the order of weight of the influencing factors is the order of permeability > temperature > salinity > viscosity. The change in permeability has the greatest influence on the degree of imbibition recovery, and the change in viscosity has the least influence on the imbibition effect.
Data availability
All relevant data are presented in the paper.
Conflicts of interest
There are no conflicts to declare.
Acknowledgements
The Graduate Innovation Fund Project of Xi'an Shiyou University (number: YCX2413064); the Natural Science Basic Research Program of Shaanxi Province (number: 2024JC-YBQN-0426); the China Postdoctoral Science Foundation (number: 2023MD744257); the State-sponsored Postdoctoral Researcher program (number: GZC20232142); and the Shanxi Province Postdoctoral Research Project (number: 2023BSHTBZZ45).
References
- D. C. Standnes, Analysis of oil recovery rates for spontaneous imbibition of aqueous surfactant solutions into preferential oil-wet carbonates by estimation of capillary diffusivity coefficients, Colloids Surf., A, 2004, 251(1–3), 93–101 CrossRef CAS
 .
. - E. R. Brownscombe and A. B. Dyes. Waterimbibition displacement, a possibility for the spraberry, Drill and Prod. Prac. API, 1952, vol. 7, 5, pp. 383–390 Search PubMed .
- J. Thomas and K. Metin, Dependence of Waterflood Remaining Oil Saturation on Relative Permeablility ,CapillaryPressure , and Reservior Parameters in Mixed Wet, Turbidite Sands. SPE30763, 1995 Search PubMed .
- Z. Karpyn, P. M. Thalleck and A. S. Grader, An experimental study of spontaneous imbibition in fractured sandstone with contrasting sedimentary layers, J. Pet. Sci. Eng., 2009, 67(1), 48–56 CrossRef CAS .
- M. Pordel Shahri, M. Jamialahmadi and S. R. Shadizadeh, New normalization index for spontaneous imbibition, J. Pet. Sci. Eng., 2012, 82–83, 130–139 CrossRef CAS .
- Y. Zhang, H. Ge, Y. Shen, L. Jia and J. Wang, Evaluating the potential for oil recovery by imbibition and time-delay effect in tight reservoirs during shut-in, J. Pet. Sci. Eng., 2020, 184, 106557 CrossRef CAS .
- P. P. Jadhunandan and N. R. Morrow, Spontaneous imbibition of water by crude oil/brine/rock systems, In Situ, 1991, 15(4), 319 CAS .
- J. Wang, H. Liu, G. Qian, Y. Peng and Y. Gao, Investigations on spontaneous imbibition and the influencing factors in tight oil reservoirs, Fuel, 2019, 236, 755–768 CrossRef .
- P. Fakcharoenphol, B. Kurtoglu, H. Kazemi, S. Charoenwongsa and Y.-S. Wu, The Effect of Osmotic Pressure on Improve Oil Recovery from Fractured Shale Formations[C], Proceedings of the SPE Unconventional Resources Conference, Woodlands, TX, April 1–3, 2014 Search PubMed .
- Z. Zhou, T. Teklu, X. Li and A. Hazim, Experimental study of the osmotic effect on shale matrix imbibition process in gas reservoirs, J. Nat. Gas Sci. Eng., 2018, 49, 1–7 CrossRef .
- H. Dehghanpour, Q. Lan, Y. Saeed, H. Fei and Z. Qi, Spontaneous Imbibition of Brine and Oil in Gas Shales: Effect of Water Adsorption and Resulting Microfractures, Energy Fuels, 2013, 27, 3039–3049 CrossRef CAS .
- H.-K. Ge, L. Yang, Y.-H. Shen, K. Ren, F.-B. Meng, W.-M. Ji and S. Wu, Experimental investigation of shale imbibition capacity and the factors influencing loss of hydraulic fracturing fluids, Pet. Sci., 2015, 12, 636–650 CrossRef CAS .
- S. Liu, J. Ni, X. Wen, X. Liu, Z. Huang, D. Zhou and P. Ren, Adual-porous and dual-permeable media model for imbibition in tight sandstone reservoirs, J. Pet. Sci. Eng., 2020, 194, 107477 CrossRef CAS .
- Z. Zhou, H. Abass, X. Li, D. Bearinger and W. Frank, Mechanisms of imbibition during hydraulic fracturing in shale formations, J. Pet. Sci. Eng., 2016, 141, 125–132 CrossRef CAS .
- S. Ahmadi, M. Hosseini, E. Tangestani, S. E. Mousavi and M. Niazi, Wettability alteration and oil recovery by spontaneous imbibition of smart water and surfactants into carbonates, Pet. Sci., 2020, 17, 712–721 CrossRef .
- K. Wu, Z. Chen, J. Li, J. Xu, K. Wang, S. Wang, X. Dong, Z. Zhu, Y. Peng, X. Jia and X. Li, Manipulating the flow of nanoconfined water by temperature stimulation, Angew. Chem., Int. Ed., 2018, 57, 8432–8437 CrossRef CAS PubMed .
- W. Kuang, S. Saraji and M. Piri, Nanofluid-Induced Wettability Gradient and Imbibition Enhancement in Natural Porous Media: A Pore-scale Experimental Investigation, Transp. Porous Media, 2020, 134, 593–619 CrossRef CAS .
- M. Zhao, X. Song, W. Lv, Y. Wu and C. Dai, The preparation and spontaneous imbibition of carbon-based nanofluid for enhanced oil recovery in tightreservoirs, J. Mol. Liq., 2020, 313, 113564 CrossRef CAS .
- H. Dehghanpour, H. Zubair and A. Chhabra, et al., Liquid intake of organic shales, Energy Fuels, 2012, 26(9), 5750–5758 CrossRef CAS .
- Y. Hu, C. Zhao and J. Zhao, et al., Mechanisms of fracturing fluid spontaneous imbibition behavior in shale reservoir: A review, J. Nat. Gas Sci. Eng., 2020, 82, 139–155 Search PubMed .
- M. J. Barnaji, P. Pourafshary and M. R. Rasaie, Visual investigation of the effects of clay minerals on enhancement of oil recovery by low salinity water flooding, Fuel, 2016, 184, 826–835 CrossRef CAS .
- H.-K. Ge, L. Yang, Y.-H. Shen, K. Ren, F.-B. Meng, W.-M. Ji and S. Wu, Experimental investigation of shale imbibition capacity and the factors influencing loss of hydraulic fracturing fluids, Pet. Sci., 2015, 12, 636–650 CrossRef CAS .
- M. Mehana and M. M. Fahes, Investigation of Double Layer Expansion in Low-Salinity Waterflooding: Molecular Simulation Study[C], Proceedings of the SPE Western Regional Meeting; Garden Grove, CA, April 22–26, 2018; DOI:10.2118/190106-MS .
- R. David and A. W. Neumann, A theory for the surface tensions and contact angles of hydrogen-bonding liquids, Langmuir, 2014, 30, 11634–11639 CrossRef CAS PubMed .
- R. Sedev, The molecular-kinetic approach to wetting dynamics: Achievements and limitations, Adv. Colloid Interface Sci., 2015, 222, 661–669 CrossRef CAS PubMed .
- Z. Meng, S. Yang, L. Wang, Z. Wang, K. Qian, H. Lei, Q. Ma and M. Wang, A Novel Model for Pore-Scale Spontaneous Imbibition Accounting for Fluid Viscosities, Proceedings of the SPE Reservoir Characterisation andSimulation Conference and Exhibition, Abu Dhabi, United Arab Emirates, May 8–10, 2017, DOI:10.2118/186039-MS .
- R. Gupta and K. K. Mohanty, Temperature Effects on Surfactant-Aided Imbibition Into Fractured Carbonates, SPE J., 2010, 15, 587–597 CrossRef CAS .
- X. Zhang, N. R. Morrow and S. Ma, Experimental verification of a modifiedscaling group for spontaneous imbibition, SPE Reservoir Eng., 1996, 11, 280–285 CrossRef CAS .
- S. Ahmadi, M. Hosseini, E. Tangestani, S. E. Mousavi and M. Niazi, Wettability alteration and oil recovery by spontaneous imbibition of smart water and surfactants into carbonates, Pet. Sci., 2020, 17, 712–721 CrossRef .
- S. Strand, T. Puntervold and T. Austad, Effect of temperature on enhanced oilrecovery from mixed-wet chalk cores by spontaneous imbibition and forceddisplacement using seawater, Energy Fuels, 2008, 22, 3222–3225 CrossRef CAS .
- T. Austad and D. C. Standnes, Spontaneous imbibition of water into oil-wet carbonates, J. Pet. Sci. Eng., 2003, 39, 363–376 CrossRef CAS .
- L. Xia-Qing, Z. Xing and L. Zhan-Guo, et al., Main controlling factors of imbibition production in low permeability reservoir, Pet. Geol. Recovery Effic., 2021, 28(05), 137–142 Search PubMed .
- H. A. L. Kiers and J. M. F. Ten berge, Minimization of a class of matrix trace functions by means of refined majorization, Psychometrika, 1992, 57(3), 371–382 CrossRef .
- R. J. LAI and S. OSHER, A splitting method for orthogonality constrained problems, J. Sci. Comput., 2014, 58(2), 431–449 CrossRef .
- H. Attouch, J. Bolte and P. Redont, et al., Proximal alternating minimization and projection methods for nonconvex problems: an approach based onthe Kurdyka-Lojasiewicz inequality, Math. Oper. Res., 2010, 35(2), 438–457 CrossRef .
|
| This journal is © The Royal Society of Chemistry 2024 |
Click here to see how this site uses Cookies. View our privacy policy here. 
 Open Access Article
 This Open Access Article is licensed under a Creative Commons Attribution-Non Commercial 3.0 Unported Licence
 and
Yang Chang-hua*
and
Yang Chang-hua*


 . Therefore, the viscous resistance of the tube wall fluid is: