 Open Access Article
Molecular dynamics simulation and experimental verification of the effects of vinyl silicone oil viscosity on the mechanical properties of silicone rubber foam†
Hongyu Heab,
Lulu Lia,
Ruhan Yac,
Hong Liud,
Bin Luod,
Zhipeng Li *b and
Wenhuai Tian
 *b
*b
aSchool of Materials Science and Engineering, University of Science and Technology Beijing, Beijing 100083, China. E-mail: hehongyu666@126.com; 15733153822@163.com
bSchool of Materials Science and Engineering, Shunde Innovation School, University of Science and Technology Beijing, Foshan 528300, China. E-mail: zplmse@ustb.edu.cn; wenhuaitian@ustb.edu.cn
cInner Mongolia Academy of Science and Technology, Huhhot 010020, China. E-mail: YARUHANJIAN@163.com
dGuangdong Homeen Organic Silicon Material Co., Ltd, Zhaoqing 526072, China. E-mail: roben@hm-sil.com; liuhong@homeen.cn
First published on 30th July 2024
Abstract
The molecular motion trajectories of silicone rubber foam (SRF) at various vinyl silicone oil viscosities were studied via molecular dynamics (MD) simulation from the perspective of all atomic molecules. The influence of different viscosities of vinyl silicone oil on interaction, compatibility, and aggregation degree of molecules was determined based on the mean square displacement, diffusion coefficient, binding energy, solubility parameter, radial distribution function, and radius of gyration. The mechanical properties of the SRF were also experimentally verified. Results revealed that as the viscosity of vinyl silicone oil increased, the mean square displacement, fractional free volume, diffusion coefficient, and solubility parameter of the system decreased, whereas its larger radius of gyration increased. Moreover, the radial distribution function showed a weaker relative interaction between molecular chains. The calculated binding energy demonstrated that the system had better compatibility at a viscosity of 0.45 Pa s. This study provided a deeper insight into the relation between the viscosity of vinyl silicone oil and mechanical properties of the SRF. As the viscosity of vinyl silicone oil increased, the changing trend in MD simulation results of elastic modulus, shear modulus, bulk modulus, and Poisson's ratio was consistent with the experimental results. The MD simulations can promote theoretical predictions and scientific basis for the design of the SRF with desired performances.
1. Introduction
Silicone rubber foam (SRF) is widely applied in vehicles, high-speed trains, and airplanes owing to its low compression set, superior temperature resistance, and good resilience.1–3 SRF is commonly foamed from silicone rubber matrix comprising polysiloxane, fillers, and other additives.4 Chemical foaming technology is used to produce the SRF due to the characteristics of one-step and green process.5 The viscosity of the matrix plays a crucial role in the cellular structure and properties of the SRF. For example, if the viscosity of vinyl silicone oil is considerably low or high, the polymer molecular chains will be shorter or longer, respectively, which have a significant impact on the performance of the SRF.6,7Molecular dynamics (MD) is a method to simulate the properties of materials at the micromolecular and atomic levels. It is used to study the effects and mechanisms of polymer modification because a large number of atoms or molecules are simulated on a large time scale.8–10 MD simulation explores the interactions between microscopic molecules based on the principle of statistical analysis of the arrangement and motion of atoms or molecules, which cannot be experimentally derived. Various polymer properties have been investigated via MD simulation.11,12 Pahari et al.11 found that MD simulation can be used to effectively predict the viscoelastic and thermodynamic properties of rubber. Lee et al.12 utilized MD simulation to analyze the fibrillization process and thermal stability of silicone foams by adding fibrillated microcrystalline cellulose, and the simulation result of fibrillization details was consistent with the experimental result. Wei et al.13 applied MD simulation method to investigate the mechanical properties of poly(vinyl alcohol) (PVA)/poly(acrylic acid) (PAA) blend systems. Results showed that the PVA chain formed a stronger intermolecular interaction than the PAA chain at the same quality. Zhu et al.14 studied the dynamic mechanical property of silicone rubbers with different phenyl units and phenyl contents via combining experiments and MD simulation.
Currently, the regulation of cellular structure, rheology, viscoelasticity, and aging of the SRF have been studied.15–19 Few researchers have conducted in-depth the impact of vinyl silicone oil viscosity on the performance of the SRF via all-atom molecular dynamic simulation.20,21 This article has investigated in detail the molecular motion trajectories, molecular interactions, and the crosslinking process of the SRF prepared from vinyl silicone oil with different viscosities through MD simulation. The intermolecular motion (such as mean square displacement, diffusion coefficient, fractional free volume, and cohesive energy density) and the molecular stereo configuration (radial distribution function and radius of gyration) were also investigated. The simulation results of mechanical properties and the experimental results were in contrast with each other. This research will provide theoretical basis and data support for the actual industrial production of the SRF.
2. MD simulation and experiment
2.1 Materials
Vinyl-terminated silicone oils with vinyl group (purity ≥99%, viscosity = 0.45 Pa s, 10 Pa s and 200 Pa s) and vinyl-terminated MQ silicone resin (purity ≥99%, viscosity = 100 Pa s) were provided by Jiangxi Bluestar Xinghuo Silicones Co., Ltd (Jiujiang, China). Hydrogen-containing silicone oil (viscosity = 0.02 Pa s, purity ≥98%, active hydrogen mass fraction = 1.6%) was obtained from Zhejiang Runhe Organic silicone New Material Co., Ltd (Huzhou, China). Hydroxyl-terminated silicone oil (purity ≥98%, hydroxyl value = 5%, viscosity = 0.02 Pa s) was provided by Zhonghao Chenguang Research Institute of Chemical Industry Co., Ltd (Zigong, China). The platinum catalyst (Karstedt's catalyst, platinum mass fraction = 0.5%) was obtained from Tianjin Umicore Catalyst Co., Ltd (Tianjin, China). The inhibitor (1-ethynylcyclohexanol, purity ≥99%) was provided by Guangdong Silicon New Material Co., Ltd (Guangzhou, China).Vinyl silicone oils with a viscosity of 0.45 and 200 Pa s were adopted in system I and II, respectively. Tables 1 and 2 show the experimental formulation of the SRF for systems I and II, respectively.
| Component | Materials | Viscosity/Pa s | Vinyl content/% | Mole content/mol |
|---|---|---|---|---|
| A | Vinyl-terminated MQ silicone resin | 100 | 1.3 | 0.00241 |
| Vinyl-terminated silicone oil | 10 | 0.14 | 0.000691 | |
| Vinyl-terminated silicone oil | 0.45 | 0.4 | 0.00263 | |
| Hydroxyl-terminated silicone oil | 0.02 | — | 0.00471 | |
| B | Vinyl-terminated MQ silicone resin | 100 | 1.3 | 0.00241 |
| Vinyl-terminated silicone oil | 10 | 0.14 | 0.000691 | |
| Vinyl-terminated silicone oil | 0.45 | 0.4 | 0.00237 | |
| Hydrogen-containing silicone oil | 0.02 | — | 0.064 |
| Component | Materials | Viscosity/Pa s | Vinyl content/% | Mole content/mol |
|---|---|---|---|---|
| A | Vinyl-terminated MQ silicone resin | 100 | 1.3 | 0.00241 |
| Vinyl-terminated silicone oil | 10 | 0.14 | 0.000691 | |
| Vinyl-terminated silicone oil | 200 | 0.02 | 0.00132 | |
| Hydroxyl-terminated silicone oil | 0.02 | — | 0.00471 | |
| B | Vinyl-terminated MQ silicone resin | 100 | 1.3 | 0.00241 |
| Vinyl-terminated silicone oil | 10 | 0.14 | 0.000691 | |
| Vinyl-terminated silicone oil | 200 | 0.02 | 0.00119 | |
| Hydrogen containing silicone oil | 0.02 | — | 0.064 |
2.2 Modeling and simulation details
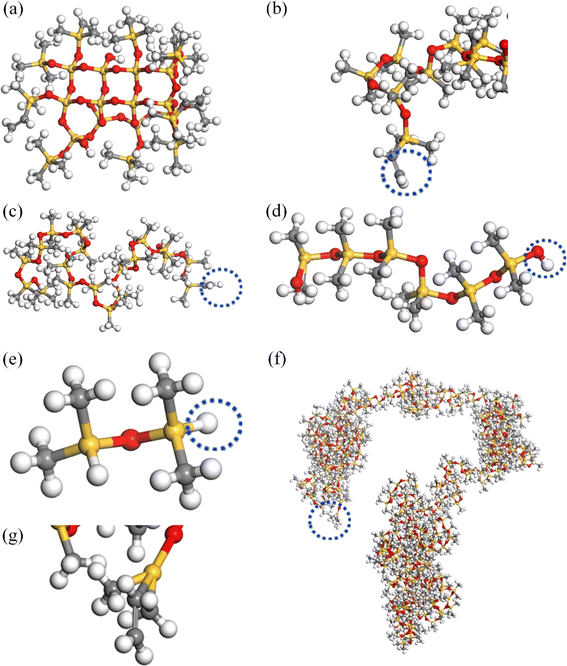
The amorphous cell modules of the Materials Studio software 2020 were used to construct the molecular models including the molecular structures of different components during the SRF preparation (Fig. 1). The MD simulation modules constitute molecules a, b, c, d, e, and f corresponding to vinyl monofunctional silane (M) and tetrafunctional silane (Q) (MQ) silicone resin with a value M/Q ratio of 0.8, vinyl silicone oil with a viscosity of 10 Pa s, vinyl silicone oil with a viscosity of 0.45 Pa s, hydroxy silicone oil containing 5% hydroxyl, 1.6% hydrogen-containing silicone oil, and vinyl silicone oil with a viscosity of 200 Pa s, respectively.The amorphous cell module was used to build the simulation box with molecules a, b, c, d, e, and f. Considering the limitation of the computer resources, the atomic number in a single molecular chain of systems was taken to be about 600–700. At the same time, the number of repeating units could not exceed 500. Therefore, it is crucial to choose the appropriate chain length of silicone rubber foam. According to Hildebrand's theory,22 the solubility parameter of silicone rubber will tend to a constant value when the degree of polymerization of silicone rubber chains exceeded a certain critical value. Reducing the scale of the repeating units by 10 times met the above conditions. Therefore, the molecular chain of molecules b, c, and f was reduced in the same proportion during the simulation process, with a reduction ratio of 10. The repeat unit of molecules b, c, and f was 52, 18, and 364, respectively. The total number of atoms in the systems I and II was 4388 and 5136, respectively. The initial density was set to 1 g cm−3. The reactive atoms on different chains were named R1 or R2 (as shown in the blue circle of Fig. 1). The cross-linked model was obtained by simulating the crosslinking process of groups R1 and R2, which were selected as the alternative crosslinks.
The force field parameters just like DREIDING and optimized potentials for liquid simulations (OPLS) will present some error at the simulation process except the temperature at 0 K.23,24 The COMPASS force field is a high-performance and powerful force field, which can predict the microstructure, molecular conformation, and thermophysical properties of polymers within a wide range of temperature and pressure. The Forcite module was applied to optimize the molecular structure with COMPASS II as the force field.25,26 During the geometric optimization process, the convergence thresholds for maximum energy change, maximum force, and maximum displacement were 0.001 kcal mol−1, 0.5 kcal mol−1 Å−1, and 0.015 Å, respectively. Then, 100 ps dynamic simulation was performed under the NPT ensemble (constant number of particles, pressure, and temperature) at 0.0001 GPa and 298 K to determine the density fluctuations until the density–time curve was stable. To release the internal stress of the system, the model was annealed at 300–500 K, with a total of 200![[thin space (1/6-em)]](https://www.rsc.org/images/entities/char_2009.gif) 000 steps. For further optimizing the structure, a 100 ps dynamic simulation was conducted under the NPT and NVT ensembles (constant number of particles, volume, and temperature), respectively. The precise Nose–Hoover temperature control mode and Berendsen pressure control mode were utilized in the dynamic process. The simulations were conducted at 298 K and a step size of 0.2 fs.
000 steps. For further optimizing the structure, a 100 ps dynamic simulation was conducted under the NPT and NVT ensembles (constant number of particles, volume, and temperature), respectively. The precise Nose–Hoover temperature control mode and Berendsen pressure control mode were utilized in the dynamic process. The simulations were conducted at 298 K and a step size of 0.2 fs.
The energy curve of the optimized model is shown in Fig. 2. During the MD simulation of the SRF, the state of the entire simulation process must be meaningful and stable. The energy curves of these systems fluctuated in the range of ∼1–5%, indicating the effectiveness of the simulation model. These results also confirmed that the two systems reached an equilibrium state.
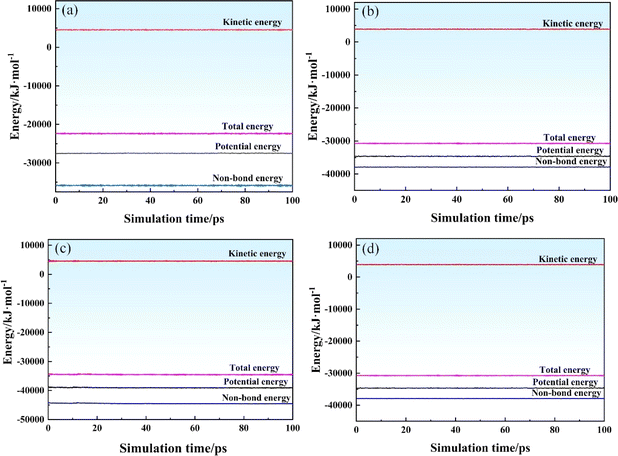 | ||
| Fig. 2 Energy curve of the SRF versus simulation time. (a and b) NPT and NVT of system I; (c and d) NPT and NVT of system II. | ||
2.3 Structure of the SRF before and after crosslinking
Fig. 3 shows the molecular structure of the SRF prepared using vinyl silicone oils of varying viscosities before and after crosslinking. The proportion of all components in the model for preparing the SRF also increased with an increase in the viscosity of vinyl silicone oil.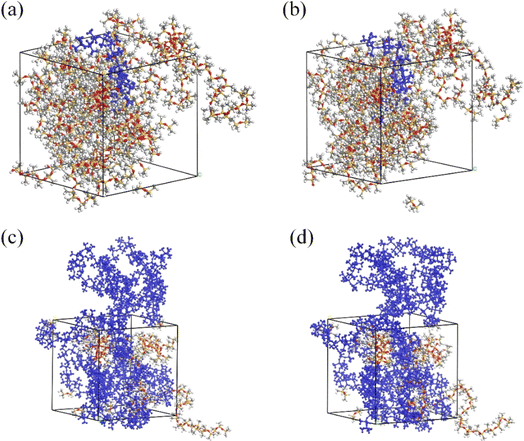 | ||
| Fig. 3 Model diagram of the SRF before and after crosslinking. (a and b) Before and after crosslinking of system I; (c and d) before and after crosslinking of system II. | ||
According to the research of Messinger,27 it was found that the cellular microstructure had no effect on the mechanical properties of the organosiloxane foams. The mechanical properties were related to differences in molecular composition, structure, and polymer chain dynamics. This suggests that bubbles can be disregarded in simulations and that their presence does not invalidate the results. Therefore, it is reasonable to use molecular dynamic simulation without simulate bubbles in the simulation process for studying the SRF.
2.4 Preparation of the SRF and characterization
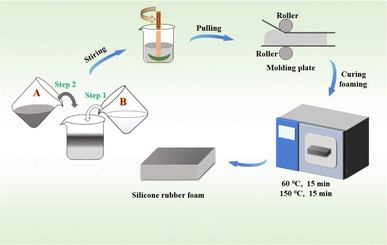
The SRF was prepared by vulcanizing components A and B at room temperature. The remaining components in both the systems were the same during the SRF preparation. Molecule e was chosen as the crosslinking agent. The Si–H group in the crosslinking agents underwent an addition reaction with the vinyl group in the molecules a, b, c, and f, forming new Si–C bonds. The Si–H group also condensed with the Si–OH group in molecule d to form Si–O–Si bonds and produce small molecules of hydrogen gas.28Components A and B were stirred in a vacuum defoaming mixer (vacuum degree of −100 kPa) at 800 rpm. The flow chart for the SRF preparation is shown in Fig. 4. The two components were completely mixed in a 1![[thin space (1/6-em)]](https://www.rsc.org/images/entities/char_2009.gif) :
:![[thin space (1/6-em)]](https://www.rsc.org/images/entities/char_2009.gif) 1 mass ratio and stirred for 2 min and quickly poured into a mold at room temperature. Then, the molding plate was cured at 60 °C and post-cured at 150 °C for 15 min, yielding the SRF. Post-curing improved the degree of curing and the components reacted completely at 150 °C, which improved the mechanical properties of the SRF and eliminated any volatile substances.
1 mass ratio and stirred for 2 min and quickly poured into a mold at room temperature. Then, the molding plate was cured at 60 °C and post-cured at 150 °C for 15 min, yielding the SRF. Post-curing improved the degree of curing and the components reacted completely at 150 °C, which improved the mechanical properties of the SRF and eliminated any volatile substances.
There has two main methods for analyzing the mechanical properties of system, static and dynamic method in MD simulation, respectively. In the static method, the bond angle was fixed, whereas the influence of configuration entropy on the elastic constant was disregard. Contrarily, the dynamic method is time-consuming and suffers from uncertainties in the results due to strain fluctuations. Therefore, the static method was used for simulation herein.
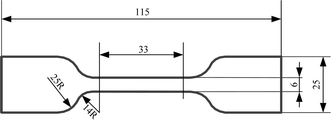
The static mechanical properties of the SRF were measured using an electronic universal testing machine (E43.104, MTS) and an axial extensometer (ZEM5.204, ZHIXIN). A schematic of the dumbbell sample is shown in Fig. 5. The effective part of the sample was 33 mm × 6 mm × 5 mm (length × width × thickness). During the experiment, the sample was uniformly stretched with a stretching rate of 50 mm min−1. For each set of data on the materials' properties, at least five samples were tested for each system and the values were averaged.
The VTMR12-010V-I nuclear magnetic resonance (NMR) crosslinking densimeter was used to test the crosslinking density of the foaming materials. The effective detection range of the sample was φ8.5 × H20 mm. The magnetic field intensity was set to 0.5 ± 0.05 T. The crosslinking density was determined at 30 °C. LX-C shore hardness testers were utilized to measure the shore hardness (shore C) of the SRF. The tensile strength and elongation at break of the SRF were tested using the WDW-10 universal testing machine at a tensile rate of 500 mm min−1. The sample was stretched uniformly during the experiment. Five samples were measured, and the average value was used as the final value in the experiment.
3. Results and discussion
3.1 Motion of molecular chains
| MSD = 〈|ri(t) − ri(0)|2〉 | (1) |
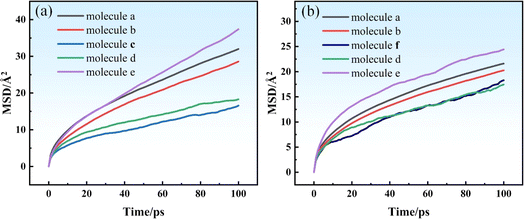
Fig. 6 shows the MSD curves of molecular chains of different components in the two systems at 298 K. A linear correlation existed between the MSD and the simulation time, indicating that the diffusion system was in a state of normal diffusion. MSD curve showed an upward trend as the simulation time increased. Fig. 6(a) and (b) show that the MSD of system II is smaller than that of system I. To accurately analyze the MSD curves, the MSDs of functional groups in the system were determined (Table 3). The MSD of the Si–H bond was the highest, whereas those of –CH![[double bond, length as m-dash]](https://www.rsc.org/images/entities/char_e001.gif) CH2 in molecules c and f is relatively smaller, primarily because hydrogen-containing silicone oil has shorter molecular chains. Thus, the molecules can easily move, which results in a larger MSD. Contrarily, vinyl silicone oil has longer molecular chains, which cannot move easily, resulting in a smaller MSD. Moreover, system I has a shorter molecular chain and a larger free volume than system II, which facilitates easier molecular chain movement. A shorter molecular chain length implies that the resistance of motion in the system is lower, and the MSD of the molecular chain is the larger.
CH2 in molecules c and f is relatively smaller, primarily because hydrogen-containing silicone oil has shorter molecular chains. Thus, the molecules can easily move, which results in a larger MSD. Contrarily, vinyl silicone oil has longer molecular chains, which cannot move easily, resulting in a smaller MSD. Moreover, system I has a shorter molecular chain and a larger free volume than system II, which facilitates easier molecular chain movement. A shorter molecular chain length implies that the resistance of motion in the system is lower, and the MSD of the molecular chain is the larger.
| Component | MSD/Å2 | |
|---|---|---|
| System I | System II | |
| Si–O–Si (silicon resin) | 31.99 | 21.62 |
–CH![[double bond, length as m-dash]](https://www.rsc.org/images/entities/char_e001.gif) CH2 (vinyl silicone oil of 0.45 Pa s) CH2 (vinyl silicone oil of 0.45 Pa s) |
16.6 | — |
–CH![[double bond, length as m-dash]](https://www.rsc.org/images/entities/char_e001.gif) CH2 (vinyl silicone oil of 10 Pa s) CH2 (vinyl silicone oil of 10 Pa s) |
28.59 | 20.26 |
–CH![[double bond, length as m-dash]](https://www.rsc.org/images/entities/char_e001.gif) CH2 (vinyl silicone oil of 200 Pa s) CH2 (vinyl silicone oil of 200 Pa s) |
— | 18.30 |
| Si–H (hydrogen containing silicone oil) | 37.39 | 24.43 |
| Si–OH (hydroxy silicone oil) | 18.37 | 17.45 |
 | (2) |
Table 4 shows the D of the SRF in systems I and II. It can be seen that system I had a larger D. This is due to the 0.45 Pa s vinyl silicone oil has short molecular chains, relatively small molecular weight, and large free volume within the system, allowing easy molecular chains movement.
| Component | D/(Å2 ps−1) | |
|---|---|---|
| System I | System II | |
| Si–O–Si (molecule a) | 0.0352 | 0.0189 |
–CH![[double bond, length as m-dash]](https://www.rsc.org/images/entities/char_e001.gif) CH2 (molecule b) CH2 (molecule b) |
0.0314 | 0.0184 |
–CH![[double bond, length as m-dash]](https://www.rsc.org/images/entities/char_e001.gif) CH2 (molecule c) CH2 (molecule c) |
0.0173 | — |
| Si–OH (molecule d) | 0.0182 | 0.0168 |
| Si–H (molecule e) | 0.0477 | 0.0215 |
–CH![[double bond, length as m-dash]](https://www.rsc.org/images/entities/char_e001.gif) CH2 (molecule f) CH2 (molecule f) |
— | 0.0196 |
 | (3) |
Fig. 7 shows the free volume morphology of the SRF with different vinyl silicone oil viscosities. The free and occupied volume of the SRF are denoted in blue and gray, respectively. The FFV of the SRF with different viscosities of vinyl silicone oil is shown in Table 5. Fig. 7 and Table 5 show that the free volume and FFV decrease as of vinyl silicone oil viscosity increases. This is due to the 200 Pa s vinyl silicone oil has a long molecular chain, relatively large molecular weight, larger volume of polymer chains, and smaller FFV. A larger FFV allows for more active movement of molecules within a larger space, thereby increasing the diffusion coefficient.36 This finding is consistent with the previous results of MSD and D values.
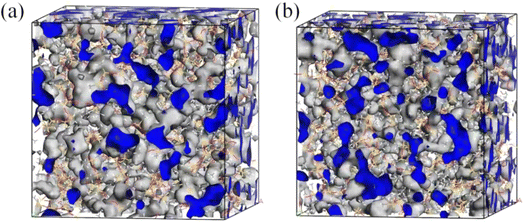 | ||
| Fig. 7 Free volume morphology of the SRF with different vinyl silicone oil viscosities. The blue denotes the area of free volume. (a) System I; (b) System II. | ||
| Systems | System I | System II |
|---|---|---|
| Free volume/A3 | 11![[thin space (1/6-em)]](https://www.rsc.org/images/entities/char_2009.gif) 252.53 252.53 |
13![[thin space (1/6-em)]](https://www.rsc.org/images/entities/char_2009.gif) 069.62 069.62 |
| Occupied volume/A3 | 41![[thin space (1/6-em)]](https://www.rsc.org/images/entities/char_2009.gif) 551.33 551.33 |
48![[thin space (1/6-em)]](https://www.rsc.org/images/entities/char_2009.gif) 563.77 563.77 |
| FFV/% | 21.31 | 21.21 |
Ebinding = −Einter = −(Etotal − E–CH![[double bond, length as m-dash]](https://www.rsc.org/images/entities/char_e001.gif) CH2 − ESi–OH − ESi–H) CH2 − ESi–OH − ESi–H)
| (4) |
![[double bond, length as m-dash]](https://www.rsc.org/images/entities/char_e001.gif) CH2 is the free energy of molecules a, b, c, and f, respectively.
CH2 is the free energy of molecules a, b, c, and f, respectively.Tables 6 and 7 show the free energies of different components and the Ebinding of systems I and II. After simulation, the Ebinding of the SRF prepared using vinyl silicone oils of 0.45 and 200 Pa s were 551.52 and −604.30 kcal mol−1, respectively. The absolute value of the Ebinding in system II was slightly higher than that in system I, with a difference of ∼52.78 kcal mol−1. Based on the sign of the Ebinding, the compatibility of two components of the SRF can be confirmed.39 A negative Ebinding indicates that the components have a poor compatibility, and a positive Ebinding indicates their good compatibility. A larger positive Ebinding implies the components of the two systems will have better compatibility.40 The stability of the SRF is affected by the magnitude of Ebinding. A larger absolute value of the Ebinding will enhance the system stability.41 Moreover, the Ebinding is influenced by the molecular chain length. System I has better compatibility for the two components due to the positive Ebinding and shorter molecular chains; therefore, the molecules are compatible with each other in this system.
| Functional group/item | Free energy/(kcal mol−1) | |
|---|---|---|
| System I | System II | |
| Etotal | −34![[thin space (1/6-em)]](https://www.rsc.org/images/entities/char_2009.gif) 545.413 545.413 |
−36![[thin space (1/6-em)]](https://www.rsc.org/images/entities/char_2009.gif) 946.094 946.094 |
| Si–O–Si (Ea) | −11![[thin space (1/6-em)]](https://www.rsc.org/images/entities/char_2009.gif) 581.263 581.263 |
−4884.269 |
–CH![[double bond, length as m-dash]](https://www.rsc.org/images/entities/char_e001.gif) CH2 (10 Pa s) (Eb) CH2 (10 Pa s) (Eb) |
−8343.170 | −3381.280 |
–CH![[double bond, length as m-dash]](https://www.rsc.org/images/entities/char_e001.gif) CH2 (0.45 Pa s) (Ec) CH2 (0.45 Pa s) (Ec) |
−7727.943 | — |
–CH![[double bond, length as m-dash]](https://www.rsc.org/images/entities/char_e001.gif) CH2 (200 Pa s) (Ef) CH2 (200 Pa s) (Ef) |
— | −986.613 |
| Si–OH (Ed) | −2344.130 | −1693.140 |
| Si–H (Ee) | −3997.385 | −26![[thin space (1/6-em)]](https://www.rsc.org/images/entities/char_2009.gif) 605.088 605.088 |
| Item | Ebinding/kcal mol−1 |
|---|---|
| System I | 551.52 |
| System II | −604.30 |
 | (5) |
The solubility parameter (δ) is applied to determine the compatibility and dissolution characteristics of different components or polymers. It is the square root of the CED and can be determined for the SRF as follows:40
 | (6) |
Table 8 shows that the CED and δ of the SRF prepared using vinyl silicone oils of 0.45 and 200 Pa s are 1.717 × 10⁸ J m−3 and 13.104 (J cm−3)1/2 as well as 1.540 × 10⁸ J m−3 and 12.408 (J cm−3)1/2, respectively. As the viscosity of the vinyl silicone oil increases, the CED and δ of the SRF decrease, indicating weak interaction between the SRF components. The higher the CED and δ, the better the compatibility between the components in the SRF. Thus, system I has better compatibility than system II. This finding is consistent with the Ebinding results.
| Item | CED/(J m−3) | δ/(J cm−3)1/2 |
|---|---|---|
| System I | 1.717 × 10⁸ | 13.104 |
| System II | 1.540 × 10⁸ | 12.408 |
Moreover, δ decreases with increasing viscosity of vinyl silicone oil and the number of repeating units. This result is consistent with that reported previously,40 where the δ of NR and SBR gradually decreased as the number of Nunit (chain repeating units) increased.
 | (7) |
![[double bond, length as m-dash]](https://www.rsc.org/images/entities/char_e001.gif) CH2 of molecules a, b, c, and f, and Si–OH in molecule d.
CH2 of molecules a, b, c, and f, and Si–OH in molecule d.Fig. 8 shows the RDFs of the SRF for the vinyl silicone oil viscosities of 0.45 and 200 Pa s, respectively. The RDFs of other atoms (such as Si–OH and –CH![[double bond, length as m-dash]](https://www.rsc.org/images/entities/char_e001.gif) CH2) found around the Si–H in hydrogen-containing silicone oil as the central atom has a significant peak at a certain distance. This indicates that Si–H has a strong attraction to other atoms around this distance. Moreover, the RDFs of the five components in the SRF are similar in the number, distribution, and patterns of peaks, but the peak values are different.
CH2) found around the Si–H in hydrogen-containing silicone oil as the central atom has a significant peak at a certain distance. This indicates that Si–H has a strong attraction to other atoms around this distance. Moreover, the RDFs of the five components in the SRF are similar in the number, distribution, and patterns of peaks, but the peak values are different.
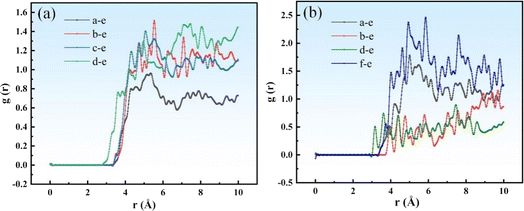 | ||
| Fig. 8 Total g(r) of Si–H for different viscosities of vinyl silicone oils; the plots on the left and right represent different distances (r). (a) System I; (b) System II. | ||
As vinyl silicone oil viscosity increases, the SRF forms looser aggregates and a relatively large g(r) peak is observed. As shown in Fig. 8(a), the maximum g(r) of molecules a, b, c, and d are 0.96, 1.51, 1.40, and 1.48, respectively. These peaks are observed at positions of 5.37, 5.53, 5.09, and 7.49 Å from the Si–H bond, respectively. As shown in Fig. 8(b), the maximum g(r) of molecules a, b, f, and d are found to be 1.78, 1.16, 2.46, and 0.89, respectively. These peaks are observed at positions of 5.01, 9.69, 5.85, and 7.45 Å from the Si–H bond, respectively. Overall, the RDF of system I is smaller than that of system II. The shorter the molecular chain of system I, the higher the vinyl content, and the tighter the molecular configuration of the SRF after crosslinking. The g(r) peak values of the components in the system I are relatively low, the aggregation of molecular chains is stronger, and the distribution of system components is more uniform. These results are consistent with the solubility parameters and Ebinding results.
 | (8) |
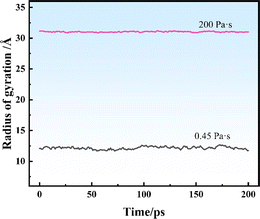
Fig. 9 shows the Rg of the SRF at different vinyl silicone oil viscosities. The Rg value is 12 and 31 Å at viscosities of 0.45 and 200 Pa s, respectively. The structure of system II has a lower aggregation degree. The reason is that vinyl silicone oil has a higher molecular weight and lower vinyl content; therefore, it forms fewer new chemical bonds. This finding is consistent with the RDF results, indicating that the peak value of the RDF is higher in system II.
An increase or decrease in Rg implies disaggregation or aggregation between the molecules, respectively.52 If the molecular aggregates are stable, Rg will be relatively stable. Contrarily, if the molecular aggregates undergo rearrangement or rebonding during the MD simulation, Rg values change over time. Fig. 9 shows Rg values of systems I and II are stable, indicating that the structure did not undergo significant expansion or contraction of during the crosslinking process and confirming its stability during the simulation of components.
3.2 Static mechanical properties
Mechanical properties are an essential basic property related to the preparation and application of the SRF.53–55 The static mechanical properties of the SRF after crosslinking were calculated via MD simulation at 298 K. The mechanical properties of the models were calculated using the constant-strain energy minimisation method. Molecular dynamic simulations allowed stress and strain analysis of systems under small deformation. By applying a micro strain to a system that has reached equilibrium, the stress–strain relationship follows Hooke's law, and the elastic stiffness tensor can be expressed as follows:56| σi = Cijεj | (9) |
The stiffness matrix Cij can be obtained from eqn (9) as follows:57,58
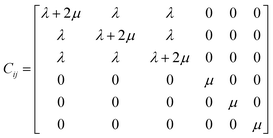 | (10) |
The elastic constants can be calculated from the stiffness matrix as follows:
| λ = ⅙(C12 + C13 + C21 + C23 + C31 + C32) | (11) |
| μ = ⅓(C44 + C55 + C66) | (12) |
The mechanical properties parameters such as elastic modulus (E), shear modulus (G), bulk modulus (B), and Poisson's ratio (v) of the system are determined as follows:59–61
 | (13) |
| G = μ | (14) |
| B = λ + 2μ/3 | (15) |
 | (16) |
Table 9 shows the experimental and simulation results of static mechanical properties in systems I and II, with some errors. The values of parameters determined via MD simulations were slightly higher. The errors between the experimental and simulation values were related to the molecular chain length of the polymers. The degree of polymerization of molecules b, c, and f was reduced in the same proportion during the simulation process. The molecules repeat units simulated by molecular dynamics is about 10 times shorter than that of the molecules in the experiment. A shorter the molecular chain implies a higher the vinyl content, and a tighter the molecular configuration of the SRF after crosslinking, leading to higher mechanical properties of the SRF. Thus, the reduction in molecular chain length is the main reason for the higher simulation results of the SRF.
| Item | Experimental results | Simulation results | ||||||
|---|---|---|---|---|---|---|---|---|
| E/MPa | G/MPa | B/MPa | v | E/GPa | G/GPa | B/GPa | v | |
| System I | 2.450 | 2.694 | 2.811 | 0.366 | 0.7217 | 0.9512 | 0.6452 | 0.4592 |
| System II | 0.997 | 1.370 | 0.663 | 0.247 | 0.6422 | 0.2920 | 0.3575 | 0.4279 |
The changes in the mechanical properties of the SRF with the increasing of the vinyl silicone oil viscosity determined via MD simulation were consistent with those determined experimentally. A comparison of the SRF in systems I and II shows that the static mechanical properties of system II decrease. As the viscosity of vinyl silicone oil increases, the elastic modulus, shear modulus, bulk modulus, and Poisson's ratio of the SRF decrease to ∼59.3%, 49.1%, 76.4%, and 32.5%, respectively, as determined experimentally. These values were determined via MD simulation as ∼11.0%, 69.3%, 44.6% and 6.8%, respectively.
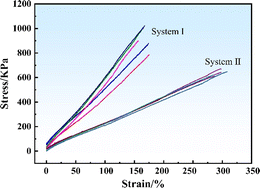
Fig. 10 shows the stress–strain curves of the SRF in systems I and II. The slope value of the elastic stage in the stress–strain curve represents the elastic modulus of each system. System I had a relatively large slope, indicating its higher elastic modulus than system II. This finding is consistent with the results shown in Table 9. These results indicated that changing the vinyl silicone oil viscosity considerably impacted on static mechanical properties of the SRF.
Fig. 11(a)–(d) show the crosslinking density, shore C, tensile strength, and elongation at break of the SRF in systems I and II, respectively. The crosslinking density of the SRF decreases from 4.62 to 4.07 mol mL−1, and shore C decreases from 44.5° to 29°. The tensile strength decreases from 0.86 to 0.61 MPa, whereas the elongation at break increases from 83.4% to 153.5%. As the viscosity of vinyl silicone oil increases, the crosslinking density, shore C, and tensile strength of the SRF decrease, whereas the elongation at break increases. As the viscosity of vinyl silicone oil increases, the length of polymer molecular chains increases and the vinyl content decreases, which loosens the cross-linked network structure of the SRF. The network structure tightens when the vinyl content is high. This indicates that the viscosity of vinyl silicone oil can influence the structure and properties of the SRF. Vinyl silicone oil with a lower viscosity can enhance the crosslinking density of silicone rubber, thereby increasing its tensile strength and hardness. In contrast, vinyl silicone oil with a higher viscosity can impart greater elasticity and longer elongation to silicone rubber. These results were also reported in a previous study.62 Thus, by selecting an appropriate the viscosity of vinyl silicone oil, the SRF with a desired structure and performance can be prepared.
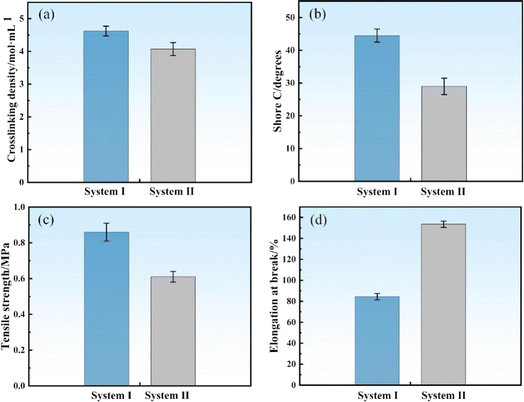 | ||
| Fig. 11 Mechanical properties of SRF in systems I and II. (a) Crosslinking density; (b) shore C; (c) tensile strength; (d) elongation at break. | ||
The performance of the SRF cannot be determined solely based on one parameter. For instance, a larger MSD of the system does not necessarily indicate poor performance. A comprehensive analysis must be conducted by considering various parameters such as RDF and δ as well as the application prospects. The cross-linked network structure of the SRF considerably affects the mechanical properties of the SRF. Additionally, the application and requirements of the SRF, such as sealing or cushioning and shock absorption, must be considered to determine its performance.
However, the effect of high-viscosity vinyl silicone oil on the movement of molecular chains and the aggregation degree of molecular structure of the SRF needs futher elucidation. To this end, we noted the following observations. (1) A longer molecular chain implies smaller free volume of the system, the weaker activity of the system's molecular chain, and the lower MSD. (2) System II has a negative Ebinding and lower CED and δ; therefore, its components have poor compatibility. (3) The low vinyl content in the system, fewer crosslinking agents, and low-density network structure increases the Rg. (4) The RDF shows that the aggregation degree of molecular structure in system II is relatively low. Thus, the mechanical property of the SRF is affected by the ability of molecular motion, the size of free volume, multicomponent compatibility, binding energy of the whole system, and the aggregation degree of its molecular chain structure. The mechanical properties of the SRF can be optimized based on the aforementioned parameters.
4. Conclusions
Herein, MD simulation was performed on the molecular motion trajectories of the SRF prepared using vinyl silicone oil of varying viscosities from the perspective of all atomic molecules using Materials Studio. Moreover, the simulation and experimental results were analyzed and compared. The following main conclusions were drawn:(1) The polymer molecular chain length is crucial for the SRF performance. As the viscosity of vinyl silicone oil increases, the MSD of the system decreases and Ebinding increases. Meanwhile, the CED and the solubility parameter decrease, leading to poor compatibility between the system components. The aggregation degree weakens with increasing Rg. Thus, the mechanical properties of the system are influenced by the viscosity of vinyl silicone oil.
(2) As the viscosity of vinyl silicone oil increases, the vinyl content decreases, and fewer network structures are formed within the system. The elastic modulus, shear modulus, bulk modulus, and Poisson's ratio of the SRF decrease. The crosslinking density, shore C, and tensile strength of the SRF also decrease, whereas the elongation at break increases. Thus, by selecting an appropriate the viscosity of vinyl silicone oil, the desired performance of SRF can be obtained.
(3) Although some minor differences were observed between the MD simulation and experiment results, they were largely consistent. This provides theoretical support and reference value for the industrial production of the SRF from a microscopic perspective.
Data availability
Data will be made available on request.Authors contribution
Hongyu He: conceptualization, data curation, investigation, methodology, software, visualization, writing – original draft. Lulu Li: conceptualization, data curation, writing – review & editing. Ruhan Ya: conceptualization, writing – review & editing. Hong Liu: upervision, methodology. Bin Luo: methodology, funding acquisition. Zhipeng Li: methodology, formal analysis, resources, writing – review & editing, supervision. Wenhuai Tian: conceptualization, funding acquisition, investigation, writing – review & editing.Conflicts of interest
The authors declare that they have no known competing financial interests or personal relationships that could have appeared to influence the work reported in this paper.Acknowledgements
The computing work is supported by USTB MatCom of Beijing Advanced Innovation Center for Materials Genome Engineering. This work was financially supported by Foshan Science and Technology Innovation Special Fund Project (No. BK21BE009 and BK22BE004).References
- M. Tripathi, S. Parthasarathy, R. Yadav and P. K. Roy, Flexible Silicone-Hollow Glass Microballoon Syntactic Foams for Application in Fire Protective Clothing, J. Appl. Polym. Sci., 2022, 139(19), e52101 CrossRef.
- Y. X. Han, L. J. Yang, Z. Yu, Y. J. Zhao and Z. X. Zhang, Lightweight and Flame Retardant Silicone Rubber Foam Prepared by Supercritical Nitrogen: The Influence of Flame Retardants Combined with Ceramicizable Fillers, Constr. Build. Mater., 2023, 370(17), 130735 CrossRef CAS.
- A. M. Golobic, T. M. Bryson, T. H. Weisgraber, J. A. Armas, E. B. Duoss, T. S. Wilson and J. M. Lenhardt, Controlled in Situ Foaming for Mechanical Responsiveness of Architected Foams, Adv. Eng. Mater., 2023, 25(23), 2301335 CrossRef CAS.
- A. H. Landrock, Handbook of Plastic Foams: Types, Properties, Manufacture and Applications, Noes Publications, Park Ridge, 1995 Search PubMed.
- C. F. Cao, P. H. Wang, J. W. Zhang, K. Y. Guo, Y. Li, Q. Q. Xia, G. D. Zhang, L. Zhao, H. Chen, L. B. Wang, J. F. Gao, P. A. Song and L. C. Tang, One-Step and Green Synthesis of Lightweight, Mechanically Flexible and Flame-Retardant Polydimethylsiloxane Foam Nanocomposites via Surface Assembling Ultralow Content of Graphene Derivative, Chem. Eng. J., 2020, 393, 124724 CrossRef CAS.
- N. Boumdouha, J. Duchet-Rumeau and J. F. Gerard, Structure Property and Performance of Polymeric Foams: A Review, J. Basic Appl. Sci., 2024, 201–222 Search PubMed.
- H. W. Pan, C. G. Zang and Y. L. Zhang, Effect of Vinyl-Terminated Silicone Oil Chain Length and Reinforcing Agent on the Properties of Silicone Rubber, Key Eng. Mater., 2022, 905, 221–230 Search PubMed.
- S. A. Hollingsworth and R. O. Dror, Molecular Dynamics Simulation for All, Neuron, 2018, 99(6), 1129–1143 CrossRef CAS PubMed.
- M. H. N. Pour, G. Payganeh and M. Tajdari, Experimental and Numerical Study on the Mechanical Behavior of 3D Printed Re-entrant Auxetic Structure Filled with Carbon Nanotubes-Reinforced Polymethylmethacrylate Foam, Mater. Today Commun., 2023, 34, 104936 CrossRef.
- A. Vasilev, T. Lorenz and C. Breitkopf, Prediction of Thermal Conductivities of Rubbers by MD Simulations-New Insights, Polymers, 2022, 14(10), 2046 CrossRef CAS PubMed.
- S. Pahari, P. Ghosh and R. Mukhopadhyay, Prediction of Thermodynamic and Viscoelastic Properties of Rubber Using Molecular Simulations, SAE Technical Paper, 2023, No. 2023-28-1312 Search PubMed.
- K. Lee, Y. L. Sim, H. Jeong, A. Kim, Y. Lee, S. E. Shim and Y. J. Qian, Mechanochemically Functionalized and Fibrillated Microcrystalline Cellulose as a Filler in Silicone Foam: an Integrated Experimental and Simulation Investigation, Carbohydr. Polym., 2024, 327, 121660 CrossRef CAS PubMed.
- Q. H. Wei, Y. E. Wang, W. H. Chai, T. Wang and Y. F. Zhang, Effects of Composition Ratio on the Properties of Poly(Vinyl Alcohol)/Poly (Acrylic Acid) Blend Membrane: a Molecular Dynamics Simulation Study, Mater. Des., 2016, 89, 848–855 CrossRef CAS.
- L. Zhu, S. G. Zhao, C. Zhang, X. Cheng, J. H. Hao, X. Q. Shao and C. J. Zhou, Effects of Chain Structure on Damping Property and Local Dynamics of Phenyl Silicone Rubber: Insights from Experiment and Molecular Simulation, Polym. Test., 2021, 93, 106885 CrossRef CAS.
- K. L. S. Yip and S. John, Sound Trapping and Waveguiding in Locally Resonant Viscoelastic Phononic Crystals, Sci. Rep., 2023, 13(1), 15313 CrossRef CAS PubMed.
- A. ReghunadhanH. AkhinaA. R. AjithaN. ChandranS. T. NairH. J. MariaS. ThomasThermoplastic Elastomers (TPEs) from Rubber-Plastic Blends, Advances in Thermoplastic Elastomers, 2024, pp. 291–314 Search PubMed.
- D. Kruszewski, R. B. Malla and M. T. Shaw, Bonding and Aging Behavior of Silicone Foam Sealant for Small Movement Bridge Joints, Int. J. Civ. Eng., 2023, 21(2), 205–217 CrossRef.
- E. Rostami-Tapeh-Esmaeil and D. Rodrigue, Morphological, Mechanical and Thermal Properties of Rubber Foams: a Review Based on Recent Investigations, Materials, 2023, 16(5), 1934 CrossRef CAS PubMed.
- S. Marl, M. Hartung, K. Klier, A. Rüppel, R. U. Giesen and H. P. Heim, Improvement of the Cell Structure of Water-Foamed Liquid Silicone Rubber, Adv. Eng. Mater., 2023, 2201898 CrossRef.
- W. T. Lou, C. Y. Xie and X. F. Guan, Molecular Dynamic Study of Radiation-Moisture Aging Effects on the Interface Properties of Nano-Silica/Silicone Rubber Composites, npj Mater. Degrad., 2023, 7(1), 32 CrossRef CAS.
- X. Li, J. Liu and Z. J. Zheng, Recent Progress of Elastomer-Silica Nanocomposites toward Green Tires: Simulation and Experiment, Polym. Int., 2023, 72(9), 764–782 CrossRef CAS.
- M. Belmares, M. Blanco, W. A. Goddard III, R. B. Ross, G. Caldwell, S. H. Chou, J. Pham, P. M. Olofson and C. Thomas, Hildebrand and Hansen solubility Parameters from Molecular Dynamics with Applications to Electronic Nose Polymer Sensors, J. Comput. Chem., 2004, 25(15), 1814–1826 CrossRef CAS PubMed.
- S. L. Mayo, B. D. Olafson and W. A. Goddard, DREIDING: a Generic Force Field for Molecular Simulations, J. Phys. Chem., 1990, 94(26), 8897–8909 CrossRef CAS.
- W. L. Jorgensen and J. Tirado-Rives, The OPLS Force Field for Proteins. Energy Minimizations for Crystals of Cyclic Peptides and Crambin, J. Am. Chem. Soc., 1988, 110(6), 1657–1666 CrossRef CAS PubMed.
- N. D. Kondratyuk and V. V. Pisarev, Calculation of Viscosities of Branched Alkanes from 0.1 to 1000 MPa by Molecular Dynamics Methods Using COMPASS Force Field, Fluid Phase Equilib., 2019, 498, 151–159 CrossRef CAS.
- H. Sun, P. Y. Ren and J. R. Fried, The COMPASS Force Field: Parameterization and Validation for Phosphazenes, Comput. Theor. Polym. Sci., 1998, 8(1–2), 229–246 CrossRef CAS.
- R. J. Messinger, T. G. Marks, S. S. Gleiman, F. Milstein and B. F. Chmelka, Molecular Origins of Macroscopic Mechanical Properties of Elastomeric Organosiloxane Foams, Macromolecules, 2015, 48(14), 4835–4849 CrossRef CAS.
- S. Hamdani, C. Longuet, D. Perrin, J. M. Lopez-Cuesta and F. Ganachaud, Flame Retardancy of Silicone-Based Materials, Polym. Degrad. Stab., 2009, 94, 465–495 CrossRef CAS.
- X. Michalet, Mean square Displacement Analysis of Single-Particle Trajectories with Localization Error: Brownian Motion in an Isotropic Medium, Phys. Rev. E, 2010, 82(4), 041914 CrossRef PubMed.
- G. Z. Guo, J. N. Zhang, X. Chen, X. F. Zhao, J. B. Deng and G. J. Zhang, Molecular-Dynamics Study on the Thermodynamic Properties of Nano-SiO2 Particle-Doped Silicone Rubber Composites, Comput. Mater. Sci., 2022, 212, 111571 CrossRef CAS.
- G. A. Heiser, Molecular Dynamics Calculation of Mean Square Displacement in Alkali Metals and Rare Gas Solids and Comparison with Lattice Dynamics, Master's thesis, Brock University, 1984 Search PubMed.
- S. G. Charati and S. A. Stern, Diffusion of Gases in Silicone Polymers: Molecular Dynamics Simulations, Macromolecules, 1998, 31(16), 5529–5535 CrossRef CAS.
- F. Melzer, R. Breuer, R. Dahlmann and C. Hopmann, Calculating Diffusion Coefficients from Molecular Dynamics Simulations for Foam Extrusion Modelling of Polypropylene with CO2, N2 and Ethanol, J. Cell. Plast., 2022, 58(4), 603–622 CrossRef CAS.
- L. Tao, J. L. He, T. Arbaugh, J. R. McCutcheon and Y. Li, Machine Learning Prediction on the Fractional Free Volume of Polymer Membranes, J. Membr. Sci., 2023, 121131 CrossRef CAS.
- D. Turnbull and M. H. Cohen, Free-Volume Model of the Amorphous Phase: Glass Transition, J. Chem. Phys., 1961, 34(1), 120–125 CrossRef CAS.
- Y. Wang, Q. Wei, S. Wang, W. Chai and Y. Zhang, Structural and Water Diffusion of Poly (Acryl Amide)/poly (Vinyl Alcohol) Blend Films: Experiment and Molecular Dynamics Simulations, J. Mol. Graphics Modell., 2017, 71, 40–49 CrossRef CAS PubMed.
- Y. L. Luo, R. G. Wang, S. H. Zhao, Y. Y. Chen, H. F. Su, L. Q. Zhang, T. W. Chan and S. Z. Wu, Experimental Study and Molecular Dynamics Simulation of Dynamic Properties and Interfacial Bonding Characteristics of Graphene/Solution-Polymerized Styrene-Butadiene Rubber Composites, RSC Adv., 2016, 6, 58077–58087 RSC.
- P. S. Sarath, G. Moni, J. J. George, J. T. Haponiuk, S. Thomas and S. C. George, A Study on the Influence of Reduced Graphene Oxide on the Mechanical, Dynamic Mechanical and Tribological Properties of Silicone Rubber Nanocomposites, J. Compos. Mater., 2021, 55(15), 2011–2024 CrossRef CAS.
- H. Zhang, F. Cai, Y. Luo, X. Yu and S. Wu, Grafting Silica onto Reduced Graphene Oxide via Hydrosilylation for Comprehensive Rubber Applications: Molecular Simulation and Experimental Study, Polym. Compos., 2022, 43(8), 5332–5343 CrossRef CAS.
- Y. S. Guo, J. Liu, Y. L. Lu, D. Dong, W. F. Wang and L. Q. Zhang, A Combined Molecular Dynamics Simulation and Experimental Method to Study the Compatibility Between Elastomers and Resins, RSC Adv., 2018, 8, 14401 RSC.
- Z. P. Zhang, P. J. Tian, Z. F. Wang, Y. Yang, S. Y. Zhang and J. J. Xia, Experimental Studies and Molecular Dynamics Simulation of the Compatibility Between Thermoplastic Polyurethane Elastomer (TPU) and Asphalt, Constr. Build. Mater., 2024, 411, 134316 CrossRef CAS.
- C. Y. Li and A. Strachan, Cohesive Energy Density and Solubility Parameter Evolution During the Curing of Thermoset, Polymer, 2018, 135, 162–170 CrossRef CAS.
- K. K. Shimizu, M. Tariq, M. F. C. Gomes, L. P. N. Rebelo and J. N. C. Lopes, Assessing the Dispersive and Electrostatic Components of the Cohesive Energy or Ionic Liquids using Molecular Dynamics Simulations and Molar Refraction Data, J. Phys. Chem. B, 2010, 114(17), 5831–5834 CrossRef CAS PubMed.
- P. Becher, The Calculation of Cohesive Energy Density From the Surface Tension of Liquids, J. Colloid Interface Sci., 1972, 38(2), 291–293 CrossRef CAS.
- Y. Masubuchi, T. Kida, Y. Doi and T. Uneyama, Radial Distribution Functions of Entanglements in Primitive Chain Network Simulations, Nihon Reoroji Gakkaishi, 2021, 49(5), 337–345 CrossRef CAS.
- E. Tsuchida, Revisiting the Minimum Image Locus Method for Calculating the Radial Distribution Functions, Comput. Theor. Chem., 2023, 1227, 114256 CrossRef CAS.
- H. Reiss and R. V. Casbreg, Radical Distribution Function of Small Hard Spheres from Scaled Particle Theory, and An Improved Equation of State, J. Chem. Phys., 1974, 61(3), 1107–1114 CrossRef CAS.
- A. Ozcan, R. Semino, G. Maurin and A. O. Yazaydin, Modeling of Gas Transport Through Polymer/MOF Interfaces: A Microsecond-Scale Concentration Gradient-driven Molecular Dynamics Study, Chem. Mater., 2020, 32(3), 1288–1296 CrossRef CAS PubMed.
- H. Tobita, Effect of Branch Point Distribution on the Radius of Gyration in Batch Free-Radical Polymerization with Chain Transfer to Polymer, Macromol. Theory Simul., 2021, 30(3), 2000036 CrossRef CAS.
- M. Y. Lobanov, N. S. Bogatyreva and O. V. Galzitskaya, Radius of Gyration as an Indicator of Protein Structure Compactness, Mol. Biol., 2008, 42, 623–628 CrossRef CAS.
- J. Cantarella, T. Deguchi, C. Shonkwiler and E. Uehara, Radius of Gyration, Contraction Factors, and Subdivisions of Topological Polymers, J. Phys. A: Math. Theor., 2022, 55(47), 475202 CrossRef.
- J. Y. Mane and S. R. Stoyanov, Molecular Dynamics Simulations of the Oil Spill-Treating Phase-Selective Organogelator N-acetyl-L-isoleucine-N’-n-octyl Amide, J. Mol. Liq., 2024, 397, 123960 CrossRef CAS.
- D. N. Theodorou and U. W. Suter, Atomistic Modeling of Mechanical Properties of Polymeric Glasses, Macromolecules, 1986, 19(1), 139–154 CrossRef CAS.
- S. Xi, M. Y. Cui, Q. W. Gao, S. L. Zhao and X. F. Xu, Mechanical Properties of Polybutadiene Rubber with Oxidation Defects: from Molecular Simulations, Ind. Eng. Chem. Res., 2023, 62(40), 16447–16455 CrossRef CAS.
- T. Raaska, S. Niemela and F. Sundholm, Atom-Based Modeling of Elastic Constants in Amorphous Polystyrene, Macromolecules, 1994, 27(20), 5751–5757 CrossRef CAS.
- K. Rajabi and Sh. Hosseini-Hashemi, Application of the Generalized Hooke's Law for Viscoelastic Materials (GHVMs) in Nonlocal Free Damped Vibration Analysis of Viscoelastic Orthotropic Nanoplates, Int. J. Mech. Sci., 2017, 124–125, 158–165 CrossRef.
- P. Kulkarni, B. Jose, S. Sambhudevan and B. Shankar, Influence of SiC and TiO2 on the Cure Characteristics and Mechanical Properties of Natural Rubber Composites, Mater. Today: Proc., 2020, 46, 4451–4453 Search PubMed.
- J. H. Weiner, Statistical Mechanics of Elasticity, Dover Publications, Com, New York, 1983 Search PubMed.
- A. Shokuhfar and B. Arab, The Effect of Cross linking Density on the Mechanical Properties and Structure of the Epoxy Polymers: Molecular Dynamics Simulation, J. Mol. Model., 2013, 19(9), 3719–3731 CrossRef CAS PubMed.
- L. Guo, H. Y. Xu, N. H. Wu, S. Yuan, L. J. Zhou, D. Y. Wang and L. J. Wang, Molecular Dynamics Simulation of the Effect of the Thermal and Mechanical Properties of Addition Liquid Silicone Rubber Modified by Carbon Nanotubes with Different Radii, e-Polymers, 2023, 23, 20228105 CrossRef CAS.
- D. K. Singaravel, S. Sharma, P. Kumar and P. R. Patel, Effect of Functionalization and Defects in Carbon Nanotube on Mechanical Properties and Creep Behavior of Nitrile Butadiene Rubber Composites: A Molecular Dynamics Approach, Polym.-Plast. Technol. Mater., 2023, 62(15), 1998–2014 Search PubMed.
- D. E. Waller and X. Y. Xie, Hydrophilically Modified Curable Silicone Impression Material, US Pat., US6201038, 2001.
Footnote |
| † Electronic supplementary information (ESI) available. See DOI: https://doi.org/10.1039/d4ra04784b |
| This journal is © The Royal Society of Chemistry 2024 |

