 Open Access Article
Degradation of humic acid by UV/PMS: process comparison, influencing factors, and degradation mechanism
Qingchao Shen*ab,
Xiaosan Song *ab,
Jishuo Fanab,
Cheng Chenab and
Zili Guoab
aSchool of Environmental and Municipal Engineering, Lanzhou Jiaotong University, Lanzhou 730070, China. E-mail: songxs@mail.lzjtu.cn
bKey Laboratory of Yellow River Water Environment in Gansu Province, Lanzhou Jiaotong University, No. 88 Anning West Road, Lanzhou 730070, China
First published on 22nd July 2024
Abstract
In natural water bodies, humic acid (HA), generated during the chlorination disinfection process at water treatment plants, can produce halogenated disinfection by-products, increasing the risk to drinking water safety and posing a threat to human health. Effectively removing HA from natural waters is a critical focus of environmental research. This study established a synergistic ultraviolet/peroxymonosulfate (UV/PMS) system to remove HA from water. It compared the efficacy of various UV/advanced oxidation processes (AOPs) on HA degradation, and assessed the influence of different water sources, initial pH, oxidant concentration, and anions (HCO3−, Cl−, NO3−) on HA degradation. The degradation mechanism of HA by the UV/PMS process was also investigated. Results showed that under the conditions of 3 mmol L−1 PMS concentration, 10 mg L−1 HA concentration, initial solution pH of 7, and a reaction time of 240 minutes, the mineralization rate of HA by UV/PMS reached 94.15%. The pseudo-first-order kinetic constant (kobs) was 0.01034 and the single-electric energy (EE/O) was 0.0157 kW h m−3, indicating superior HA removal efficiency compared to other systems. Common anions (HCO3−, Cl−, NO3−) in water were found to inhibit the degradation of HA, and acidic conditions were more conducive to HA removal, with the optimal pH being 3. Free radical quenching experiments showed that both sulfate radical (SO4−˙) and hydroxyl radical (˙OH) radicals were involved in HA degradation, with SO4−˙ being the primary oxidant and ˙OH as the auxiliary species. Analyses using 3D-excitation-emission matrix (EEM), parallel factor analysis (PARAFAC), specific fluorescence index, and absorbance demonstrated that UV/PMS technology could effectively degrade HA in water. This study provides theoretical references for further research on the removal of HA and other organic substances using UV/PMS technology.
1 Introduction
Humic acid (HA), a key component of natural organic matter (NOM), primarily originates from the decomposition of plant and animal metabolic products. It is widely found in surface water and groundwater.1,2 HA's molecular structure is complex and variable, containing various active functional groups such as phenolic hydroxyl, carboxyl, and alcohol hydroxyl.3 These properties endow HA with unique acidity, hydrophilicity, and ion exchange capacity, enabling it to adsorb organic and inorganic pollutants, undergo ion exchange and chelation reactions, deteriorate water quality, and pose threats to human health and the ecological environment.4 Currently, developing efficient methods to remove HA has become a prominent issue in environmental research.The primary methods for controlling HA in water include physical and chemical approaches. Physical removal techniques for HA, such as adsorption5 and filtration,6 merely transfer HA to a solid phase, necessitating subsequent solid waste management. Chemical oxidation methods, including electrochemical oxidation,7 Fenton oxidation,8 and photocatalysis,9–11 have attracted researchers' attention due to their ability to rapidly decompose and mineralize HA.12 Among these, advanced oxidation processes (AOPs) are particularly noted for their operational simplicity, high efficiency, and absence of secondary pollution,13 and have been employed to remove various micropollutants. AOPs generate highly oxidative radicals such as ˙OH and SO4−˙,14 which degrade and mineralize organic pollutants in surface water sources. The sulfate radical (SO4−˙) has a higher oxidation potential (E0 = 2.5–3.1 V) and a longer lifespan (t = 30–40 μs) than ˙OH (E0 = 2.8 V, t = 0.02 μs), enhancing its capacity to oxidize organic substances.15 Moreover, SO4−˙ exhibits greater selectivity and efficiency towards pollutants containing unsaturated bonds or aromatic rings, making it more effective in removing micropollutants from water.16,17
Currently, SO4−˙ is primarily generated by activating peroxydisulfate (PS) through thermal energy, light energy, alkaline conditions, ultrasound, and transition metals. Among various activation methods, photocatalysis has become a focus of interest due to its environmentally friendly characteristics.18 In particular, the ultraviolet (UV) activation of peroxydisulfate is a low-cost, energy-saving method that avoids heavy metal pollution.19 It has shown significant effectiveness in treating pharmaceuticals, personal care products, pesticides, and industrial chemicals.20–23 In advanced oxidation processes using persulfate, the commonly used oxidants are peroxymonosulfate (PMS) or peroxodisulfate (PDS). Tang et al.24 compared the effectiveness of UV/PMS and UV/PDS in removing HA and found that UV/PMS was superior in terms of degradation efficiency, rate, and cost-effectiveness. Fang25 demonstrated that UV/PMS was more effective in treating HA compared to H2O2 and direct UV irradiation. PMS, with its shorter O–O bond and unique asymmetric structure, is more easily activated to produce oxidative radicals. Using UV to activate PMS to produce SO4−˙ is a straightforward and environmentally friendly method. Compared to other activation techniques (such as heat or metal cations), it is simpler and does not introduce other substances, making UV/PMS a practical water and wastewater treatment technology for removing HA.26
This study compared the effectiveness of different UV/AOPs in treating HA, evaluating the impact of varying water sources, initial pH, oxidant concentration, and water anions (HCO3−, Cl−, NO3−) on HA degradation. Through radical quenching experiments, the main active substances in the synergistic system were identified, and the mechanism of HA degradation by the UV/PMS process was systematically explored using 3D-EEM, parallel factor analysis, specific fluorescence index analysis, and absorbance analysis. The results of this study provide a theoretical reference for the subsequent application of UV/PMS in treating HA and other organic substances.
2 Methods
2.1 Experimental reagents and equipment
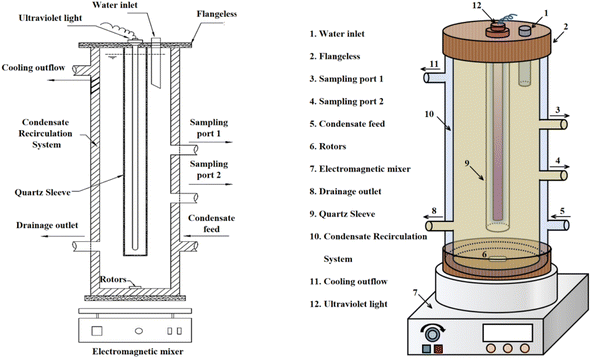
The device is designed for ease of use, with a detachable UV lamp glass tube that facilitates the replacement of UV lamps of various specifications and types. Sampling ports are strategically positioned at different heights for convenient sampling, and a reagent addition port at the top simplifies the introduction of reagents. The outer glass condensing water system mitigates the issue of temperature increase during UV lamp irradiation. The full immersion UV lamp used in the study is from the Osram brand, model HNS 4P SE.
2.2 Experimental investigation indicators and testing methods
2.2.1.1 Physical indicators. Temperature and pH changes in water samples were monitored using a thermometer and pH meter. The pH was adjusted using 0.05 mol L−1 NaOH and 0.05 mol L−1 H2SO4 buffer solutions. Prior to testing, calibration solutions with pH values of 4.0, 6.86, and 9.18 were employed to calibrate the pH meter.
2.2.1.2 Chemical oxygen demand (COD). COD was measured using the acidified potassium permanganate method, in accordance with standard GB 11892-89. This method is applicable to water samples containing chlorine ions up to 30 mg L−1. If the potassium permanganate index exceeds 10 mg L−1, the sample should be diluted before measurement.
2.2.3.1 UV254. The UV254 absorbance was determined using a UV spectrophotometric method. The UV2600A UV spectrophotometer, which requires a 0.5 hours preheating period, was used for this purpose. Samples were filtered through a 0.45 μm filter membrane and measured at a wavelength of 254 nm.
2.2.3.2 Specific ultraviolet absorbance (SUVAχ). The SUVAχ value indicates the aromaticity of organic matter in water. A higher SUVAχ value suggests a greater presence of unsaturated double bonds or aromatic ring structures in the organic matter.
 | (1) |
2.2.5.1 Organic matter degradation rate.
 | (2) |
2.2.5.2 Single electrical energy consumption (EE/O).
 | (3) |
2.3 Experimental operations and procedures
Before the beginning of the experiment, the UV lamp should be preheated for 20 min to ensure the stability of UV radiation intensity. Before running the experimental device, the whole device should be placed in a magnetic stirrer, with the help of rotor stirring, to realize the uniformity of the reaction and constant temperature operation. After the UV lamp is preheated, it is installed in the casing of the device, and at the same time, the reaction solution and the required reagents are introduced into the glass tube. Finally, the device was wrapped tightly with light-impermeable tinfoil to avoid the interference of the external light source and to prevent the UV radiation from causing damage to the eyes of the experimenters. At the beginning of the experiment, the UV lamp was activated, and the condensation circulator and magnetic stirring device were operated, during which the UV radiation intensity of 3.28 mW cm−2, the reaction temperature of 25 ± 3 °C, and the rotational speed of 630 rpm were maintained, in which the experimental groups of this study were required to carry out three parallel experiments, and the results of the experimental results were taken as the average value. At the end of the experiment, a certain amount of reaction solution was taken out for determination and analysis.3 Results and discussion
3.1 Removal of natural water HA by different UV/AOPs synergistic systems
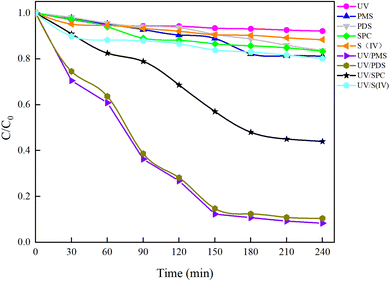
Under an initial solution pH of 7, an initial HA concentration of 10 mg L−1, and the addition of 3 mmol L−1 of AOPs (PMS, PDS, SPC (sodium percarbonate), S(IV) (sodium sulfurous acid)), and the reaction proceeded for 240 minutes. This study employed various methods such as direct UV photolysis, AOPs oxidation, and UV/AOPs synergistic treatment to analyze the degradation effects of different systems on HA (Fig. 2). In the UV/oxidant process, the removal of HA by different concentrations of oxidants followed pseudo-first-order kinetics. The first-order rate constant (kobs) was determined by eqn (4) and is listed in Table 1.
 | (4) |
| System | First-order kinetic equation | kobs (min−1) | R2 | EE/O (kW h m−3) |
|---|---|---|---|---|
| UV/PMS | Ln(C0/C) = 0.01034t + 0.1516 | 0.01034 | 0.928 | 0.0157 |
| UV/PDS | Ln(C0/C) = 0.0094t + 0.1355 | 0.00940 | 0.919 | 0.0204 |
| UV/SPC | Ln(C0/C) = 0.00342t + 0.0147 | 0.00342 | 0.975 | 0.0561 |
| UV/S(IV) | Ln(C0/C) = 0.00051t + 0.0077 | 0.00051 | 0.978 | 0.3750 |
In Fig. 2, under conditions of direct UV photolysis and single AOPs oxidation, the mineralization rate of HA was less than 15%, indicating minimal mineralization. In UV/AOPs synergistic systems, UV/PMS, UV/PDS, and UV/SPC exhibited significant mineralization effects, with C/C0 values of 5.85%, 10.47%, and 44.00%, corresponding to mineralization rates of 94.15%, 89.53%, and 56%, respectively. The UV/S(IV) system had a C/C0 of 80.20%, with a mineralization rate of only 20%, indicating the poorest performance. Comparative analysis revealed that direct UV photolysis and single oxidant treatments were ineffective at generating sufficient radicals to oxidize and degrade HA efficiently, requiring external energy to activate the oxidants and produce potent oxidative radicals. This demonstrates that the UV/AOPs system process can more effectively promote the decomposition of organic matter.
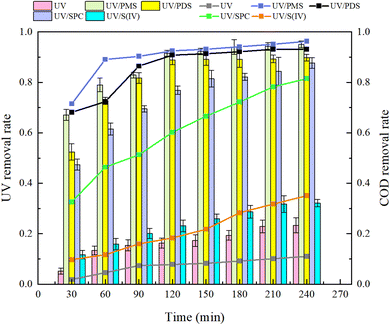
Analysis of Fig. 3 shows that after a 240 minutes reaction in the oxidation system, the highest UV254 and COD removal rates were observed in the UV/PMS synergistic process, achieving 95.07% and 96.26%, respectively. This was followed by the UV/PDS and UV/SPC processes, while the UV/S(IV) process demonstrated the poorest performance, with UV254 and COD removal rates of only 32.14% and 35.06%, respectively. Analysis of the fitted first-order kinetic equations (Table 1) showed that the kobs ranked from highest to lowest as UV/PMS > UV/PDS > UV/SPC > UV/S(IV), with kobs values of 0.01034 and 0.00940 for UV/PMS and UV/PDS, respectively, which are significantly higher than 0.00342 and 0.00051 for UV/SPC and UV/S(IV), respectively. The comparison indicates that the UV/PMS process had the best mineralization rate and removal effect for HA. PMS, being an efficient oxidant with an asymmetric dipole structure and high oxidation potential, also has low molecular orbital energy which facilitates easier electron acceptance compared to the other three oxidants.27 This allows PMS to be activated and release oxidative radicals more quickly, thereby enhancing the efficiency of organic matter removal from water. Although PDS is also an effective oxidant, its symmetrical molecular structure requires more energy to be activated and to produce oxidative radicals. This explains why the single use electrical energy for PMS (0.0157 kW h m−3) is lower than that for PDS (0.0204 kW h m−3), as outlined in Table 1, where Table 2 shows the results of the remaining researchers compared to this paper.
| Processing | Concentration | pH | AOPs | Time | Degradation rate | Reference |
|---|---|---|---|---|---|---|
| UV/H2O2 | 15 mg L−1 | 4 | H2O2: 3 mmol L−1 | 180 min | 21.9% | 24 |
| UV/PDS (H2S2O8) | 6 | PDS: 3 mmol L−1 | 120 min | 92.9% | 24 | |
| UV/SPC (Na2CO3) | 5 mg L−1 | 9.9 | SPC: 0.5 mmol L−1 | 90 min | 92.1% | 28 |
| UV/PMS (H2SO5) | 2 mg L−1 | 7 | PDS: 0.5 mmol L−1 | 180 min | 100% | 29 |
| UV/SPB (NaBO3) | 10 mg L−1 | 3 | SPB: 1 mmol L−1 | 60 min | 88.8% | 30 |
| UV/PMS (H2SO5) | 10 mg L−1 | 3 | PMS: 3 mmol L−1 | 180 min | 92.09% | This work |
Considering the mineralization rate of HA, removal effect, and single electrical energy consumption, the UV/PMS synergistic system emerges as the best choice for removing HA from water, followed by UV/PDS, UV/SPC, and UV/S(IV) synergistic systems.
3.2 Effect of different water sources on HA removal
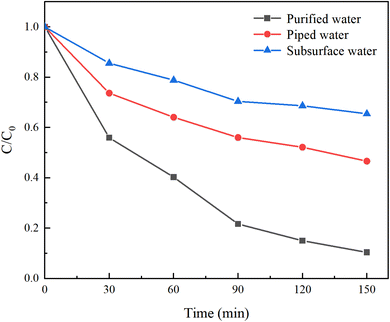
In contrast to laboratory-prepared water, real water sources contain various suspended particles, impurity ions, and other factors that can interfere with HA removal. To investigate the impact of different water sources on HA removal, natural water, tap water, and ultrapure water were selected for a comparative study. Natural water was sourced from the Yellow River in Lanzhou, Gansu Province, with a pH of 8.46 ± 0.5, and was filtered before use. Under an initial solution pH of 5, a PMS concentration of 3 mmol L−1, and an HA concentration of 10 mg L−1, the reaction proceeded for 150 minutes. The results are illustrated in Fig. 4.After 150 minutes of reaction, the C/C0 values for ultrapure water, tap water, and natural water were 10.39%, 46.62%, and 65.45%, respectively, with corresponding mineralization rates of 89.61%, 53.58%, and 34.55%. This demonstrates that both natural water and tap water inhibit HA removal. The reasons for this are twofold: (1) natural water contains complex components, and other NOM present will compete with HA for SO4−˙ generated by PMS; (2) various anions present in natural water and tap water inhibit the activity of oxidative radicals, thereby reducing the efficiency of HA removal.30 Among them, tap water, having undergone precipitation, filtration, and other treatment processes, significantly reduced the content of anions, resulting in a weaker inhibition of HA degradation compared to surface water.
3.3 Effect of initial pH on HA removal
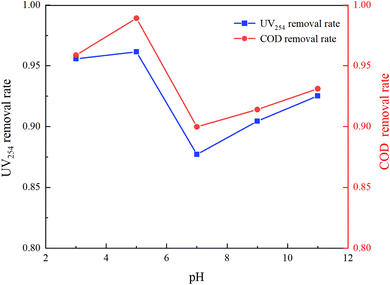
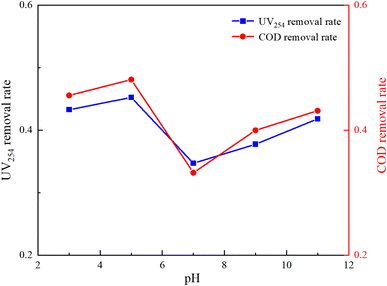
The molecular form, solubility, and reactivity of HA with free radicals are all influenced by the initial pH value of the water.31 This experiment was designed to explore the degradation of HA under various initial pH values (3, 5, 7, 9, 11) in natural and laboratory-prepared waters. The experiment was conducted under an initial HA concentration of 10 mg L−1, 3 mmol L−1 of PMS added and a stirring speed of 630 rpm. By controlling different initial reaction pH values, the reaction lasted for 150 minutes. The sampling and detection results are depicted in Fig. 5 and 6.Fig. 5 and 6 demonstrate that pH significantly influences HA removal in both water types. At a pH of 5, the UV254 and COD removal rates in the experimental water reached as high as 96.15% and 98.92%, respectively, with HA being almost completely mineralized. At a pH of 3, the UV254 and COD removal rates were 95.58% and 95.88%, respectively. When the pH ranged from 7 to 11, the UV254 and COD removal rates were slightly lower than those in acidic initial solutions. Although the removal rates of UV254 and COD in natural water were lower than those in laboratory-prepared water, the basic trends remained consistent. At a pH of 5, the removal rate of HA was the highest, followed by pH 3, 11, 9, and 7, indicating that the UV/PMS process is most effective for the mineralization of HA under acidic conditions.
HA molecules are neutral in strongly acidic environments, which enhances their photochemical activity compared to neutral and alkaline conditions.32 Acidic initial conditions facilitate the photochemical reaction of HA, increasing its removal rate under UV irradiation. In an alkaline environment, the main products of activated PMS are OH˙, 1O2, and O2−˙, which have a weaker oxidation ability than SO4−˙. In alkaline solutions, quenching (eqn (5)) and radical transfer (eqn (6)) between SO4−˙ and OH˙ may occur, reducing the number and oxidation capacity of oxidative radicals.33 Therefore, slightly acidic conditions are more conducive to the degradation of HA in the UV/PMS reaction system.
SO4˙− + ˙OH → HSO5−![[thin space (1/6-em)]](https://www.rsc.org/images/entities/char_2009.gif) k = 1.1 × 10¹⁰ M−1 S−1 k = 1.1 × 10¹⁰ M−1 S−1
| (5) |
SO4˙− + OH− → SO42− + ˙OH![[thin space (1/6-em)]](https://www.rsc.org/images/entities/char_2009.gif) k = 6.5 × 10¹⁰ M−1 S−1 k = 6.5 × 10¹⁰ M−1 S−1
| (6) |
3.4 Effect of oxidant concentration on HA removal
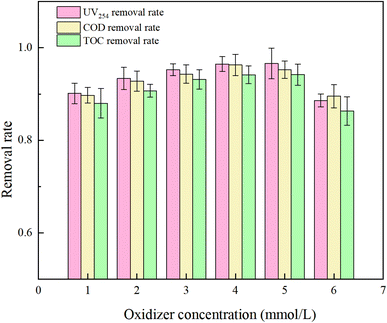
PMS serves as a source of oxidative radicals and plays a crucial role in the removal of HA from water. Under experimental conditions a an initial solution pH of 5, a PMS concentration of 3 mmol L−1, and an HA concentration of 10 mg L−1, the reaction proceeded for 150 minutes. The effect of PMS concentration on the degradation rate of HA was investigated, and the results are presented in Fig. 7 and 8.Fig. 7 reveals that with increasing oxidant concentration, the removal rates of UV254, COD, and TOC continuously increase at low concentrations (PMS = 1, 2, 3, 4 mM L−1), reaching a maximum of 96.47%, 96.29%, and 94.16%, respectively. However, when the PMS concentration exceeds 5 mM L−1, a shielding effect occurs,34 and the removal efficiencies of UV254, COD, and TOC decrease to 88.58%, 89.52%, and 86.31%. This analysis indicates that at excessively high PMS concentrations, the likelihood of radical–radical interactions (eqn (7) and (8))35 and excess PS–SO4−˙ and ˙OH reactions (eqn (9) and (10))36 increases, reducing the rate of free radical oxidation of HA.
| SO4−˙ + H2O → HSO5− + ˙OH | (7) |
| HSO5− + ˙OH → SO5−˙ + HO2 | (8) |
| SO4−˙ + H2O → HSO5− + ˙OH | (9) |
| ˙OH + ˙OH → H2O2 | (10) |
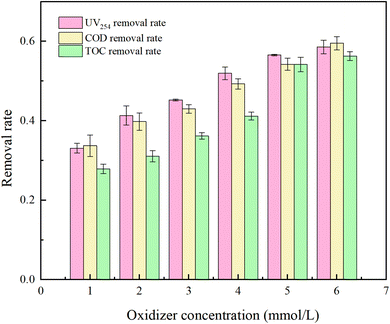
Fig. 8 reflects that in natural water, UV254, COD, and TOC removal increased by 25.48%, 25.81%, and 28.43%, respectively, as the oxidant concentration was increased from 1 mM L−1 to 6 mM L−1. Although the oxidation efficiency was not as good as the water distribution experiment, there was no threshold. The reason for this was analyzed as too high a concentration of PMS would inhibit the removal rate of HA due to its own scavenging effect in an ideal condition without the influence of impurities. In natural water, the number of oxidizing radicals in the water gradually increased with the increase of PMS concentration, but the degradation rate of HA by the UV/PMS system continued to increase due to the presence of other organic impurities in itself, which resulted in the oxidant always being in short supply.
The reasons why the degradation rate of HA in natural water is lower than the ideal state include: ① the turbidity of natural water is greater than that of pure water, and despite filtration, many soluble substances remain, leading to incomplete activation of PMS and low efficiency of free radical generation; ② organic impurities present in the water compete for free radicals, so even with an elelvation of oxidant concentration, the removal effect of HA in natural water is still not as effective as in the prepared water experiment.
3.5 Effect of anions in solution on HA removal
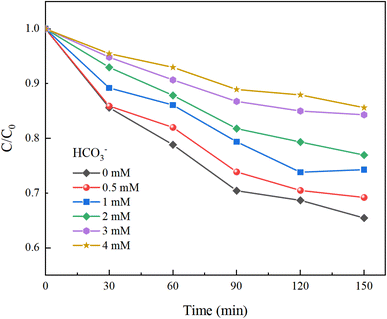
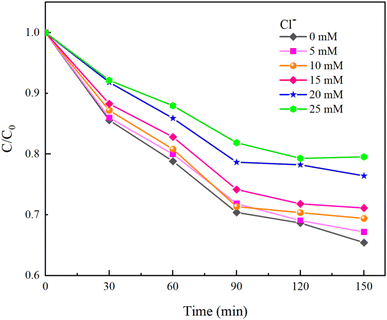
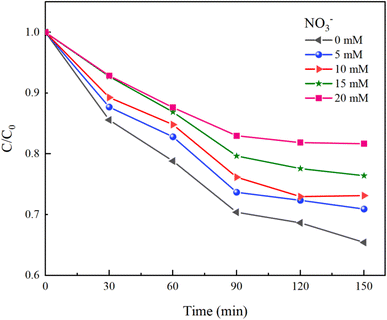
Inorganic anions present in water can alter the types of oxidative radicals produced by PMS, reduce oxidation efficiency, and adversely affect the effectiveness of PMS in removing HA. This study examined the impacts of common anions including NO3−, Cl−, and HCO3− in natural water on the removal of HA using the UV/PMS process.Under experimental conditions with an initial solution pH of 7, a PMS concentration of 3 mmol L−1, and varying concentrations of HCO3− (0–4.0 mM), Cl− (0–25 mM), and NO3− (0–20 mM), with an HA concentration of 10 mg L−1, the reaction proceeded for 150 minutes. We explored the effects of HCO3−, Cl−, and NO3− in the solution on the HA removal efficiency of the UV/PMS process, and the results are displayed in Fig. 9–11.
In Fig. 9, as the concentration of HCO3− in the solution increases, the efficiency of HA degradation is significantly inhibited. At HCO3− concentrations of 0 mM and 4 mM, the degradation rates of HA were 34.55% and 14.4%, respectively, marking a decrease of 58.32%. HCO3− undergoes hydrolysis (eqn (11) and (12)),37 forming an HCO3−–CO32− system. The reasons for the inhibition of HA degradation include: ① HCO3− itself acts as a free radical scavenger, reacting with SO4−˙ and OH˙ (eqn (13) and (14)), reducing the number of oxidative radicals available in the solution; ② the ˙OH generated is consumed by CO32− to produce CO3−˙ (eqn (15)), which has a weaker oxidation ability, thus reducing HA oxidation and removal.38 Additionally, the addition of HCO3− increases the solution pH, and the oxidation–reduction potential E0 of CO3−˙ decreases,39 further diminishing the oxidation capacity of CO3−˙.
H2CO3(aq) → H+ + HCO3−![[thin space (1/6-em)]](https://www.rsc.org/images/entities/char_2009.gif) pKa = 6.37 pKa = 6.37
| (11) |
HCO3− → H+ + CO32−![[thin space (1/6-em)]](https://www.rsc.org/images/entities/char_2009.gif) pKa = 10.33 pKa = 10.33
| (12) |
 | (13) |
| ˙OH + HCO3− → 2CO3−˙ + H2O | (14) |
| ˙OH + CO32− → CO3−˙ + OH− | (15) |
As shown in Fig. 10, HA removal decreased by 14.11% when the Cl− concentration was increased from 0 mM to 25 mM. HA removal changed only by 5.7% when the Cl− concentration ranged from 0 to 15 mM, indicating that the low concentration of Cl− has less effect on HA removal. It was analyzed that excess Cl− not only consumes ˙OH in water to generate ClOH−˙, but also quenches SO4−˙ in water to generate Cl˙ and Cl2−˙ (eqn (16)–(18)).40 When ˙OH and SO4−˙ with strong oxidizing effects in water are replaced by weaker radicals, the degradation of HA by the UV/PMS system will be seriously affected. At the same time, the newly generated chloride in the water will seriously damage human health and also cause corrosion of the subsequent water treatment equipment, so attention needs to be paid to the fact that when the concentration of Cl− in the solution exceeds the standard, the ion exchange method can be used to reduce the concentration of Cl− in the water.
| ˙OH + Cl− → ClOH−˙ | (16) |
| Cl˙ + Cl− → Cl2−˙ | (17) |
| SO4−˙ + Cl− → Cl˙ + SO42− | (18) |
Moreover, Cl− can also compete with HA for free radicals and react with the oxidant to produce hypochlorous acid (eqn (19)), with high concentrations of Cl− accelerating the reaction with PMS.41 Under acidic conditions, hypochlorous acid can further transform into chlorine gas (eqn (20)). Hence, excessive chloride ions negatively impact the stability of PMS.
| HSO5− + Cl− → SO42− + HOCl | (19) |
| HOCl + H+ + Cl− → Cl2↑ + H2O | (20) |
NO3− does not react with PMS and does not affect the solution pH, so it does not impact the stability of the oxidant.42 In the UV/PMS system, NO3− plays two roles:43 ① NO3− absorbs UV light to generate O−˙ and  , which in turn produce ˙OH to degrade HA (eqn (21) and (22)); ② NO3− reacts with the SO4−˙ generated by PMS to produce
  , which has a lower oxidation capacity than SO4−˙ (eqn (23)). In Fig. 11, as the NO3− concentration increases, the mineralization rate of HA decreases from 34.55% to 18.31%, a reduction of 47%, indicating that NO3− has an inhibitory effect on HA degradation. Overall, the inhibitory effect of NO3− on HA degradation is more pronounced than its promoting effect.
 | (21) |
| O−˙ + H2O + hv → ˙OH + OH− | (22) |
 | (23) |
3.6 Mechanism of HA removal by UV/PMS
As shown in Fig. 12, the energy input of UV light causes the O–O bonds of PMS to split, and during this activation process, the application of external energy in excess of the bond energy causes the peroxygen bonds of PMS to break, resulting in the production of SO4−˙ and ˙OH. which act as strong oxidizing agents and are capable of degrading a wide range of pollutants more rapidly.
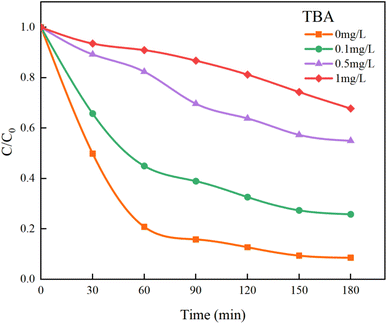
In Fig. 13, the addition of TBA significantly decreased the mineralization rate of HA. As the concentration of TBA increased, the mineralization rate dropped from the original 91.41% to 32.22%. However, the mineralization effect on HA was not completely suppressed because the remaining SO4−˙ in the solution could still continue to mineralize HA. Although TBA also quenches SO4−˙, its rate of removing ˙OH is approximately three orders of magnitude higher than that of SO4−˙ (kTBA, SO4−˙ = 4.0–9.1 × 10⁵ M−1 s−1, kTBA, ˙OH = 1.8–2.8 × 10⁹ M−1 s−1).44 Therefore, within a limited concentration range, TBA will preferentially capture and quench ˙OH.
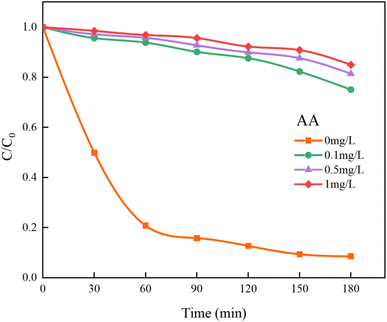
In Fig. 14, the addition of AA resulted in a decrease in the overall mineralization rate of HA by 76.41%, which is significantly greater than the 59.19% reduction observed with TBA. This demonstrates that SO4−˙ contributes more to the removal of HA than ˙OH, making it the primary oxidative radical. Additionally, other reactive species such as singlet oxygen (1O2) and superoxide anions (O2−˙) generated in the UV/PMS system45 cannot be quenched by TBA and AA. Thus, even at high concentrations of TBA and AA, the removal of HA is not completely inhibited. Further studies indicate that SO4−˙ and ˙OH are the primary radicals under acidic and alkaline conditions, respectively.46 After introducing different concentrations of PMS to the solution, the pH drops sharply, becoming strongly acidic. Consequently, it is inferred that SO4−˙ is the main oxidizing species and plays a major role in the UV/PMS co-treatment of HA, while ˙OH is an auxiliary agent in the oxidation of HA.
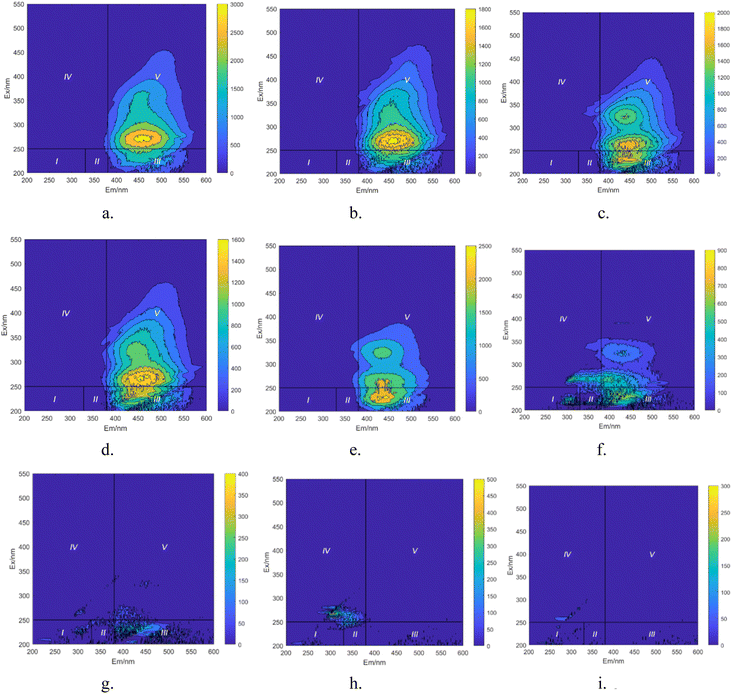
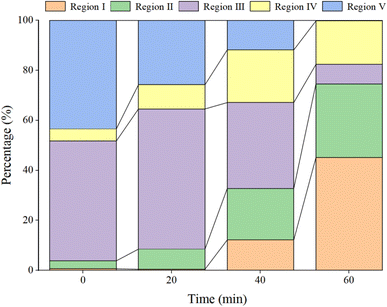
In Fig. 15a, prior to the initiation of the reaction, both region III (FA) and region V (HA-like substances) display significant fluorescence responses, with the strongest fluorescence peak observed. This suggests the presence of a substantial amount of both large and small organic molecules in the initial solution, with the fluorescence response predominantly originating from fluorescent groups such as hydroxyl and carboxyl functional groups. In Fig. 16, at t = 0 min, regions II and IV exhibit weak fluorescence responses related to aromatic proteins, which are typically associated with microbial activity. However, since the reaction solution is not derived from natural water, the initial fluorescence response is subdued. As the reaction progresses (Fig. 15c), the fluorescence response in region V decreases, indicating a trend toward the generation of new fluorescence peaks. In Fig. 15e and 16, at t = 40 min, there is a noticeable reduction in the fluorescence material in regions III and V, accompanied by the emergence of new peaks. This suggests ongoing mineralization of HA in the solution and the generation of new substances. At 60 min into the reaction (Fig. 15g), no strong fluorescence peak is detected in region V, and the fluorescence intensity in region III also decreases significantly, while the fluorescence intensity in other regions increases slightly. This suggests that HA-like substances and FA-like substances have been mineralized and removed, with some being degraded into intermediate products such as tyrosine-like substances, tryptophan-like substances, and soluble microbial by-products, as well as other small molecular organic compounds. When the reaction reaches 80 min (Fig. 15i), the fluorescence responses in regions I–III essentially disappear, indicating that HA and its intermediate products are almost completely mineralized.
Based on the positions of the fluorescence peaks, the spectral range was divided into seven different regions (Table 3).47–49 In Fig. 17, during the degradation of HA, fluorescent peaks appear successively in four regions of the water sample. Initially, the solution displays three fluorescent peaks (Fig. 17a): peak A (Ex/Em = 230 nm/450 nm), peak C1 (Ex/Em = 310 nm/460 nm), and peak C2 (Ex/Em = 360 nm/460 nm). Peaks C1 and C2 are located in region V, representing humic substances visible in the light zone. Peak A is found in region III, representing UV zone FA. These three peaks are characteristic of HA-like fluorescent substances, with peak C1 exhibiting the strongest fluorescence response and being the predominant substance in the solution. As the reaction progresses (Fig. 17b), the intensity of the fluorescence response at peaks C decreases significantly, and new peak shapes appear, namely peak B (Ex/Em = 225 nm/305 nm) and peak T (Ex/Em = 265 nm/310 nm). Peak B is located in region I, and peak T in region IV, representing protein-like fluorescent substances, specifically tyrosine-like and tryptophan-like substances, respectively. Most researchers believe that peak T is related to macromolecular organic matter or colloidal substances, while peak B represents small molecular organic matter.50 The weakening of old peak shapes and the emergence of new ones indicate that large molecular substances in the solution are degraded into smaller molecular substances, and the original functional group structures are disrupted. As the reaction nears completion (Fig. 17c), only peak T remains, indicating that in the UV/PMS synergistic system, highly oxidative radicals can efficiently achieve mineralization of HA.
| Peak | Type | Em/nm | Ex/nm |
|---|---|---|---|
| A | UV region FA | 370–460 | 230–260 |
| B | Protein-like (tryptophan-like) | 305–310 | 225–230 |
| C | Visible light region humic substance | 370–480 | 310–360 |
| D | Soil HA | 430–510 | 350–440 |
| E | Soil HA | 420–450 | 280–288 |
| T | Protein-like (tryptophan-like) | 320–350 | 275 |
| M | Marine-derived humic substance | 380–420 | 330–350 |
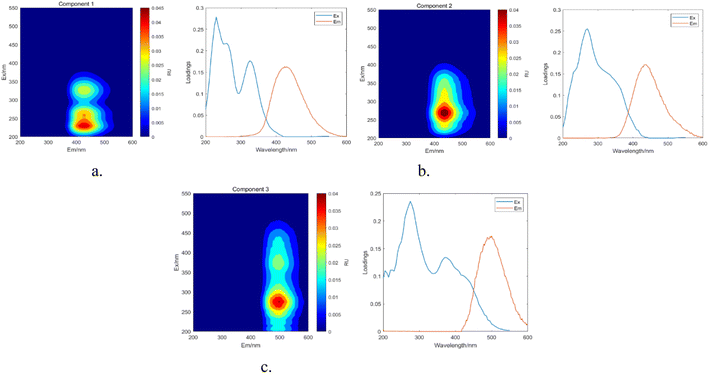 | ||
| Fig. 19 Parallel factor and loading plots. (a) Factor 1 and loading plot. (b) Factor 2 and loading plot. (c) Factor 3 and loading plot. | ||
The maximum wavelengths for each component, based on the Ex and Em loading plots in Fig. 19, are as follows: C1: Ex/Em = 230 nm/424 nm; C2: Ex/Em = 270 nm/438 nm; C3: Ex/Em = 275 nm/500 nm. These component models were uploaded to the Openfluor database and matched within it, with Em and Ex wavelength confidence intervals set at 0.96. The matching results are summarized in Table 4.
| Component | Ex max (nm) | Em max (nm) | Composition | Matching literature |
|---|---|---|---|---|
| C1 | 230 | 424 | Terrestrial HA | C1-Walker et al.51 |
| UV region FA | C1-Ryan et al.52 | |||
| Terrestrial humic substance | C1-Panettieri et al.53 | |||
| Humic substance | C1-Amaral et al.54 | |||
| C2 | 270 | 438 | Humic substance | C1-Smith et al.55 |
| Terrestrial HA | C1-Wauthy et al.56 | |||
| Humic substance | C2-Eder et al.57 | |||
| C3 | 275 | 500 | Humic substance | C1-Lambert et al.58 |
| Soil yellow HA | C4-Huguet et al.59 | |||
| Terrestrial HA | C3-Murphy et al.60 |
According to the matching results in Table 4, in conjunction with the area integration analysis and the peak positions of the three fluorescent factors, component C1 is identified as UV-zone HA-like, containing two peaks with peak A having the strongest fluorescence response and peak C as a secondary peak. These findings align with Panettieri et al.,53 where peak A represents terrestrial humic substances negatively correlated with dissolved organic matter (DOM) biodegradability, and peak C is similar to fluorescent groups associated with biological activity in freshwater DOM, indicating its widespread presence in the environment. The fluorescence intensity of peak A surpasses that of peak C, indicating that peak A possesses a higher molecular weight and greater aromaticity. Component C2 is identified as terrestrial humic substances with only one characteristic fluorescence peak, peak A, representing refractory terrestrial humic substance fluorescent groups,57 associated with waters with high organic matter load. Component C3 is interpreted as soil-like HA, containing a mixture of two peaks, with peak D being the prominent peak. Lambert et al.58 suggest that C3 typically occurs in freshwater and is associated with high molecular weight and aromatic molecules from terrestrial sources, which are prone to photodegradation.
| BIX = Iem(380 nm)/Iem(430 nm)(λex(310 nm)) | (24) |
| HIX = ΣIem(435 nm−480 nm)/ΣIem(300 nm−345 nm)(λex(254 nm)) | (25) |
| BIX | HIX | FluI | Fmax | |||
|---|---|---|---|---|---|---|
| C1 | C2 | C3 | ||||
| Max | 0.49468109 | 1.000091258 | 1.859563882 | 2406.156 | 2700.972 | 1534.438 |
| Min | 0.20712789 | 0.737115578 | 1.063203214 | 1.116588 | 0.2347 | 0.298081 |
| Mean | 0.38059421 | 0.978994115 | 1.677082145 | 759.962 | 596.809 | 472.726 |
In Table 5, the maximum value of FluI is 1.859563882, the mean value is 1.677082145, and the lowest is 1.063203214, with all values ranging between 1.4 and 1.9. This range indicates that humic substances are derived from both internal and external sources, predominantly from algal or microbial degradation of endogenous metabolites and terrestrial exogenous input of organic matter.61 The overall FluI value is low, indicating that humic substances contain a significant number of benzene ring structures and are highly aromatic. The HIX values range from 0 to 1, with an average of 0.978994115, signifying a high degree of humification and the presence of significant aromatic content and high molecular weights in the organic matter.62 BIX values are all below 0.8, indicating that some organic matter in the humic substances is of exogenous origin and has low biodegradability.
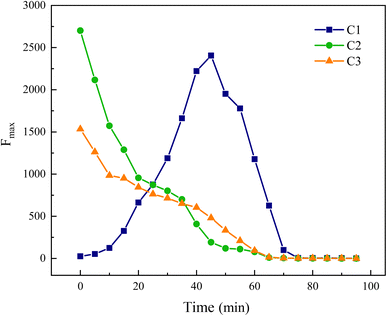
The fluorescence characteristics of each component can be quantified by the Fmax value, which represents the maximum fluorescence intensity.
In Fig. 20, components C2 and C3 are progressively decomposed as the reaction advances, whereas the Fmax of component C1 initially rises before declining, suggesting an initial increase followed by a decrease in its concentration in the water. This analysis indicates that components C2 and C3 are transformed into component C1. Moreover, C1 corresponds to the fluorescence peak A in region III, reflecting an initial increase and subsequent decrease in UV-zone HA within this region, which aligns with the findings from the area integration analysis depicted in Fig. 15.
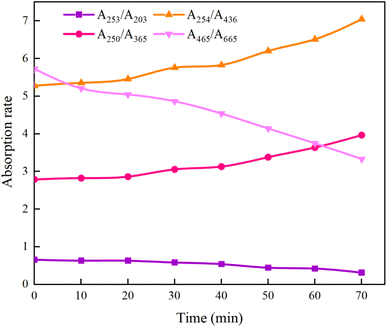
As can be seen from Fig. 21, after the reaction was carried out for 70 min, A253/A203 decreased from the initial 0.66 to 0.32, indicating that the stability of the functional groups such as carboxyl and carbonyl groups within the aromatic structure of HA decreased, resulting in a decreasing trend in the content of the substituted aromatic ring structure within the HA molecule; A465/A665 decreased from 5.73 to 3.33, which is a further evidence of the disruption of the aromaticity in HA. The increase of A254/A436 from 5.28 to 7.05 indicates that the chromophore group of HA was gradually broken, which led to the increase of its removal rate; and the increase of A250/A365 from 2.79 to 3.97 indicates that the molecular weight of HA decreased. The comprehensive changes of A253/A203, A465/A665, A254/A436, and A250/A365 show that the UV/PMS synergistic system is very ideal for the degradation of HA in water, which is of value for the subsequent large-scale application. In addition to the above four indicators, researchers can use Color465/Color665 (specific absorbance ratio) and SR = (S275−295/S350−400) (SR is defined as the ratio of the slope in the 275–295 nm region to the slope in the 350–400 nm region) to determine the degradation effect of HA in water region to the slope in the 350–400 nm region,64 which reflect the changes in aggregation and molecular weight of organic molecules, respectively, to further verify the effectiveness of UV/PMS in degrading HA.
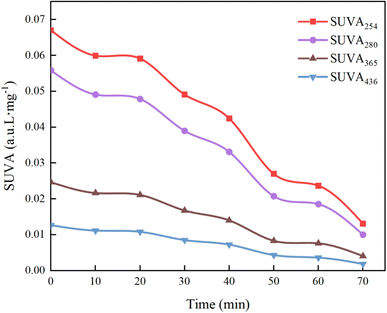
As shown in Fig. 22, the decrease in the values of SUVA254 and SUVA280 indicates that during the degradation of HA by UV/PMS, the oxidizing free radicals break the quinone chemical bond on the benzene ring, leading to the destruction of the original aromatic structure, the decrease in hydrophobicity and the decrease in the molecular weight of the organic compounds; the decrease in the value of SUVA365 indicates that the volume of organic molecules decreases as the reaction proceeds, and analyzed in conjunction with Fig. 15g, it is found that the decrease in the molecular volume of organic compounds may be caused by the degradation of large molecules of humic acid-like substances and fulvic acid-like substances in the solution into other small organic molecules such as tyrosine and tryptophan; the decrease of SUVA436 proves that functional groups and chromophores are destroyed by various oxidizing free radicals. Hence, specific absorbance analysis confirms that the UV/PMS combined system efficiently breaks down the complex molecular structure of HA, achieving the goal of water purification.
4 Conclusion
(1) A comparative analysis revealed that among various UV/AOPs (PMS, PDS, SPC, S(IV)) processes, the UV/PMS synergistic system exhibited the best performance in treating HA. In experiments conducted with a HA concentration of 10 mg L−1 and a starting pH of 7, with the addition of 3 mmol L−1 PMS, after 240 minutes of reaction, the mineralization rate of HA reached 94.15%, with a kobs of 0.01034 and an EE/O of 0.0157 kW h m−3.(2) Experimental comparisons assessing the effects of different water sources on HA removal indicated that both natural water and tap water inhibit HA mineralization, with mineralization rates of 53.58% and 34.55%, respectively, compared to 89.61% for pure water. Anion effect experiments demonstrated that Cl−, HCO3−, and NO3− all exhibit varying degrees of inhibition on HA mineralization.
(3) Free radical quenching experiments showed that in the UV/PMS synergistic system for treating HA, SO4−˙ generated by PMS plays the primary role as the oxidizing agent, while ˙OH acts as an auxiliary agent for HA oxidation. Results from 3D-EEM, PARAFAC, specific fluorescence index analysis, and absorbance analysis collectively demonstrate that the UV/PMS synergistic system is capable of degrading HA in water.
Data availability
All relevant data used in this study can be obtained from the corresponding authors upon reasonable request.Author contributions
The concept and design of the study were collaborative efforts between all authors. Qingchao Shen was in charge of data collection, material preparation, and analysis. XiaosanSong, Jishuo Fan, Cheng Chen and Zili Guo wrote the first draft of the paper, and subsequent draughts were revised with insight from all authors. The final draft of this paper was reviewed and approved by all authors.Conflicts of interest
No conflict of interest was reported by the authors.Acknowledgements
This study was supported by the Research Program for Higher Education Institutions in Gansu Province (2020C-038).References
- X. Du, F. Qu and H. Liang, et al., Cake properties in ultrafiltration of TiO2 fine particles combined with HA: in situ meas-urement of cake thickness by fluid dynamic gauging and CFD calculation of imposed shear stress for cake controlling, Environ. Sci. Pollut. Res., 2016, 23, 8806–8818 CrossRef CAS PubMed.
- J. Ryu, J. Jung and K. Park, et al., Humic acid removal and microbial community function in membrane bioreactor, J. Hazard. Mater., 2021, 417, 126088 CrossRef CAS.
- E. Peña-Méndez, J. Havel and J. Patočka, Humic substances-compounds of still unknown structure: applications in agriculture, industry, environment, and biomedicine, J. Appl. Biomed., 2005, 3, 13–24 CrossRef.
- L. Cui, Y. Zhang and K. He, et al., Ti4O7 reactive electrochemical membrane for humic acid removal: Insights of electrosorption and electrooxidation, Sep. Purif. Technol., 2022, 293 Search PubMed.
- R. Vidic and M. Suidan, Role of dissolved oxygen on the adsorptive capacity of activated carbon for synthetic and natural organic matter, Environ. Sci. Technol., 1991, 25, 1612–1618 CrossRef CAS.
- H. Särkkä, M. Vepsäläinen and M. Sillanpää, Natural organic matter (NOM) removal by electrochemical methods-A review, J. Electroanal. Chem., 2015, 755, 100–108 CrossRef.
- T. Maqbool, Q. Ly and K. He, et al., Reactive electrochemical ceramic membrane for effective removal of high concentration humic acid: Insights of different performance and mechanisms, J. Membr. Sci., 2022, 651, 120460 CrossRef CAS.
- B. Huang, C. Qi and Z. Yang, et al., Pd/Fe3O4 nanocatalysts for highly effective and simultaneous removal of humic acids and Cr(VI) by electro-Fenton with H2O2 in situ electro-generated on the catalyst surface, J. Catal., 2017, 352, 337–350 CrossRef CAS.
- V. Oskoei, M. Dehghani and S. Nazmara, et al., Removal of humic acid from aqueous solution using UV/ZnO nano-photocatalysis and adsorption, J. Mol. Liq., 2015, 213, 374–380 CrossRef.
- E. Doustkhah, M. Esmat and N. Fukata, et al., MOF-derived nanocrystalline ZnO with controlled orientation and photocatalytic activity, Chemosphere, 2022, 303, 124932 Search PubMed.
- B. Hashemzadeh, H. Alamgholiloo and N. Pesyan, et al., Degradation of ciprofloxacin using hematite/MOF nanocomposite as a heterogeneous Fenton-like catalyst: A comparison of composite and core–shell structures, Chemosphere, 2021, 281, 130970 Search PubMed.
- S. Lee, Y. Roh and D. Koh, Oxidation and reduction of redox-sensitive elements in the presence of humic substances in subsurface environments: A review, Chemosphere, 2018, 220, 86–97 CrossRef.
- A. Lado Ribeiro, J. Rodríguez-Chueca and S. Giannakis, Urban and industrial wastewater disinfection and decontamination by advanced oxidation processes(AOPs): Current issues and future trends, Water, 2021, 13, 560 CrossRef.
- S. Barisci and R. Suri, Removal of polyfluorinated telomer alcohol by advanced oxidation processes(AOPs) in different water matrices and evaluation of degradation mechanisms, J. Water Proc. Eng., 2020, 39, 101745 CrossRef.
- W. Song, J. Li and Z. Wang, et al., A mini review of activated methods to persulfate-based advanced oxidation process, Water Sci. Technol., 2018, 79, 573–579 CrossRef.
- L. Chen, T. Cai and C. Cheng, et al, Degradation of acetamiprid in UV/H2O2 and UV/persulfate systems: A comparative study, Chem. Eng. J., 2018, 351, 1137–1146 CrossRef CAS.
- Y. Zhang, J. Zhang and Y. Xiao, Kinetic and mechanistic investigation of azathioprine degradation in water by UV, UV/H2O2 and UV/persulfate, Chem. Eng. J., 2016, 302, 526–534 Search PubMed.
- T. Song, G. Li and R. Hu, et al., Degradation of Antibiotics via UV-Activated Peroxodisulfate or Peroxymonosulfate: A Review, J. Catal., 2022, 12, 1025 CAS.
- H. Ou, J. Liu and J. Ye, et al., Degradation of tris(2-chloroethyl) phosphate by ultraviolet-persulfate: Kinetics, pathway and intermediate impact on proteome of Escherichia coli, Chem. Eng. J., 2017, 308, 386–395 CrossRef CAS.
- Z. Frontistis, Degradation of the nonsteroidal anti-inflammatory drug piroxicam from environmental matrices with UV-activated persulfate, J. Photochem. Photobiol., A, 2019, 378, 17–23 CrossRef CAS.
- S. Hsieh, W. Lai and A. Lin, Kinetics and mechanism of 4-methylbenzylidene camphor degradation by UV-activated persulfate oxidation, Environ. Sci. Pollut. Res., 2021, 28, 18021–18034 CrossRef CAS PubMed.
- Q. Wang, P. Rao and G. Li, et al., Degradation of imidacloprid by UV-activated persulfate and peroxymonosulfate processes: Kinetics, impact of key factors and degradation pathway, Ecotoxicol. Environ. Saf., 2020, 187, 109779 CrossRef CAS PubMed.
- M. Wang, Q. Wang and Y. Cai, et al., Efficient degradation and defluorination of perfluorobutyric acid under UV irradiation in the presence of persulfate, J. Cleaner Prod., 2021, 327, 129472 CrossRef CAS.
- S. Tang, J. Tang and D. Yuan, et al., Elimination of humic acid in water: comparison of UV/PDS and UV/PMS, RSC Adv., 2020, 10, 17627–17634 RSC.
- Y. Fang and H. Sakai, Use of an ultraviolet light-activated persulfate process to degrade humic substances: effects of wavelength and persulfate dose, Environ. Sci. Pollut. Res., 2022, 29, 9923–9931 CrossRef CAS PubMed.
- A. Shad, J. Chen and R. Qu, et al., Degradation of sulfadimethoxine in phosphate buffer solution by UV alone, UV/PMS and UV/H2O2: kinetics, degradation products, and reaction pathways, Chem. Eng. J., 2020, 398, 125357 CrossRef CAS.
- L. Devi, M. Srinivas and M. Arunakumari, Heterogeneous advanced photo-Fenton process using peroxymonosulfate and peroxydisulfate in presence of zero valent metallic iron: A comparative study with hydrogen peroxide photo-Fenton process, J. Water Proc. Eng., 2016, 13, 117–126 CrossRef.
- D. Yuan, J. Tang and Z. Nie, et al., Study on the removal of humic acid from water by ultraviolet activated sodium percarbonate, J. Yanshan Univ., 2021, 45, 220–226 Search PubMed.
- A. Alayande and S. Hong, Ultraviolet light-activated peroxymonosulfate (UV/PMS) system for humic acid mineralization: Effects of ionic matrix and feasible application in seawater reverse osmosis desalination, Environ. Sci. Pollut. Res., 2022, 307, 119513 CAS.
- Y. Deling, Z. Zhihui and Z. Eryu, et al., Humic Acid Removal in Water via UV Activated Sodium Perborate Process, J. Coat., 2022, 12, 885 CrossRef.
- Z. Wang, Y. Wan and P. Xie, et al., Ultraviolet/persulfate (UV/PS) pretreatment of typical natural organic matter (NOM): variation of characteristics and control of membrane fouling, Chemosphere, 2019, 214, 136–147 CrossRef CAS PubMed.
- Y. Deling, Z. Zhihui and Z. Eryu, et al., Humic Acid Removal in Water via UV Activated Sodium Perborate Process, J. Coat., 2022, 12, 885 CrossRef.
- M. Lominchar, A. Santos and E. Miguel, et al., Remediation of aged diesel contaminated soil by alkaline activated persulfate, Sci. Total Environ., 2018, 622–623, 41–48 CrossRef CAS PubMed.
- S. Tang, J. Tang and D. Yuan, et al., Elimination of humic acid in water: comparison of UV/PDS and UV/PMS., RSC Adv., 2020, 10, 17627–17634 RSC.
- Z. Wang, J. Chen and L. Zhang, et al., Activated Carbon Supported Co3O4 Catalysts to Activate Peroxymonosulfate for Orange G Degradation, Huan Jing Ke Xue, 2016, 37, 2591–2600 Search PubMed.
- F. Jiang, B. Qiu and D. Sun, Advanced degradation of refractory pollutants in incineration leachate by UV/Peroxymonosulfate, Chem. Eng. J., 2018, 349, 338–346 Search PubMed.
- C. Tan, N. Gao and S. Zhou, et al., Kinetic study of acetaminophen degradation by UV-based advanced oxidation processes, Chem. Eng. J., 2014, 253, 229–236 CrossRef CAS.
- D. Yuan, C. Zhang and S. Tang, et al., Ferric ion-ascorbic acid complex catalyzed calcium peroxide for organic wastewater treatment: Optimized by response surface method, Chin. Chem. Lett., 2021, 32, 3387–3392 CrossRef CAS.
- X. Fu, X. Gu and S. Lu, et al., Enhanced degradation of benzene in aqueous solution by sodium percarbonate activated with chelated-Fe(II), Chem. Eng. J., 2016, 285, 180–188 CrossRef CAS.
- L. Cai, L. Li and S. Yu, et al., Formation of odorous by-products during chlorination of major amino acids in East Taihu Lake: Impacts of UV, UV/PS and UV/H2O2 pre-treatments, Water Res., 2019, 162, 427–436 CrossRef CAS.
- S. Wang and J. Wang, Treatment of membrane filtration concentrate of coking wastewater using PMS/chloridion oxidation process, Chem. Eng. J., 2020, 379, 122361 CrossRef CAS.
- J. Wang and S. Wang, Effect of inorganic anions on the performance of advanced oxidation processes for degradation of organic contaminants, Chem. Eng. J., 2021, 411, 128392 CrossRef CAS.
- W. Lai, J. Lin and M. Li, Degradation of benzothiazole by the UV/persulfate process: Degradation kinetics, mechanism and toxicity, J. Photochem. Photobiol., A, 2023, 436, 114355 CrossRef CAS.
- W. Liu, H. Zhang and B. Cao, et al., Oxidative removal of bisphenol A using zero valent aluminum–acid system, Water Res., 2011, 45, 1872–1878 CrossRef CAS PubMed.
- D. Yuan, M. Sun and S. Tang, et al., All-solid-state BiVO4/ZnIn2S4 Z-scheme composite with efficient charge separations for improved visible light photocatalytic organics degradation, Chin. Chem. Lett., 2020, 31, 547–550 CrossRef CAS.
- X. Du, Y. Zhang and I. Hussain, et al., Insight into reactive oxygen species in persulfate activation with copper oxide: activated persulfate and trace radicals, Chem. Eng. J., 2017, 313, 1023–1032 CrossRef CAS.
- P. Fu, C. Liu and F. Wu, Three-dimensional fluorescence spectral characterization of dissolved organic matter, Spectrosc. Spectr. Anal., 2005, 25, 2024–2028 CAS.
- P. Coble, Characterization of marine and terrestrial DOM in seawater using excitation-emission matrix spectroscopy, Mar. Chem., 1996, 51, 325–346 CrossRef CAS.
- S. Li, M. Zhang and Y. Hao, et al., Spectral Characteristics of Dissolved Organic Matter (DOM) in the Surface Soil of Songhua Dam Reservoir Area in Kunming. Chinese J, Spectrosc. Spectral Anal., 2017, 37, 1183–1188 CAS.
- H. Li, Research on the Application of Nanofiltration Membrane in the Treatment of High Quality Drinking Water, D. Lanzhou Jiaotong University, 2020 Search PubMed.
- S. Walker, R. Amon and C. Stedmon, et al., The use of PARAFAC modeling to trace terrestrial dissolved organic matter and fingerprint water masses in coastal Canadian Arctic surface waters, J. Geophys. Res.: Biogeosci., 2009, 114, G4 Search PubMed.
- K. Ryan, L. Palacios and F. Encina, et al., Assessing inputs of aquaculture-derived nutrients to streams using dissolved organic matter fluorescence, Sci. Total Environ., 2022, 807, 150785 CrossRef CAS.
- M. Panettieri, J. Guigue and N. Prévost-Bouré, et al., Grassland-cropland rotation cycles in crop-livestock farming systems regulate priming effect potential in soils through modulation of microbial communities, composition of soil organic matter and abiotic soil properties, Agric., Ecosyst. Environ., 2020, 299, 106973 CrossRef CAS.
- V. Amaral, C. Romera-Castillo and M. García-Delgado, et al., Distribution of dissolved organic matter in estuaries of the southern Iberian Atlantic Basin: Sources, behavior and export to the coastal zone, Mar. Chem., 2020, 226, 103857 CrossRef CAS.
- M. Smith, J. Kominoski and E. Gaiser, et al., Stormwater runoff and tidal flooding transform dissolved organic matter composition and increase bioavailability in urban coastal ecosystems, J. Geophys. Res.: Biogeosci., 2021, 126, e2020JG006146 CrossRef CAS.
- M. Wauthy, M. Rautio and K. Christoffersen, et al., Increasing dominance of terrigenous organic matter in circumpolar freshwaters due to permafrost thaw, Limnol. Oceanogr. Lett., 2018, 3, 186–198 CrossRef CAS.
- A. Eder, G. Weigelhofer and M. Pucher, et al., Pathways and composition of dissolved organic carbon in a small agricultural catchment during base flow conditions, Ecohydrol. Hydrobiol., 2022, 22, 96–112 CrossRef.
- T. Lambert, S. Bouillon and F. Darchambeau, et al., Shift in the chemical composition of dissolved organic matter in the Congo River network, Biogeosciences, 2016, 13, 5405–5420 CrossRef CAS.
- M. Søndergaard, C. Stedmon and N. Borch, Fate of terrigenous dissolved organic matter (DOM) in estuaries: Aggregation and bioavailability, Ophelia, 2003, 57, 161–176 CrossRef.
- K. Murphy, C. Stedmon and T. Waite, et al., Distinguishing between terrestrial and autochthonous organic matter sources in marine environments using fluorescence spectroscopy, Mar. Chem., 2008, 108, 40–58 CrossRef CAS.
- Y. Wang, S. Lu and W. Huang, et al., Spectral characterization and source analysis of CDOM in the surface water of Lake Taihu before flooding, Chin. J. Environ. Sci., 2023, 44, 4906–4914 Search PubMed.
- T. Ohno, Fluorescence inner-filtering correction for determining the humification index of dissolved organic matter, Environ. Sci. Technol., 2002, 36, 742–746 CrossRef CAS PubMed.
- M. Kumke, C. Specht and T. Brinkmann, et al., Alkaline hydrolysis of humic substances-spectroscopic and chromatographic investigations, Chemosphere, 2001, 45, 1023–1031 CrossRef CAS PubMed.
- C. Uyguner and M. Bekbolet, Implementation of spectroscopic parameters for practical monitoring of natural organic matter, Desalination, 2005, 176, 47–55 CrossRef CAS.
- T. Wang, G. Qu and J. Ren, et al., Evaluation of the potentials of humic acid removal in water by gas phase surface discharge plasma, Water Res., 2016, 89, 28–38 CrossRef CAS.
- S. Valencia, J. Marín and G. Restrepo, et al., Application of excitation–emission fluorescence matrices and UV/Vis absorption to monitoring the photocatalytic degradation of commercial humic acid, Sci. Total Environ., 2013, 442, 207–214 CrossRef CAS PubMed.
- C. Uyguner and M. Bekbolet, Evaluation of humic acid photocatalytic degradation by UV-vis and fluorescence spectroscopy, Catal. Today, 2005, 101, 267–274 CrossRef CAS.
| This journal is © The Royal Society of Chemistry 2024 |

