
 Open Access Article
 This Open Access Article is licensed under a Creative Commons Attribution-Non Commercial 3.0 Unported Licence
Role of silver nanoparticles and silver nanoclusters for the detection and removal of Hg(II)
Mamta Sahu
,
Mainak Ganguly
 * and
Priyanka Sharma
* and
Priyanka Sharma
Department of Chemistry, Manipal University Jaipur, Dehmi Kalan, Jaipur 303007, Rajasthan, India. E-mail: humansense2009@gmail.com
First published on 15th July 2024
Abstract
Silver metal, being a 3d transition metal in group 11 in the periodic table, is widely used in material science for its distinguished plasmonic properties. Nanoparticles (NPs) and nanoclusters (NCs) are widely used in sensing applications having a surface plasmon band and emissive properties, respectively. Mercury is one of the detrimental toxins and threats to various ecosystems. The distinction between nanoparticles and nanoclusters, the utility and toxicity of heavy metal mercury, fluorometric and colorimetric approaches to the recognition of mercury ions with NPs and NCs, the mechanism of detection, spot detection, and natural water sample analyses were illustrated in detail in this review article. Moreover, the sensing platform and analyte (Hg2+) fate were described for substantiating the mechanism. It was observed that NCs are mostly utilized for fluorometric approaches, while NPs are mostly employed for colorimetric approaches. Fluorometric detection is mainly quenching-based. However, sensing with enhancement was found in a few reports. Adulteration of other metals with silver particles often modifies the sensing platform.
 Mamta Sahu | Mamta Sahu received her BSc degree from S.S. Jain Subodh Girls P.G. College (Jaipur, India) and MSc from R. K. Vigyan Mahavidyalya (Jaipur, India). She is currently pursuing her PhD degree under the supervision of Dr Mainak Ganguly in the Department of Chemistry at Manipal University Jaipur (India). Her area of research is environmental nanoscience and spectroscopy. |
 Mainak Ganguly | Dr Mainak Ganguly received his PhD from the Indian Institute of Technology, Kharagpur India in 2014. He also had 5 years of postdoctoral research experience at Furman University (USA) and McGill University (Canada). He is currently working as an assistant. Professor in the Department of Chemistry, Manipal University Jaipur (India). His research interests include Nanoparticles, clusters, biophysical chemistry, environmental remediations, etc. He has published more than 60 papers. |
 Priyanka Sharma | Priyanka Sharma received her BSc and MSc Degrees from Maharaja Brij University, India. She is currently pursuing her PhD degree under the supervision of Dr Mainak Ganguly in the Department of Chemistry, at Manipal University Jaipur (India). Her area of interest is material science and environmental remediation. |
1. Introduction
Water contamination has become a global problem, and combating it requires a constant evaluation of water resource policies. Water pollution causes fatalities and illnesses worldwide, and approximately 14![[thin space (1/6-em)]](https://www.rsc.org/images/entities/char_2009.gif) 000 people die daily as a consequence of it.1 Water pollution is an issue in both established and developing nations. Weather, climate, soil type, flora, geology, flow conditions, groundwater, and human actions all have an impact on water purity. The most serious threat to water purity comes from point sources of contamination, such as factories and towns. Water quality is influenced by mining, urbanization, and farmland. Other kinds of sources of contamination include sediments, nutrients, and poisonous contaminants.2 Pollutants come in a variety of forms and have unique characteristics, such as storage pollutants including non-recyclable substances, polymers made from chemicals, and heavy metals.3
000 people die daily as a consequence of it.1 Water pollution is an issue in both established and developing nations. Weather, climate, soil type, flora, geology, flow conditions, groundwater, and human actions all have an impact on water purity. The most serious threat to water purity comes from point sources of contamination, such as factories and towns. Water quality is influenced by mining, urbanization, and farmland. Other kinds of sources of contamination include sediments, nutrients, and poisonous contaminants.2 Pollutants come in a variety of forms and have unique characteristics, such as storage pollutants including non-recyclable substances, polymers made from chemicals, and heavy metals.3
The following are some heavy metals with concentrations higher than 5 g cm−3 and are more prevalent daily. Some of the element names are Ti, V, Cr, Mn, Fe, Co, Ni, Cu, Zn, As, Mo, Ag, Cd, Sn, Pt, Au, Hg, and Pb.4 But mercury (Hg) is the most toxic metal, and diagnosing low-concentration of Hg is very challenging. Hg causes harmful effects on not only humans but also plants and animals. It is found that rivers are mostly contaminated with Hg. Among several sources of Hg, gold mining is the primary source of mercury pollution in worldwide coastal waters. Fossil fuels are also an important source. The convention of Minamata discussed mercury emissions into the atmosphere and the creation of methods to utilize less mercury.5,6
Silver nanoparticles (AgNPs) and clusters (AgNCs) are well studied because of surface plasmons and intra/interbond transition.7,8 AgNPs are thus widely used for sensing applications based on colorimetry and fluorimetry. Sabela et al.9 reviewed colorimetric detection based on AgNPs. Lan et al.10 sensed ionic copper based on fluorescent AgNCs.
In our review article, we summarized the sensing of mercury calorimetrically and fluorometrically using AgNPs and AgNCs. We also illustrated the need for detection, the fate of silver particles and analytes, the mechanism of sensing, real sample analysis, spot detection for prototype applications, and the effect of adulteration.
2. Use of Hg2+
Hg is an element, that is liquid at the atmosphere's temperature. In different forms, Hg is used widely for biological, industrial, and domestic purposes.11 In this review article, we focused on ionic mercury salts.2.1 Cosmetics
Skin-lightening goods are available in a variety of forms such as lotions and soaps and are used without a doctor's guidance.12 In cosmetic goods, Hg and Hg salts as HgCl2 and HgO are utilized widely as skin-whitening substances.13 It was observed that the face treatments had a significantly greater Hg content than the body preparations,14 because Hg salts prevent melanin synthesis, producing a lighter complexion.15 Tyrosinase is necessary for producing melanin, a key component responsible for human skin color. Chen et al.16 discovered that HgCl2 may directly block the tyrosinase. The sample results, obtained in the research literature, were 25.7 mg kg−1 mercury concentration in low-cost whitening cream products. Vermillion is a red color powder, made from mercury sulfide.172.2 In reaction
Metals have been applied frequently as catalysts for organic processes by chemists. Hg had been one of the earliest catalysts.18 Hg2+ acts as a catalyst in many organic reactions such as the hydroamination of alkynes19 and the amination of allyl alcohols.20,21 The synthesis of complex cyclic structures is very difficult. A large number of cyclizations are produced via transition-metal salts. Complex heterocyclic and carbocyclic compounds, which are hard to manufacture with other transition metal salts, have been successfully synthesized via cyclizations involving Hg(II) salts22 Methane is converted into methanol not just in the presence of HgCl2.23 But mercuric sulfate is also used as a catalyst.24HgCl2 can be used to stabilize chemical and analytical samples. Foreman et al.25 demonstrated that continuous liquid–liquid extraction or closed-loop stripping produced organic components, recognized via analytical interferences of HgCl2 preservatives in natural water.
2.3 Disinfecting agent
Surface sterilization is a key step in the creation of healthy and sustainable tissue culture explants.26 Different amounts of HgCl2 are employed for various lengths of time during plant tissue culture. Optimizing quantities is necessary to minimize contamination. Clinacanthus nutans is a medicinal herb used in various disease treatments.27 Clinacanthus nutans is sterilized using a variety of agents. However, 0.2% HgCl2 is the most efficient sterilization solution for sanitizing nodal explants of Clinacanthus nutans, used for in vitro growth.28 Aspidosperma polyneuron is a high-valued wood tree, that gives nearby people a stable source of income. For contaminant control, 10 min of HgCl2 (0.125%) disinfection was sufficient.28,29 To decrease microbial contamination, HgCl2 is frequently used for surface sterilization in sugarcane tissue culture.30HgCl2 is often typically employed in laboratories to destroy germs on explants due to its high sterilizing efficacy. Paul Das et al.31 performed a comprehensive study on the role of HgCl2 as a disinfecting agent in the mixed culture.31 HgCl2 is still used successfully as a disinfection solution on several forest and firewood species, that have major contamination concerns. Phenyl-mercury-nitrate is a disinfectant and antiseptic agent. It is non-toxic to animal tissue and may be applied to the skin and relieve wound healing.29
2.4 Sensing platform
Hg is a wearable, wireless sensor platform for individuals with neuromotor illnesses including epilepsy, Parkinson's disease, and stroke to analyze their movement.32Hg2+ is also used in various sensing applications in the laboratory. For example, Askari et al.33 synthesized graphene carbon dots with 1.8 nm size with high emission intensity, which was quenched selectively and sensitively with the help of Hg2+. Quenched fluorescence was restored selectively with thiocyanate (λex 360 and λem 461 nm) to sense thiocyanate.
2.5 Energy source
India's coal has extremely high mercury levels. Indian coal has higher amounts of Hg than that from other nations. Hg, a common persistent worldwide toxin, is emitted from coal burning the most frequently in India. 50% of the 5500 tonnes of mercury, emitted into the environment annually come from coal-fired power stations. Mercury exists in three different forms in coal-burning power plant systems: pure Hg, Hg2+, and particulate Hg. Volatile Hg is present in large amounts in the geothermal steam, used to generate electricity. In cooling tower exhausts, a large portion of this Hg is released into the environment as pure Hg vapor. On a per megawatt (electric) basis, Hg emissions from geothermal power plants are equivalent to those from coal-fired power plants. According to estimations based on measurements from a few chosen power plants, Indian coal ash has an average mercury content of 0.53 mg kg−1. Coal fly ash tends to have a greater concentration of Hg upon burning.34,352.6 Gold mining
Small-scale gold extraction operations employ Hg in >50 poor nations. The discharges, that go along with it, have an impact on the planet and human health. Instead of a true alloying process, the wetting of Au by Hg is a phenomenon of somewhat deep sorption, involving some interpenetration of the two elements. Because the surface tension of Hg is lower than that of Au and greater than that of water, it sticks to the surface of Au particles. Hg also acts as a thick medium to sink Au, causing the lighter gangue material to float on the top. Only 0.06% of Au is soluble in Hg at 20 °C. Numerous amalgamation processes are used in artisanal mining operations because amalgamation is simple to use and understand (Fig. 1).36,37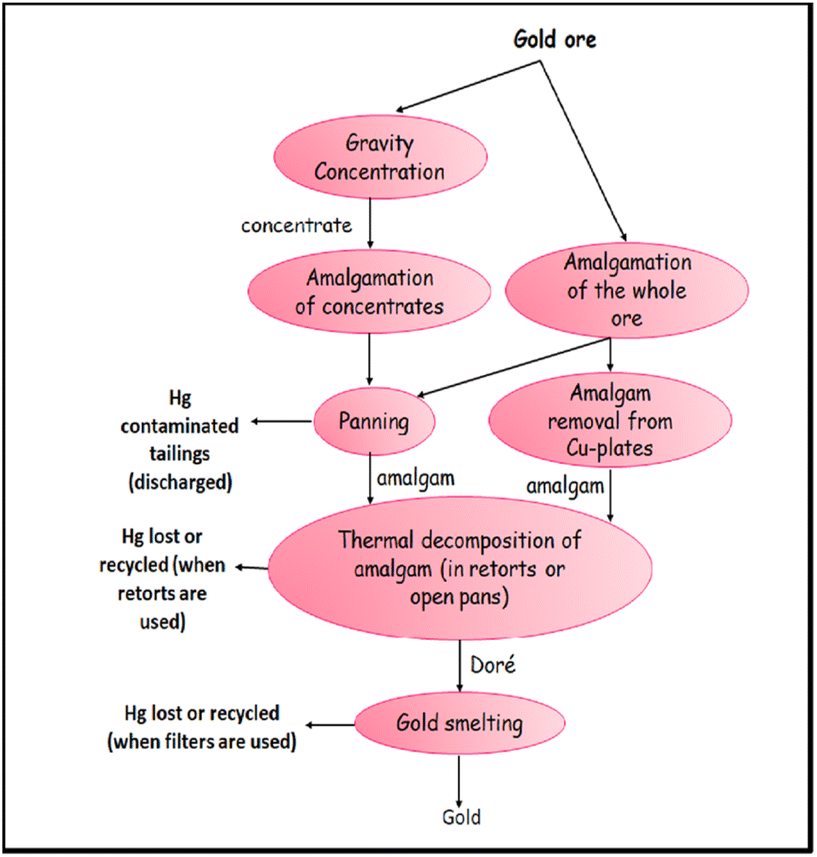 | ||
| Fig. 1 Techniques for extracting gold using Hg in artisanal mining processes. | ||
When mercury is introduced to the grinding circuit, the greatest losses of Hg per unit of gold produced take place. Amalgamation employing miller mills in China results in losses of 14 to 20 parts of mercury for every part of generated gold (Fig. 2).39
 | ||
| Fig. 2 Miners in Sulawesi, Indonesia, add one kilogram of mercury to each ball mill when kids play nearby the operational area. Reproduced with permission from ref. 38, copyright 2024, J. Clean. Prod. | ||
2.7 Others
Mercury is widely used in various preparations such as antibacterial agents, skin antiseptics diuretics, laxatives, and other ointments.18Mercury is used in various forms and compositions for dental amalgam.40 Mercury also has practical use in the study of porous solids. Determining the pore size distribution by mercury porosimeter is a well-established practice in the chemical industry.41
Inorganic mercury ions can be found in nature in a variety of colors, spanning from colorless oxides to browns and blacks with sulfide compounds. They are also widely employed in manufacturing. They have been used, as skin-brightening lotions, tooth eruption, and as antioxidants in some medications, most notably eyedrops. In the shape of the ‘blue pill’, HgCl (calomel) was extensively used as a purgative.42
3. Nanocluster vs. nanoparticles
The distinction between metal nanoclusters (NCs) and nanoparticles (NPs). Because of their higher surface area (1–100 nm), nanoparticles have special characteristics. Surface plasmon resonance (SPR), which happens when light interacts with the electrons on the nanoparticle's surface, is one such characteristic. In contrast, metal nanoclusters are just tens to hundreds of atoms in size and are significantly smaller (around 2 nm). Due to their small size, nanoclusters have characteristics more akin to molecules, such as luminescence and catalysis, but lack the surface area required for surface plasmon resonance (SPR). In essence, nanoclusters act as a link between the actions of bigger nanoparticles and individual atoms.4. AgNPs vs. AgNCs
The range of uses that silver nanoparticles (AgNPs) and nanoclusters (AgNCs) can have. AgNPs have several biological uses, including antibacterial and anti-inflammatory effects. They exhibit potential in catalysis and sensing as well. AgNPs have the additional ability to improve Raman signals for low-concentration molecule detection. On the other hand, AgNCs behave like molecules since they are smaller than 1 nm. Unlike bulk silver or AgNPs, they radiate strongly and absorb light across a wide range. Because of their compact size and high brightness, this special characteristic enables the development of accurate, adjustable fluorescent labels for bioimaging and sensing applications.5. Silver–mercury interaction
It is commonly known that, at the bulk scale, zero-valent mercury is produced by the stoichiometric 1:2 interaction between aqueous mercury(II) and silver metal(0) [eqn (1)].| Hg2+(aq) + 2Ag(s) → Hg(s) + 2Ag+(aq) | (1) |
The potential applications of the hyperstoichiometric interaction between mercury and silver at the nanoscale are significant since they span a variety of sectors. Hg2+ from water is reduced onto the AgNPs as a result of this interaction, which happens when the diameter of the AgNPs is lowered below 32 nm. For 11 nm AgNPs, the mercury-to-silver ratio reaches 1.125:1. This phenomenon has great potential for novel perspectives on nanoscale chemistry and substantial progress in wastewater treatment, improved chemical catalysis, and nanoscale system toxicity. It has been established that the hyperstoichiometry effect is related to the size of the AgNPs and occurs for both mercury nitrate and mercury acetate. Perhaps because nanosized silver particles have a higher surface energy than their bulk scale counterparts, the smaller AgNPs exhibit improved release and catalytic recycling of the silver ions released into the solution.43
Several characterization techniques, including UV-vis spectroscopy, dynamic light scattering (DLS), zeta potential measurement, elemental mapping, and X-ray photoelectron spectroscopy (XPS), are used in the mechanism of direct SERS detection of Hg2+ without tagging. These characterizations show that the formation of a non-uniform mercury/Ag shell wrapping around AgNPs is the result of the rapid interaction between Hg2+ and AgNPs.44
AgNPs' surface plasmon resonance (SPR) characteristic is impacted by this interaction, which lowers the substrates' electromagnetic enhancement. AgNPs' zeta potential also decreases as a result of the contract, which has an impact on Raman reporter molecules' ability to adhere to AgNP surfaces. The XPS test findings demonstrate that the citrate has decreased Hg0 and Hg2+ bound to it. Strong support for the mechanism of direct SERS detection of Hg2+ without tagging is provided by these experimental results.44
Sun et al.45 primarily offer a methodical theoretical investigation of Hg binding on the small neutral and charged Agn cluster (n = 1–6) using the DFT approach, as both supported and free Ag clusters are frequently employed as regenerable sorbents in real-world Hg removal research.
The density functional theory of mercury adsorption on a sequence of charged and neutral Agn (n = 1–6) clusters. The findings show that the charged state and cluster size have a major impact on the adsorption of mercury. The BEs rise and subsequently fall on the neutral clusters. Except for Ag, the binding energies for negatively charged Agn clusters exhibit an odd-even pattern, whereas the BEs for cationic clusters drop as cluster size increases. According to NBO analysis, in the case of anionic and neutral compounds, additionally, electrons go from the p orbital of mercury to the s orbital of silver. The prediction of Hg binding orientation for neutral and charged anions satisfactorily validates the rules of LUMO (HOMO for anions) established by Sun et al.(Fig. 3).45
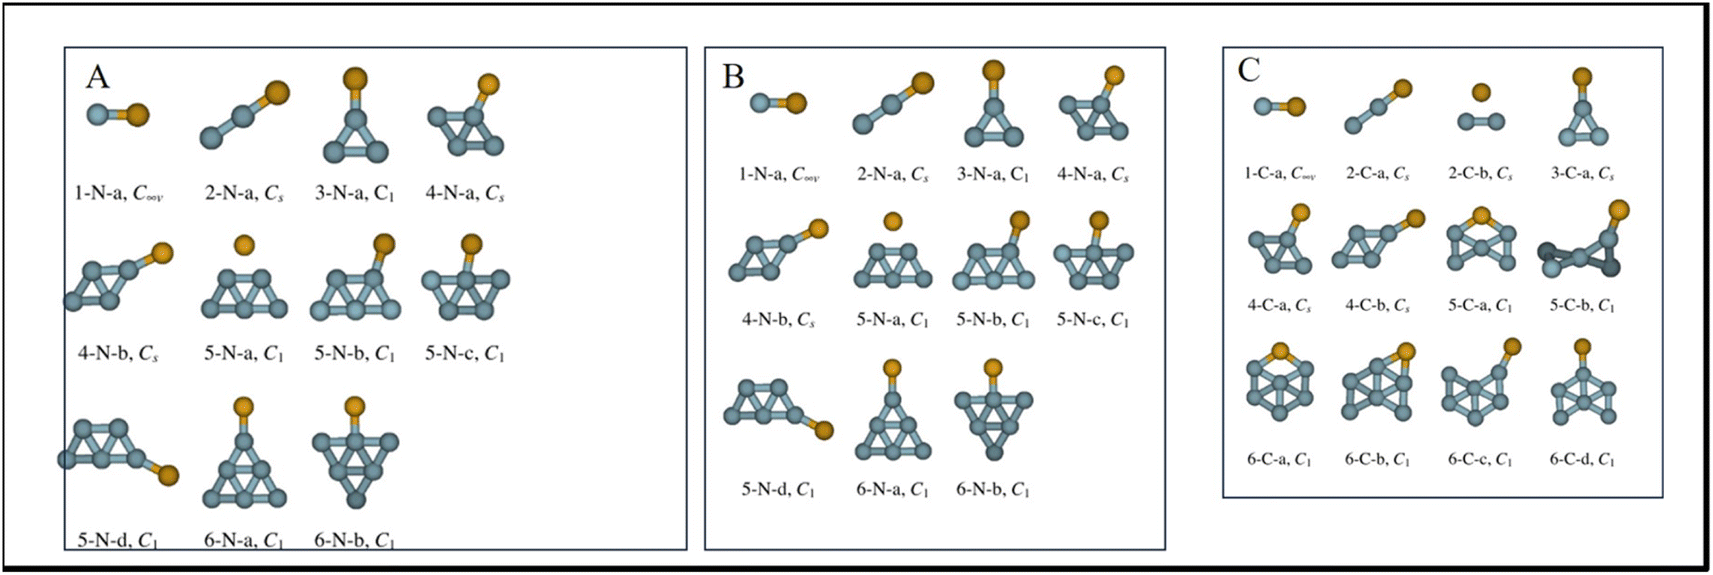 | ||
| Fig. 3 (A) Optimized structures of neutral AgnHg complexes, n ≤ 6. The symmetry point group is indicated. (B) Optimized structures of anionic AgnHg complexes, n ≤ 6. The symmetry point group is indicated. (C) Optimized structures of cationic AgnHg complexes, n ≤ 6. The symmetry point group is indicated.45 Reproduced with permission from ref. 45, copyright 2024, Chem. Phys. Lett. | ||
The surface plasmon mode shifts blue as a result of Hg adsorption on AgNPs. For smaller particles, the blue shift's magnitude is more noticeable.46
6. Removal of mercury and adsorption via silver particles
A novel method for preconcentrating water by filtration and employing paper treated with NPs to detect Hg2+ in an ultrasensitive manner. By reducing Hg2+ to Hg0 without using chemical reagents, this approach amalgamates Hg0 utilizing cellulose substrates that include in situ-synthesized AgNPs. The enhanced filters are then placed inside a direct mercury analyzer so that atomic absorption can determine the mercury content. The various NP synthesis techniques, filtering methods, filter paper properties, and other pertinent factors affect Hg solid-phase extraction.47By using filter paper that has been treated with AgNPs, the technique enables the direct analysis of mercury without the need for further digestion or desorption processes. This makes it possible to determine mercury at ultra-trace levels and streamlines the preconcentration procedure. Furthermore, for a 100 mL sample volume, the approach achieves a preconcentration factor of about 3500, with a limit of quantification (LOQ) of 0.8 ng L−1 and a limit of detection (LOD) of 0.2 ng L−1. Relative standard deviation (RSD) represents the method's accuracy, which is 5% for repeatability and 9% for reproducibility. Moreover, the technique shows excellent selectivity for Hg2+ sorption, with recoveries for synthetic waters and verified reference materials ranging from 92% to 105%.47 An inventive method for the synthesis of AgNPs using lignin as a reducing and stabilizing agent under solar light was presented by Zhang et al. The AgNPs were tangled in lignin after being placed onto the surface of lignin nanoparticles (LNPs) with an average size of around 14 nm and a consistent shape.48
When it came to Hg2+ detection, the AgNP-LNP solution exhibited excellent sensitivity and selectivity. The ultra-sensitive colorimetric reaction to Hg2+, which had a detection limit of 1.8 nM in tap water samples—much lower than the drinking water threshold of 10 nM for Hg2+—demonstrated the sensitivity of the method. Additionally sensitive and selective for on-site Hg2+ detection in actual water samples was the AgNP-LNP solution. The absorbance results demonstrated the selectivity of the AgNP-LNP suspension, which had a stronger affinity for Hg2+ than other metal ions. As a result, it was a very useful sensor for detecting Hg2+ in real-world samples.48
The adsorption capacity of synthetic zeolite (Na-X and Na-P1) generated from coal fly ash was insignificant for Hg, but it could be significantly increased for Hg0 after being impregnated with silver.49,50 Wang et al. reported ionic mercury adsorption and removal using organic framework passivated AgNPs from wastewater, acidic in nature (Table 1).51
| NPs | Size | Hg removal capacity | Type of adsorption | Time | Rate constant |
|---|---|---|---|---|---|
| Covalent organic framework-AgNPs51 | 200 nm | 113 mg g−1 | Langmuir | 30 min | Pseudo-second-order |
7. Fluorometric detection concept
Electrical stimulation, which occurs during light absorption by the fluorophore, causes light to be emitted. When a molecule remains in the excitation state after light absorption, it produces fluorescence emission, which has a longer wavelength and lower energy.52 Fluoroionophore is one of the light sensor's luminescence and ionophore components.53 Recognition and signaling systems are the primary components under evaluation. The former is in charge of discrimination and binding effectiveness, while the latter transforms information into an optical signal.53 When the fluorescent sensor interacts with cations, variations in the photophysical properties of the fluorophore cause a variety of processes, including charge transfer, energy transfer, excimer formation, and so on.54 The combination of silver particles and fluorescent units has increased sensor portability, stability, sensing range, and general performance (Fig. 4 and 5).55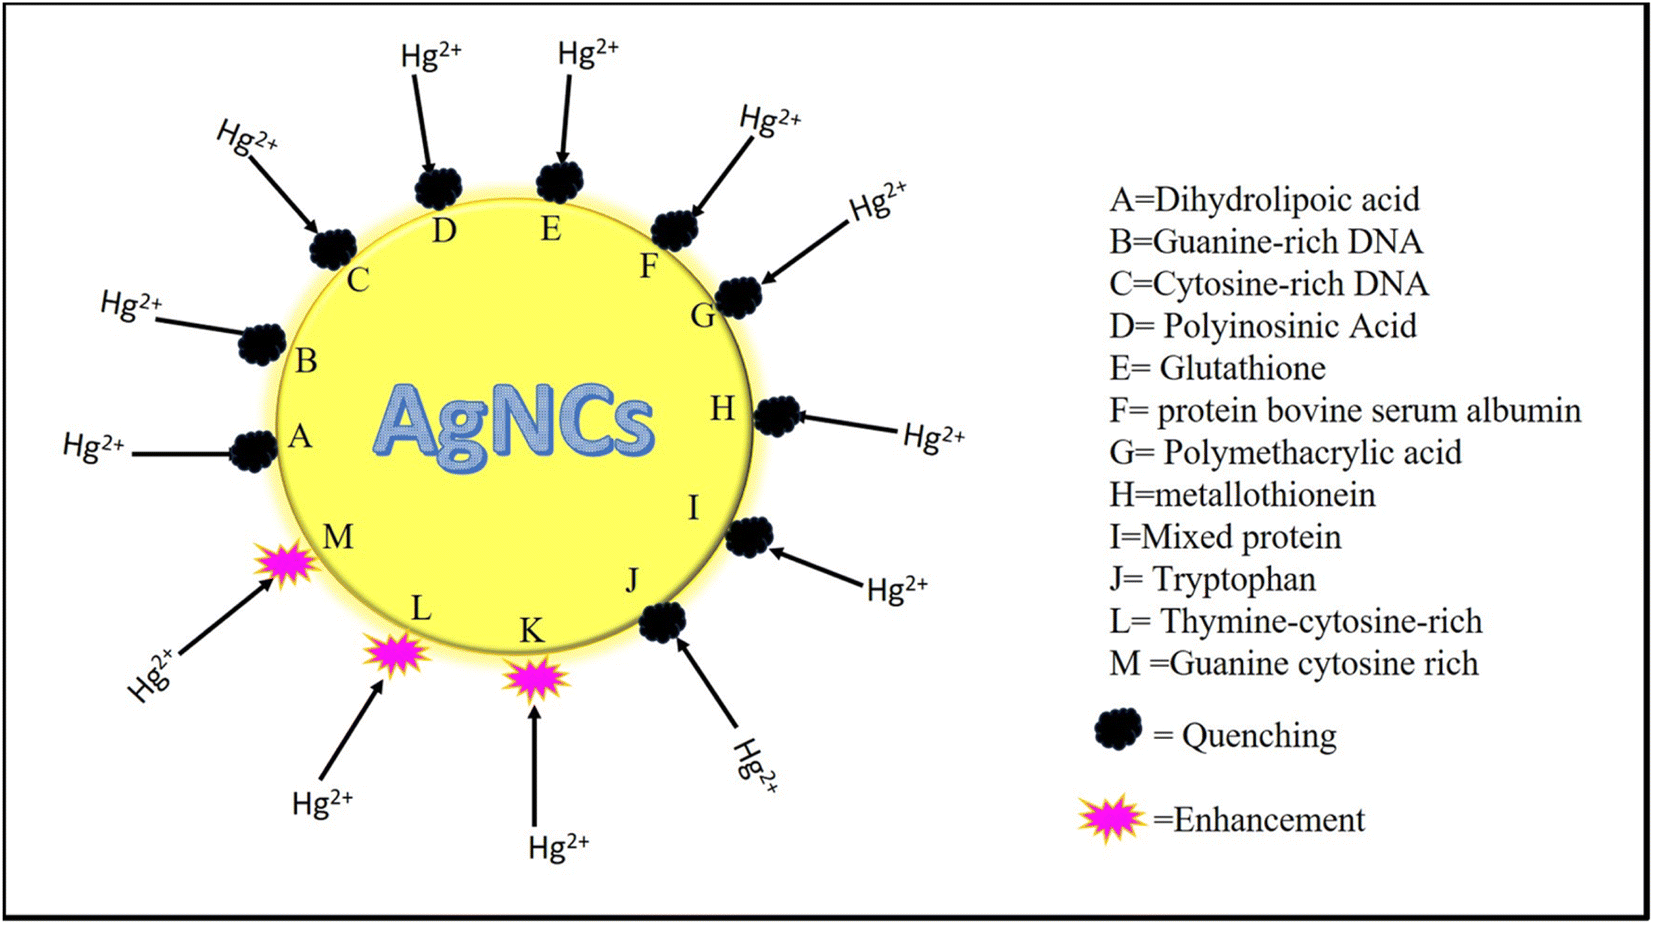 | ||
| Fig. 4 Fluorescence-based sensing of mercury with AgNCs, with different capping agents. | ||
 | ||
| Fig. 5 Mechanism of fluorometric detection of Hg2+ with AgNCs. | ||
7.1 Fluorometric detection of Hg2+ with the silver nanocluster
Deng et al.57 formed a thymine–cytosine-rich DNA duplex for the formation of AgNCs. The interaction of DNA with Mercury gives stability to the DNA duplex and the configuration of a cytosine-rich loop (The λex and λem were at 558 and 625 nm, respectively). The thymine–cytosine-rich fluorescent probes work satisfactorily for mercury detection. Hg2+ can be detected by the lower limit concentration of 10 nM. The strong fluorescence shows from pH 5 to 7.58
A quick and easy method for detecting metal ions is proposed by oligonucleotide-based radiant technologies, allowing for onsite detection and measurement of the metal-ion concentration.59 Oligonucleotide probes, having -C6G5C6, ligated to AgNCs act as a capping agent. Guanines were introduced into cytosine fragments to enhance the fluorescence of AgNCs. DNA-capped AgNCs showed enhancement with Hg2+, while Cd2+ showed quenching. The advantage of this method has a lower LOD.60
Amino acid and its components have a large active surface. So, amino acids are a promising platform for heavy metal sensing61 Tryptophan is a type of amino acid and it is fluorescent. Bian et al.62 prepared tryptophan-capped AgNCs. Amino acid functionality and nitration of tryptophan give stability to the AgNCs. AgNCs were highly fluorescent (λex 330 nm and λem 465 nm) and enhancement happened with Hg2+selectively (LOD 0.658 pM and linear detection range 10 mM to 1 pM).
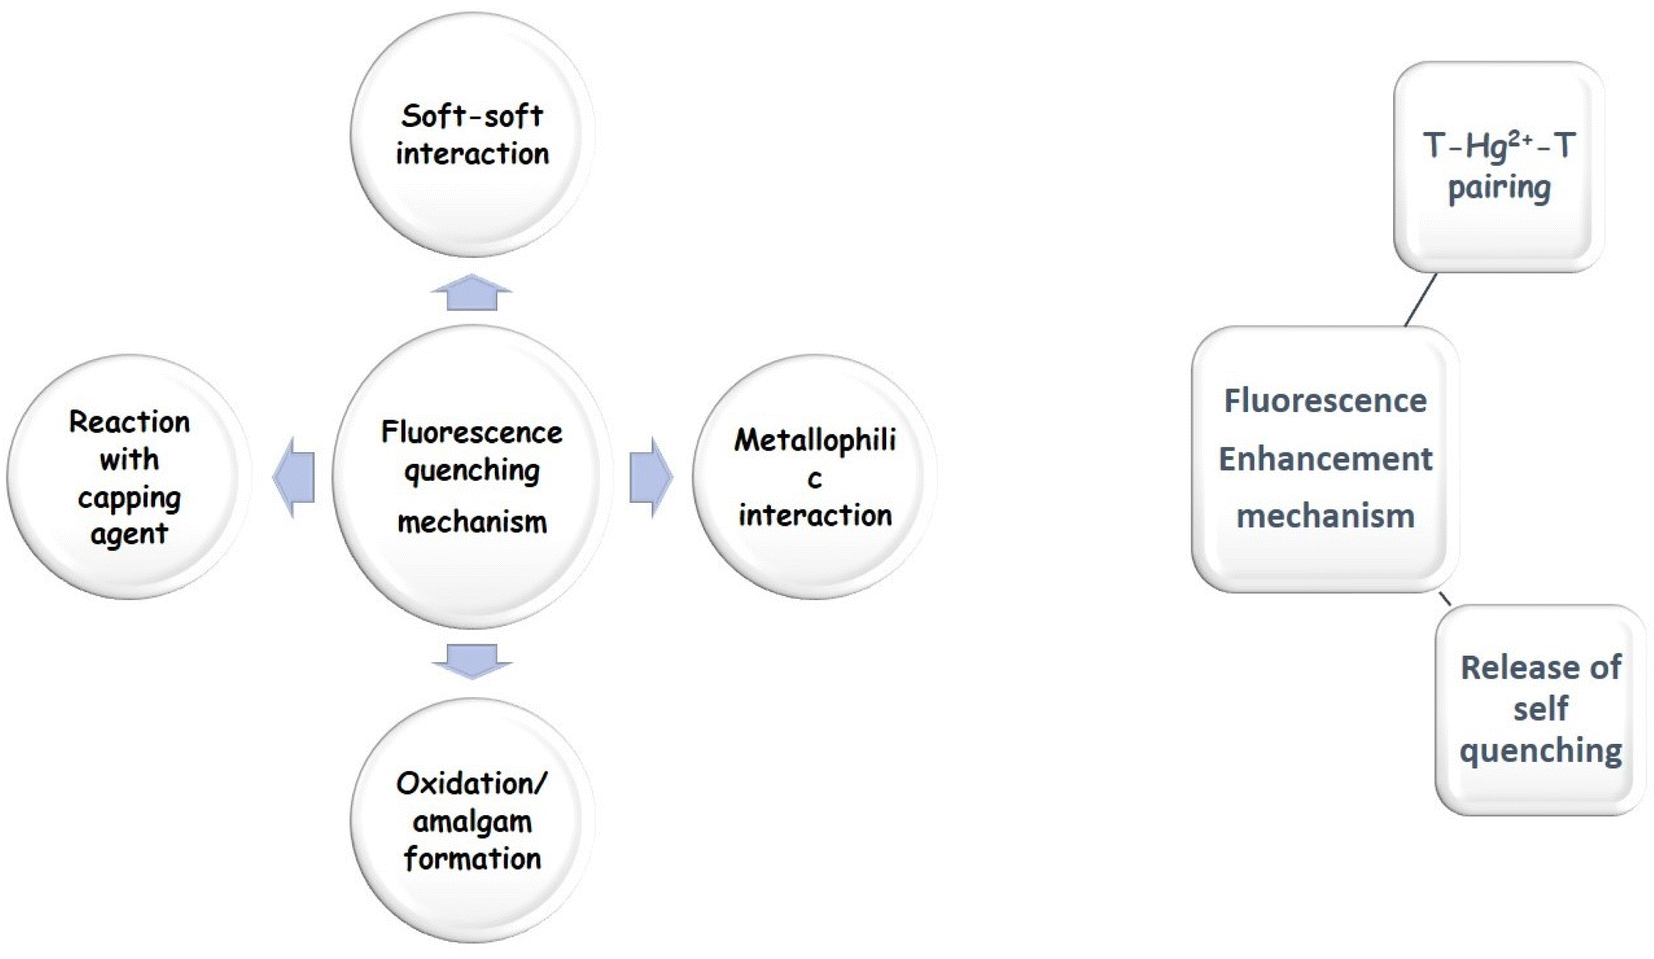
7.1.1.1 Mechanism based on enhancement. T–Hg2+–T pairing: Many novel methods for DNA-based Hg2+ sensors are now being developed as a result of the complementary interaction between thymine bases and mercury ions without the aforementioned restrictions. Thymine–thymine (T–T) mismatched DNA duplexes would particularly bind Hg2+ in an aqueous solution to produce stable T–Hg2+–T pairing DNA duplexes. T–Hg2+–T has a binding constant, almost 4.14 × 10⁶ times higher than an adenine–thymine base pair found in nature. Furthermore, the T–T base pair can only be stabilized by Hg2+ in this kind of T–Hg2+–T coupling, ensuring remarkable selectivity.63–66
Release of self-quenching: A process in which the intensity of fluorescence emission is decreased is known as fluorescence quenching. Fluorescence quenching may be caused by several events, complex formation, electron transport, excited state reaction, and energy transfer.67,68
A distinctive type of fluorescence quenching is self-quenching. In right-angle geometry, strong fluorescence self-quenching of highly concentrated fluorophore solutions is seen.69–71 The re-absorption effect is the main cause of fluorescence self-quenching. Moreover, the resonance energy transfer of the Förster type (home-transfer) is also an aspect. Self-quenching occurs when toluene has a high ambient tetraphenyl-porphyrin concentration (300 K).71 Water volume variations in lipid vesicles may be measured using self-quenching characteristics. At relatively high (mM) concentrations, self-quenching happens.72 Tryptophan's nitrosylation was important for the detection of Hg2+ ions. Trp-NO2-AgNCs had the ability to self-quench. Such quenching was released after adding Hg2+ to the solution of AgNCs. A high static electrostatic repulsion was formed between AgNCs due to the binding of Hg2+, increasing the distance of AgNCs.62
| Capping agent | λex and λem (nm) | LOD | Linear detection range | References |
|---|---|---|---|---|
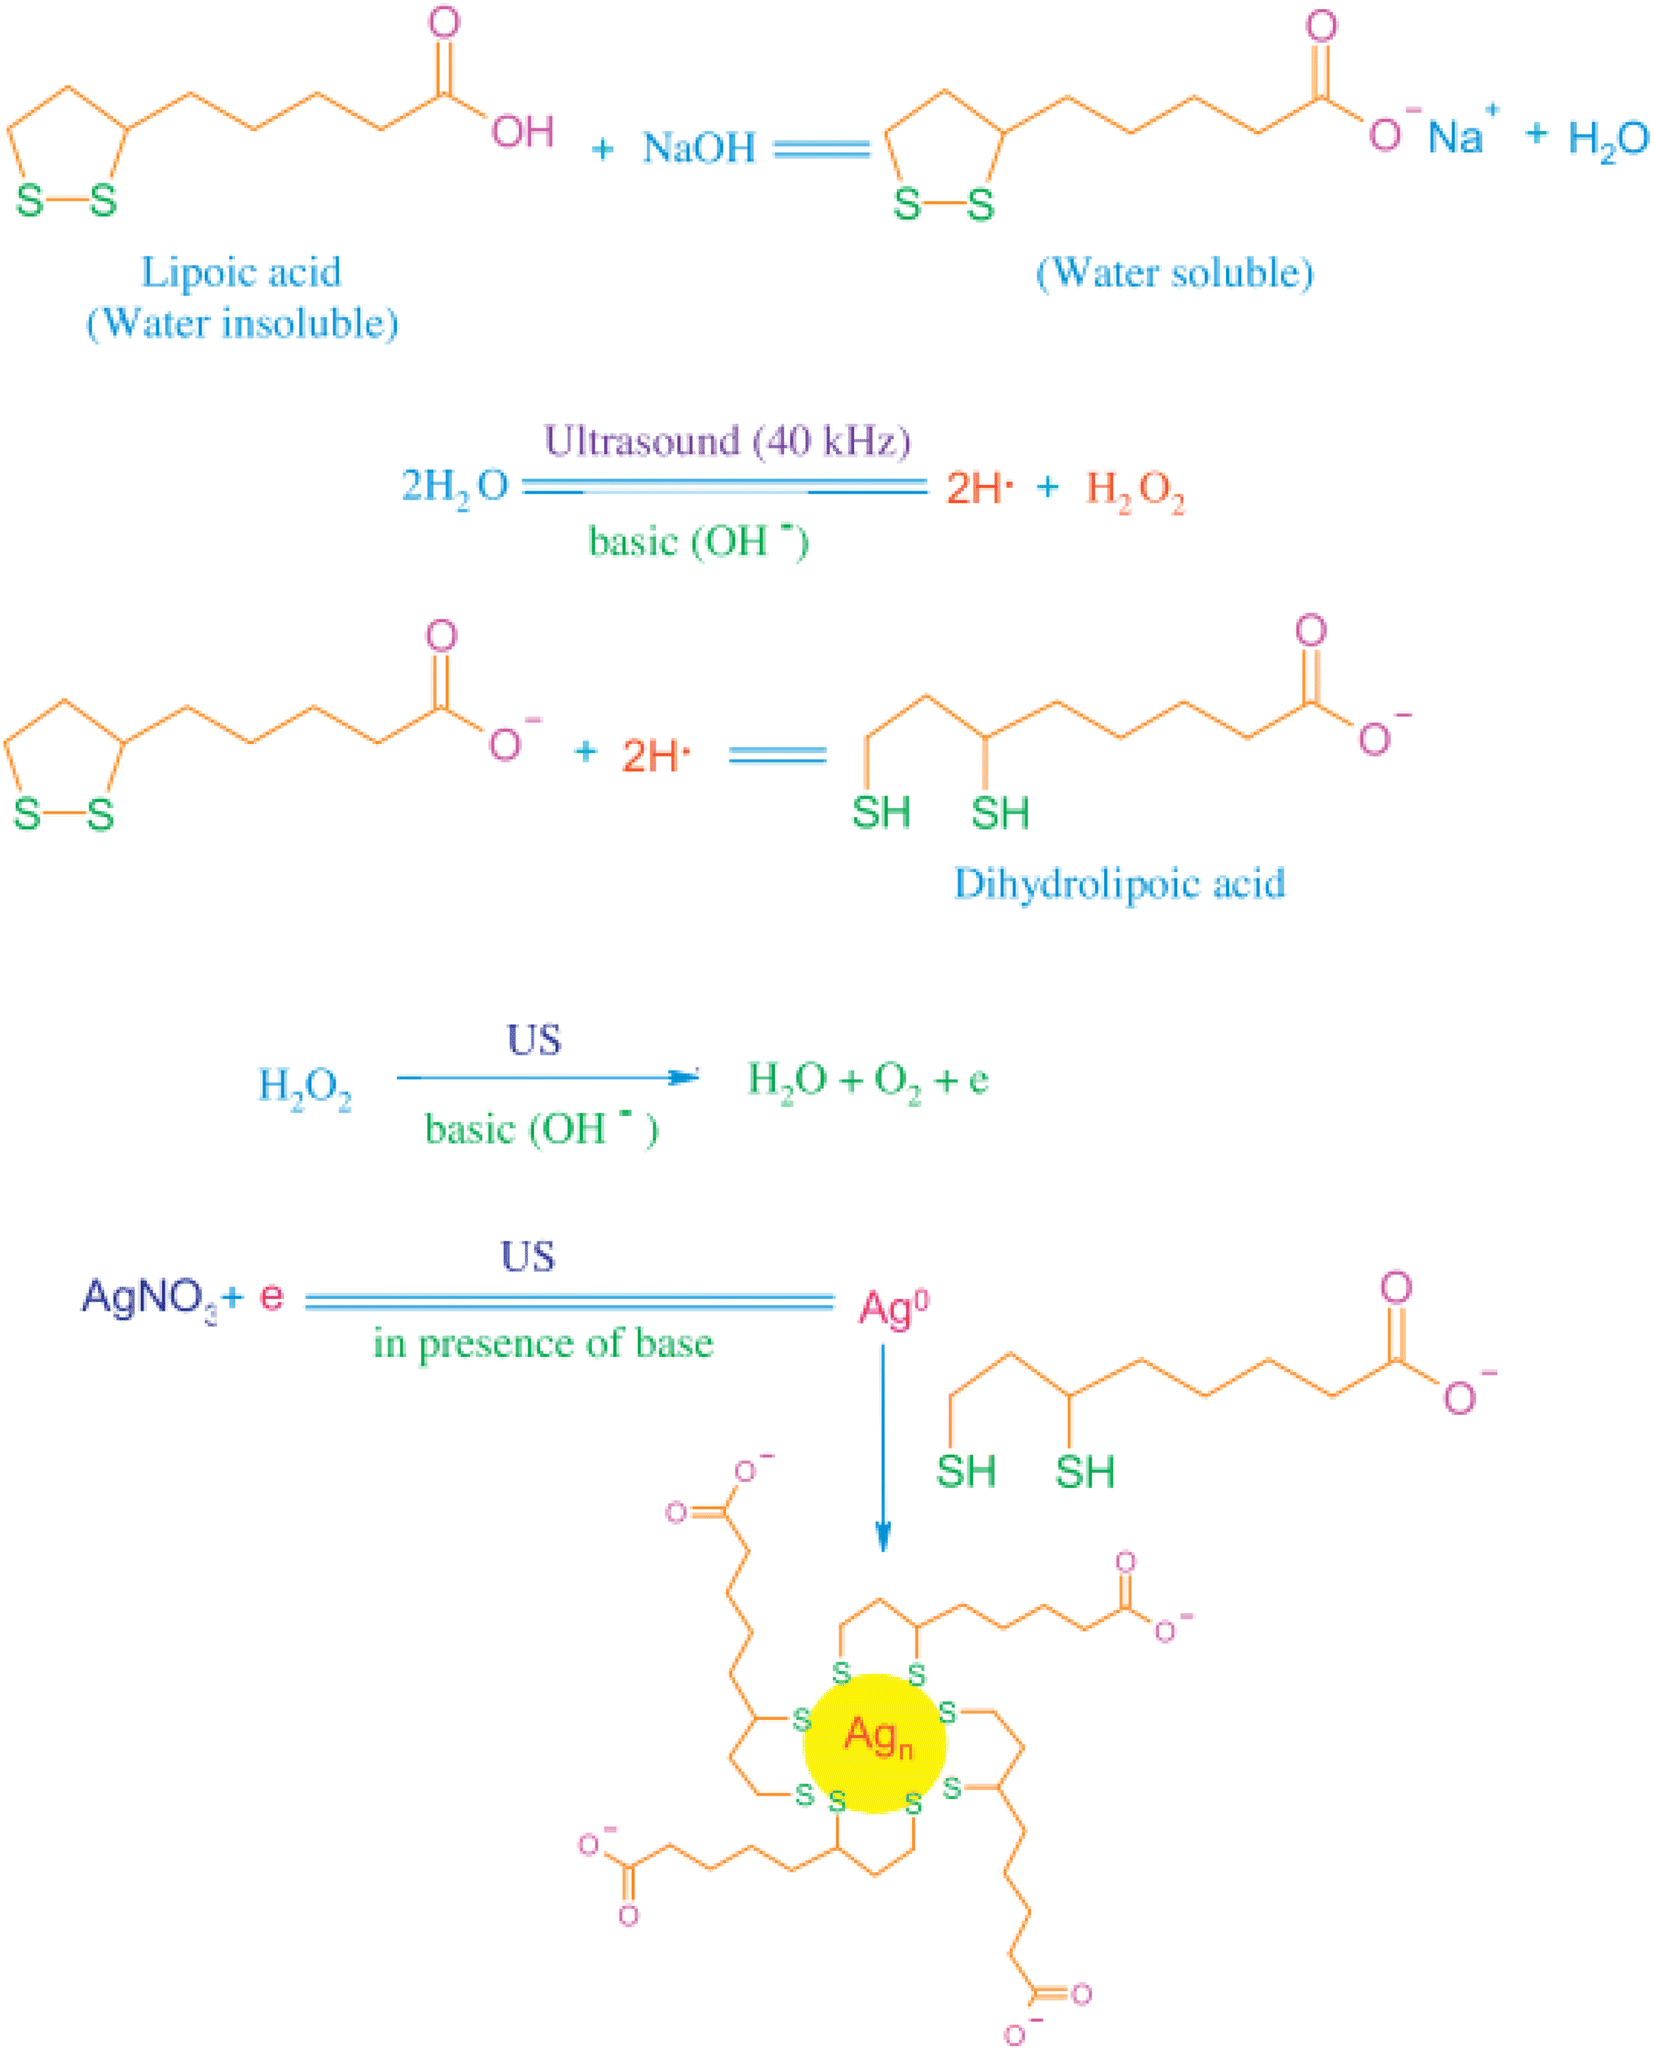
| Dihydrolipoic acid | λex 330 nm/λem 448 nm | 0.1 nM | — | 74 |
| Guanine-rich DNA | λex 480 nm/λem 560 nm | 2.1 nM | 6.0–160 nM | 76 |
| Cytosine-rich DNA | λex 724 nm/λem 768 nm | 1.90 × 10⁻⁹ | 1.90 × 10⁻⁹ to 1.90 × 10⁻⁸ M | 77 |
| Polyinosinic | λex 545 nm/λem 585 nm | 3.2 nM | 0.05–10 μM | 85 |
| Polycytidylic acids | λex 500 nm/λem 575 nm | 9.0 nM | 0.5–10 μM | 85 |
| Glutathione | λex 527 nm/λem 700 nm | 0.1 nM to 10 mM | 126–245 nM | 79 |
| Protein bovine serum albumin | λex 400 nm/λem 637 nm | 10 nM | 10 nM–5 μM | 81 |
| Polymethacrylic acids | λex 510 nm/λem 610 nm | 10 nM | 10 nM–20 μM | 82 |
| Metallothionein | λex 385 nm/λem 475 nm | — | 0.2–5.0 μM | 83 |
| Mixed protein | λex 470 nm/λem 620 nm | 0.7 nM | 0–1 μM | 84 |
 | ||
| Fig. 6 Synthesis protocol for the preparation of water-soluble fluorescent AgNCs. Reproduced with permission from ref. 74, copyright 2024, J. Environ. Chem. Eng. | ||
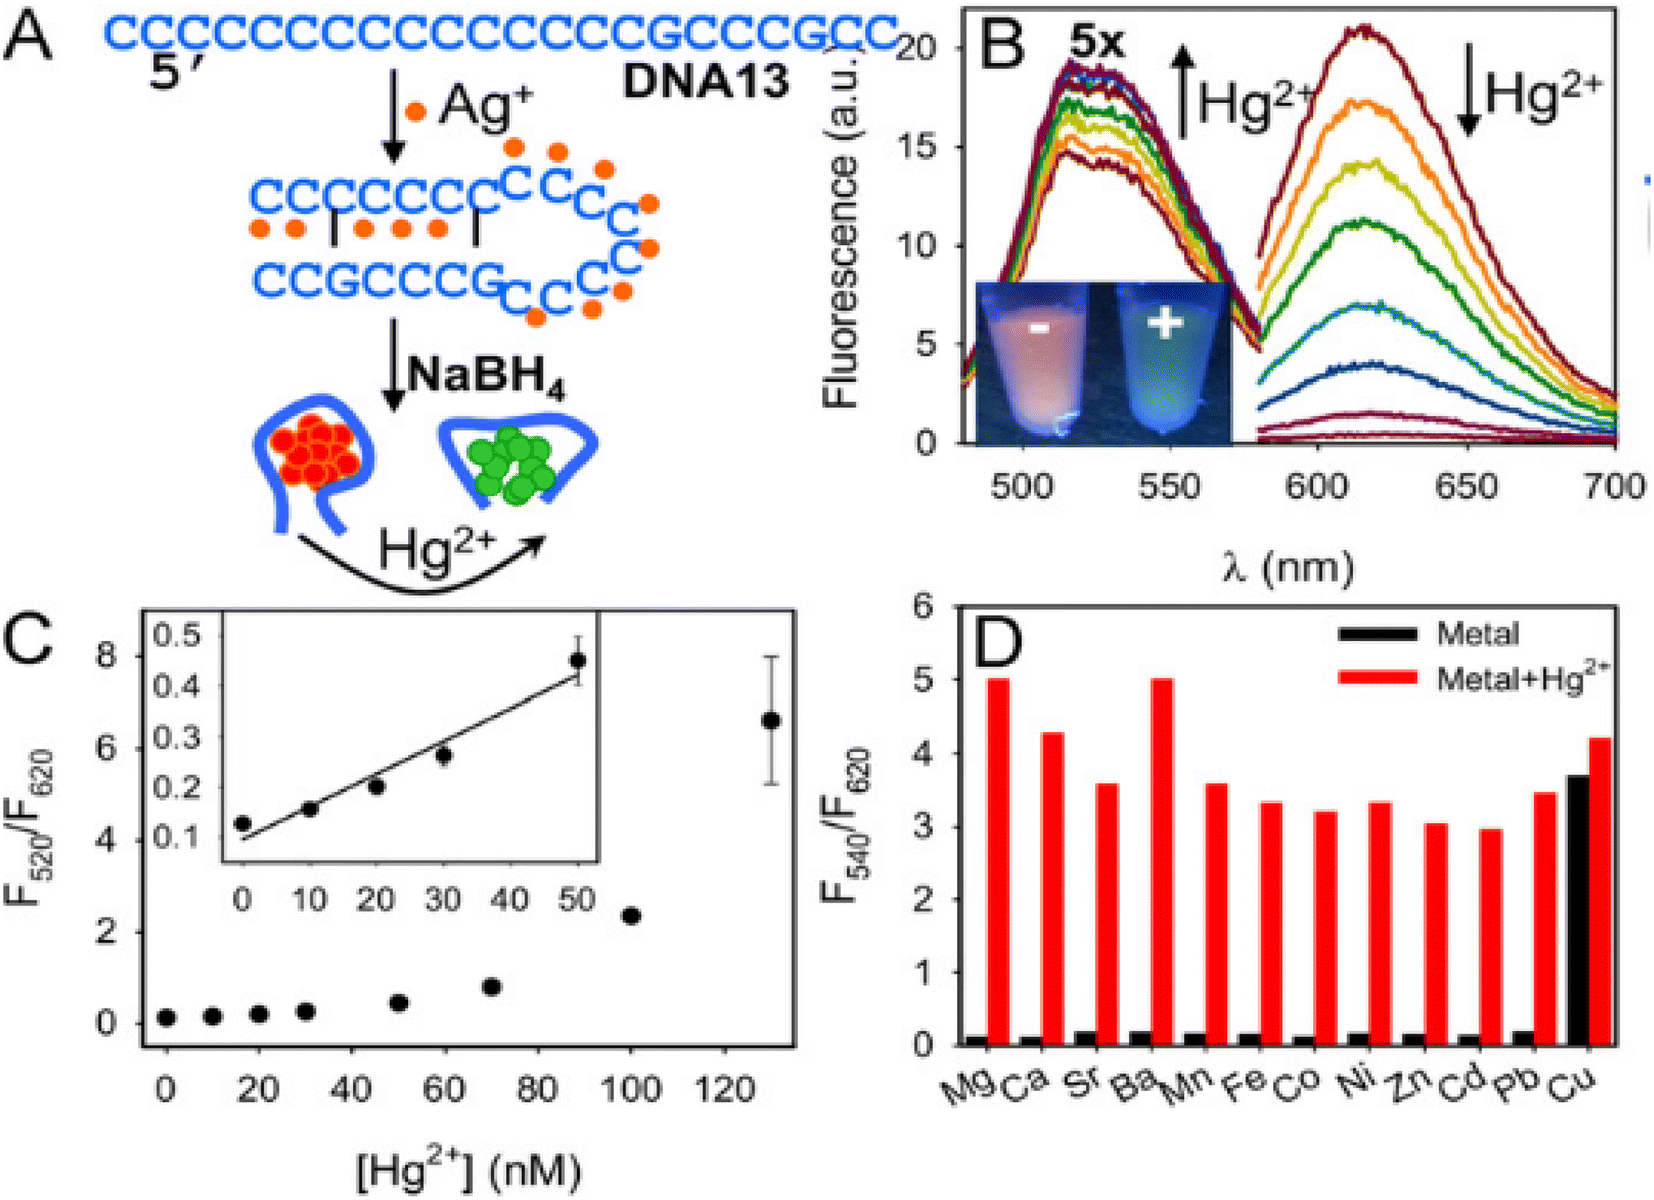 | ||
| Fig. 7 (A) Synthesis of DNA13 passivated Ag clusters, (B) fluorescence spectra after the addition of Hg2+, (C) linear detection range, and (D) effect of competing metal ions. Reproduced with permission from ref. 86, copyright 2024, Biosens Bioelectron. | ||
DNA oligomers are especially intriguing templates for creating AgNCs because the DNA sequence may be changed to produce a variety of emission colors. Hg2+ caused a substantial quenching of the red peak (of DNA13 passivated AgNCs) and a concurrent rise in the green peak, resulting in a visible fluorescence transition from orange to green.86
7.1.2.1 Mechanism based on quenching. Soft–soft interaction: The extremely high lipophilicity of mercury may be the cause of its selective activity in the context of soft–soft contact (soft acid and soft base interaction: SASB). Due to SASB, mercury removed silver from the system74,75 Naaz et al. identified similar principals for their “knock-out” sensor of Hg2+ with 2–6 atom AgNCs.
Reaction with a capping agent: Carboxylic acids of the lipoic acid-capped AgNCs had the greatest affinity towards Hg2+ destabilizing AgNCs and fluorescence was quenched as reported by Bayen et al. (logb4 = 17.6, where b4 is the complex formation constant).
Metallothionein (MT), a low-molecular-weight protein, has a unique dumbbell-shaped structure with a stable C-terminal α-domain and a reactive N-terminal β-domain. Because of the thiolate ligands in MT, Zn2+ in the α-domain was kept in its tetrahedrally coordinated state. However, Zn2+ in the β-domain was preferentially replaced by silver, which was then reduced by sodium borohydride to create AgNCs.
The energy transfer between the AgNCs and the Hg2+ cysteine thiolates in the β-domain may allow coordinated Zn2+ in the α-domain to be exchanged for Hg2+. The decrease in fluorescence emission was caused as a result. Fluorescence quenching was the result of the energy transfer between the AgNCs and the Hg2+-cysteine thiolates in the α-domain.83
Oxidation/amalgam formation: AgNCs were partially oxidized to Ag+ due to electron withdrawal via Hg2+ ions with amalgam formation. The emissive property of Hg2+ was substantially quenched.74
Metallophilic interaction: Weak electrostatic interactions with low-valent closed shells [(n−1)d10ns0] or pseudo-closed shells [(n1)d8ns0] metal ions are referred to as metallophilic interactions. It is a well-known phenomenon that metallophilic connections can form in the structural chemistry of gold(I) derivatives, and it most likely results from dispersion forces that are amplified by relativistic effects. These interactions, whose strengths have been likened to hydrogen bonds, have a range of 2.8–3.5 Å. These interactions are predicted to happen in the chemistry of Hg2+, which likewise has a 5d10 closed-shell electronic structure. These interactions were later found in a wide range of heterometallic/homometallic couples with supported or unsupported backbones.84,87–89
Many research groups79,81,84 pointed out metallophilic interaction for Hg2+-induced quenching. Guo et al. illustrated 5d10(Hg2+)–4d10(Ag+) metallophilic interaction for protein-passivated AgNCs with Hg2+ for fluorescence quenching. In cytosine-rich DNA, fluorescence quenching resulted from high d10–d10 metallophilic interactions, 5d10(Hg2+)–4d10(Ag+).
7.2 Fluorometric detection of Hg2+ with silver nanoparticles
Ganguly et al.91 prepared Schiff base from salicylaldehyde and 1,3 propylene-diamine. Such Schiff base worked as a capping agent for AgNPs, exhibiting silver-enhanced fluorescence (SEF). SEF was quenched selectively by dopamine and restored selectively by Hg2+. The introduction of Na2-EDTA caused quenching due to the EDTA-Hg2+ adduct.
7.2.1.1 Mechanism-based on enhancement-based detection. In a turn-on situation thymine(T)–Hg–thymine(T) bond is observed. So, Hg2+ selectively increased the fluorescence intensity.90
Deng et al.93 designed DNA-capped fluorescent AgNPs, which were highly selective for Hg2+, because of Ag/Hg amalgam formation (LOD 2.6 nM) (Fig. 8).
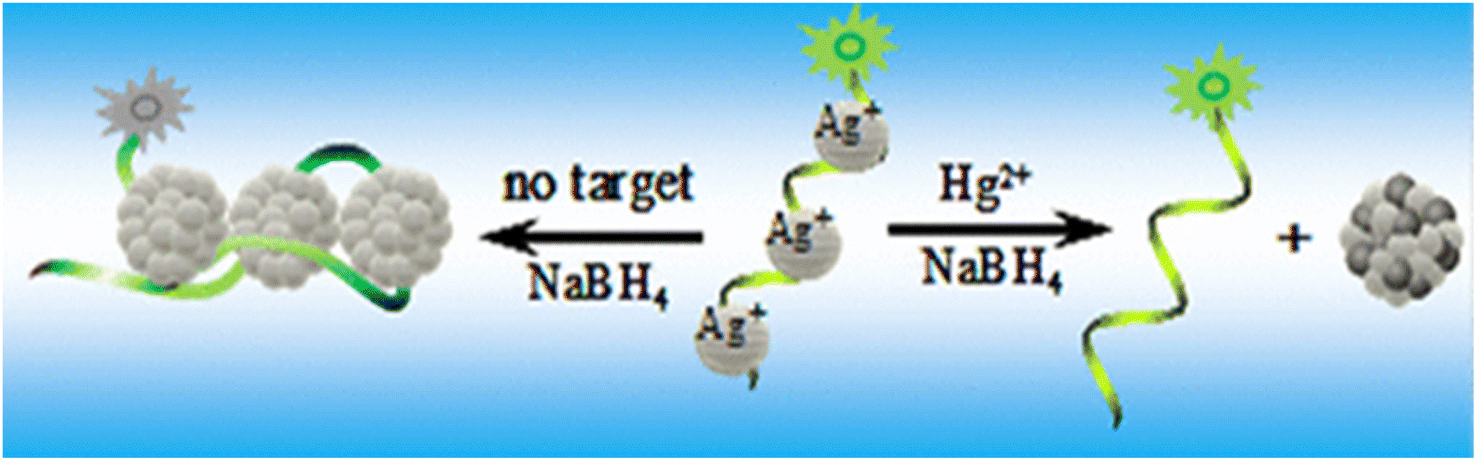 | ||
| Fig. 8 Quenching of fluorescence with Hg2+ via DNA-AgNPs. Reproduced with permission from ref. 93, copyright 2024, Anal. Chem. | ||
7.2.2.1 Mechanism-based on quenching. Reaction with a capping agent: The Fluorescence of NBD-capped AgNPs is drastically quenched by Hg2+ due to complexation with NBD. Having the paramagnetic properties of Hg2+, the electronic environment of NBD was changed leading to a turn of fluorescence.92
It is also essential to know how Ag and Hg atoms interact chemically. Interaction is usually redox in nature. With Hg2+, nanoclusters lose their fluorescence by being oxidized and aggregated.
X-ray photoelectron spectroscopy was used to investigate the distinct and powerful interaction between AgNCs and Hg2+, which is caused by dispersion forces between closed-shell metal atoms. The silver 3d spectra were de-convoluted into components at 369.582 eV (Ag 3d5/2) and 375.720 eV (Ag 3d3/2), which are indicative of Ag ions when Hg2+ was introduced to the DNA-AgNCs. Hg endured the process as a doubly charged particle. Fluorescence quenching was brought on by potent 5d10(Hg2+)–4d10(Ag+) metallophilic contacts.77,94 The TEM image clearly showed the formation of AgNPs from the small AgNCs, after Hg2+ treatment. Liu et al.82 theorized that the aggregation of AgNCs was driven by the coordination effect, because of the stronger interaction between Hg2+ and the –COOH group, on the surfaces of AgNCs.
Riboflavin-capped AgNPs were not aggregated in the TEM picture, but they became aggregated after the addition of Hg2+.90
8. Concepts of colorimetric sensing
Localized Surface Plasmon Resonance (LSPR) is unique to noble metal nanoparticles (MNPs). The conduction electrons of MNPs collectively and tenaciously vibrate, when a certain frequency of electromagnetic radiation interacts with them. This resonance is known as an LSPR or SPR. Metal NPs and the environment around them were essential to LSPR. NPs can change their size, shape, and composition, changing the LSPR frequency, and their sensitivity to the dielectric properties of their surroundings with LSPR shifts. MNPs are unique due to these distinguishing LSPR characteristics, with gold and AgNPs being among the best in their class. Numerous sensors have been developed with this feature in mind. When MNPs interact with the target analyte, two different types of sensors are produced: an aggregation sensor (caused by the NPs' inter-particle plasmon coupling) and a refractive index sensor (caused by the medium's change in local refractive index—plasmon shift). The LSPR displacement from source frequency results from this. Additionally, there are additional types of sensors, including Surface Enhanced Raman Spectroscopy (SERS) and Metal Enhanced Fluorescence (MEF).95,96 Aggregation sensor is the subject of the current debate. Metal ion identification is easy, rapid, good, and cheap when MNPs are aggregated, causing a wide redshift of the LSPR band (Fig. 9).97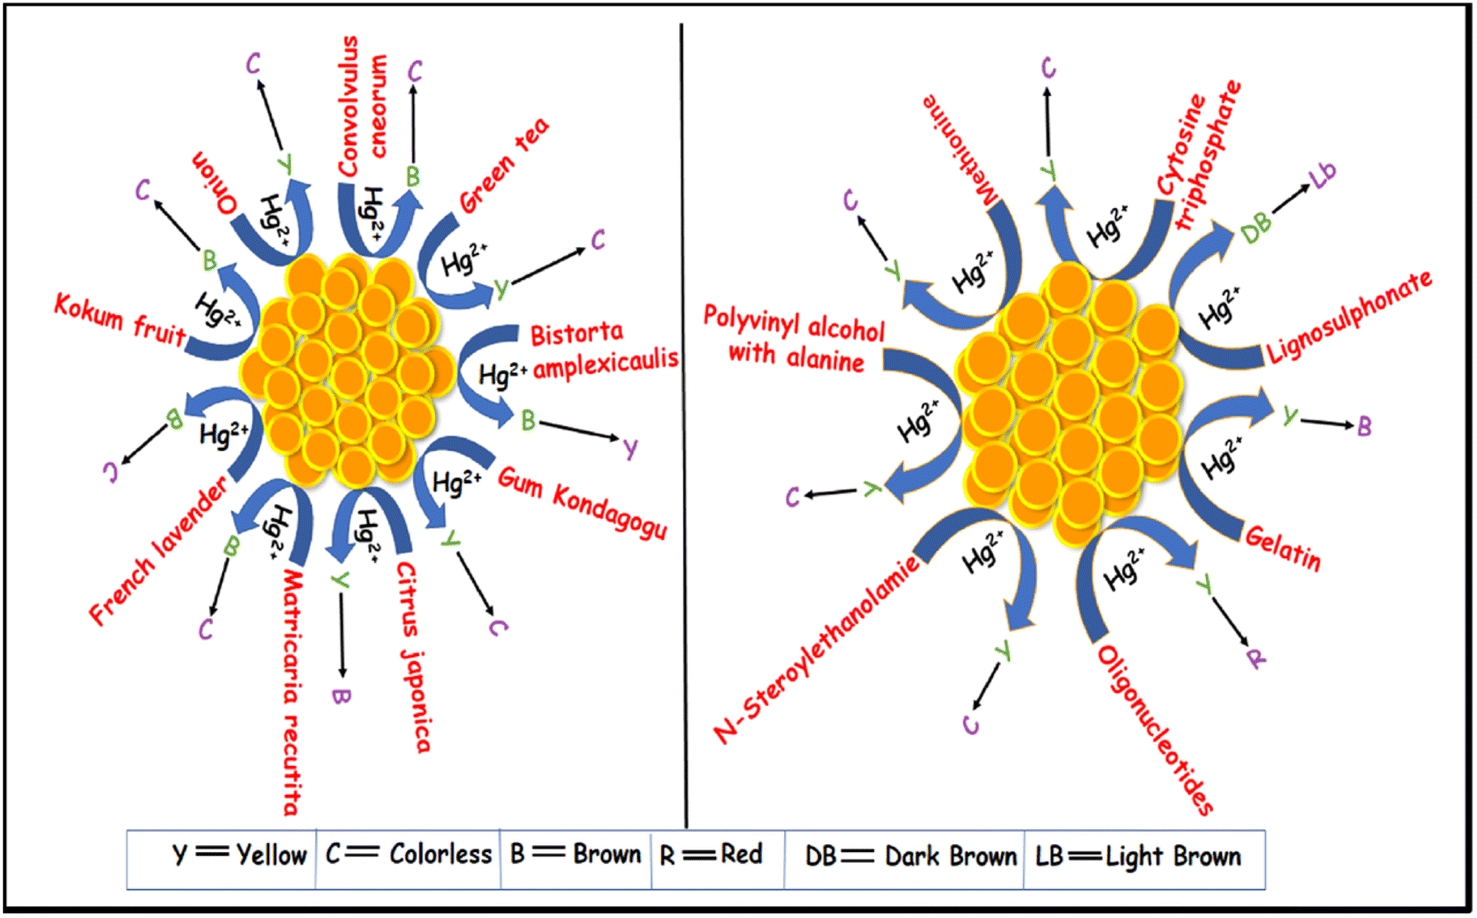 | ||
| Fig. 9 Colorimetric-based sensing of mercury with AgNPs, with different capping agents. | ||
8.1 Colorimetric detection of Hg2+ via AgNCs
Roy et al.79 designed glutathione-capped AgNCs, which are reddish pink in color, and after the addition of Hg2+, a colorless solution appeared. It was observed also through the naked eye (LOD 245 nM).Liu et al.82 prepared pinked-colored AgNCs, templated with the sodium salt of polymethacrylic acid, employing a hydrothermal technique. In the presence of Hg2+, the pink color changed to colorless. A shift of the absorbance peak from 510 nm to 470 nm due to the color change was observed.
8.2 Colorimetric detection of Hg2+ ions using AgNPs
| Plant extract | Color change (before and after Hg2+ treatment) | λ change (before and after Hg2+ treatment) | Linear range | LOD | References |
|---|---|---|---|---|---|
| Jicama root | Yellowish brown to colorless | From 427 nm to & hypsochromic | 100 nM –200 μM | 98 | |
| French lavender | Brown to colorless | From 440 nm to 290 nm hypsochromic | 2.7 μM –200 μM | 2.7 μM | 99 |
| Convolvulus cneorum's aqueous leaf | Brown to colorless | Blue shift 452–417 | 50 μm–200 mM | 5 ppb | 100 |
| Bistorta amplexicaulis | Dark brown to light yellow | — | 1 × 10⁻⁶ to 1 × 10⁻⁷ M | 8.0 × 10⁻⁷ M | 101 |
| Onion | Yellow to colorless | From 400 nm to 290 nm hypsochromic shift | — | — | 102 |
| Gum kondagogu | Yellow to colorless | — | 50–900 nM | 4.9 × 10⁻⁸ mol L−1 | 103 |
| Green tea | Brownish to transparent | 424 nm | 20 to 160 μM | — | 104 |
| Kokum fruit | Brown to colorless | 426 nm | 120–200 ppm | 6.2 ppb | 105 |
| Citrus japonica | Yellow to brownish | — | 0.3–7.3 μM | 0.09 μM | 106 |
| Matricaria recutita | Yellowish brown to colorless | — | — | — | 107 |
Farhadi et al.94 synthesized soap-root plants as a stabilizing agent for AgNPs. Because silver nanoparticles' surface plasmon resonance vibrations (SPR band) were excited, synthesized AgNPs appeared yellowish-brown in an aqueous solution. The color of the freshly prepared AgNPs solution changed from yellowish-brown to pale yellow upon the addition of Hg2+ solution. The color of the AgNPs solution then gradually decreased as the concentration of Hg2+ increased, and it eventually turned colorless upon the addition of a known concentration of 10−3 mol L−1 mercury(II) (Fig. 10).
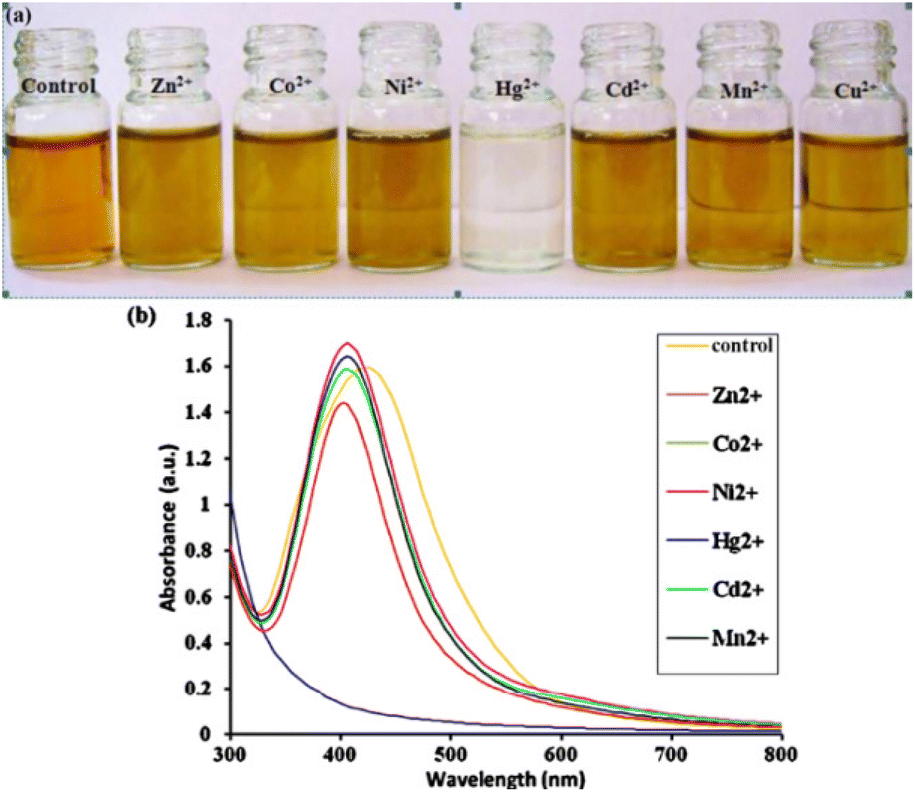 | ||
| Fig. 10 (a) Digital image and (b) UV-vis spectra of synthetic AgNPs containing various transition-metal ions. Reproduced with permission from ref. 94, copyright 2024, Sens. Actuators B: Chem. | ||
For example, using an environmentally friendly method, Convolvulus cneorum's aqueous leaf extract was used to create AgNPs. A possible colorimetric detection limit for hazardous Hg2+, and Cr(VI) up to ppm was demonstrated using so-produced AgNPs. When Hg2+, Cr(VI), and ammonia were added, the SPR peak of AgNPs underwent a noticeable blue shift.100
| Lab chemicals | Color change (before and after Hg2+ treatment) | λ change (before and after Hg2+ treatment) | Linear range | LOD | References |
|---|---|---|---|---|---|
| Lignosulphonate | Dark brown to light brown | 403.5 nm/409 nm | 1–20 ppm | 0.7 ppm | 110 |
| N-Steroylethanolamine | Yellow to colorless | 418 nm/gradual hypsochromic shift | — | — | 111 |
| Cytosine triphosphate | Yellow to colorless | 390 nm/gradual hypsochromic shift | 0.625 to 5 Mm | 0.125 μM | 112 |
| Natural polymer | Generation of blue color | 620 nm | 0.50 to 800 nM | 0.125 nM | 113 |
| Polyvinyl alcohol (PVA) with alanine | Brownish-yellow to colorless | — | 200–1000 nM | 143 nM | 114 |
| Mercury-specific oligonucleotides | Yellow to pale red | 395 nm/570 nm | 25–500 nM | 17 nM | 115 |
| Methionine | Yellow to colorless | 390 nm/Hypochromic shift | 20–100 nm | — | 116 |
For example, Zhan et al.112 developed a colorimetric platform for measuring Cr3+ and Hg2+, using AgNPs capped with cytosine triphosphate (CTP). AgNO3 was reduced in the presence of CTP in a single step to yield the CTP-capped AgNPs. It was shown that these AgNPs can interact with Cr3+ A new, red-shifted band arose at 510 nm as a result, turning the material from yellow to red, and the SPR band at 390 nm lost some of its intensity. In further cases, the yellow color of AgNPs vanished gradually with increased [Hg2+], associated with little hypsochromic shift (detection range 0.625 μM to 5 μM and detection limit 0.125 μM).
Huang et al.117 synthesized L-tyrosine capped AgNPs for Hg2+ sensing, based on the Tyndall effect (TE) assay. The TE-inspired assay has a linear detection range for Hg2+ of 5 nM to 4 M.
8.2.4.1 Redox reaction. One putative mechanism for chlorophyll-AgNPs' interaction with Hg2+ ions is the oxidation of metallic Ag. Hg ions were associated with –CH3 and –CH2 at the surface of chlorophyll-AgNPs and exchanged electrons with the AgNPs. The color faded as a result. The SPR band widened and shifted to blue, and the absorption band at 290 nm picked up additional silver ions.99
The possibility of a redox reaction, taking place at the surface of the AgNPs, was utilized to explain the putative mechanism for the selective identification of Hg2+ due to the difference between the standard potentials of 0.85 V (Hg2+/Hg) and 0.8 V (Ag+/Ag). When Hg2+ is added to the colloidal AgNPs solution, the organic capping agents on the surface of the AgNPs strengthen the electrostatic–ionic attractions between the NPs and Hg.100 Anbazhagan et al.111 also reported the selective detection of Hg2+ ions via the decoloration of N-steroylethanolamine-AgNPs due to redox reaction.
Due to the lower cohesive energy of Hg (0.69 eV) than that of Ag, reducing chemicals can create Hg atoms by reducing Hg2+ direct contact with AgNPs can result in the formation of Ag@Hg nanoalloys (2.95 eV). Newly created Hg atoms may migrate onto the silver surface, resulting in a slight blue shift and a diminution of the absorption band. Zhan et al.112 synthesized cytosine triphosphate-capped AgNPs and the capping agent reduced Hg2+ to Hg atom. During this process, Hg had direct contact with AgNPs to form Ag@Hg nanoalloys.
8.2.4.2 Ag–Hg amalgam. A reaction between AgNPs and Hg ions produced amalgam. Amalgam formation can happen when Hg2+ and AgNPs interact chemically through under-potential deposition due to the negligibly tiny electrochemical potential difference between Hg2+ (0.85) and AgNPs (0.8 V). This suggests that the amalgam formation process is quite probable.104,105,107
The polyvinylpyrrolidone-capped AgNPs added to methionine for colorimetric conjugate, play a significant role in the aggregation of the AgNPs because of the enhanced attraction of Hg2+ for the sulfur present in methionine. The selectivity of Hg2+ could not be observed without methionine. The Hg2+ ion caused the AgNPs to agglomerate, turning them colorless from pale yellow.
8.2.5.1 Tyndall effect (TE). The term Tyndall colloid was given by British scientist John Tyndall because it frequently suggests a “visible light path” that results from the scattering of a light beam by colloidal nanoparticles. The size or quantity of colloidal particles favorably impacts the TE intensity. AgNPs are preferred over AuNPs of the same size because of their less expensive material cost and other characteristics.121,122
Visual tests are initially made using the silver colloid's TE. The TE-inspired test can detect Hg2+ ions with incredible sensitivity. It is about 5400 times more sensitive than surface plasmon resonance signaling. All you need is a smartphone and a laser pointer pen for portable quantification.117
For example, using hydrothermal tyrosine reduction, AgNPs were created, and they emitted an intense reddish signal due to TE (Fig. 11). As a result of the AgNPs being destroyed by the unique oxidation–reduction interactions between the analyte ions [E0 (Hg2+/Hg) = 0.85 V] and the nanoprobes [E0 (Ag+/Ag) = 0.80 V], the TE would be significantly decreased or even eliminated with the addition of Hg2+. The variation in TE intensity was used to qualitatively or semi-quantitatively analyze the Hg2+ content and a Hg2+ detection limit of 0.85 nM was achieved.117
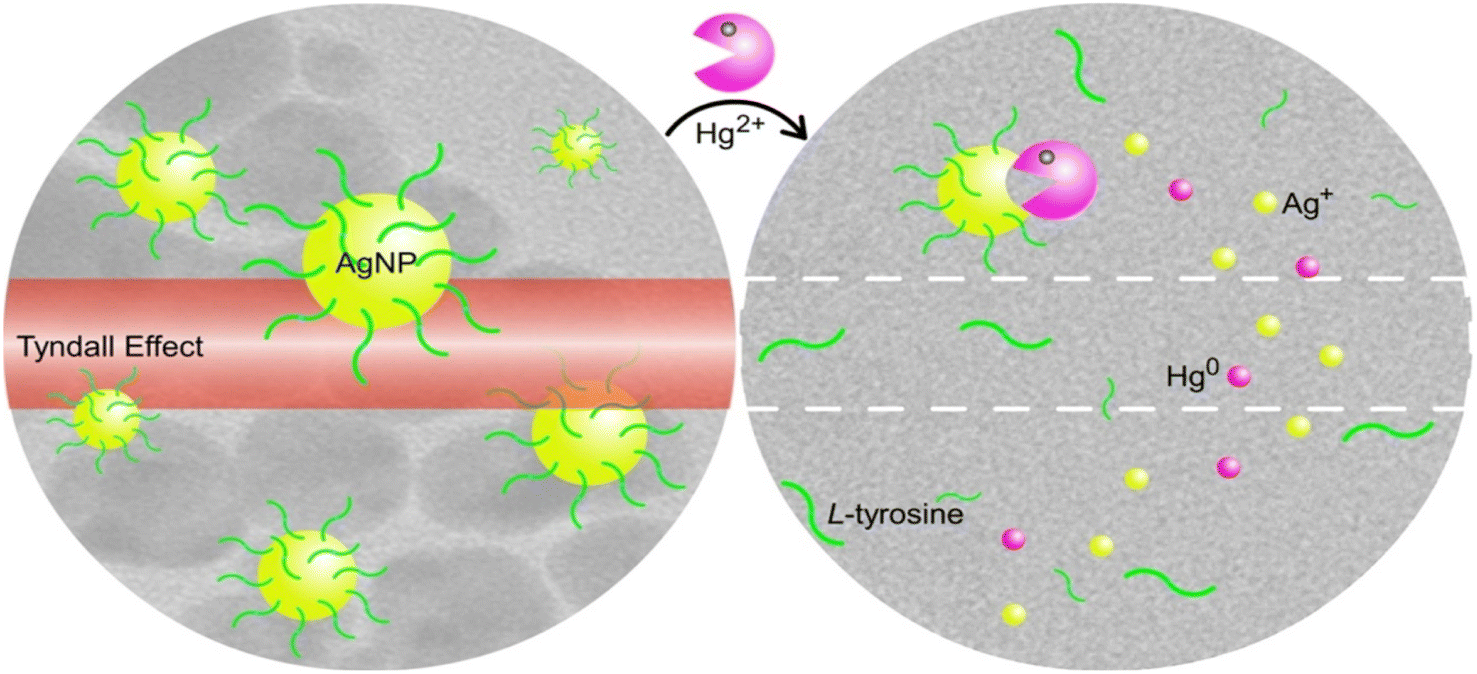 | ||
| Fig. 11 Sensing of mercury with tyrosine-stabilized AgNPs involving the Tyndall effect. Reproduced with permission from ref. 117, copyright 2024, Sens. Actuators B: Chem. | ||
9. The fate of mercury and AgNPs
AgNPs are usually found to be aggregated and destabilized after the addition of Hg2+ in the silver hydrosol, as observed from various characterization tools. DLS, TEM, SEM, zeta potential, and XRD data often support the amalgam formation after the treatment of Hg2+ towards AgNPs.For example, Alzahrani102 reported the green synthesis of AgNPs with a thin layer of capping materials, consisting of onion extract on their surface. TEM images of the particles were in the nano range with a spherical shape, great dispersion, and no aggregation, effectively stimulating the LSPR band's absorbance. After adding Hg2+, the AgNPs were also evaluated by TEM examination. The findings showed that AgNPs were dramatically changed by the addition of Hg2+. Catalytic interactions between Hg2+ and AgNPs caused the NPs to assemble and aggregate. Hg2+, interacting with AgNPs, decreased the absorbance of the LSPR band in UV-vis spectra. AgNP aggregation did not exist together with other metal ions.
Gum kondagogu-capped108 AgNPs underwent SEM-EDAX investigation before and after being exposed to Hg2+. By lyophilizing the AgNPs colloidal solution before and after the reaction with Hg2+ and recording XRD bands, it was determined that Ag–Hg alloy was produced via analyzing standard silver-nanocomposite substance XRD patterns before and after Hg treatment. The face-centered cubic bulk metallic equivalents of the crystalline phases, produced by the creation of AgNPs in the Gum kondagogu medium, could be indexed to the (1 1 1), (2 0 0), (2 2 0), and (3 1 1) planes. All of the diffraction peaks are distinct, with the peak at (1 1 1) having the greatest strength. The XRD study supports the creation of amalgam following the addition of Hg2+. The lyophilized powder from AgNPs and Hg2+ reaction had an XRD pattern, nearly matched to Ag2Hg3 alloy, proving that Hg2+ had been reduced by Ag0.
The TEM picture showed scattered sphere-shaped nanocrystals with an average diameter of around 13 nm for the cytosine triphosphate (CTP)-capped AgNPs.112 The average hydrodynamic diameter of scattered AgNPs was found to be ∼30 nm, which was a bit bigger than what was predicted using the TEM image. According to the TEM image, the irregular amalgam was formed after being incubated with Hg2+ as a result of Hg atom diffusion.112 Hg2+-stimulated AgNP aggregation was provided by TEM (reported by Wang et al.115), which revealed individual NPs in the absence of Hg2+ and aggregated NPs in the presence of Hg2+ (Fig. 12).
 | ||
| Fig. 12 TEM images of the AgNPs solution (0.075 nM) mixed with 300 nM MSO in the (A) absence or (B) presence of 500 nM Hg2+ after the addition of 60 mM NaCl. Reproduced with permission from ref. 115, copyright 2024, ACS Appl. Mater. Interfaces. | ||
AgNPs can detect mercury ions as low as ppm level, when coupled with a ligand, such as sodium 3-mercapto-1-propane sulfonate(3-MPS). Schiesaro et al.123 suggested the sensitivity of the nanosensor to Hg2+ in the 1 to 5 ppm range, using optical analysis, and substantiated the observation with several characterization tools (Fig. 13). The color was changed from yellow to colorless. The absorption spectra of AgNPs had a distinct maximum at 399 nm. With an increase of 1 ppm of Hg2+, the absorption band was blue-shifted to 385 nm. As the amount of Hg2+ in the Ag hydrosol increased, the blue shift increased and reached its peak at 348 nm at 5 ppm of Hg2+. The formation of homogeneous NPs of Ag–Hg alloys appeared to be triggered by the addition of Hg2+.
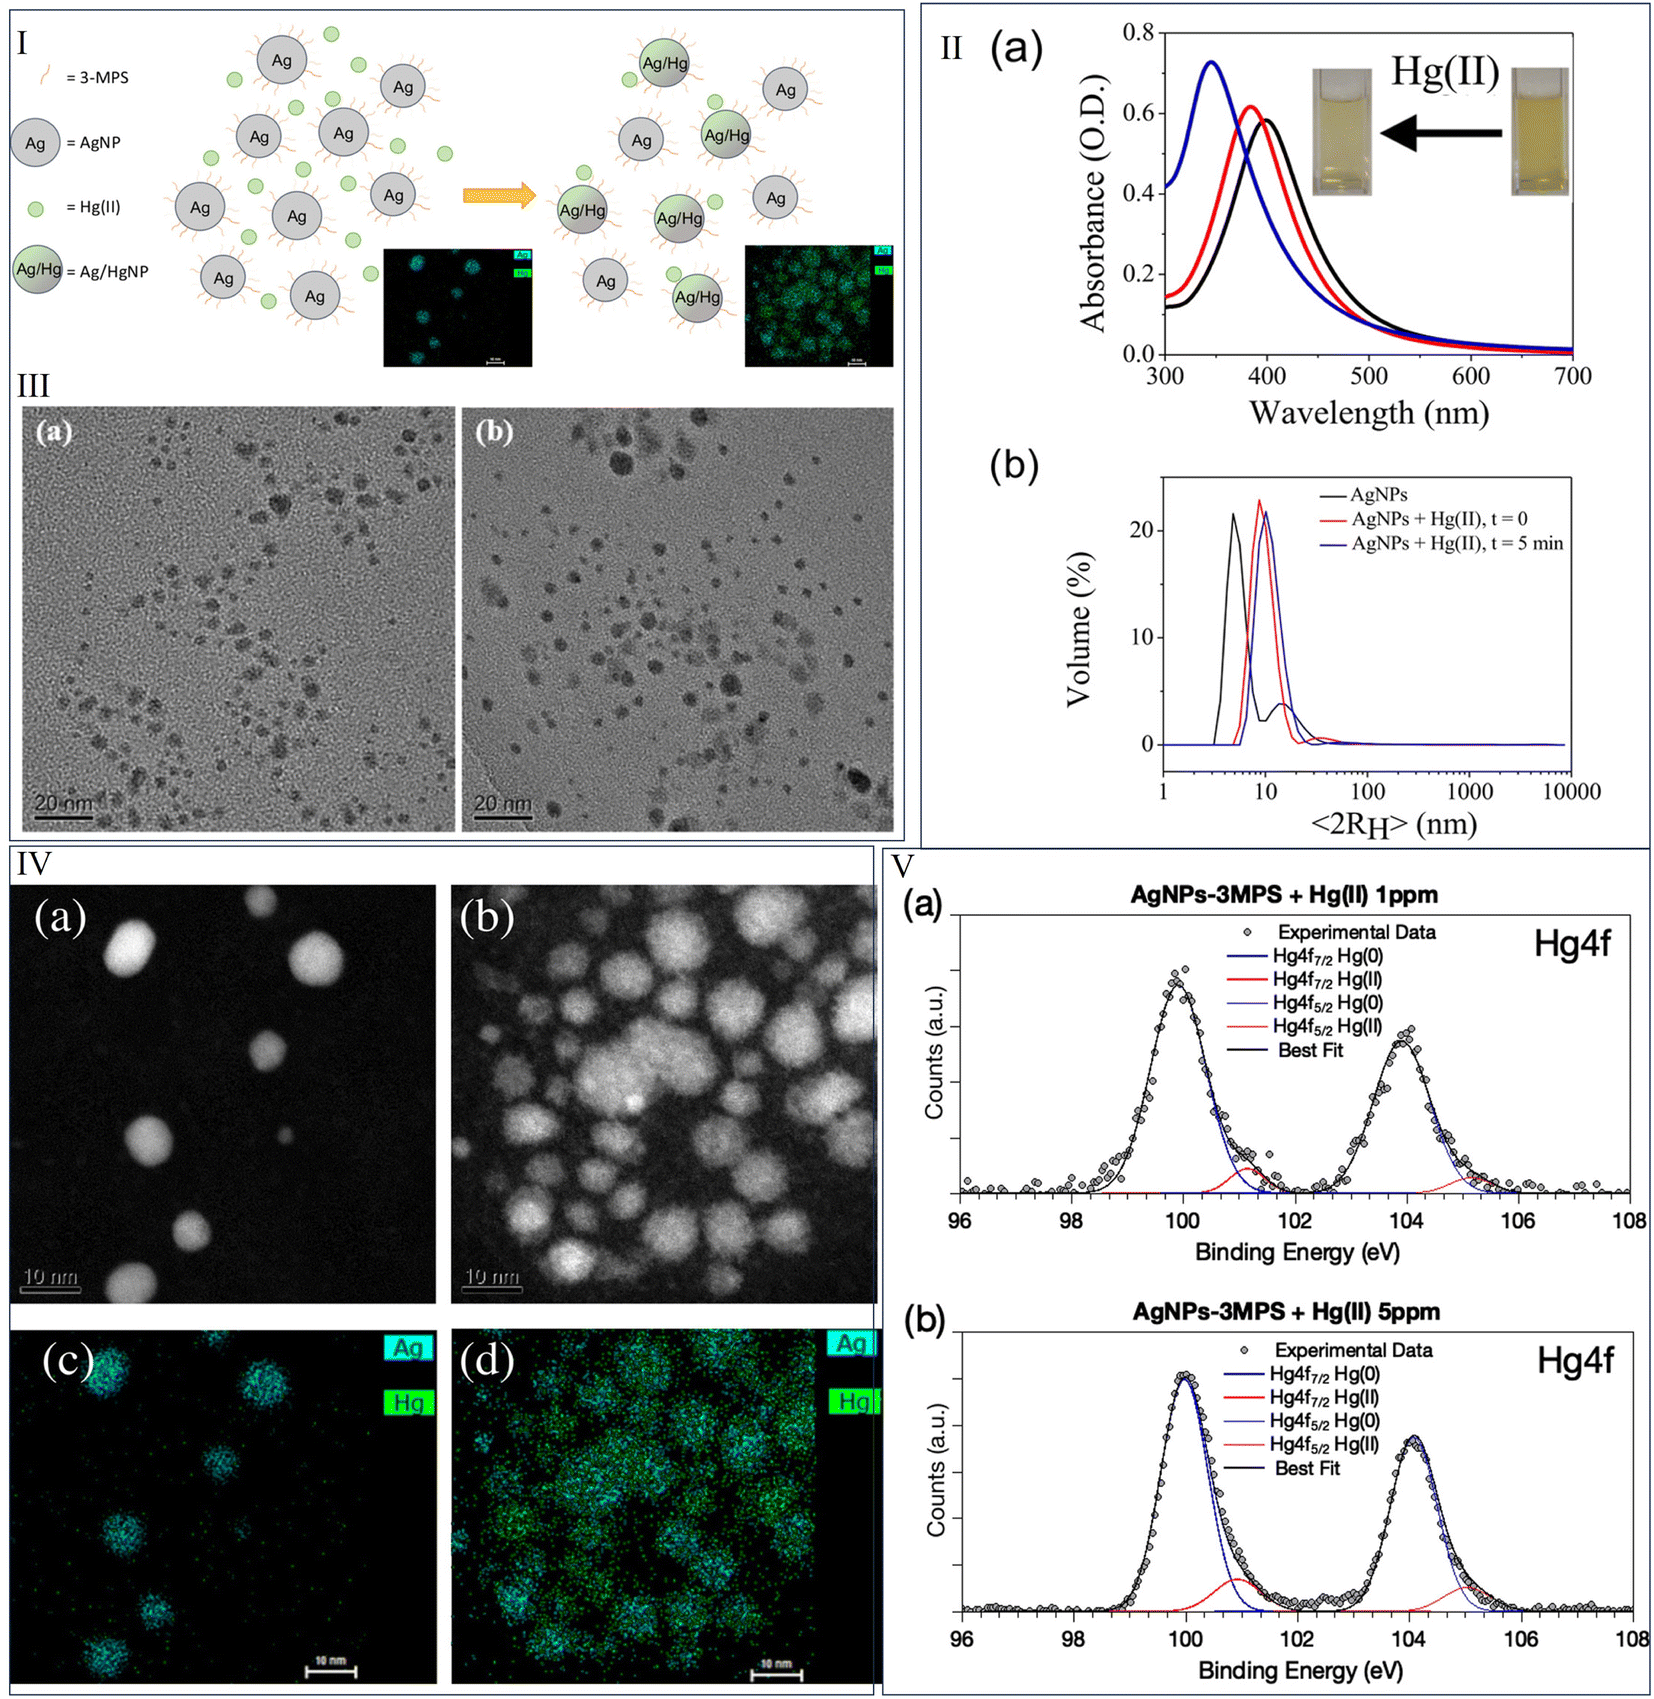 | ||
| Fig. 13 (I) Formation of Ag–Hg amalgam after the treatment of Hg2+ to 3-MPS capped AgNPs; (II) (a) UV-visible spectra and (b) DLS spectra of 3-MPS capped AgNPs with the addition of Hg2+; (III) TEM image (a) before and (b) after the addition of Hg2+; (IV) (a) STEM image before addition of Hg2+, (b) STEM image after addition of Hg2+, (c) EDS mapping before addition of Hg2+, and (d) EDS mapping after addition of Hg2+; (V) XPS spectra for the element mercury after the addition of Hg2+ at two different concentrations. Reproduced with permission from ref. 123, copyright 2024, J. Phys. Chem. C. | ||
The size of AgNPs increased in the presence of Hg2+. DLS data supported 3-MPS ligand-capped-AgNPs to be non-aggregated than the same sample with 1 ppm Hg2+. 3-MPS ligated AgNP/Hg aggregate structure was clarified by TEM morphological analysis, revealing the creation of Ag/Hg alloy NPs.
The EDS map investigation in conjunction with the STEM analysis brought up key points. Some AgNPs had dark sections with low Hg content and high porosity. Others included brilliant regions with high Hg concentrations and little porosity. Furthermore, it was clear that the size of the AgNPs affected the dispersion of Hg atoms. In contrast to the smaller population, which had few or no Hg atoms interacting with the NPs, the larger population had a uniform distribution of Hg atoms across its whole volume, generating an amalgam of Ag and Hg rather than a core–shell structure.
The XPS spectra123 of AgNPs were unsymmetric because of the capping of 3-MPS. The AgNPs were composed of at least two distinct types of Ag atoms. The extremely modest signal at greater binding energy was typically attributed to positively charged silver atoms, interacting with the ligand at the NP surface. Metallic Ag atoms in the NPs core had the lowest spin–orbit coupling binding energy (Ag 3d5/2 = 368.09 eV binding energy). The XPS spectra of Hg 4f were asymmetric with the addition of Hg, resulting in two distinct couples of spin–orbit components. The primary component (Hg 4f7/2 BE = 99.9 eV) was consistent with Hg0 atoms for amalgams. The signal of lower intensity (about 10% of the total Hg 4f signal) with higher binding energy (around 101 eV) could be attributed to Hg2+ ions in coordination compounds or oxides.
10. Spot detection
There are some reports114,116 available in the literature for spot Hg2+. Janani et al.114 synthesized polyvinyl alcohol-stabilized AgNPs. In the presence of alanine, Hg2+ can be detected by the colorimetric sensor. For making the test paper-based sensor, the Whatmann paper was submerged in AgNPs-alanine. To make the hydrogel for Hg2+ detection, agarose powder was dissolved in an AgNPs–alanine conjugate. To test the recognition depending on visual color change, a few drops of Hg2+ and other metal ions solutions were dripped onto the dried filter paper and agarose gel-based sensor. Hg2+ concentrations ranging from 1 nM to 1 mM were used to determine how the color gradient appeared.11. Real sample analysis
NPs and NCs of Ag metal are widely used for selective and sensitive mercury detection. Though there are ample reports77,92,98,108,112,114,117 available in the literature, it is also important to check their applicability in natural water samples (tap water, rainwater, sewage water, river, ocean, etc.). Hg is one of the serious contaminants in natural water, causing hazards in ecosystems human health, and the environment. The real sample analysis provides unequivocal evidence of the applicability of methods for prototype applications. To test the metal ion sensing potential of NSEA-AgNPs in ambient water bodies, Veerappan et al.111 collected water samples from the normal tap (a nearby pond), disposal of a sewage plant (campus of SASTRA University in, Tamilnadu), and blood plasma. The addition of NSEA-AgNPs indicates the absence of Hg contamination in these samples.98 They also spiked Hg2+ in natural samples and successfully determined [Hg2+] with their proposed technique.12. Effect of adulteration
The production of bimetallic Au/Ag NPs has also received increased attention recently, with the goal of combining their synergistic effects to attain more alluring benefits over monometallic ones for electrical, optical signals, and catalytic efficiency.124,125In the long-overlooked “silver effect” on gold catalysis, bimetallic AuAg NPs (Au–Ag BNPs) have substantially higher catalytic activity than Au nanoparticles alone. Additionally, some luminescent Au/AgNCs have been created or used by adding silver to alter the luminance of AuNCs.126,127 A Few reports128,129 are available on silver gold-doped nanoclusters and nanoparticles for Hg2+ sensing.
Ganguly et al.130 designed a glutathione-capped core–shell giant cluster, with gold(I) in the core and silver(0) in the shell. The core–shell fluorescent giant cluster is highly stable with time, even in solid form (Fig. 14).131 This giant cluster was a sensitive and selective platform for Hg2+ based on fluorescence quenching. The metallophilic 5d10(Hg2+)–4d10(Agδ+) interaction as well as Hg2+ stimulated aggregation was ascribed for causing the fluorescence quenching and redshift (LOD 6 nM).
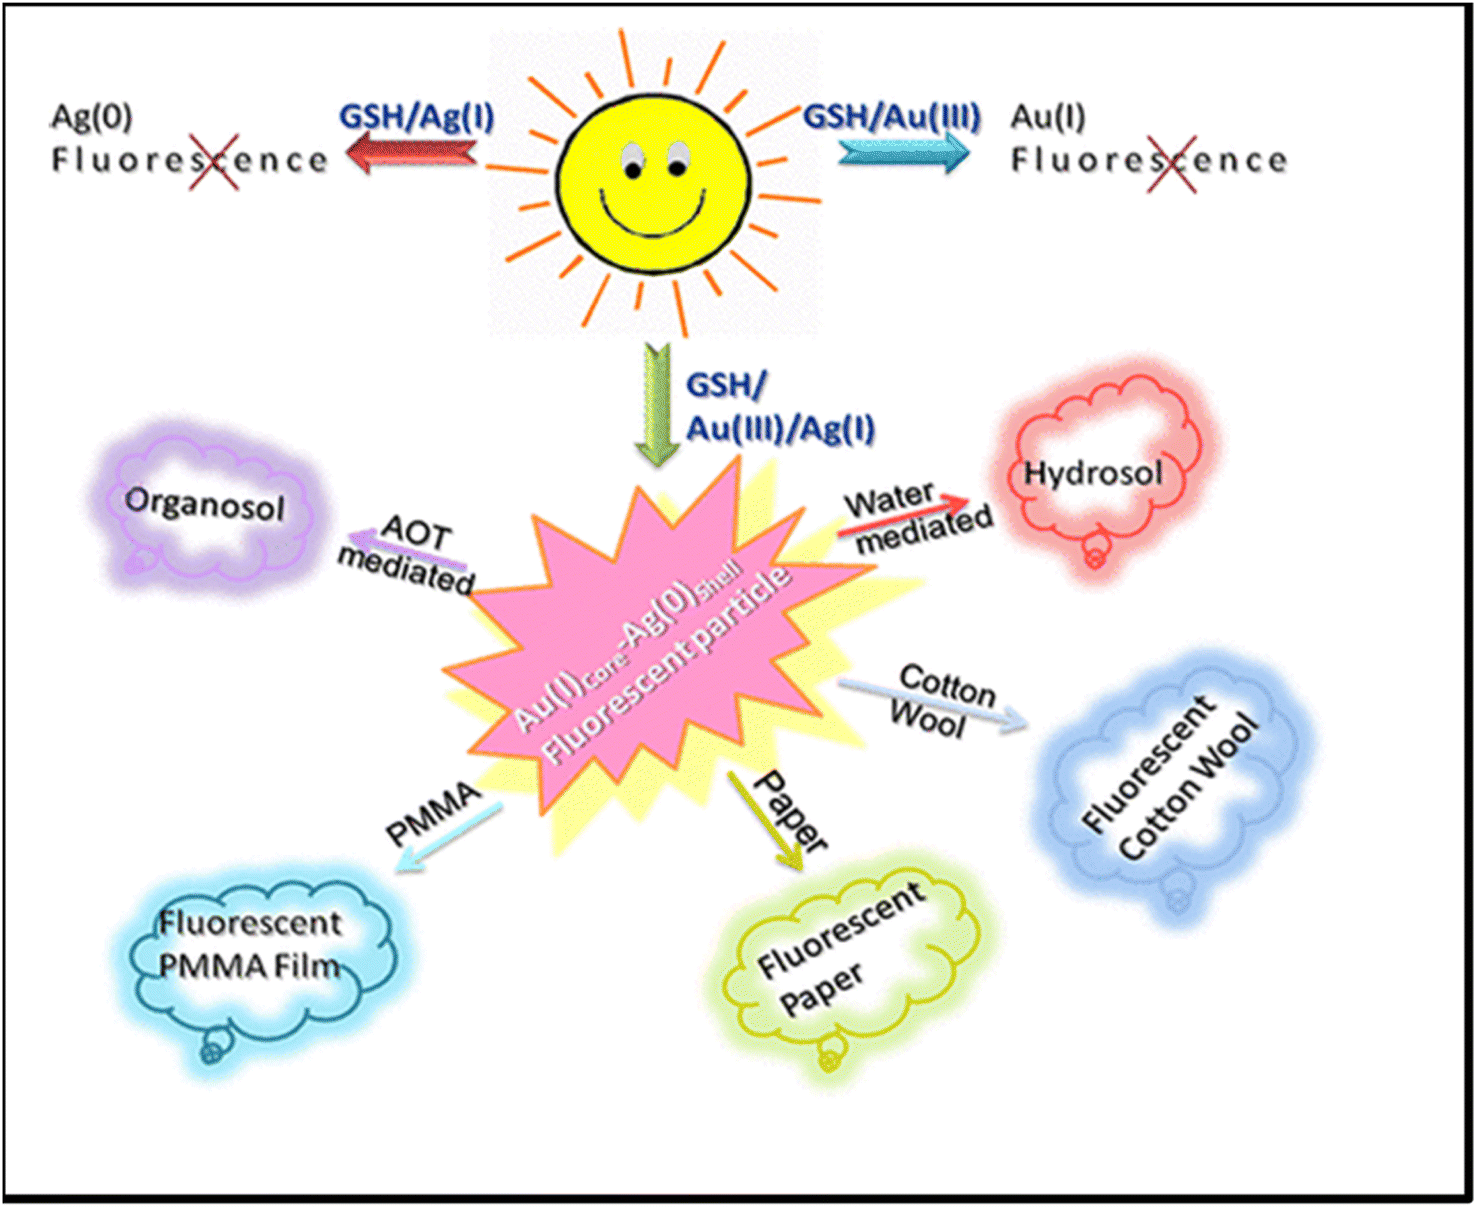 | ||
| Fig. 14 Bimetallic gold silver giant clusters with strong emissive properties for versatile applications. Reproduced with permission from ref. 131, copyright 2024, Langmuir. | ||
Zhang et al.132 synthesized bovine serum albumin-capped fluorescent bimetallic alloying gold–silver NCs for the selective sensing of Hg2+ and Cu2+.
Mathaweesansurn et al.133 designed a colorimetric sensor, Au–Ag bimetallic NPs for sensitive and selective detection of Hg2+. Hg2+ was found to have a LOD of 0.526 + 0.001 mg L−1 and a detection range of 0.5 to 80 mg L−1. The practical application of bimetallic NPs for the detection of Hg2+ in real samples has also been confirmed.
Direct electrodeposition of the Ag-AuNPs onto the indium tin oxide glass substrate was reported by Tao et al.134 In addition to serving as a reducing agent, the NPs may also act as a recognition platform to find Hg2+. The Ag-AuNP surface had a hypochromic shift in the LSPR band due to the Hg deposition (LOD 0.02 ppb and linear detection range 0.05 to 500 ppb).
Au–Fe doped AgI passivated with polyglycine was employed for colorimetric sensing of Hg2+. The polyglycine assisted in stabilizing the Au–Fe doped AgI via hydrogen bonding. Hg2+ introduced a redox reaction, causing the formation of elemental Hg to coat the metal composite for sensing via amalgamation. Thus, optical density was decreased with the oxidation of metals involved in the sensing platform, and in situ produced reduced Hg was deposited on the oxidized metalized surface.129 The LOD was observed to be 1.0 nM, while λmax of 500 nm in the absorption spectra was decreased with [Hg2+].
13. Conclusions and future perspectives
While NPs are primarily used for colorimetric techniques, NCs are predominantly used for fluorometric procedures. Numerous quenching-based fluorometric detection techniques exist. However, a few stories included sensing with enhancement. This review is a comparative account of AgNPs and AgNCs regarding physicochemical behaviors, sensing tactics, the fate of associated components, plausible mechanisms, spot detection, and real sample analyses. In contexts of prototype uses, such as in hospitals, labs, homes, and fields, novel AgNPs and AgNCs syntheses with non-toxic, stable, affordable, and biocompatible reagents are warranted for their simplicity, convenience of use, and low cost. This review will hopefully serve as an asset for the young researcher to venture into the field of hazardous material sensing and remediation technologies with sufficient literature background.Conflicts of interest
There are no conflicts to declare.References
- F. N. Chaudhry and M. F. Malik, J. Ecosyst. Ecography, 2017, 7, 1–3 Search PubMed.
- S. Ahuja, ACS Symp. Ser., 2020, 1352, 1–11 CrossRef CAS.
- J. Mikes, M. Siglova, A. Cejkova, J. Masak and V. Jirku, Water Sci. Technol., 2005, 52, 151–156 CrossRef CAS.
- J. Briffa, E. Sinagra and R. Blundell, Heliyon, 2020, 6, e04691 CrossRef CAS.
- M. Liu, Q. Zhang, T. Maavara, S. Liu, X. Wang and P. A. Raymond, Nat. Geosci., 2021, 14, 672–677 CrossRef CAS.
- A. C. (Thanos) Bourtsalas and N. J. Themelis, Waste Manage., 2019, 85, 90–94 CrossRef CAS PubMed.
- D. D. Evanoff and G. Chumanov, ChemPhysChem, 2005, 6, 1221–1231 CrossRef CAS PubMed.
- N. Cao, J. Xu, H. Zhou, Y. Zhao, J. Xu, J. Li and S. Zhang, Microchem. J., 2020, 159, 105406 CrossRef CAS.
- M. Sabela, S. Balme, M. Bechelany, J. M. Janot and K. Bisetty, Adv. Eng. Mater., 2017, 19, 1–24 CrossRef CAS.
- G. Y. Lan, C. C. Huang and H. T. Chang, Chem. Commun., 2010, 46, 1257–1259 RSC.
- D. M. Riley, C. A. Newby and T. O. Leal-Almeraz, Risk Anal., 2006, 26, 1205–1221 CrossRef.
- B. Ladizinski, N. Mistry and R. V. Kundu, Dermatol. Clin., 2011, 29, 111–123 CrossRef CAS.
- T. Y. K. Chan, Clin. Toxicol., 2011, 49, 886–891 CrossRef CAS.
- A. Podgórska, A. Puścion-Jakubik, A. Grodzka, S. K. Naliwajko, R. Markiewicz-żukowska and K. Socha, Molecules, 2021, 26(13), 4088 Search PubMed.
- H. H. Abbas, M. Sakakibara, K. Sera, Nurgahayu and E. Andayanie, Cosmetics, 2020, 7, 58 CrossRef CAS.
- J. Chen, Y. Ye, M. Ran, Q. Li, Z. Ruan and N. Jin, Front. Pharmacol, 2020, 11, 1–10 CrossRef.
- M. Cotte, J. Susini, N. Metrich, A. Moscato, C. Gratziu, A. Bertagnini and M. Pagano, Anal. Chem., 2006, 78, 7484–7492 CrossRef CAS PubMed.
- A. Leyva-Pérez and A. Corma, Angew. Chem., Int. Ed., 2012, 51, 614–635 CrossRef.
- J. Barluenga and R. Rodes, J. Chem. Soc., Perkin Trans. 1, 1980, 1, 2732–2737 RSC.
- J. Barluenga, J. Perez-Prieto and D. Valencia, Tetrahedron, 1990, 46, 2453–2460 CrossRef CAS.
- T. E. Müller, K. C. Hultzsch, M. Yus, F. Foubelo and M. Tada, Chem. Rev., 2008, 108, 3795–3892 CrossRef.
- S. Mandal, R. D. Chaudhari and G. Biswas, Beilstein J. Org. Chem., 2021, 17, 2348–2376 CrossRef CAS.
- R. A. Periana, D. J. Taube, E. R. Evitt, D. G. Löffler, P. R. Wentrcek, G. Voss and T. Masuda, Science, 1993, 259, 340–343 CrossRef CAS.
- X. Gang, H. Birch, Y. Zhu, H. A. Hjuler and N. J. Bjerrum, J. Catal., 2000, 196, 287–292 CrossRef CAS.
- W. T. Foreman, S. D. Zaugg, L. M. Falres, M. G. Werner, T. J. Lelker and P. F. Rogerson, Environ. Sci. Technol., 1992, 26, 1307–1312 CrossRef CAS.
- S. N. Hashim, S. Z. Ghazali, N. J. Sidik, T. Chia-Chay and A. Saleh, E3S Web of Conferences, 2021, vol. 306, pp. 1–8 Search PubMed.
- A. Alam, S. Ferdosh, K. Ghafoor, A. Hakim, A. S. Juraimi, A. Khatib and Z. I. Sarker, Asian Pac. J. Trop. Med., 2016, 9, 402–409 CrossRef CAS.
- D. L. García Lozano, M. L. Ocampo Guerrero and N. Mesa López, Rev. Colomb. Biotecnol., 2015, 17, 76–84 CrossRef.
- L. A. Weed and E. E. Ecker, J. Infect. Dis., 1931, 51, 309–314 CrossRef.
- M. Tilahun, D. Mulugeta and S. Manju, Afr. J. Biotechnol., 2013, 12, 6282–6286 CrossRef.
- M. Paul Das, L. Jeyanthi Rebecca, S. Sharmila and S. Chatterjee, J. Chem. Pharm. Res., 2012, 4, 4975–4978 Search PubMed.
- G. W. C. Konrad Lorincz, B.-rong Chen, S. P. Atanu Roy Chowdhury, P. Bonato and M. Welsh, SenSys' 09: Proceedings of the 7th ACM Conference on Embedded Networked Sensor Systems., 2009, pp. 183–196 Search PubMed.
- F. Askari, A. Rahdar, M. Dashti and J. F. Trant, J. Fluoresc., 2020, 30, 1181–1187 CrossRef CAS PubMed.
- H. Agarwalla, R. N. Senapati and T. B. Das, J. Environ. Sci., 2021, 100, 28–33 CrossRef CAS PubMed.
- V. K. Rai, N. S. Raman and S. K. Choudhary, Ind. J. Pure App. Biosci., 2013, 1, 31–37 Search PubMed.
- M. M. Veiga, G. Angeloci-Santos and J. A. Meech, Extr. Ind. Soc., 2014, 1, 351–361 Search PubMed.
- M. M. Veiga and J. A. Meech, Ambio, 1995, 24, 371–375 Search PubMed.
- M. M. Veiga, P. A. Maxson and L. D. Hylander, J. Clean. Prod., 2006, 14, 436–447 CrossRef.
- A. J. Gunson and M. M. Veiga, Environ. Pract., 2004, 6, 109–120 CrossRef.
- G. N. George, S. P. Singh, J. Hoover and I. J. Pickering, Chem. Res. Toxicol., 2009, 22, 1761–1764 Search PubMed.
- L. Moscou and S. Lub, Powder Technol., 1981, 29, 45–52 Search PubMed.
- F. B. Teixeira, A. C. A. De Oliveira, L. K. R. Leão, E. H. C. De Oliveira, M. E. Crespo-lopez and C. S. F. Maia, Front. Mol. Neurosci., 2018, 11, 1–11 CrossRef.
- K. V. Katok, R. L. D. Whitby, T. Fukuda, T. Maekawa, I. Bezverkhyy, S. V. Mikhalovsky and A. B. Cundy, Angew. Chem., Int. Ed., 2012, 51, 2632–2635 CrossRef CAS.
- W. Ren, C. Zhu and E. Wang, Nanoscale, 2012, 4, 5902–5909 RSC.
- L. Sun, A. Zhang, S. Su, H. Wang, J. Liu and J. Xiang, Chem. Phys. Lett., 2011, 517, 227–233 CrossRef CAS.
- T. Morris, H. Copeland, E. McLinden, S. Wilson and G. Szulczewski, Langmuir, 2002, 18, 7261–7264 CrossRef CAS.
- I. de la Calle, I. Lavilla, H. Bartolomé-Alonso and C. Bendicho, Spectrochim. Acta, Part B, 2019, 161, 105697 CrossRef CAS.
- Q. Zhang, C. Chen, G. Wan, M. Lei, M. Chi, S. Wang and D. Min, Microchim. Acta, 2019, 186, 727 CrossRef CAS.
- M. Wdowin, M. M. Wiatros-Motyka, R. Panek, L. A. Stevens, W. Franus and C. E. Snape, Fuel, 2014, 128, 451–457 CrossRef CAS.
- J. G. Yu, B. Y. Yue, X. W. Wu, Q. Liu, F. P. Jiao, X. Y. Jiang and X. Q. Chen, Environ. Sci. Pollut. Res., 2016, 23, 5056–5076 CrossRef CAS PubMed.
- L. Wang, H. Xu, Y. Qiu, X. Liu, W. Huang, N. Yan and Z. Qu, J. Hazard. Mater., 2020, 389, 121824 CrossRef CAS.
- B. Valeur and I. Leray, Coord. Chem. Rev., 2000, 205, 3–40 CrossRef CAS.
- L. Prodi, F. Bolletta, M. Montalti and N. Zaccheroni, Coord. Chem. Rev., 2000, 205, 59–83 CrossRef CAS.
- N. Bhardwaj, S. K. Bhardwaj, M. K. Nayak, J. Mehta, K. H. Kim and A. Deep, TrAC, Trends Anal. Chem., 2017, 97, 120–135 CrossRef CAS.
- C. D. G. J. R. Lakowicz, Topics in Fluorescence Spectroscopy, 1991, vol. 4 Search PubMed.
- W. Zhou, R. Saran and J. Liu, Chem. Rev., 2017, 117, 8272–8325 CrossRef CAS PubMed.
- L. Deng, Z. Zhou, J. Li, T. Li and S. Dong, Chem. Commun., 2011, 47, 11065–11067 RSC.
- D. L. Ma, D. S. H. Chan, B. Y. W. Man and C. H. Leung, Chem.–Asian J., 2011, 6, 986–1003 CrossRef CAS.
- J. Wang, C. Du, P. Yu, Q. Zhang, H. Li and C. Sun, Sens. Actuators, B, 2021, 348, 130707 CrossRef CAS.
- L. W. Tang, Y. Alias, R. Zakaria and P. Meng, Crit. Rev. Anal. Chem., 2021, 53, 869–886 CrossRef PubMed.
- J. R. Wisniewski and F. Z. Gaugaz, Anal. Chem., 2015, 87, 4110–4116 CrossRef CAS.
- P. Bian, L. Xing, Z. Liu and Z. Ma, Sens. Actuators, B, 2014, 203, 252–257 Search PubMed.
- G. Wang, G. Xu, Y. Zhu and X. Zhang, Chem. Commun., 2014, 50, 747–750 RSC.
- Y. Miyake, H. Togashi, M. Tashiro, H. Yamaguchi, S. Oda, M. Kudo, Y. Tanaka, Y. Kondo, R. Sawa, T. Fujimoto, T. Machinami and A. Ono, J. Am. Chem. Soc., 2006, 128, 2172–2173 CrossRef CAS PubMed.
- R. C. Pawar, D. H. Choi, J. S. Lee and C. S. Lee, Mater. Chem. Phys., 2015, 151, 167–180 CrossRef CAS.
- Y. Tanaka, S. Oda, H. Yamaguchi, Y. Kondo, C. Kojima and A. Ono, J. Am. Chem. Soc., 2007, 129, 244–245 CrossRef CAS.
- J. B. Xiao, X. Q. Chen, X. Y. Jiang, M. Hilczer and M. Tachiya, J. Fluoresc., 2008, 18, 671–678 CrossRef CAS PubMed.
- X. Zhuang, T. Ha, H. D. Kim, T. Centner, S. Labeit and S. Chu, Proc. Natl. Acad. Sci. U. S. A., 2000, 97, 14241–14244 CrossRef CAS PubMed.
- R. Katoh, S. Sinha, S. Murata and M. Tachiya, J. Photochem. Photobiol., A, 2001, 145, 23–34 CrossRef CAS.
- R. Liu, S. Duan, L. Bao, Z. Wu, J. Zhou and R. Yu, Anal. Chim. Acta, 2020, 1114, 50–57 CrossRef CAS.
- M. Ghosh, S. Nath, A. Hajra and S. Sinha, J. Lumin., 2013, 141, 87–92 CrossRef CAS.
- S. Hamann, J. F. Kiilgaard, T. Litman, F. J. Alvarez-Leefmans, B. R. Winther and T. Zeuthen, J. Fluoresc., 2002, 12, 139–145 CrossRef CAS.
- Y. Liu, W. Zhu, D. Ni, Z. Zhou, J. H. Gu, W. Zhang, H. Sun and F. Liu, J. Nanobiotechnol., 2020, 18, 1–14 CrossRef CAS PubMed.
- S. P. Bayen, M. K. Mondal, S. Naaz, S. K. Mondal and P. Chowdhury, J. Environ. Chem. Eng., 2016, 4, 1110–1116 CrossRef CAS.
- S. Naaz and P. Chowdhury, Sens. Actuators, B, 2017, 241, 840–848 CrossRef CAS.
- J. Peng, J. Ling, X. Q. Zhang, H. P. Bai, L. Zheng, Q. E. Cao and Z. T. Ding, Spectrochim. Acta, Part A, 2015, 137, 1250–1257 CrossRef CAS PubMed.
- D. Lu, Z. Chen, Y. Li, J. Yang, S. Shuang and C. Dong, Anal. Lett., 2015, 48, 281–290 CrossRef CAS.
- A. Mao and C. Wei, Microchim. Acta, 2019, 186, 541 CrossRef PubMed.
- S. Roy, A. Baral and A. Banerjee, ACS Applied Materials and Interface, 2014, 6, 4050–4056 CrossRef CAS.
- A. Baksi, M. S. Bootharaju, X. Chen, H. Häkkinen and T. Pradeep, J. Phys. Chem. C, 2014, 118, 21722–21729 CrossRef CAS.
- C. Guo and J. Irudayaraj, Anal. Chem., 2011, 83, 2883–2889 CrossRef CAS.
- J. Liu, X. Ren, X. Meng, Z. Fang and F. Tang, Nanoscale, 2013, 5, 10022–10028 RSC.
- S. Hu, B. Ye, X. Yi, Z. Cao, D. Wu, C. Shen and J. Wang, Talanta, 2016, 155, 272–277 CrossRef CAS PubMed.
- G. Yang, H. Zhang, Y. Wang, X. Liu, Z. Luo and J. Yao, Sens. Actuators, B, 2017, 251, 773–780 CrossRef CAS.
- R. Z. Wang, D. L. Zhou, H. Huang, M. Zhang, J. J. Feng and A. J. Wang, Microchim. Acta, 2013, 180, 1287–1293 CrossRef CAS.
- J. L. MacLean, K. Morishita and J. Liu, Biosens. Bioelectron., 2013, 48, 82–86 CrossRef CAS.
- J. B. King, M. R. Haneline, M. Tsunoda and F. P. Gabbai, J. Am. Chem. Soc., 2002, 124, 9350–9351 CrossRef CAS PubMed.
- T. Lasanta, J. M. Lõpez-De-Luzuriaga, M. Monge, M. E. Olmos and D. Pascual, Chem.—Eur. J., 2013, 19, 4754–4766 CrossRef CAS.
- S. Raju, H. B. Singh and R. J. Butcher, Dalton Trans., 2020, 49, 9099–9117 RSC.
- B. Roy, P. Bairi and A. K. Nandi, Analyst, 2011, 136, 3605–3607 RSC.
- M. Ganguly, C. Mondal, J. Jana, A. Pal and T. Pal, Langmuir, 2014, 30, 4120–4128 CrossRef CAS PubMed.
- S. Kraithong, N. Chailek, J. Sirirak, K. Suwatpipat, N. Wanichacheva and P. Swanglap, J. Photochem. Photobiol., A, 2021, 407, 113064 CrossRef CAS.
- L. Deng, X. Ouyang, J. Jin, C. Ma, Y. Jiang, J. Zheng, J. Li, Y. Li, W. Tan and R. Yang, Anal. Chem., 2013, 85, 8594–8600 CrossRef CAS PubMed.
- K. Farhadi, M. Forough, R. Molaei, S. Hajizadeh and A. Rafipour, Sens. Actuators, B, 2012, 161, 880–885 CrossRef CAS.
- F. Zarlaida and M. Adlim, Microchim. Acta, 2017, 184, 45–58 CrossRef CAS.
- N. C. Pomal, K. D. Bhatt, K. M. Modi, A. L. Desai, N. P. Patel, A. Kongor and V. Kolivoška, J. Fluoresc., 2021, 31, 635–649 CrossRef CAS PubMed.
- C. Caro, P. M. Castillo, R. Klippstein, D. Pozo and A. P. Zaderenko, Silver Nanopart., 2010, 201–225 CAS.
- F. M. Lutfi, M. Juwita, P. R. Ibrahim, E. D. Rakhmawaty and R. Iman, Res. J. Chem. Environ., 2018, 22, 1–3 Search PubMed.
- D. Demirezen Yılmaz, D. Aksu Demirezen and H. Mıhçıokur, Surf. Interfaces, 2021, 22, 100840 CrossRef.
- M. Ismail, M. I. Khan, K. Akhtar, J. Seo, M. A. Khan, A. M. Asiri and S. B. Khan, J. Mater. Sci.: Mater. Electron., 2019, 30, 7367–7383 CrossRef CAS.
- H. X. F. Ahemed and H. Kabir, Front. Chem., 2020, 8, 1–15 CrossRef.
- E. Alzahrani, J. Anal. Methods Chem., 2020, 2020, 1–14 CrossRef.
- L. Rastogi, R. B. Sashidhar, D. Karunasagar and J. Arunachalam, Talanta, 2014, 118, 111–117 CrossRef CAS PubMed.
- P. Prema, V. Veeramanikandan, K. Rameshkumar, M. K. Gatasheh, A. A. Hatamleh, R. Balasubramani and P. Balaji, Environ. Res., 2022, 204, 111915 CrossRef CAS.
- G. M. Sangaonkar, M. P. Desai, T. D. Dongale and K. D. Pawar, Sci. Rep., 2020, 10, 1–12 CrossRef.
- S. Bhagat, H. Shaikh, A. Nafady, Sirajuddin, S. T. H. Sherazi, M. I. Bhanger, M. R. Shah, M. I. Abro, R. Memon and R. Bhagat, J. Cluster Sci., 2022, 33, 1865–1875 CrossRef CAS.
- I. Uddin, K. Ahmad, A. A. Khan and M. A. Kazmi, Sens. Biosensing Res., 2017, 16, 62–67 CrossRef.
- L. Rastogi, R. B. Sashidhar, D. Karunasagar and J. Arunachalam, Talanta, 2014, 118, 111–117 CrossRef CAS PubMed.
- A. Tirado-Guizar, G. Rodriguez-Gattorno, F. Paraguay-Delgado, G. Oskam and G. E. Pina-Luis, MRS Commun., 2017, 7, 695–700 CrossRef CAS.
- S. G. R. A. Thakur, Iran. J. Mater. Sci. Eng., 2020, 17, 80–89 Search PubMed.
- V. Anbazhagan, K. B. A. Ahmed and S. Janani, Sens. Actuators, B, 2014, 200, 92–100 CrossRef CAS.
- L. Zhan, T. Yang, S. J. Zhen and C. Z. Huang, Microchim. Acta, 2017, 184, 3171–3178 CrossRef CAS.
- Z. Sun, N. Zhang, Y. Si, S. Li, J. Wen, X. Zhu and H. Wang, Chem. Commun., 2014, 50, 9196–9199 RSC.
- B. Janani, A. Syed, A. M. Thomas, A. H. Bahkali, A. M. Elgorban, L. L. Raju and S. S. Khan, Optik, 2020, 204, 164160 CrossRef CAS.
- Y. Wang, F. Yang and X. Yang, ACS Applied Materials and Interface, 2010, 2, 339–342 CrossRef CAS.
- S. Balasurya, A. Syed, A. M. Thomas, N. Marraiki, A. M. Elgorban, L. L. Raju, A. Das and S. S. Khan, Spectrochim. Acta, Part A, 2020, 228, 117712 CrossRef CAS PubMed.
- J. Huang, X. Mo, H. Fu, Y. Sun, Q. Gao, X. Chen, J. Zou, Y. Yuan, J. Nie and Y. Zhang, Sens. Actuators, B, 2021, 344, 130218 CrossRef CAS.
- P. Prosposito, L. Burratti and I. Venditti, Chemosensors, 2020, 8, 1–29 CrossRef.
- S. K. Laliwala, V. N. Mehta, J. V. Rohit and S. K. Kailasa, Sens. Actuators, B, 2014, 197, 254–263 CrossRef CAS.
- V. Vinod Kumar, S. Anbarasan, L. R. Christena, N. Saisubramanian and S. Philip Anthony, Spectrochim. Acta, Part A, 2014, 129, 35–42 CrossRef CAS PubMed.
- W. Xiao, Z. Deng, J. Huang, Z. Huang, M. Zhuang, Y. Yuan, J. Nie and Y. Zhang, Anal. Chem., 2019, 91, 15114–15122 CrossRef CAS.
- Y. Z. K. Yuan, Y. Sun, F. Liang, F. Pan, M. Hu, F. Hua, Y. Yuan and J. Nie, RSC Adv., 2022, 12, 23379 RSC.
- I. Schiesaro, L. Burratti, C. Meneghini, I. Fratoddi, P. Prosposito, J. Lim, C. Scheu, I. Venditti, G. Iucci and C. Battocchio, J. Phys. Chem. C, 2020, 124, 25975–25983 CrossRef CAS.
- M. J. Hostetler, C. J. Zhong, B. K. H. Yen, J. Anderegg, S. M. Gross, N. D. Evans, M. Porter and R. W. Murray, J. Am. Chem. Soc., 1998, 120, 9396–9397 CrossRef CAS.
- R. Ferrando, J. Jellinek and R. L. Johnston, Chem. Rev., 2008, 108, 845–910 CrossRef CAS.
- D. Wang, R. Cai, S. Sharma, J. Jirak, S. K. Thummanapelli, N. G. Akhmedov, H. Zhang, X. Liu, J. L. Petersen and X. Shi, J. Am. Chem. Soc., 2012, 134, 9012–9019 CrossRef CAS PubMed.
- J. Sun and Y. J. Haoxi Wua, Nanoscale, 2014, 6, 5449–5457 RSC.
- R. Gui, Y. Wang and J. Sun, Microchim. Acta, 2014, 181, 1231–1238 CrossRef CAS.
- Y. Liu, Z. Xu, S. Zhu, A. Fakhri and V. Kumar Gupta, J. Photochem. Photobiol., A, 2022, 422, 113522 CAS.
- M. Ganguly, C. Mondal, J. Pal, A. Pal, Y. Negishi and T. Pal, Dalton Trans., 2014, 43, 11557–11565 RSC.
- M. Ganguly, J. Pal, S. Das, C. Mondal, A. Pal, Y. Negishi and T. Pal, Langmuir, 2013, 29, 10945–10958 CAS.
- N. Zhang, Y. Si, Z. Sun, L. Chen, R. Li, Y. Qiao and H. Wang, Anal. Chem., 2014, 86, 11714–11721 CrossRef CAS PubMed.
- A. Mathaweesansurn, N. Vittayakorn and E. Detsri, Molecules, 2020, 25, 4443 CrossRef CAS PubMed.
- H. Tao, Y. Lin, J. Yan and J. Di, Electrochem. Commun., 2014, 40, 75–79 CrossRef CAS.
| This journal is © The Royal Society of Chemistry 2024 |