DOI:
10.1039/D4RA04075A
(Paper)
RSC Adv., 2024,
14, 22312-22325
Comparative study on efficiency of surface enhanced coal fly ash and raw coal fly ash for the removal of hazardous dyes in wastewater: optimization through response surface methodology†
Received
3rd June 2024
, Accepted 9th July 2024
First published on 15th July 2024
Abstract
Crystal violet (CV) dye, because of its non-biodegradability and harmful effects, poses a significant challenge for wastewater treatment. This study addresses the efficiency of easily accessible coal fly ash (CFA)-based adsorbents such as raw coal fly ash (RCFA) and surface enhanced coal fly ash (SECFA), in removing CV dye from waste effluents. Various analytical techniques such as FTIR, XRD, SEM, TEM, BET, zeta sizer and zeta potential were employed for the characterization of the adsorbents and dye-loaded samples. BET revealed that RCFA possesses a surface area of 19.370 m2 g−1 and SECFA of 27.391 m2 g−1, exhibiting pore volumes of 0.1365 cm3 g−1 and 0.1919 cm3 g−1 respectively. Zeta-sizer and potential analysis showed the static charges of RCFA as −27.3 mV and SECFA as −28.2 mV, with average particle sizes of 346.6 and 315.3 nm, respectively. Langmuir and Freundlich adsorption isotherms were also employed for adsorption studies. Employing central composite design (CCD) of response surface methodology (RSM), the maximum CV removal was 81.52% for RCFA and 97.52% for SECFA, providing one minute contact time, 0.0125 g adsorbent dose and 10 ppm dye concentration. From the thermodynamic studies, all the negative values of ΔG° showed that all the adsorption processes of both adsorbents were spontaneous in nature.
1 Introduction
The expansion of industries creates environmental pollution in every aspect of life. Particularly, dye-contaminated wastewater when directly drained into freshwater reservoirs reduces the transmission of sunlight and disrupts the photosynthesis process underwater thereby damaging the aquatic ecosystem.1–3 Many dyes are toxic, and carcinogenic and cannot be easily degraded because of their complex aromatic structure.4 Around 700![[thin space (1/6-em)]](https://www.rsc.org/images/entities/char_2009.gif) 000 metric tons of commercial dyes of a hundred-thousand types are produced around the globe per year and 1–1.5% of these dyes are discharged directly into wastewater.5,6 In Europe and the United States, around 1 million kilograms of dyes are directly drained into oceans every year,7 and in Pakistan textile and leather industries are the biggest producers of dye-contaminated wastewater.8 It is because these dyes are the primary materials in the textile, paint, paper, food, and tannery industries.9
000 metric tons of commercial dyes of a hundred-thousand types are produced around the globe per year and 1–1.5% of these dyes are discharged directly into wastewater.5,6 In Europe and the United States, around 1 million kilograms of dyes are directly drained into oceans every year,7 and in Pakistan textile and leather industries are the biggest producers of dye-contaminated wastewater.8 It is because these dyes are the primary materials in the textile, paint, paper, food, and tannery industries.9
Anionic, cationic and nonionic are all categories of dyes but the most hazardous are cationic dyes because they are difficult to degrade and can pass through the entire food chain.10 Crystal violet (CV) dye is also a cationic dye that persists in the environment for a long period and poses toxic effects.11,12 There are several methods to remove dyes from wastewater which include photocatalysis,13 coagulation,14 membrane separation,15,16 electrochemical treatment,17 ion-exchange,18 biodegradation,19 and UV–H2O2 degradation.20 However, the techniques have several limitations including high costs, low efficiency, and less applicability at vast levels. Instead of these techniques, adsorption methods can be applicable on a large scale with minimum cost and at low adsorbent ratios.21,22 Adsorption is a promising and widely used technique for the removal of coloured substances from wastewater. As it is environment friendly, efficient, simple, and cost-effective technique.23,24 There are various adsorbents available like zeolites,25 commercial activated carbon,26 multiwall carbon nanotube,27 and graphene oxide,28 but they all are not cost-effective and are difficult to prepare. To overcome this problem, the waste products of industries like CFA can be used as adsorbents.
In various studies, chemically modified CFA has been used to remove a variety of dyes from wastewater. For example, Banerjee and coworkers conducted a study to remove methylene blue dye up to 90% by using chemically modified CFA. The CFA was modified by mixing it with 1 M HCl solution in 1![[thin space (1/6-em)]](https://www.rsc.org/images/entities/char_2009.gif) :
:![[thin space (1/6-em)]](https://www.rsc.org/images/entities/char_2009.gif) 2 (w/v) and heating the mixture for 24 h at 105 °C followed by neutralizing the mixture by washing it with double distilled water and then drying it overnight in an oven at 105 °C.29 In a study by Dahlan and colleagues, the modification was achieved by mixing the rice husk ash-coal fly ash in 1
2 (w/v) and heating the mixture for 24 h at 105 °C followed by neutralizing the mixture by washing it with double distilled water and then drying it overnight in an oven at 105 °C.29 In a study by Dahlan and colleagues, the modification was achieved by mixing the rice husk ash-coal fly ash in 1![[thin space (1/6-em)]](https://www.rsc.org/images/entities/char_2009.gif) :
:![[thin space (1/6-em)]](https://www.rsc.org/images/entities/char_2009.gif) 1 with 1 M NaOH/Na2CO3 and stirring the mixture for 2 hours at 80 °C then neutralizing it with deionized water and drying it overnight in an oven at 110 °C led to the formation of the adsorbent that showed 45.1% efficiency against acid violet 7 dye.30 In another study by Balji and colleagues, the CFA was prepared simply by neutralizing the fine powder of CFA and placing it in an oven at 110 °C for 3 h, this was used to remove malachite green and methyl violet dye and it showed 96% efficiency for methyl violet.31 Eteba and colleagues prepared CFA by stirring it with 30% (w/w) HCl for 12 hours at 90 °C, neutralizing this mixture with distilled water and dried at 120 °C for 24 hours. By using this adsorbent, the direct blue 78 dye was removed with an efficiency of 99.7%.32
1 with 1 M NaOH/Na2CO3 and stirring the mixture for 2 hours at 80 °C then neutralizing it with deionized water and drying it overnight in an oven at 110 °C led to the formation of the adsorbent that showed 45.1% efficiency against acid violet 7 dye.30 In another study by Balji and colleagues, the CFA was prepared simply by neutralizing the fine powder of CFA and placing it in an oven at 110 °C for 3 h, this was used to remove malachite green and methyl violet dye and it showed 96% efficiency for methyl violet.31 Eteba and colleagues prepared CFA by stirring it with 30% (w/w) HCl for 12 hours at 90 °C, neutralizing this mixture with distilled water and dried at 120 °C for 24 hours. By using this adsorbent, the direct blue 78 dye was removed with an efficiency of 99.7%.32
The major objective of this study is to develop a cost-effective method for adsorbing harmful dyes from wastewater using coal fly ash (CFA), a waste product from brick kilns. This approach addresses managing the waste materials of two industries simultaneously. For this purpose, the waste of the brick kiln industry (CFA) is utilized to treat the dye-polluted wastewater of the textile industry. The central composite design (CCD) model within the framework of response surface methodology (RSM) has been employed to determine the optimized conditions for the adsorption of CV dye onto RCFA and SECFA. This approach allows for a systematic exploration of the influence of key variables such as dye concentration, contact time, and adsorbent dose on the adsorption efficiency. The Characterization of RCFA and SECFA has been done, using FTIR, XRD, SEM, TEM, BET, zeta potential and zeta sizer analysis.
2 Materials and methods
2.1. Chemicals and reagents
The CFA was collected from the waste material of different brick kilns in the Faisalabad district Pakistan. CV, eriochrome black T (EBT), methyl orange (MO) and safranin dyes and sodium hydroxide (NaOH) were purchased from Sigma-Aldrich while hydrochloric acid (HCl) was purchased from the Chemico (CMC) group, and distilled water was used as a solvent. Analytical-grade chemicals were used throughout the experimental studies.
2.2. Preparation of raw coal fly ash (RCFA)
All the collected samples of CFA from the different brick kilns were mixed well to obtain homogeneity as the composition may vary with respect to the area and the fuel used in the brick kilns. 10 Grams of the mixed sample of CFAs were ground in the pestle and mortar and was passed through a sieve of mesh size 100 to obtain size homogeneity. The sieved CFA was then transferred to a beaker containing 300 mL of distilled water and stirred at 500 rpm for an hour at room temperature to thoroughly dissolve the water-soluble components in the water. Then it was filtered using Whatman's No. 4 filter paper to remove the water-soluble components from the CFA. The retentate (CFA) was then dried overnight in a hot air oven at 60 °C to obtain the raw coal fly ash (RCFA) to be used for further experiments.33
2.3. Preparation of surface enhanced coal fly ash (SECFA)
The SECFA was prepared by following the method proposed by Hussain and coworkers with little modifications. For this purpose, 10 grams of as-prepared CFA was transferred to a beaker containing 267 mL of distilled water and 13.33 mL of 5% HCl solution.33 The mixture was stirred for an hour at 100 °C at 500 rpm. The mixture was then allowed to cool down. Afterwards, 267 mL of distilled water and 267 mL of 4 molar NaOH were added to the mixture at room temperature and further stirring for an hour led to the formation of a slurry-like mixture. The mixture was allowed to stand until the particles settled down. The upper layer was decanted and the obtained viscous slurry was filtered by using Whatman's No. 4 filter paper. Then the slurry was washed three times with distilled water for neutralization and dried at 230 °C for 20 hours to get a fine powder of SECFA.33
2.4. Stock solutions of dye
Industrial wastewater was not directly used in our study as it may have a variety of contaminants with variable concentrations. For the preliminary dye-selection protocol, the adsorption capacities of both RCFA and SECFA were compared with several dyes, such as EBT, safranin, MO and CV. By looking at the percentage adsorptions, it was concluded that CV was the appropriate dye for further analysis. Thus, this study is specifically conducted on CV dye, so that the presence of other contaminants may not interfere with our results. All the solutions in our study were prepared in distilled water. A 1000 ppm stock solution of CV dye was prepared by adding 1 gram of the dye and making the solution up to 1000 mL with distilled water. A further 20 dilutions in series between 10 and 200 ppm (with a difference of 10 ppm) were prepared from the stock solution using the dilution formula (C1V1 = C2V2), where C1, C2 & V1, V2 represent the concentrations and volumes of the prepared stock solution and required dye solutions, respectively.
2.5. Batch mode adsorption studies
The experiments were carried out employing batch mode adsorption on dye solutions prepared in distilled water. RCFA was prepared simply after removing the water-soluble components, while SECFA was prepared by treating the RCFA chemically to enhance the adsorption capacity. Various doses of both RCFA and SECFA (0.0125, 0.025, and 0.05 grams per 10 mL of dye solutions) were applied, with contact times of 1, 5, and 10 minutes, and stirring at 700 rpm at room temperature. Furthermore, all the solutions were filtered to separate the dye-loaded coal fly ash particles to avoid their interference during UV measurements of the filtrate. The adsorption experiments were conducted with varying initial dye concentrations ranging between 10 and 200 ppm with a difference of 10 ppm. The dye removal percentage of adsorbents was calculated by measuring the dye concentration before and after the adsorption process by setting the spectrophotometer at calculated λmax of 580 nm. The detailed scheme of the adsorption process is mentioned in the ESI file Scheme S1.†
The percentage removal efficiency and adsorption extent of each sample at the specific conditions were calculated by the given formulas (1) and (2) respectively.34
| |
 | (1) |
| |
 | (2) |
where
C0 and
C1 represent the concentration of dye before and after adsorption, respectively, while
V and
m represent the volume of solution and mass of adsorbent, respectively.
2.6. Statistical model of CV adsorption
The response surface methodology (RSM) is a powerful technique based on statistical and mathematical algorithms to represent the effects of multiple factors and their mutual responses simultaneously. In this experiment, RSM was used to evaluate the effects of all three independent variables, such as the concentration of CV dye (X1), the dosage of fly ash (RCFA and SECFA) (X2), and the contact time (X3). All these were coded levels, low and high (−1, 0 and +1), as mentioned in Table 1. The experimental design was based on the CCD model using the Design-Expert software 13.0. For this purpose, 180 readings (UV-visible) of each sample were taken and further, one more repetition was done for both RCFA and SECFA. This study involved taking a total of 720 readings, where 360 readings each for RCFA and SECFA including one repetition. Three levels were defined for time and adsorbent dose, while twenty levels were defined for dye concentration. The summarized response tables are given in the ESI Tables S1 and S2.† The percentage removal of dye from the solution can be calculated by eqn (1).| |
 | (3) |
In eqn (3), Y is the dependent (response) variable, while βij, βii, βi, and β0 are all interaction, quadratic, linear, and intercept coefficients respectively, while k is the parameter count, xi is the explanatory variable (independent) and ∈ shows the error in the model. By putting the values of the coefficients, eqn (4) and (5) are written for the RCFA and SECFA, respectively.| | |
Y = (45.6531) + (−45.7895)X1 + (24.0506)X2 + (3.5188)X3 + (14.2748)(X1)2 +(−4.6962)(X2)2 + (−0.8592)(X3)2 + (−0.3708)X1X2 +(−1.0474)X1X3 + (0.6621)X2X3
| (4) |
| | |
Y = (99.2790) + (−6.4059)X1 + (6.3084)X2 + (0.7434)X3 + (−1.9104)(X1)2 + (−5.8969)(X2)2 + (−0.4674)(X3)2 + (6.1175)X1X2 + (0.2990)X1X3 + (−0.7431)X2X3
| (5) |
where X1 (dye concentration) X2 (adsorbent dosage) and X3 (contact time) represent the independent variables while Y shows the percentage of dye removal.
Table 1 Independent variables for RSM–CCD model
| Factors name |
Symbols |
Units |
Minimum |
Maximum |
Levels |
| Coded low |
Coded high |
| Concentration |
X1 |
ppm |
10 |
200 |
−1 ↔ 10 |
+1 ↔ 200 |
| RCFA/SECFA dosage |
X2 |
grams |
0.0125 |
0.050 |
−1 ↔ 0.01 |
+1 ↔ 0.05 |
| Contact time |
X3 |
Minutes |
1 |
10 |
−1 ↔ 1 |
+1 ↔ 10 |
The analysis of variance (ANOVA) was also calculated with the Design-Expert. R2 values were acknowledged at a 95% confidence level to determine the model's fitness. The F-test and the coefficient of determination (R2) calculated from the ANOVA measurements, were used to determine the significance of regression and fitting quality respectively.
2.7. Characterization
The prepared RCFA and SECFA were characterized by using X-ray diffraction (XRD) with a Bruker SMART APEX II diffractometer, high Resolution transmission electron microscopy (HRTEM) was performed using a Tecnai G2 F20 (FEI, United States) operated at 200 kV and scanning electron microscopy (SEM) measurements with an Apreo 2 C LoVac Thermofisher instrument. The Brunauer–Emmett–Teller (BET) analysis has been performed using the Autosorb iQ station 2 instrument to determine the total surface area and total pore volume of coal fly ash. Zeta potential and sizer analysis were measured with the Malvern zeta sizer nano ZSP instrument to find out the static charge and size of particles respectively. The structural features of the adsorbents and the dye-loaded samples were studied using an Agilent Technologies Cary 630 FTIR instrument in the range of 650–4000 cm−1.
3 Results and discussions
3.1. FTIR analysis
Fourier Transform Infrared (FTIR) Spectroscopy is an important technique to study the vibrational changes brought about by the different functional groups. In this study, FTIR analysis was performed on the RCFA (a) and SECFA (c) samples to indicate the effects of acid–base treatment on RCFA, as well as on loaded RCFA (b) and loaded SECFA (d) samples to study the adsorption of the dye on the adsorbents as shown in Fig. 1. A clear peak at 1990–2000 cm−1 in all the samples corresponds to the combination or overtone bands of SiO2.35–37 Moreover, If the FTIR spectra of (a) and (b) are compared, a clear peak can be seen at 1160 cm−1. This corresponds to the stretching vibration of SO42− present in anhydrite (CaSO4),38,39 while this signal disappears in the FTIR spectra of (c) and (d) which show the removal of anhydrite after acid–base and heat treatment of RCFA. This fact is also supported by the XRD study where the disappearance of certain signals (2θ = 25.16°, 31.04°, 38.33°, 55.38°) showed the removal of anhydrite after the modification of RCFA. Moreover, if the vibrational spectra of dye-loaded samples (b) and (d) are compared to those of (a) and (b), some new peaks appeared in the formers, showing the adsorption of the crystal violet dye at the adsorbents. A peak appeared at 900 cm−1 assigned to the aromatic deformations of the C–H groups.40 A relatively broad peak at 1006 cm−1 referring to the C–H bending vibrations suggests the presence of C–H groups of the adsorbed CV at the adsorbents.41 A more clear indication of the adsorption of the dye comes from the appearance of the band at 1588 cm−1 which corresponds to the C![[double bond, length as m-dash]](https://www.rsc.org/images/entities/char_e001.gif) C stretching vibrations of the benzene ring of CV adsorbed on the adsorbent surface.42,43
C stretching vibrations of the benzene ring of CV adsorbed on the adsorbent surface.42,43
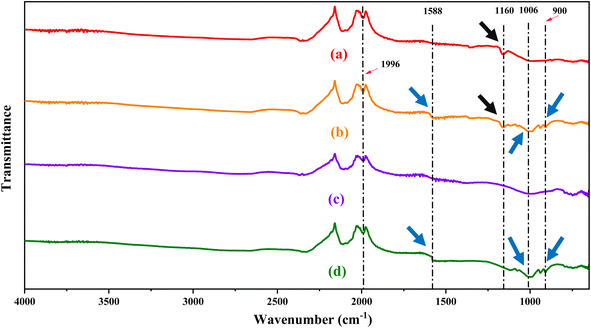 |
| | Fig. 1 FTIR Spectra of the adsorbents RCFA (a) and SECFA (c) and their respective dye-loaded samples RCFAL (b) and SECFAL (d). | |
3.2. BET analysis
The Brunauer–Emmett–Teller (BET) analysis outcomes are mentioned in Table 2. The Langmuir surface areas, which assume monolayer adsorption are 27.549 cm2 g−1 and 39.802 cm2 g−1 for RCFA and SECFA, respectively. When it comes to multilayer adsorption (BET surface area) RCFA and SECFA showed 19.370 cm2 g−1 and 27.391 cm2 g−1, respectively.33 The results suggested that the SECFA provides more surface area than RCFA, which means SECFA has more sites to accommodate the dye molecules. Furthermore, SECFA has a higher total pore volume (28.86%) than RCFA. The values for both are 0.1919 cm3 g−1 and 0.1365 cm3 g−1 respectively.44 The pore volume increases in SECFA due to the removal of components of coal fly ash during its preparation,45 Which has also been discussed in the X-ray diffraction section.
Table 2 Surface properties of RCFA and SECFA
| Adsorbents |
Langmuir surface area (m2 g−1) |
BET surface area (m2 g−1) |
Total pore volume (cm3 g−1) |
| RCFA |
27.549 |
19.370 |
0.1365 |
| SECFA |
39.802 |
27.391 |
0.1919 |
3.3. XRD analysis
The X-ray diffraction (XRD) analysis is used to measure the structural morphology, and crystallinity along with mineral phases of RCFA and SECFA. Fig. 2(a) shows the diffractogram of RCFA, which includes the mineral phases such as quartz (2θ = 20.56°, 36.27°, 45.80°, 49.87°, 60.00°, 63.76°, 67.46°, 68.04°, 75.26°, and 79.64°), anhydrite (2θ = 25.16°, 31.04°, 38.33°, 48.38°, 55.38°, and 62.13°), hematite-proto (2θ = 26.36°), tremolite (2θ = 40.55°) and dicalcium magnesium disilicate (2θ = 52.01°). Less intensity of these peaks showed less crystallinity of these minerals in RCFA. Fig. 2(b) representing the diffractogram of SECFA shows that the peaks of these mineral phases appeared with more intensity at the same 2θ value indicating high crystallinity of the phases like quartz, anhydrite/CaSO4 (48.38°), hematite-proto, tremolite and lipscombite. The high intensity of peaks in SECFA showed more crystallinity, which provides more surface area than RCFA as confirmed by BET analysis. Various characteristic peaks that appeared in the diffractogram of RCFA such as 25.16° (anhydrite/CaSO4), 31.04° (anhydrite/CaSO4), 38.33° (anhydrite/CaSO4), 52.0° (dicalcium magnesium disilicate, Ca2MgO7Si2), and 55.38° (anhydrite/CaSO4) disappeared in the diffractogram of SECFA. The disappearance of these peaks indicated the disappearance of several groups after the acidic and basic modification of RCFA to obtain SECFA.46 These disappeared peaks in SECFA are related to calcium salts, which means these components, were eliminated during acid–base treatment in SECFA, leading to increased pore and fringe formation, which shows the availability of more adsorption sites. So, the XRD analysis revealed that the main components in both the adsorbents which are responsible for the adsorption of the crystal violet dye are quartz, hematite-proto, and tremolite.
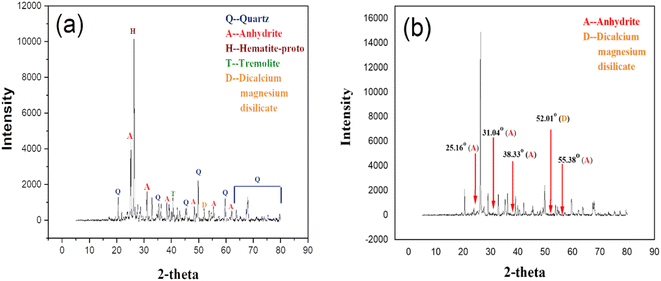 |
| | Fig. 2 X-ray diffractograms of RCFA (a) and SECFA (b). | |
3.4. SEM analysis
The SEM analysis was used to investigate the surface morphology of the RCFA, and SECFA along with their dye-loaded samples. Fig. 3(c) shows that SECFA has a more rough surface (fringes) as compared to RCFA Fig. 3(a) and it is correlated with TEM findings.23 This was brought about by the acid–base treatment, which was a factor that caused increased-adsorption of dye. The acid–base treatment also resulted in the elimination of components that increase the surface area Fig. 3(c) which is also explained by XRD analysis. In Fig. 3(b) and (d), the adsorbed dye can be seen accommodating by the surfaces of RCFA and SECFA respectively.47
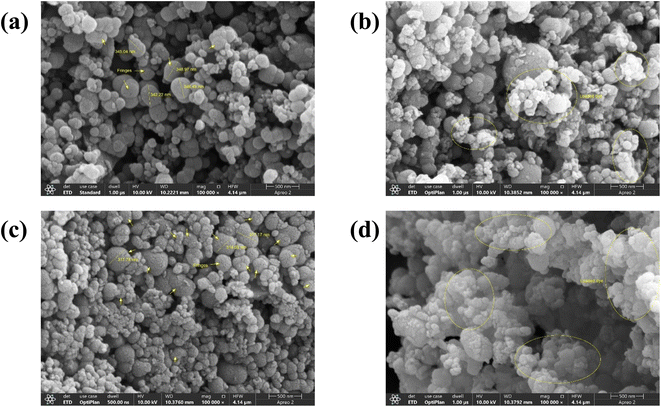 |
| | Fig. 3 SEM images of RCFA and SECFA where (a) and (c) represent unloaded samples while (b) and (d) represent dye-loaded samples respectively. | |
3.5. TEM analysis
TEM analysis was used to characterize the internal morphology, size and shape of both RCFA and SECFA particles. The TEM investigation showed that the sizes of the largest RCFA and SECFA particles are 321.2 nm and 240 nm respectively as in Fig. 4(a) and (b). According to zeta sizer analysis, the average sizes of RCFA and SECFA particles are 346.6 nm and 315.3 nm respectively as shown in the ESI Section S1.† The average size means some particles are bigger while some are of smaller size and then the average values were calculated. So, it is possible that the particle size revealed by TEM analysis may be of that portion where the smaller particles might be in bulk. It means TEM results regarding size might not be representative of the whole sample. Thus, their significance may be limited in assessing the overall size distribution as measured by the zeta sizer. Particles also overlap each other in TEM images of both RCFA and SECFA, which makes it difficult to find boundaries for the calculation of particle size. TEM analysis suggested that the particle shapes of both RCFA and SECFA are irregular spherical-oval as shown in Fig. 4(a) and (b). Fringes in SECFA are also evidence that some components were eliminated from it leading to the development of more pores as shown in Fig. 4(c),48 this is also coherent by XRD and BET analyses. TEM images of dye-loaded RCFA and SECFA are encircled and represented in the ESI Fig. S2.† These dye-loaded sites are very low in numbers, this is because dye molecules are very small in comparison with RCFA and SECFA particles. So, where they are accumulated in bulk, can be seen in TEM images.
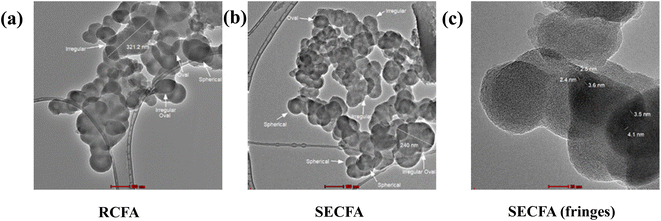 |
| | Fig. 4 TEM images of RCFA (a), SECFA (b) and fringes of SECFA (c). | |
3.6. Response surface methodology (RSM)
To determine the suitability of the model and to produce the ANOVA table, a series of sum-of-squares tests and lack-of-fit assessments were conducted for RCFA and SECFA, as depicted in Table 3. R2 values were acknowledged at a 95% confidence level to assess model fitness. Significant terms were identified for both models by analyzing the F values, which were 433.08 and 937.28 (first row). All the model terms of SECFA are significant as the p-values are less than 0.10, while the terms AB, AC, BC, and C2 are not significant as these are greater than 0.10. The R2 values were 0.9176 and 0.9602 for RCFA and SECFA, respectively, suggesting a reasonable fit for both models. For RCFA and SECFA, the predicted R2 values are 0.9119 and 0.9577, which are in reasonable agreement with the adjusted R2 values of 0.9155 and 0.9591, respectively. The difference between the predicted and adjusted R2 values is less than 0.20,49 indicating good model reliability. Adequate precision measures the signal-to-noise ratio, and a ratio greater than 4 is desirable. The values of adequate precision (84.028 and 125.248) indicate an adequate signal for RCFA and SECFA, respectively, as shown in ESI Table S3.† Data were statistically analyzed, and response surfaces were produced. Plots showing predicted vs. actual values were created for each model to evaluate the model's acceptability.50,51 As seen in Fig. 5, the actual and predicted values correspond closely, indicating that the model can be utilized to explore the selected design space.52
Table 3 Analysis of variance (ANOVA) for percentage CV removal through RCFA and SECFA
| |
Sum of squares |
Df |
Mean squares |
F-value |
p-Value |
|
| Source |
RCFA |
SECFA |
RCFA |
SECFA |
RCFA |
SECFA |
RCFA |
SECFA |
| Model |
4.278 × 10⁵ |
20![[thin space (1/6-em)]](https://www.rsc.org/images/entities/char_2009.gif) 946.13 946.13 |
9 |
47![[thin space (1/6-em)]](https://www.rsc.org/images/entities/char_2009.gif) 531.91 531.91 |
2327.35 |
433.08 |
937.28 |
<0.0001 |
<0.0001 |
Significant |
| A-dye concentration |
2.727 × 10⁵ |
5336.51 |
1 |
2.727 × 10⁵ |
5336.51 |
2484.28 |
2149.15 |
<0.0001 |
<0.0001 |
|
| B-RCFA dosage |
1.386 × 10⁵ |
9532.30 |
1 |
1.386 × 10⁵ |
9532.30 |
1262.38 |
3838.90 |
<0.0001 |
<0.0001 |
|
| C-contact time |
2919.86 |
130.35 |
1 |
2919.86 |
130.35 |
26.60 |
52.49 |
<0.0001 |
<0.0001 |
|
| AB |
12.61 |
3431.67 |
1 |
12.61 |
3431.67 |
0.1149 |
1382.02 |
0.7348 |
<0.0001 |
|
| AC |
97.40 |
7.94 |
1 |
97.40 |
7.94 |
0.8875 |
3.20 |
0.3468 |
0.0746 |
|
| BC |
73.03 |
92.02 |
1 |
73.04 |
92.02 |
0.6655 |
37.06 |
0.4152 |
<0.0001 |
|
| A2 |
7905.81 |
141.60 |
1 |
7905.81 |
141.60 |
72.03 |
57.03 |
<0.0001 |
<0.0001 |
|
| B2 |
1344.28 |
2119.56 |
1 |
1344.28 |
2119.56 |
12.25 |
853.60 |
0.0005 |
<0.0001 |
|
| C2 |
57.38 |
16.98 |
1 |
57.38 |
16.98 |
0.5228 |
6.84 |
0.4701 |
0.0093 |
|
| Residual |
38![[thin space (1/6-em)]](https://www.rsc.org/images/entities/char_2009.gif) 413.66 413.66 |
869.08 |
350 |
109.75 |
2.48 |
|
|
|
|
|
| Pure error |
25.53 |
7.26 |
180 |
0.1418 |
0.0403 |
|
|
|
|
|
| Cor total |
4.662 × 10⁵ |
21![[thin space (1/6-em)]](https://www.rsc.org/images/entities/char_2009.gif) 815.21 815.21 |
359 |
|
|
|
|
|
|
|
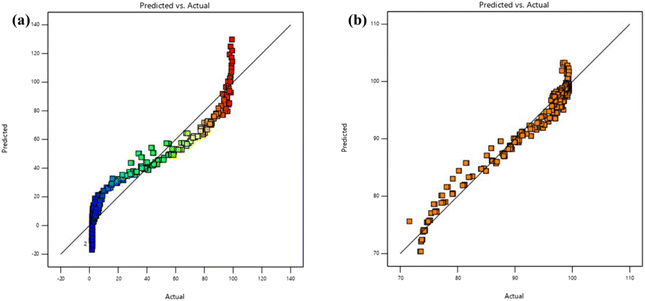 |
| | Fig. 5 Plots indicating proximity between predicted and actual values for both adsorbents RCFA (a) and SECFA (b). | |
3.7. Effect of parameters on dye removal
3.7.1. Effect of dye concentration. 3D plots were used to investigate the effect of dye concentration on dye removal while keeping other parameters constant, as shown in Fig. 6. To check the maximum effect of dye concentration, other parameters were set at a point where their contributions to dye removal were minimal. For this purpose, the adsorbent dose and contact time were kept at a minimum, which were 0.0125 g/10 mL and one minute, respectively. The effects of both RCFA and SECFA adsorbents were examined at minimum, moderate, and maximum dye concentrations, i.e., 10 ppm, 100 ppm, and 200 ppm, respectively. At 10 ppm, RCFA showed 81.52% dye removal, which was a reasonable difference from SECFA's 97.52% dye removal, as shown in Fig. 6(a) and (b). However, when the dye concentration increased to 100 ppm, a drastic difference was observed. RCFA removed only 3.65% of dye, while SECFA showed 81.57% dye removal, as shown in Fig. 6(c) and (d). Similarly, at 200 ppm dye concentration, RCFA and SECFA showed 1.79% and 73.45% dye removal, respectively, as mentioned in Fig. 6(e) and (f). There is a significant effect of dye concentration: as it increases, the percentage of dye adsorption decreases.53 The reason behind this behavior is that at low concentrations, there are enough active sites present in RCFA and SECFA to adsorb dye molecules, while at higher dye concentrations, RCFA does not have enough sites to accommodate the dye molecules compared to SECFA, which has more surface area, as revealed by BET analysis.54
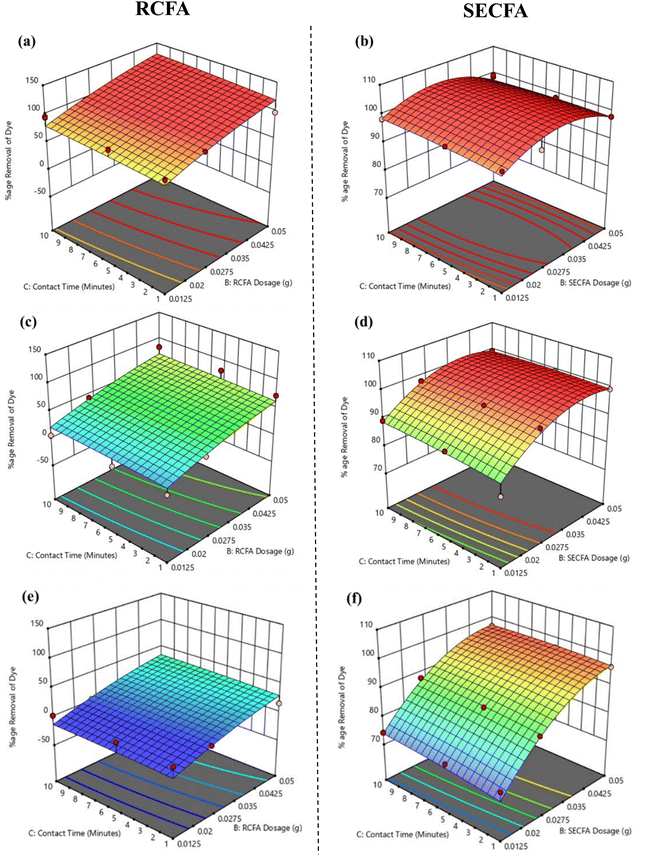 |
| | Fig. 6 3D surfaces of RCFA and SECFA plotted at minimum adsorbent dosages and contact time with varying dye concentrations of 10 ppm (a) and (b), 100 ppm (c) and (d) and 200 ppm (e) and (f). | |
3.7.2. Effect of adsorbent dosages. To study the maximum effect of both RCFA and SECFA adsorbents, dosages of 0.0125 g, 0.025 g and 0.05 g per 10 mL of dye solution were used, while keeping the other two parameters, i.e., dye concentration and contact time, constant at conditions where their influence on dye removal was minimum. These conditions were 200 ppm dye concentration and one minute contact time. At 0.0125 g/10 mL, RCFA and SECFA showed 1.79% and 73.45% dye removal efficiency, respectively, as mentioned in Fig. 7(a) and (b). When adsorbent dosages were doubled, i.e., 0.025 g/10 mL, SECFA showed a reasonable increment in dye removal which was 84.97%, but RCFA showed only 3.12% dye removal, as shown in Fig. 7(c) and (d). Similarly, at the maximum dosage (0.05 g/10 mL), RCFA and SECFA showed 15.45% and 96.37% dye removal, respectively, as mentioned in Fig. 7(e) and (f).55 The reason for low adsorption with RCFA is that there are fewer active sites on RCFA to accommodate the dye molecules due to the presence of bulkier groups in their structures which have been removed from the SECFA as shown by XRD analysis.
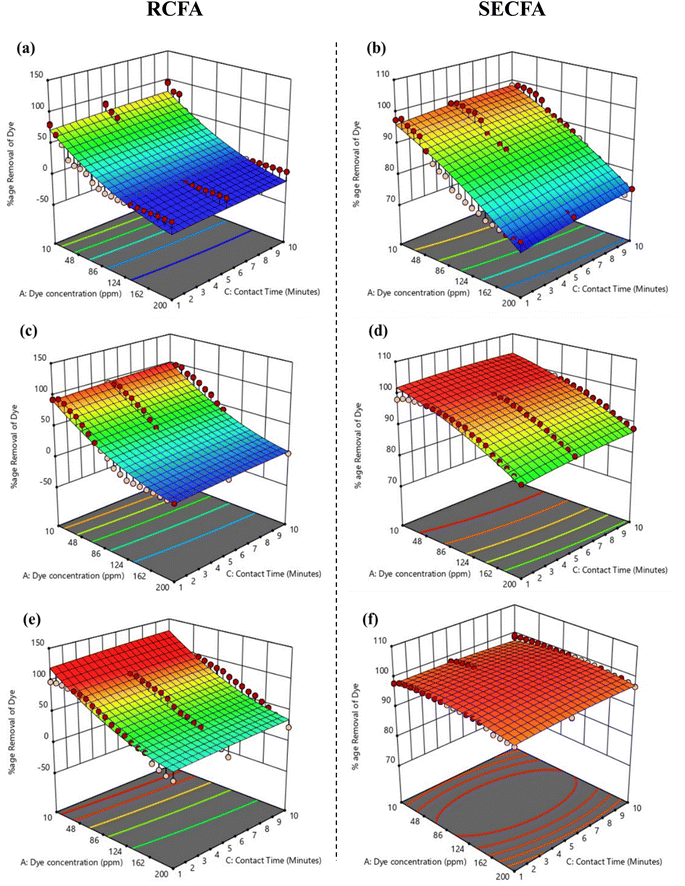 |
| | Fig. 7 3D surfaces of RCFA and SECFA plotted at maximum dye concentration and minimum contact time with varying the adsorbents dosages of 0.0125 g (a) and (b), 0.025 g (c) and (d) and 0.05 g (e) and (f). | |
3.7.3. Effect of contact time. The effect of contact time on dye removal was evaluated by varying the contact time at three different levels: 1, 5, and 10 minutes, while keeping the other conditions at points where their impact was lowest (200 ppm dye concentration and 0.0125 g/10 mL adsorbent dosage) to get actual effect of contact time. At 1 minute Fig. 8(a) and (b), 5 minutes Fig. 8(c) and (d), and 10 minutes Fig. 8(e) and (f), RCFA showed 1.79%, 2.15% and 2.22% dye removal, respectively, while SECFA showed 73.45%, 73.88%, and 74.31% dye removal, respectively. The influence of contact time in the dye adsorption process is linear but not as significant as the concentration of dye and adsorbent dosage for both RCFA and SECFA. It is apparent that the presence of vacant adsorption active sites facilitates rapid adsorption in the early stages, which subsequently slows down over time and inhibits further changes in adsorption capacity.56
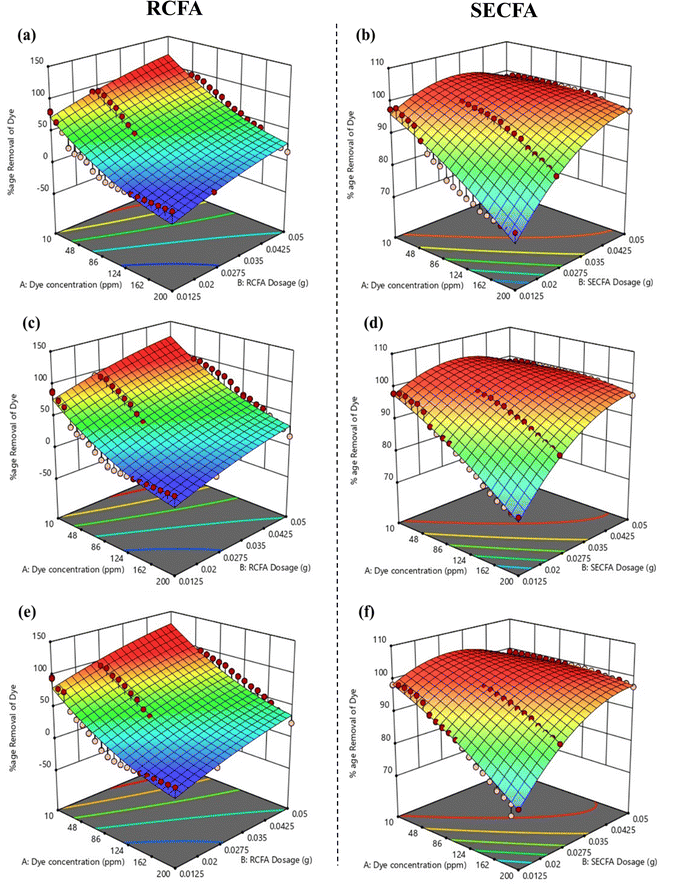 |
| | Fig. 8 3D surfaces of RCFA and SECFA plotted at minimum adsorbent dosages and maximum dye concentrations with varying contact times of 1 minute (a) and (b), 5 minutes (c) and (d) and 10 minutes (e) and (f). | |
3.8. Adsorption isotherms study
The interaction behaviour between adsorbent and adsorbate can be estimated easily by the evaluation of adsorption isotherms. Isotherm models can be used to explain the nonlinear equilibrium relationship between the concentrations of the adsorbed solute and the solute that is remained in the solution. The adsorption isotherm study was performed at different dye concentrations ranging between 10 and 200 ppm, at each adsorbents dosages of 0.0125 g, 0.025 g and 0.05 g. Moreover, each adsorbent dose was examined at different time durations of 1, 5 and 10 minutes. In this study, the adsorption data was studied by using Langmuir and Freundlich isotherms.
The Langmuir isotherm is frequently employed model for analyzing the adsorption of dyes and other organic pollutants and is mostly used for monolayer adsorption processes, while the second most popular isotherm model is the Freundlich isotherm, which is based on heterogeneous or multilayer surfaces.57,58 Both Langmuir and Freundlich isotherm models are used for large surface areas and more porous structures.59 Fig. 9(a) and (d) show one of the best-fitted (regarding R2 value) linear forms of Langmuir and Freundlich isotherms of RCFA and SECFA adsorbents while the complete values are mentioned in Tables S3 and S4.†
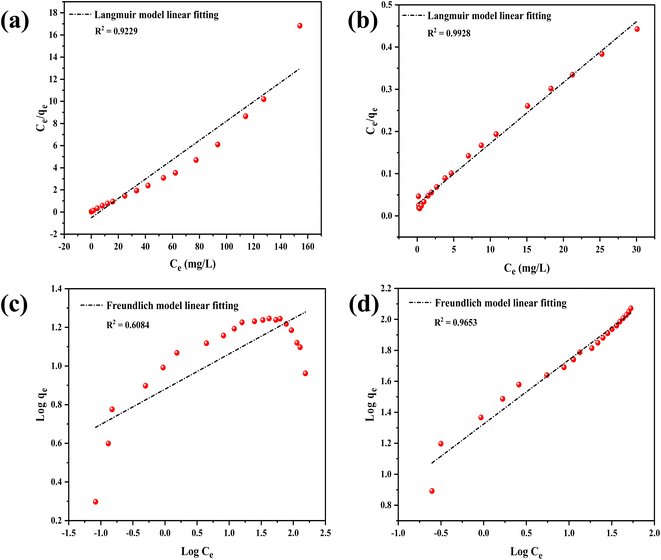 |
| | Fig. 9 (a) and (b) Show the Langmuir linear model fitting of RCFA (at 10 minutes and 0.05 g adsorbent) and SECFA (at 1 minute and 0.025 g adsorbent) respectively. While (c) and (d) show the Freundlich linear model fitting of RCFA (at 10 minutes and 0.05 g adsorbent) and SECFA (at 1 minute and 0.0125 g adsorbent) respectively. | |
The models presented in Tables S3 and S4† represent the relationship between the adsorbate concentration and adsorbing power under specific conditions, which are related to the surface of the adsorbent and pore distribution properties and how they interact with the adsorbate. Table S3† exhibits the adsorption of CV dye showing good fitting of the model to the Langmuir isotherm in comparison with the Freundlich isotherm which is described in Table S4.† To describe the appropriate fitting of the model and to avoid mentioning several R2 values, an average of R2 values for each of RCFA and SECFA were taken60,61 and the values that appeared for both the adsorbents for the Langmuir isotherm were 0.8758, 0.9428 and for Freundlich isotherm were 0.2907 and 0.8592, respectively. These values show the best fitting of the Langmuir adsorption isotherm. The values of the adsorbents showed that the porous structure of SECFA facilitates and increases specific surface area, allowing dye molecules to easily access the adsorption sites where intermolecular forces are significant. The Langmuir isotherm confirms the development of a monolayer covering by showing that adsorption occurs at discrete, uniform spots on the adsorbent surface. Furthermore, it shows that when the adsorbent gets farther away from the adsorption surfaces, the intensity of the intermolecular interactions rapidly decreases.62
The equations for Langmuir and Freundlich isotherm are mentioned below,
| |
 | (6) |
| |
 | (7) |
where
qe,
Ce,
KL and
KF represent the adsorption, concentration of dye, adsorption coefficient and Freundlich respectively.
3.9. Adsorption kinetics and thermodynamic studies
The adsorption kinetics of crystal violet dye onto coal fly ash-based adsorbents were analyzed using the pseudo-first-order kinetic model. The linear form of the pseudo-first-order kinetic equation is given by:| |
 | (8) |
where: qe is the amount of dye adsorbed at equilibrium (mg g−1), qt is the amount of dye adsorbed at time (mg g−1) and K1 is the pseudo-first-order rate constant (min−1).
From eqn (8), the slope and intercept can be determined as follows:
| |
 | (9) |
| |
Intercept = log![[thin space (1/6-em)]](https://www.rsc.org/images/entities/char_2009.gif) qe qe
| (10) |
The value of K1 can be calculated from eqn (9) as follows:
| K1 (min−1) = −Slope × 2.303 |
The Gibbs free energy change (ΔG°) for the adsorption process was calculated using the equilibrium constant Kc derived from the adsorption isotherms. The thermodynamic equations used are:
ln![[thin space (1/6-em)]](https://www.rsc.org/images/entities/char_2009.gif) Kc × RT = −ΔH° + TΔS° Kc × RT = −ΔH° + TΔS° |
| |
−RT![[thin space (1/6-em)]](https://www.rsc.org/images/entities/char_2009.gif) ln ln![[thin space (1/6-em)]](https://www.rsc.org/images/entities/char_2009.gif) Kc = ΔH° − TΔS° Kc = ΔH° − TΔS°
| (11) |
From eqn (11) and (12).
ΔG° = −RT![[thin space (1/6-em)]](https://www.rsc.org/images/entities/char_2009.gif) ln ln![[thin space (1/6-em)]](https://www.rsc.org/images/entities/char_2009.gif) Kc Kc |
The negative values of ΔG° indicate the spontaneity of the adsorption process.29,63 The calculations for ΔG° are summarized in ESI Table S5,† which shows that all processes are spontaneous in nature.
3.10. Regeneration studies
Regenerating adsorbents is very important for their reusability, cost-effectiveness, and environmental sustainability. CFA-based adsorbents have advantages over organic adsorbents, as they are more thermally stable. These adsorbents can be desorbed by the action of heat.64 In this study, 0.05 grams of RCFA and SECFA adsorbents were each separately added into 10 mL of a 150 ppm CV solution and stirred for one minute. The exhausted adsorbents were then used for calcination at 230 °C for 2 hours to restore their adsorption capacity. This regeneration process was repeated until no significant dye removal was observed, as shown in Fig. 10. The data indicate that after three regeneration cycles, the dye removal efficiency of both RCFA and SECFA adsorbents stabilized, remaining nearly linear. This demonstrates that both types of adsorbents can sustain a high dye removal rate even after multiple uses, rendering them cost-effective and environmentally friendly solutions for dye adsorption.65
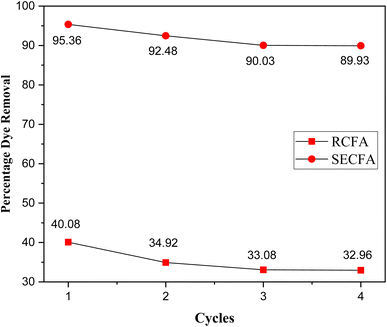 |
| | Fig. 10 Regeneration studies of the adsorbents for CV dye removal. | |
4 Conclusion
This study describes the comparison of the dye-adsorption capacities of RCFA and thermally acid–base treated SECFA. After the treatment of RCFA, certain groups were eliminated leading to the enhancement of the surface area and the pore volume of the SECFA. The adsorption capacity of SECFA was greater than that of RCFA because removal of the components from the later to produce former leads to the availability of more adsorption sites to adsorb dye molecules as revealed by XRD and SEM analysis. The isothermal study predicted that the Langmuir model is a better fit than the Freundlich model suggesting it to be a monolayer adsorption process. The RSM–CCD model is another chemometric approach that was used to study the optimized conditions and the influence of one variable over the other. It is concluded that at lower dye concentrations, RCFA and SECFA showed almost similar results. However, SECFA can be used preferably as an adsorbent at higher dye concentrations instead of RCFA as it showed better results. The thermodynamic studies suggested all the adsorption processes to be spontaneous. This study simultaneously makes a valuable contribution to managing the waste material (CFA) of brick kilns and dye-polluted water of textile industries.
Data availability
All the data produced or examined during this research have been provided within the manuscript and ESI file.†
Author contributions
HN: writing original draft. FJ: formal analysis. MAI: supervision, review & editing and project administration. TWN: conceptualization. MK: statistical modeling. AHI and SSA: funding acquisition. SUZ: investigation. USS: data curation. RK: validation. FA, SK and MTR: software. All authors approved the final manuscript.
Conflicts of interest
The authors declare that they have no competing interests as denied by Journal, or other interests that might be perceived to influence the results and/or discussion reported in this paper.
Acknowledgements
The authors are thankful to the Pakistan Science Foundation (PSF) for awarding research grant PSF/CRP/Consrm/676.
References
- R. Kishor, D. Purchase, G. D. Saratale, R. G. Saratale, L. F. R. Ferreira, M. Bilal, R. Chandra and R. N. Bharagava, J. Environ. Chem. Eng., 2021, 9, 105012, DOI:10.1016/j.jece.2020.105012.
- X. Wang, C. Jiang, B. Hou, Y. Wang, C. Hao and J. Wu, Chemosphere, 2018, 206, 587–596, DOI:10.1016/j.chemosphere.2018.04.183.
- G. J. Copello, A. M. Mebert, M. Raineri, M. P. Pesenti and L. E. Diaz, J. Hazard. Mater., 2011, 186, 932–939, DOI:10.1016/j.jhazmat.2010.11.097.
- J. Liu, N. Wang, H. Zhang and J. Baeyens, J. Environ. Manage., 2019, 238, 473–483, DOI:10.1016/j.jenvman.2019.03.009.
- M. M. Nassar, M. S. El-Geundi and A. A. Al-Wahbi, Desalin. Water Treat., 2012, 44, 340–349, DOI:10.1080/19443994.2012.691701.
- M. Auta and B. Hameed, Chem. Eng. J., 2011, 171, 502–509, DOI:10.1016/j.cej.2011.04.017.
- X. Querol, N. Moreno, J. t. Umaña, A. Alastuey, E. Hernández, A. Lopez-Soler and F. Plana, Int. J. Coal Geol., 2002, 50, 413–423, DOI:10.1016/S0166-5162(02)00124-6.
- Y. Safa and H. N. Bhatti, Desalination, 2011, 272, 313–322, DOI:10.1016/j.desal.2011.01.040.
- S. Mani and R. N. Bharagava, in Recent Advanc Environ Manag, CRC Press, 2018, pp. 47–69, DOI:10.1007/978-3-319-58538-3_230-1.
- P. Rai, R. K. Gautam, S. Banerjee, V. Rawat and M. Chattopadhyaya, J. Environ. Chem. Eng., 2015, 3, 2281–2291, DOI:10.1016/j.jece.2015.08.017.
- S. Mani and R. N. Bharagava, in Rev Environ Contam Toxicol, ed. P. D. Voogt, 2016, vol. 237, pp. 71–104, DOI:10.1007/978-3-319-58538-3_230-1.
- A. Hapiz, A. H. Jawad, L. D. Wilson, Z. A. Alothman, A. S. Abdulhameed and S. Algburi, Int. J. Phytorem., 2024, 26, 579–593, DOI:10.1080/15226514.2023.2256412.
- J. Swain, A. Priyadarshini, S. Hajra, S. Panda, J. Panda, R. Samantaray, Y. Yamauchi, M. Han, H. J. Kim and R. Sahu, J. Alloys Compd., 2023, 965, 171438, DOI:10.1016/j.jallcom.2023.171438.
- L. W. Man, P. Kumar, T. T. Teng and K. L. Wasewar, Desalin. Water Treat., 2012, 40, 260–271, DOI:10.1080/19443994.2012.671257.
- S. R. Panda and S. De, J. Environ. Chem. Eng., 2015, 3, 1678–1690, DOI:10.1016/j.jece.2015.06.004.
- S. Avlonitis, I. Poulios, D. Sotiriou, M. Pappas and K. Moutesidis, Desalination, 2008, 221, 259–267, DOI:10.1016/j.desal.2007.01.082.
- P. He, L. Wang, J. Xue and Z. Cao, Environ. Technol., 2010, 31, 417–422, DOI:10.1080/09593330903511413.
- S. Raghu and C. A. Basha, J. Hazard. Mater., 2007, 149, 324–330, DOI:10.1016/j.jhazmat.2007.03.087.
- H. Ali, W. Ahmad and T. Haq, Afr. J. Biotechnol., 2009, 8, 1574–1576, DOI:10.5555/20093146343.
- G. Wei, L. Zhang, T. Wei, Q. Luo and Z. Tong, Environ. Technol., 2012, 33, 1589–1595, DOI:10.1080/09593330.2011.639395.
- A. Hamzezadeh, Y. Rashtbari, S. Afshin, M. Morovati and M. Vosoughi, Int. J. Environ. Anal. Chem., 2022, 102, 254–269, DOI:10.1080/03067319.2020.1720011.
- R. Rehman, M. S. Hussain, G. Samin, M. M. Jahangir, A. Dar, Z. T. Al-Thagafi, R. I. Alsantali, E. A. Al-Abbad and M. Akram, Int. J. Biol. Macromol., 2024, 256, 128285, DOI:10.1016/j.ijbiomac.2023.128285.
- W. Astuti, A. Chafidz, E. T. Wahyuni, A. Prasetya, I. M. Bendiyasa and A. E. Abasaeed, J. Environ. Chem. Eng., 2019, 7, 103262, DOI:10.1016/j.jece.2019.103262.
- B. C. S. Ferreira, F. S. Teodoro, A. B. Mageste, L. F. Gil, R. P. de Freitas and L. V. A. Gurgel, Ind. Crops Prod., 2015, 65, 521–534, DOI:10.1016/j.indcrop.2014.10.020.
- S. Das, S. Barman and R. Thakur, J. Environ. Sci. Eng., 2012, 54, 472–480 CAS . https://pubmed.ncbi.nlm.nih.gov/25151710/.
- D. A. Giannakoudakis, G. Z. Kyzas, A. Avranas and N. K. Lazaridis, J. Mol. Liq., 2016, 213, 381–389, DOI:10.1016/j.molliq.2015.07.010.
- M. Ghaedi, S. Hajati, M. Zaree, Y. Shajaripour, A. Asfaram and M. Purkait, Adv. Powder Technol., 2015, 26, 1087–1093, DOI:10.1016/j.apt.2015.05.002.
- D. Robati, B. Mirza, M. Rajabi, O. Moradi, I. Tyagi, S. Agarwal and V. Gupta, Chem. Eng. J., 2016, 284, 687–697, DOI:10.1016/j.cej.2015.08.131.
- S. Banerjee, G. C. Sharma, M. Chattopadhyaya and Y. C. Sharma, J. Environ. Chem. Eng., 2014, 2, 1870–1880, DOI:10.1016/j.jece.2014.06.020.
- I. Dahlan and N. W. Ling, Sep. Sci. Technol., 2021, 56, 54–67, DOI:10.1080/01496395.2019.1708115.
- G. B. Balji, A. Surya, P. Govindaraj and G. M. Ponsakthi, Inorg. Chem. Commun., 2022, 143, 109708, DOI:10.1016/j.inoche.2022.109708.
- A. Eteba, M. Bassyouni and M. Saleh, Int. J. Environ. Sci. Technol., 2023, 20, 7589–7602, DOI:10.1007/s13762-022-04457-5.
- Z. Hussain, N. Chang, J. Sun, S. Xiang, T. Ayaz, H. Zhang and H. Wang, J. Hazard. Mater., 2022, 422, 126778, DOI:10.1016/j.jhazmat.2021.126778.
- H. Zhang, Y. Li, B. Cheng, C. Ding and Y. Zhang, Int. J. Biol. Macromol., 2020, 161, 561–572, DOI:10.1016/j.ijbiomac.2020.06.017.
- H. A. Benesi and A. C. Jones, J. Phys. Chem., 1959, 63, 179–182, DOI:10.1021/j150572a012.
- H. Yoshino, K. Kamiya and H. Nasu, J. Non-Cryst. Solids, 1990, 126, 68–78, DOI:10.1016/0022-3093(90)91024-L.
- J. R. Combes, L. D. White and C. P. Tripp, Langmuir, 1999, 15, 7870–7875, DOI:10.1021/la990495+.
- M. Sall, A. C. Wade, G. Dieye, A. Traoré, P. M. Gueye, S. Diouf, D. Thiaw, K. A. Diop and D. Diop, J. Miner. Mater. Charact. Eng., 2022, 10, 446–459, DOI:10.4236/jmmce.2022.105032.
- H.-A. Nguyen, V.-A. Tran and D.-H. Vo, JST-UD, 2019, pp. 1–4, https://www.neliti.com/publications/448628/utilization-of-fourier-transform-infrared-on-microstructural-examination-of-sfc Search PubMed.
- K. Belkassa, M. Khelifa, I. Batonneau-Gener, K. Marouf-Khelifa and A. Khelifa, J. Hazard. Mater., 2021, 415, 125656, DOI:10.1016/j.jhazmat.2021.125656.
- M. F. H. Al-Kadhemy, W. H. Abaas and I. Fakher, Casp. J. Appl. Sci. Res., 2013, 2, 11 Search PubMed.
- R. Ragu, P. L. Mageshwari, M. Akilan and S. J. Das, Appl. Phys. B, 2020, 126, 1–10, DOI:10.1007/s00340-020-07439-y.
- J. Cheriaa, M. Khaireddine, M. Rouabhia and A. Bakhrouf, Sci. World J., 2012, 2012, DOI:10.1100/2012/512454.
- P. Sangaroon, T. Srisatit and P. Sriprom, Environment Asia, 2019, 12, 58–68, DOI:10.14456/ea.2019.27.
- T. Al-Dahri, A. A. AbdulRazak, I. H. Khalaf and S. Rohani, Mater. Express, 2018, 8, 234–244, DOI:10.1166/mex.2018.1433.
- M. Mofulatsi, E. Prabakaran, T. Velempini, E. Green and K. Pillay, Microporous Mesoporous Mater., 2022, 329, 111480, DOI:10.1016/j.micromeso.2021.111480.
- S. Dash, H. Chaudhuri, G. Udayabhanu and A. Sarkar, Energy Fuels, 2016, 30, 6646–6653, DOI:10.1021/acs.energyfuels.6b00900.
- S. Sivalingam and S. Sen, Appl. Surf. Sci., 2018, 455, 903–910, DOI:10.1016/j.apsusc.2018.05.222.
- A. Majeed, A. H. Ibrahim, S. S. Al-Rawi, M. A. Iqbal, M. Kashif, M. Yousif, Z. U. Abidin, S. Ali, M. Arbaz and S. A. Hussain, ACS Omega, 2024, 9, 12069–12083, DOI:10.1021/acsomega.3c09989.
- Z. U. Abidin, A. Majeed, M. A. Iqbal, M. Kashif, T. Fatima, M. Yousif, M. Arbaz, S. A. Hussain and M. Sajid, Clean Technol. Environ. Policy, 2024, 1–15, DOI:10.1007/s10098-024-02842-x.
- M. Yousif, A. H. Ibrahim, S. S. Al-Rawi, A. Majeed, M. A. Iqbal, M. Kashif, Z. U. Abidin, M. Arbaz, S. Ali and S. A. Hussain, RSC Adv., 2024, 14, 16138–16149, 10.1039/D4RA01202J.
- Z. N. Garba, M. Imam, H. Adamu and E. B. Agbaji, Sustain Chem One World, 2024, 1, 100001, DOI:10.1016/j.scowo.2024.100001.
- M. Abdi, M. Balagabri, H. Karimi, H. Hossini and S. O. Rastegar, Appl. Water Sci., 2020, 10, 1–10, DOI:10.1007/s13201-020-01252-w.
- I. Chaari, B. Moussi and F. Jamoussi, J. Alloys Compd., 2015, 647, 720–727, DOI:10.1016/j.jallcom.2015.06.142.
- M. S. Manzar, G. Khan, P. V. dos Santos Lins, M. Zubair, S. U. Khan, R. Selvasembian, L. Meili, N. I. Blaisi, M. Nawaz and H. A. Aziz, J. Mol. Liq., 2021, 339, 116714, DOI:10.1016/j.molliq.2021.116714.
- I. A. Mohammed, N. N. A. Malek, A. H. Jawad, M. S. Mastuli and Z. A. ALOthman, J. Polym. Environ., 2022, 30, 3447–3462, DOI:10.1007/s10924-022-02443-z.
- I. Langmuir, J. Am. Chem. Soc., 1918, 40, 1361–1403, DOI:10.1021/ja02242a004.
- E. C. Umejuru, E. Prabakaran and K. Pillay, ACS Omega, 2021, 6, 11155–11172, DOI:10.1021/acsomega.0c04194.
- Y. Zhou, Y. Hu, W. Huang, G. Cheng, C. Cui and J. Lu, Chem. Eng. J., 2018, 341, 47–57, DOI:10.1016/j.cej.2018.01.155.
- K. Al-Sou'od, APCBEE Proc., 2012, 1, 116–125, DOI:10.1016/j.apcbee.2012.03.020.
- K. Batouche, M. Chikhi, F. Balaska and A. Abbaz, Alger. J. Environ. Sci. Technol., 2021, 7 DOI:10.5555/20230085863.
- G. Xie, X. Shang, R. Liu, J. Hu and S. Liao, Carbohydr. Polym., 2011, 84, 430–438, DOI:10.1016/j.carbpol.2010.12.003.
- O. Acisli, I. Acar and A. Khataee, J. Ind. Eng. Chem., 2020, 83, 53–63, DOI:10.1016/j.jiec.2019.11.012.
- M. Karmakar, M. Mahapatra, A. Dutta, P. K. Chattopadhyay and N. R. Singha, Int. J. Biol. Macromol., 2017, 102, 438–456, DOI:10.1016/j.ijbiomac.2017.04.044.
- W. Yu, X. Wu, R. Mi, H. Zai, M. Fang, X. Min, Y. Liu and Z. Huang, J. Am. Ceram. Soc., 2024, 5298–5312, DOI:10.1111/jace.19805.
|
| This journal is © The Royal Society of Chemistry 2024 |
Click here to see how this site uses Cookies. View our privacy policy here.  Open Access Article
 *ab,
Tan Wen Nee
 c,
Muhammad Kashifd,
Ahmad Hamdy Ibrahim
 e,
Sawsan S. Al-Rawi
 f,
Sami Ullah Ziaa,
Umar Sohail Shoukata,
Rimsha Kanwala,
Farhan Ahmada,
Sabha Khalida and
Muhammad Tjammal Rehmang
![[thin space (1/6-em)]](https://www.rsc.org/images/entities/char_2009.gif) 000 metric tons of commercial dyes of a hundred-thousand types are produced around the globe per year and 1–1.5% of these dyes are discharged directly into wastewater.5,6 In Europe and the United States, around 1 million kilograms of dyes are directly drained into oceans every year,7 and in Pakistan textile and leather industries are the biggest producers of dye-contaminated wastewater.8 It is because these dyes are the primary materials in the textile, paint, paper, food, and tannery industries.9
000 metric tons of commercial dyes of a hundred-thousand types are produced around the globe per year and 1–1.5% of these dyes are discharged directly into wastewater.5,6 In Europe and the United States, around 1 million kilograms of dyes are directly drained into oceans every year,7 and in Pakistan textile and leather industries are the biggest producers of dye-contaminated wastewater.8 It is because these dyes are the primary materials in the textile, paint, paper, food, and tannery industries.9
![[thin space (1/6-em)]](https://www.rsc.org/images/entities/char_2009.gif) :
:![[thin space (1/6-em)]](https://www.rsc.org/images/entities/char_2009.gif) 2 (w/v) and heating the mixture for 24 h at 105 °C followed by neutralizing the mixture by washing it with double distilled water and then drying it overnight in an oven at 105 °C.29 In a study by Dahlan and colleagues, the modification was achieved by mixing the rice husk ash-coal fly ash in 1
2 (w/v) and heating the mixture for 24 h at 105 °C followed by neutralizing the mixture by washing it with double distilled water and then drying it overnight in an oven at 105 °C.29 In a study by Dahlan and colleagues, the modification was achieved by mixing the rice husk ash-coal fly ash in 1![[thin space (1/6-em)]](https://www.rsc.org/images/entities/char_2009.gif) :
:![[thin space (1/6-em)]](https://www.rsc.org/images/entities/char_2009.gif) 1 with 1 M NaOH/Na2CO3 and stirring the mixture for 2 hours at 80 °C then neutralizing it with deionized water and drying it overnight in an oven at 110 °C led to the formation of the adsorbent that showed 45.1% efficiency against acid violet 7 dye.30 In another study by Balji and colleagues, the CFA was prepared simply by neutralizing the fine powder of CFA and placing it in an oven at 110 °C for 3 h, this was used to remove malachite green and methyl violet dye and it showed 96% efficiency for methyl violet.31 Eteba and colleagues prepared CFA by stirring it with 30% (w/w) HCl for 12 hours at 90 °C, neutralizing this mixture with distilled water and dried at 120 °C for 24 hours. By using this adsorbent, the direct blue 78 dye was removed with an efficiency of 99.7%.32
1 with 1 M NaOH/Na2CO3 and stirring the mixture for 2 hours at 80 °C then neutralizing it with deionized water and drying it overnight in an oven at 110 °C led to the formation of the adsorbent that showed 45.1% efficiency against acid violet 7 dye.30 In another study by Balji and colleagues, the CFA was prepared simply by neutralizing the fine powder of CFA and placing it in an oven at 110 °C for 3 h, this was used to remove malachite green and methyl violet dye and it showed 96% efficiency for methyl violet.31 Eteba and colleagues prepared CFA by stirring it with 30% (w/w) HCl for 12 hours at 90 °C, neutralizing this mixture with distilled water and dried at 120 °C for 24 hours. By using this adsorbent, the direct blue 78 dye was removed with an efficiency of 99.7%.32


![[double bond, length as m-dash]](https://www.rsc.org/images/entities/char_e001.gif) C stretching vibrations of the benzene ring of CV adsorbed on the adsorbent surface.42,43
C stretching vibrations of the benzene ring of CV adsorbed on the adsorbent surface.42,43


![[thin space (1/6-em)]](https://www.rsc.org/images/entities/char_2009.gif) 946.13
946.13![[thin space (1/6-em)]](https://www.rsc.org/images/entities/char_2009.gif) 531.91
531.91![[thin space (1/6-em)]](https://www.rsc.org/images/entities/char_2009.gif) 413.66
413.66![[thin space (1/6-em)]](https://www.rsc.org/images/entities/char_2009.gif) 815.21
815.21


![[thin space (1/6-em)]](https://www.rsc.org/images/entities/char_2009.gif) qe
qe
![[thin space (1/6-em)]](https://www.rsc.org/images/entities/char_2009.gif) Kc × RT = −ΔH° + TΔS°
Kc × RT = −ΔH° + TΔS°![[thin space (1/6-em)]](https://www.rsc.org/images/entities/char_2009.gif) ln
ln![[thin space (1/6-em)]](https://www.rsc.org/images/entities/char_2009.gif) Kc = ΔH° − TΔS°
Kc = ΔH° − TΔS°
![[thin space (1/6-em)]](https://www.rsc.org/images/entities/char_2009.gif) ln
ln![[thin space (1/6-em)]](https://www.rsc.org/images/entities/char_2009.gif) Kc
Kc


