DOI:
10.1039/D4RA04070H
(Paper)
RSC Adv., 2024,
14, 24322-24334
Fabrication of silica/calcium alginate nanocomposite based on rice husk ash for efficient adsorption of phenol from water†
Received
3rd June 2024
, Accepted 22nd July 2024
First published on 5th August 2024
Abstract
The current work discusses the synthesis of three different solid adsorbents: silica nanoparticles derived from rice husk (RS), calcium alginate beads (AG), and silica/alginate nanocomposite (RSG). The fabricated solid adsorbents were characterized by using different physicochemical techniques such as TGA, XRD, nitrogen adsorption/desorption analysis, ATR-FTIR, pHPZC, SEM, and TEM. The adsorption efficiencies of the prepared solid adsorbents were considered for the removal of phenol as a selected hazardous pollutant. Because of its improved adsorption capacity and environmentally friendly character, a composite made of biosilica nanoparticles and naturally occurring alginate biopolymer by click chemistry is significant in environmental treatment. Adding silica nanoparticles to the alginate biopolymer hydrogel has many advantages, including increased surface area, easier recovery of the solid adsorbent, and additional surface chemical functional groups. The silica/alginate nanocomposite showed surface heterogeneity with many chemical functional groups present, whereas silica nanoparticles had the highest surface area (893.1 m2 g−1). It has been found that the average TEM particle size of RS, AG, and RSG was between 18 and 82 nm. RSG displayed the maximum adsorption capacity of phenol (100.55 mg g−1) at pH 7 and 120 min as equilibrium adsorption time. Adsorption of phenol onto the solid adsorbents fit well with a nonlinear Langmuir isotherm with favorable adsorption. Kinetic and thermodynamic studies prove that the adsorption process follows a pseudo-second-order kinetic model, endothermic process, physical, and spontaneous adsorption. Sodium hydroxide is effective in desorbing 94% of the loaded phenols, according to desorption investigations. Solid reusability tests showed that, after seven cycles of phenol adsorption/desorption, RSG lost only 8.8% of its adsorption activity.
1. Introduction
The expansion of technology, industry, and population growth are the primary factors responsible for rising water consumption, wastewater generation, and environmental contamination. As a result, there is an increasing demand for investments to be made in the disposal and treatment of wastewater.1 Among organic pollutants, phenol is a toxic, carcinogenic aromatic, semi-volatile organic with detectable solubility in water and has been found in the wastewater of pharmaceutical, plastic, paper, resin, paint, dyes, pesticide, petrochemical, and oil refining industries. Aquatic ecosystems, humans, and animals are all at grave risk of health problems from untreated phenolic wastewater.2,3 Health effects upon exposure to phenolic chemical compounds depend on the period of contact and the quantity of phenol absorbed.4 Long-term phenol exposure increases the risk of the following symptoms: conjunctival burn, nausea, headache, diarrhea, vomiting, skin irritation, respiratory failure, coma, and blindness. Because of its poor biodegradability, it can led to mortality, damage to the liver, pancreas, and kidneys, diminished tissue proteins, and failure of the central nervous system. Fish's development, metabolism, and reproduction are all impacted by phenol's interference with their metabolic enzymes. As a result, the US Environmental Protection Agency dictates that treated industrial effluent containing phenol should not have more than 0.1 mg L−1. Furthermore, less than 1 μg L−1 of phenol is allowed as the standard for human drinking water, according to the World Health Organization (WHO).3,4
Therefore, a lot of efforts has gone into creating techniques like chemical oxidation, photocatalytic degradation, and reverse osmosis that can handle wastewater contaminated with phenol. These techniques are suitable for small and medium-sized applications but are expensive to operate.5 Biological treatment is another popular approach for removing phenol, although it is sluggish and ineffective when treating wastewater with a salt concentration of more than 5% and phenol concentrations higher than 3 g L−1, which is commonly the case with phenolic industrial wastewater.6 Additionally, it was noted that salt induces plasmolysis, which suppresses cell activity, and that phenol concentrations as low as 50 mg L−1 impeded the biological treatment process. Conversely, adsorption has become a straightforward, safe, affordable, and effective method for treating wastewater that contains organic contaminants, such as phenolic chemicals.2 Based on this method and the potentially harmful effects, researchers constantly attempt to combine materials that have various properties to create inexpensive, easily recovered adsorbents that are also environmentally friendly.7 Many innovative adsorbents have been developed over the past few decades for the purpose of removing organic contaminants from simulated wastewater. These include clays/zeolites and their composites, agricultural solid wastes, industrial by-products, and their composites, biosorbents, and other various materials. Biological substances, such as cellulose, alginate, and chitosan can effectively remove organic contaminants. Due to their diverse range of sources, raw materials are widely available and renewable.8,9
Alginic acid is a carboxylated polysaccharide component that is one of the most prevalent polysaccharides in the world. Its unique structure is made up of two mannuronic acids, β-D-mannuronic acid, and α-L-guluronic acid.10,11 A variety of application fields, including photocatalysis, adsorption, drug release, and antibacterial activity, use alginate extensively because of its natural abundance, biocompatibility, non-toxicity, biodegradability, hydrophilicity, and adsorption qualities. Their primary characteristic is gelation, which is accomplished by the interchange of sodium ions from the guluronic acid residues with other divalent cations (Fe2+, Ba2+, and Ca2+).7,12 A three-dimensional network is created when the divalent cations linked to the α-L-guluronic acid blocks in between two distinct chains.13 Furthermore, alginate's carboxylic and hydroxyl groups make it a good candidate for electrostatic interactions with phenol, and the creation of a biopolymer-inorganic composite can result in an interesting combination that may be promising for phenolic adsorption. The hydrophilic, three-dimensionally organized, extensively crosslinked polymer chains that make up the hydrogel matrix have a large swelling capacity in saline solutions, physiological fluids, and water. These unique characteristics allow for a wide range of applications. Currently, it has been demonstrated in multiple studies that the biopolymer alginates' encapsulation of nanofillers results in novel properties that are distinct from those of the parent materials. Through the retention of organic contaminants, the encapsulation of mesoporous materials, zeolites, clays, MOFs, activated carbon, metal oxides, and polymers by alginate has demonstrated a notable improvement. Different interactions between the composite and the organic contaminants led to this improvement.
Silica gel is an amorphous inorganic polymer of silicic acid made up of tetrahedral interlinked SiO4 units that bind to oxygen to produce silane bonds (Si–O–Si) and, in the end, nanoscale particles with the general formula SiO2. The most used methodology for synthesizing silica is the sol–gel method. It involves using chemical reactions in solution at low temperatures to synthesize an inorganic polymer network. Silica precipitates during the sol–gel method of silica synthesis under conditions such as specific growth restrictions. The primary sources of silica used to create nanosilica have been tetramethoxysilane and tetraethoxysilane. These sources are highly hazardous, though, and are rather costly. Researcher interest in the formation of nanosilica materials from agricultural waste, such as rice husk ash, has recently increased from both an environmental and economic perspective. Biosilica nanoparticles are created by living things like diatoms, sponges, and specific kinds of plants, as opposed to conventional silica nanoparticles that are made by chemical processes. Because biosilica nanoparticles are made by living organisms, their manufacturing can be sustainable and environmentally beneficial, which adds to their appeal in a variety of applications. One of the raw materials with the highest silica content is rice husk ash (RHA), which has a silica content of 90–98%. Over 120 million tons of rice husk are produced annually worldwide, and in many nations, they are regarded as unwanted agricultural mass residue. Because of its high surface area and amorphous condition, silica in RHA is appealing for a variety of uses, including as an adsorbent, a filler in composite materials, a medicinal ingredient, and when it is produced at nanoscale sizes.14 Various types of hydrogels with a polysaccharide basis such as cellulose-based thermosensitive supramolecular hydrogel,15 hydroxyapatite/calcium alginate composite,16 nanomagnetic zinc oxide hybridized PVA/alginate/chitosan nanofibers,17 chitosan/calcium alginate blended beads,18 and alginate-coated magnetic nanocatalyst19 were utilized for the removal of phenol as a hazardous organic contaminant. It has been demonstrated that the primary factors influencing adsorption capacity on solid adsorbents are surface area and surface chemical functional groups acting as active sites. Developing biocomposite using biosilica and alginate is interesting for applications in environmentally safe and sustainable situations. Improved surface area and the presence of various surface chemical functional groups enhance the adsorption capability of composites as solid adsorbents.
The present study involved the synthesis of three solid nanomaterials, silica nanoparticles derived from rice husk (RS), calcium alginate (AG), and silica nanoparticles/calcium alginate composite (RSG) materials. Several analytical techniques were employed to examine the synthesized solid nanoparticles, including pHPZC, FTIR, TGA, SEM, XRD, TEM, and N2 adsorption/desorption isotherms. Different application conditions were considered for the removal of phenol from aqueous medium, including the effect of dose, initial phenol concentration, pH, temperature, shaking time, and temperature. Kinetic and thermodynamic studies were also considered. Solid adsorbent desorption and reusability is essential to investigate the sustainability of the prepared materials.
2. Materials and methods
2.1. Materials
Rice husk (RH) was collected from Domiatte rice mill in Egypt while sodium alginate (>99%), calcium chloride (≥99%), and phenol (97%) were purchased from Sigma-Aldrich Co., St. Louis, MO, USA. Hydrochloric acid (37%), ethanol (95%), benzene (99.5%), and sodium hydroxide (97%) were obtained from Oxford Lab Fine Chem LLP, India. All reagents were used without any prior treatment.
2.2. Preparation of solid adsorbents
2.2.1. Preparation of silica nanoparticles. Silica nanoparticles was synthetized based on the sol–gel method reported by Hassan et al. with slight modifications.14 Rice husk (190 g) was washed with distilled water to remove any adhered impurities and dried at 120 °C. The dried rice husk was grinded using Retsch ZM200 titanium mill and ignited in an oven for 4 h at 900 °C till the formation of white rice husk ash (RHA). Rice husk ash (40 g) was refluxed with 100 mL of 2.5 M HCl for 2 h at 120 °C under continuous magnetic stirring to ensure complete dissolution of all metal oxides except silicon dioxide. The previous refluxed mixture was filtered, the solid residue was washed several times with distilled water until neutral filtrate and dried at 120 °C. The dried residue (10 g) was refluxed in 2.5 M NaOH solution under continuous stirring conditions for 3 h, and filtered to get a colorless viscous, and transparent filtrate (eqn (1)). The produced sodium metasilicate solution was treated with 3 M HCl solution drop wisely until pH 2 (eqn (2)), followed by the addition of ammonium hydroxide till pH 8.5, the produced mixture was agitated for 3 h and the obtained silica nanoparticles was removed by centrifugation, washed with distilled water, and dried at 120 °C. Ammonium hydroxide was used to adjust the pH of the reaction medium and facilitate the formation of silica nanoparticles. The obtained white powder was stored in a clean dry bottle (RS).| | |
SiO2 (RHA) + NaOH → Na2SiO3 + H2O
| (1) |
| | |
2HCl + Na2SiO3 → SiO2 (silica nanoparticles) + 2NaCl + H2O
| (2) |
2.2.2. Preparation of calcium alginate beads. In deionized water, separate solutions of calcium chloride (3% w/v) and sodium alginate (1% w/v) were prepared. Water insoluble calcium alginate was synthetized by gradually adding sodium alginate solution to the calcium chloride solution that had been manufactured. All beads were then repeatedly rinsed with deionized water to eliminate any residual calcium chloride from the beads surface. After being washed, the beads were dried at 70 °C (AG).
2.2.3. Preparation of silica/alginate nanocomposite. An initial 2% (w/v) solution of sodium alginate was constantly swirled to produce a viscous homogenous solution. Then, 2 g of silica nanoparticles (RS) was mixed with 100 mL of the produced sodium alginate (2% w/v) while being continuously stirred for 1 h. Drop by drop, the prior mixture was added to a beaker of 100 mL aqueous CaCl2 solution (2% w/v). The synthetized beads were kept in their mother liquor for 4 h. After collecting the beads using dry filter paper, they were repeatedly rinsed with distilled water and allowed to dry at 80 °C overnight (RSG).
2.3. Characterization of solid adsorbents
For any solid adsorbent, thermal, textural, and surface chemical characterization is essential for understanding the nature of the adsorption process and adsorption capacity. In a thermoanalyzer apparatus (Shimadzu D-50, Japan) up to 800 °C at nitrogen flow rate of 50 mL min−1 and heating rate of 10 °C min−1, thermogravimetric analysis for RH, AG, RS, and RSG samples was carried out. An XRD system PANalytical X'Pert PRO, Cu Ka radiation (k = 1.540 Å), the tube operated at 30 kV was used to obtain X-ray diffraction (XRD) scans with the Bragg's angle (2θ) in the range of 5–50 degrees for all the prepared solid materials. Using a gas sorption analyzer (Quantachrome Corporation NOVA2000, USA) system, the specific surface area (SBET, m2 g−1), pore radius (![[r with combining macron]](https://www.rsc.org/images/entities/i_char_0072_0304.gif) , nm), and total pore volume (VP, cm3 g−1) were calculated via nitrogen gas adsorption at −196 °C for all the investigated solid adsorbents. The examined solid samples (0.05 g) were degassed for 12 hours at 10−4 Torr and 110 °C before being exposed to nitrogen gas adsorption. The morphological structure of the RS, AG, and RSG materials was investigated using a JEOL JSM-6510LV model SEM and a JEOL-JEM-2100 model TEM. Prior to TEM investigation, the samples were placed on a Cu grid and covered with an ultrathin holey/lacey carbon film after being dried at 100 °C in an oven and dispersed in pure ethanol using ultrasonication for 30 minutes. Nicolet Impact 400 D ATR-FTIR with a ZnSe crystal was used to perform ATR-FTIR on RS, AG, and RSG in the range (400–4000 cm−1). Zeta potentials were determined for RS, AG, and RSG in order to calculate pHPZC using the Zetasizer Nano S from Malvern Instrument in the UK. The measured zeta potentials (mV) were determined at different pH values (2–10).
, nm), and total pore volume (VP, cm3 g−1) were calculated via nitrogen gas adsorption at −196 °C for all the investigated solid adsorbents. The examined solid samples (0.05 g) were degassed for 12 hours at 10−4 Torr and 110 °C before being exposed to nitrogen gas adsorption. The morphological structure of the RS, AG, and RSG materials was investigated using a JEOL JSM-6510LV model SEM and a JEOL-JEM-2100 model TEM. Prior to TEM investigation, the samples were placed on a Cu grid and covered with an ultrathin holey/lacey carbon film after being dried at 100 °C in an oven and dispersed in pure ethanol using ultrasonication for 30 minutes. Nicolet Impact 400 D ATR-FTIR with a ZnSe crystal was used to perform ATR-FTIR on RS, AG, and RSG in the range (400–4000 cm−1). Zeta potentials were determined for RS, AG, and RSG in order to calculate pHPZC using the Zetasizer Nano S from Malvern Instrument in the UK. The measured zeta potentials (mV) were determined at different pH values (2–10).
2.4. Adsorption of phenol
Batch (static) adsorption experiments were investigated for phenol adsorption onto all the prepared solid adsorbents (RS, AG, and RSG) under different application conditions.
Phenol adsorption from aqueous medium by RS, AG, and RSG was carried out by shaking 25 mL of phenol solution having a certain concentration with 0.075 g of the investigated solid adsorbent at pH 7, for 3 h, and at 20 °C. The residual phenol concentration (Ce, mg L−1) was determined at wavelength of 273 nm by using a PerkinElmer UV-vis spectrophotometer after centrifugation to remove any residual solid particles. Three replications of each measurement were made, and the average values were used. The removal percent (R%) and adsorption capacity (qe, mg g−1) were calculated by applying eqn (3) and (4).
| |
 | (3) |
| |
 | (4) |
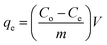
Herein the equilibrium and initial phenol concentration are identified by Ce and Co (mg L−1), respectively. m and V are related to the adsorbent mass (g) and the volume of phenol solution (L). To optimize the adsorption efficiency of phenol, the pH (2–8), shaking time up to 160 min, initial phenol concentration (20–300 mg L−1), the dosage of RS, AG, and RSG (1.0–5.0 g L−1), and adsorption temperature (20–40 °C) effects were investigated.
2.4.1. Kinetic adsorption models. The nature of phenol adsorption must be uncovered using kinetic investigations. Pseudo-first (eqn (6)), pseudo-second-order (eqn (7)), Elovich (eqn (8)), and Weber–Morris (eqn (9)) kinetic models were applied for phenol adsorption on RS, AG, and RSG samples.| |
 | (5) |
| |
 | (7) |
| |
 | (8) |
where, Ct (mg L−1), qt (mg g−1), k1 (min−1), and k2 (g mg−1 min−1) are phenol residual concentration, capacity of adsorption at certain time (t, min), PFO, and PSO rate constants. α (mg g−1 min−1), and β (g mg−1) are Elovich constants related to the rate of adsorption at the beginning, and the extent of surface coverage, respectively. The ko (mg g−1 min−1/2) and C represent on the intra-particle diffusion rate constant and the boundary layer thickness.
2.4.2. Adsorption isotherms models. Different nonlinear adsorption isotherm models were applied to determine the maximum adsorption capacity and studying the adsorption favorability onto all the prepared solid materials. Nonlinear Langmuir (eqn (10)), Freundlich (eqn (12)), and Temkin (eqn (13)) models were applied.| |
 | (10) |
| |
 | (11) |
| |
 | (13) |
where, qm (mg g−1), b (L mg−1), and RL are related to the maximum adsorption capacity calculated by Langmuir, Langmuir constant, and the dimensionless separation factor. The adsorption of phenol is known to be irreversible if (RL = 0), favorable when (0 < RL <1), and unfavorable if (RL > 1). Freundlich coefficients that related to the intensity of adsorption and the capacity of adsorption are defined by KF and n, respectively. bT (J mol−1) and KT (L g−1) are known as Temkin model constants. Ideal gas constant (8.314 J mol−1 K−1) and Kelvin temperature are denoted by R and T.
2.4.3. Effect of temperature and thermodynamic parameters. Thermodynamic parameters and the effect of applied adsorption temperature were studied for phenol adsorption onto RS, AG, and RSG at 20, 25, 30, 35, 40 °C. It is applied by shaking 25 mL of 300 mg L−1 of phenol with 0.075 g of the solid adsorbent (RS, AG, or RSG) at pH 7 under different applied temperature for 120 min. The residual concentration of phenol was determined at 273 nm by using a PerkinElmer UV-vis spectrophotometer after centrifugation. Different thermodynamic parameters namely; the change in free energy (ΔG°, kJ mol−1), enthalpy (ΔH°, kJ mol−1), and entropy (ΔS°, kJ mol−1 K−1) were calculated. The change in enthalpy and entropy were calculated from the slope and intercept of Van't Hoff model (eqn (14)) while the change in free energy from eqn (16).| |
 | (14) |
| |
 | (15) |
Herein, Cs and Ce (mg L−1) are phenol concentration on the adsorbent surface and concentration of phenol solution at equilibrium, respectively. T (K), and R are the Kelvin absolute temperature and ideal constant of gas while Kd is the adsorption distribution constant (eqn (15)).
2.5. Desorption of phenol and reusability of solid adsorbent
Utilizing of 0.5 g of the dried pre-loaded phenol RSG was mixed with 100 mL of distilled water, ethanol, benzene, hydrochloric acid (0.1 mol L−1), or sodium hydroxide (0.1 mol L−1) to study the desorption process. The mixture was then shaken for 8 hours at 20 °C. After filtration, the amount of desorbed phenol in the filtrate was determined. The following equation was used to get the desorption efficiency percent:20| |
 | (17) |
where C (mg L−1) is the equilibrium phenol concentration after the desorption process from RSG. V (L) is the volume of desorbing agent. X (mg g−1) is the maximum capacity of RSG adsorption. m (g) is the RSG mass.
After seven cycles of phenol adsorption/desorption treatments, an analysis of the adsorbent's reusability was conducted. Phenol adsorption was carried out by RSG under 3 g L−1 as adsorbent dosage, pH 7, 300 mg L−1 as adsorbate concentration, 120 min of shaking time, and at 20 °C. After each cycle, the RSG was filtered and washed several times with 30 mL of 0.1 mol L−1 NaOH to remove the pre-adsorbed phenol, washed with distilled water, and dried at 90 °C for the next reuse.
3. Results and discussion
3.1. Solid samples characterization
Thermogravimetric analysis (TGA) is a technique used in order to evaluate the thermal stability of the prepared solid materials at temperatures ranging from room temperature to 800 °C. TGA was studied by relating the mass of the sample versus temperature (Fig. 1 and Table S1†). At 120 °C, rice husk powder showed a mass loss of 4.6%, which is associated with the removal of moisture content and indicates the existence of multiple polar surface chemical groups. Thermal decomposition of cellulose and hemi-cellulose present in RH can be detected by the loss between 245 and 450 °C (22–60%). The previous breakdown occurs in the formation of water, hydrogen, and carbon dioxide as incondensable gases and wood tars, acetic acid, and methanol as condensable vapors.14 Raising temperature of RH up to 800 °C is accompanied by extra mass loss of 15.1% which is attributed to the decomposition of stable lignin.21 At 120 °C both of AG and RSG showed mass loss of 4.7 and 6.7% based on the removal of surface water molecules and showed the existence of additional pores and surface-active sites in the case of fabricated RSG. Calcium alginate showed mass loss of 22.8–59.4% in the range between 250 and 550 °C and is related to the chain's dissociation and bond decomposition of polymer chains of alginate at temperature. Excessive heating up to 800 °C is accompanied by another 8.1% mass loss and is related to the pyrolysis of polymer between 50 and 800 °C.22 TGA curve for RSG shows a higher thermal stability in comparing with the unmodified AG but less than RS. RSG displayed a mass loss of 37% greater than RS and 24% less than AG at 800 °C, suggesting the formation of a composite between RS and the biopolymer network. The resulting composite can be identified by the increased abundance of surface chemical functional groups that resulted from a combination of calcium alginate and silica nanoparticles. It is expected that the resulting composite will have more effective adsorption capacity.
 |
| | Fig. 1 TGA (a), nitrogen adsorption/desorption (b), FTIR (c), and zeta potential (d) for RS, AG, and RSG in addition to TGA of RH. | |
Nitrogen adsorption/desorption isotherm and related textural parameters are considered as highly significant to identify the adsorption capacity of the investigated solid materials. Nitrogen adsorption isotherms of AG, RS and RSG are displayed in Fig. 1b and the calculated parameters are presented in Table 1. The results of the plots indicate that; for both RS and RSG type-IV isotherm, according to IUPAC classification which prove the mesoporous structures of materials. The RSG showed hysteresis loop of type H3, which is related to the capillary condensation in the adsorption system with slit-shaped pores. The H2 hysteresis loop that silica nanoparticles exhibited is indicative of bottleneck constrictions and is commonly associated with disordered materials where the distribution of pore size and shape is not well defined.23,24 The calculated surface area of RS > RSG > AG (893.1, 452.4, and 73.1 m2 g−1, respectively). The presence of noticeable exterior porosity arising between the solid RS particles can be linked to the increased RS surface area, which is indicative of its nanostructure. The surface area of RSG is 6.2 times more than that of AG, which can be related by the presence of RS particles in between the matrix of alginate polymers and creating new pores. Total pore volume (VP, cm3 g−1) of RSG is higher than RS and AG (0.8043, 0.5842, and 0.0298 cm3 g−1, respectively) which is go in accordance with the related pore radius (, nm).
Table 1 Nitrogen adsorption parameters and pHPZC for RS, AG, and RSG
| Solid adsorbents |
SBET (m2 g−1) |
VP (cm3 g−1) |
(nm) |
pHPZC |
TEM average particle size (nm) |
| RS |
893.1 |
0.5842 |
2.308 |
6.1 |
18 |
| AG |
73.1 |
0.0298 |
2.001 |
7.1 |
63 |
| RSG |
452.4 |
0.8043 |
3.560 |
6.4 |
82 |
The crystal structure and nature of samples (RS, AG, and RSG) were explored by XRD analysis as shown in Fig. S1.† Silica nanoparticles showed a sharp peak at 2θ = 22°, which suited the (101) plane and is characteristic of amorphous silica.14,25,26 The X-ray diffractogram of RS showed no extra strong peaks, indicating that all of the silica samples are substantially amorphous.27 Calcium alginate exhibited characteristic broad peak located at 20°. The resulting composite RSG displayed PXRD with nearly identical RS peaks and a little shift in the 2θ angle, which can be connected to the interlocking of the RS and AG particles.
ATR-FTIR spectra was conducted for the prepared materials to study their chemical structure and surface functional groups as depicted in Fig. 1c. Two bands can be observed in the AG spectra at around 3668 and 3617 cm−1. These bands are related to the starching vibration of O–H bonds.28 The carboxyl group exhibited asymmetric and symmetric stretching peaks at 1631 and 1526 cm−1, respectively. Additionally, the band displayed around 680 cm−1 belonged to the metal–oxygen bond (Ca–O) vibration and the findings suggest that the Ca-alginate sample was prepared with a known structure.29,30 For the RS sample FT-IR spectra, the most prominent band appears at 1071 cm−1 and it described the starching vibration of Si–O bond. The bending vibration of Si–O–Si bonds are consistence with the typical bands located at 797 and 451 cm−1.31,32 The RSG spectra show the typical bands of the AG and RS spectrums; a small shift in the peak positions indicates possible interactions between the two components. The peak position shift can be attributed to the intermolecular hydrogen bonding between silica and water molecules employed in the preparation process as well as the intramolecular hydrogen bonding in alginate molecules that originated between –O– and –OH groups.33 The broad band observed at approximately 3400 cm−1 is associated with the O–H groups in alginate structure as well as the O–H groups of water molecules that absorb on the surface. Bands at 1598 and 1415 cm−1 are associated with calcium alginate structure. Besides, bands at 1071, 797 and 451 cm−1 represent the silica structure.34
Detecting the pH of point of zero charge (pHPZC) of adsorbents is important characteristic property that should be considered in adsorption studies. As shown in Fig. 1d and illustrated in Table 1, AG has the highest pHPZC value (pH 7.1) over the adsorbents while RS has the lowest (pH 6.1). However, it is noted that incorporate SiO2 into the structure of calcium alginate lower the pHPZC of alginate by pH 0.7. This might be because; increasing the acidic functionality that originated from RS on the alginate surface and, the resulting interactions between the two components of RSG composite signifying the formation of the composite.35
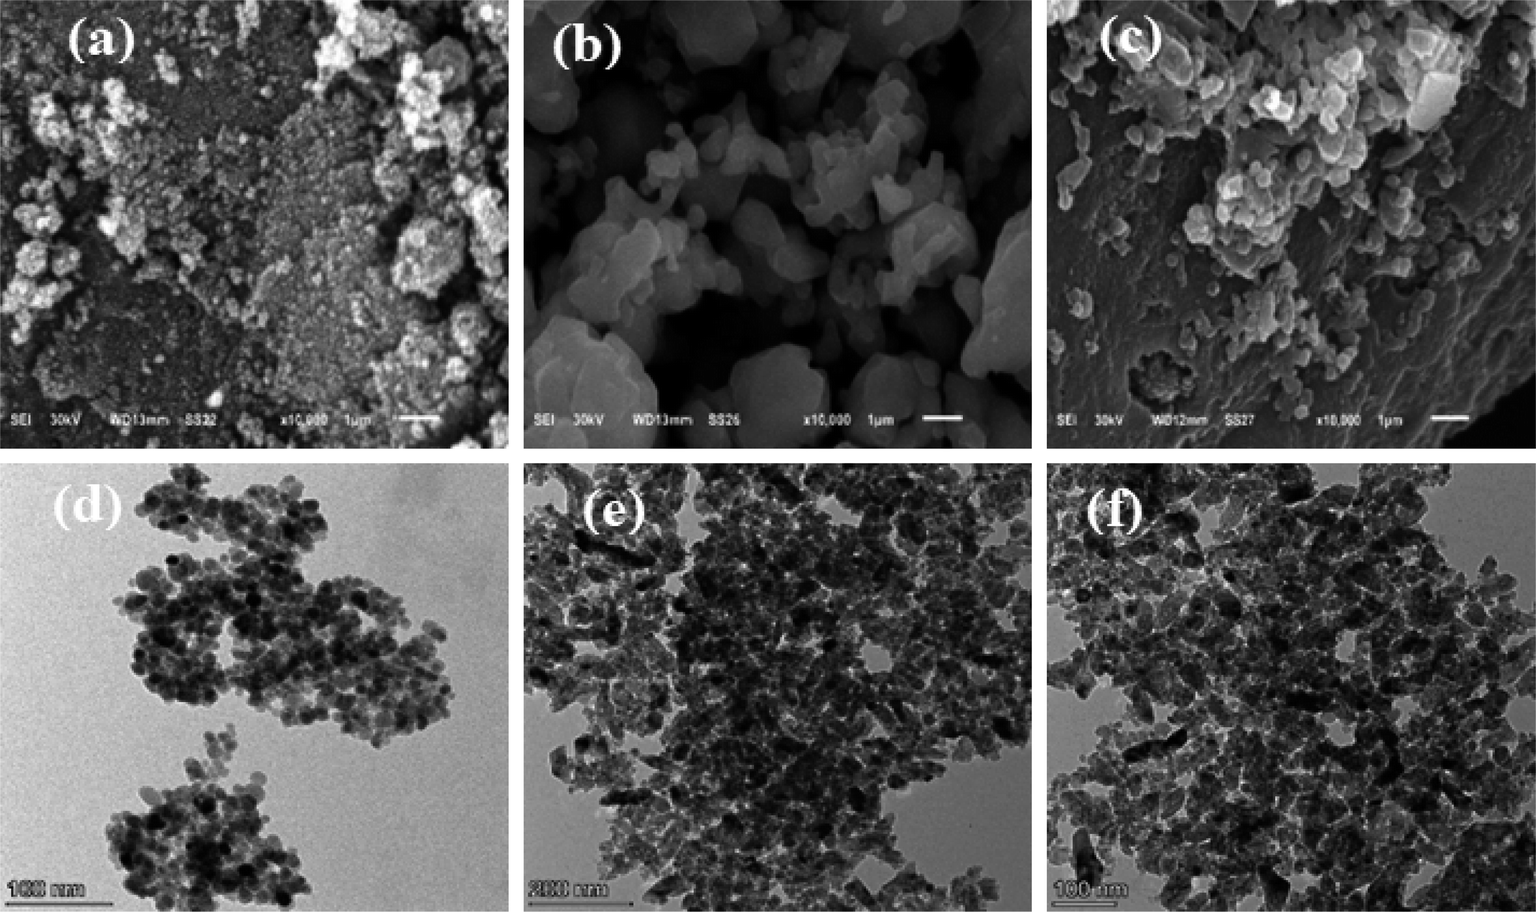
The prepared adsorbents surface morphology was depicted using SEM (Fig. 2a–c) for RS, AG, and RSG, respectively. The granular touch on the RS surface is irregular, whereas the AG surface showed a flat, plate-like structure with different sizes and shapes. On the other hand, RSG composite has an alginate surface that is smooth and appears as a darker background with bright, spherical SiO2 particles that are distributed throughout the alginate surface. Thus, more pores and crack with different size and shape were noticed in the composite.36 Average TEM particle sizes were varied for the different adsorbents being 18, 63, 82 nm for RS, AG and RSG, respectively. Additionally, a transparent halo surrounding the darker silica particles cores could be a sign that the silica nanoparticles have been coated with alginate.37 Analysis of TEM images showed spherical shape nanoparticles of RS, and irregular shape of nanoparticles assigned to representing RSG composite formation.
 |
| | Fig. 2 SEM (a–c) and TEM (d and e) images for RS, AG, and RSG, respectively. | |
3.2. Static adsorption of phenol
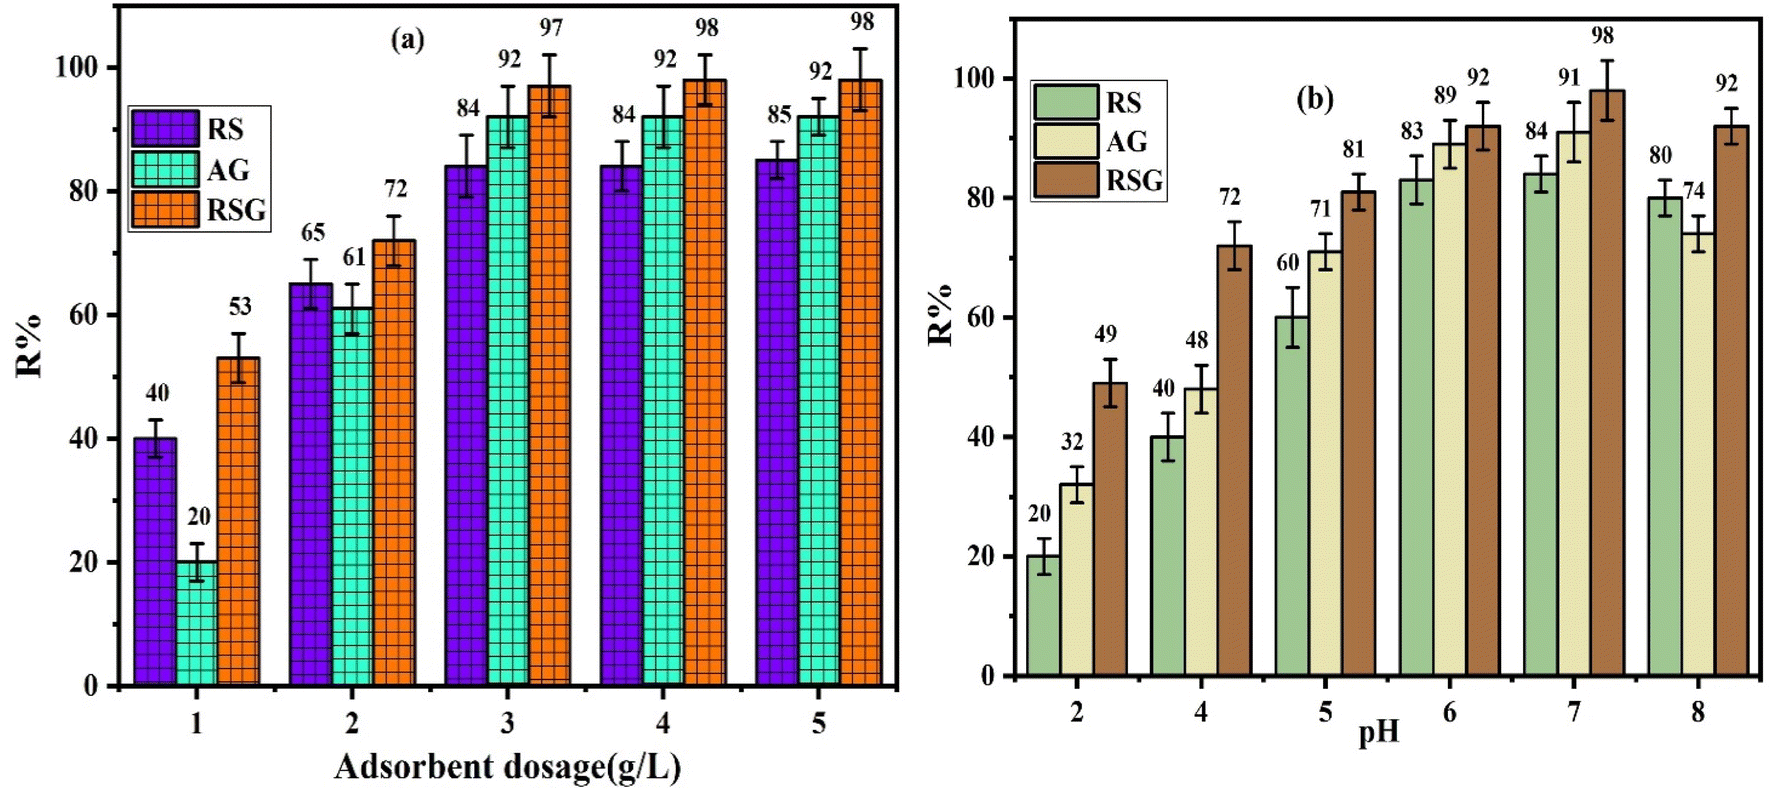
3.2.1. Effect of adsorbent dosage. Efficient removal through adsorption requires careful consideration of several essential parameters, one of which is optimizing the quantity of adsorbent. Fig. 3a illustrates how the masses of RS, AG, and RSG affect the removal percent (R%, eqn (3)) when their values are changed from 1 to 5 g L−1 by the consumption of 25 mL of 200 mg L−1 as initial concentration of phenol, at 20 °C, and pH 7 for 180 minutes of shaking time. As seen in Fig. 3, increasing the dosage of the adsorbent from 1 to 3 mg L−1 results in an important rise in the removal percentages for RS, AG, and RSG, which are 44, 72, and 44%, respectively. The observation can be explained by the fact that more active sites are available on the surface of adsorbents when their quantity increases, allowing for the adsorption of phenol molecules.38,39 Despite the presence of more active sites on solid adsorbent surface, at dosages more than 3.0 g L−1, there is no apparent increase in the removal% due to the establishment of the adsorption equilibrium at lower phenol concentration and the decrease in phenol/active sites ratio.40 However, it is important to note that RSG adsorbent exceeds RS and AG with regard to removal efficiency, outperforming them by 13% and 6%, respectively. The optimum dosage of adsorbents for this study was kept at 3 g L−1.
 |
| | Fig. 3 Effect of adsorbent dosage (a) and pH (b) on phenol adsorption on RS, AG, and RSG at 20 °C. | |
3.2.2. Effect of initial solution pH. Acidity of the adsorption medium (pH) is a significant factor for adsorption process to identify the most suitable value at which adsorption is most efficient, where pH has an impact on the surface chemistry of the adsorbent and adsorbate, changing their electrostatic interaction and having a major effect on the adsorption process. In this regard, several pH values (2–8) were used in this study to examine the effect of the solution initial pH value on phenol removal process, while other parameters remained constant (25 mL of 200 mg L−1 of phenol solution was mixed with 3 g L−1 of adsorbents dosage and shaking time was 180 min at 20 °C). Effect of pH is shown in Fig. 3b and important findings were obtained; (i) the percentage of phenol removed at lower pH values was very low (<49% at pH 2) for all the investigated solid adsorbents. The first factor that possibly responsible for the reduction in the adsorption process is the competition between phenol molecules and H3O+ which prevents phenol molecules from reaching the surface of the adsorbent.41,42 Second, the phenol molecules and the solid adsorbent surface are both positively charged at lower pH values, which inhibits the adsorption process. Where, at pH < pHPZC the solid surfaces are positively charged.43 (ii) The total removal percentage of phenol onto RS, AG, and RSG increases by 64%, 59%, and 49%, respectively, when the medium pH is raised from 2 to 7. The conversion of phenol to the negatively charged phenolate ion, which strongly attracts to the solid adsorbent surface in addition to the decrease in protons that prevent phenol adsorption, can be linked to the increase in phenol adsorption.41,44 (iii) A slight drop in removal percentage is seen at pH values greater than 7, which caused by the negatively charged solid surface that developed at pH > pHPZC and the negatively charged phenolate ions' electrostatic repulsion.45 The previous study confirmed that, pH 7 is the optimal value for phenol adsorption into all the studied solid adsorbents.
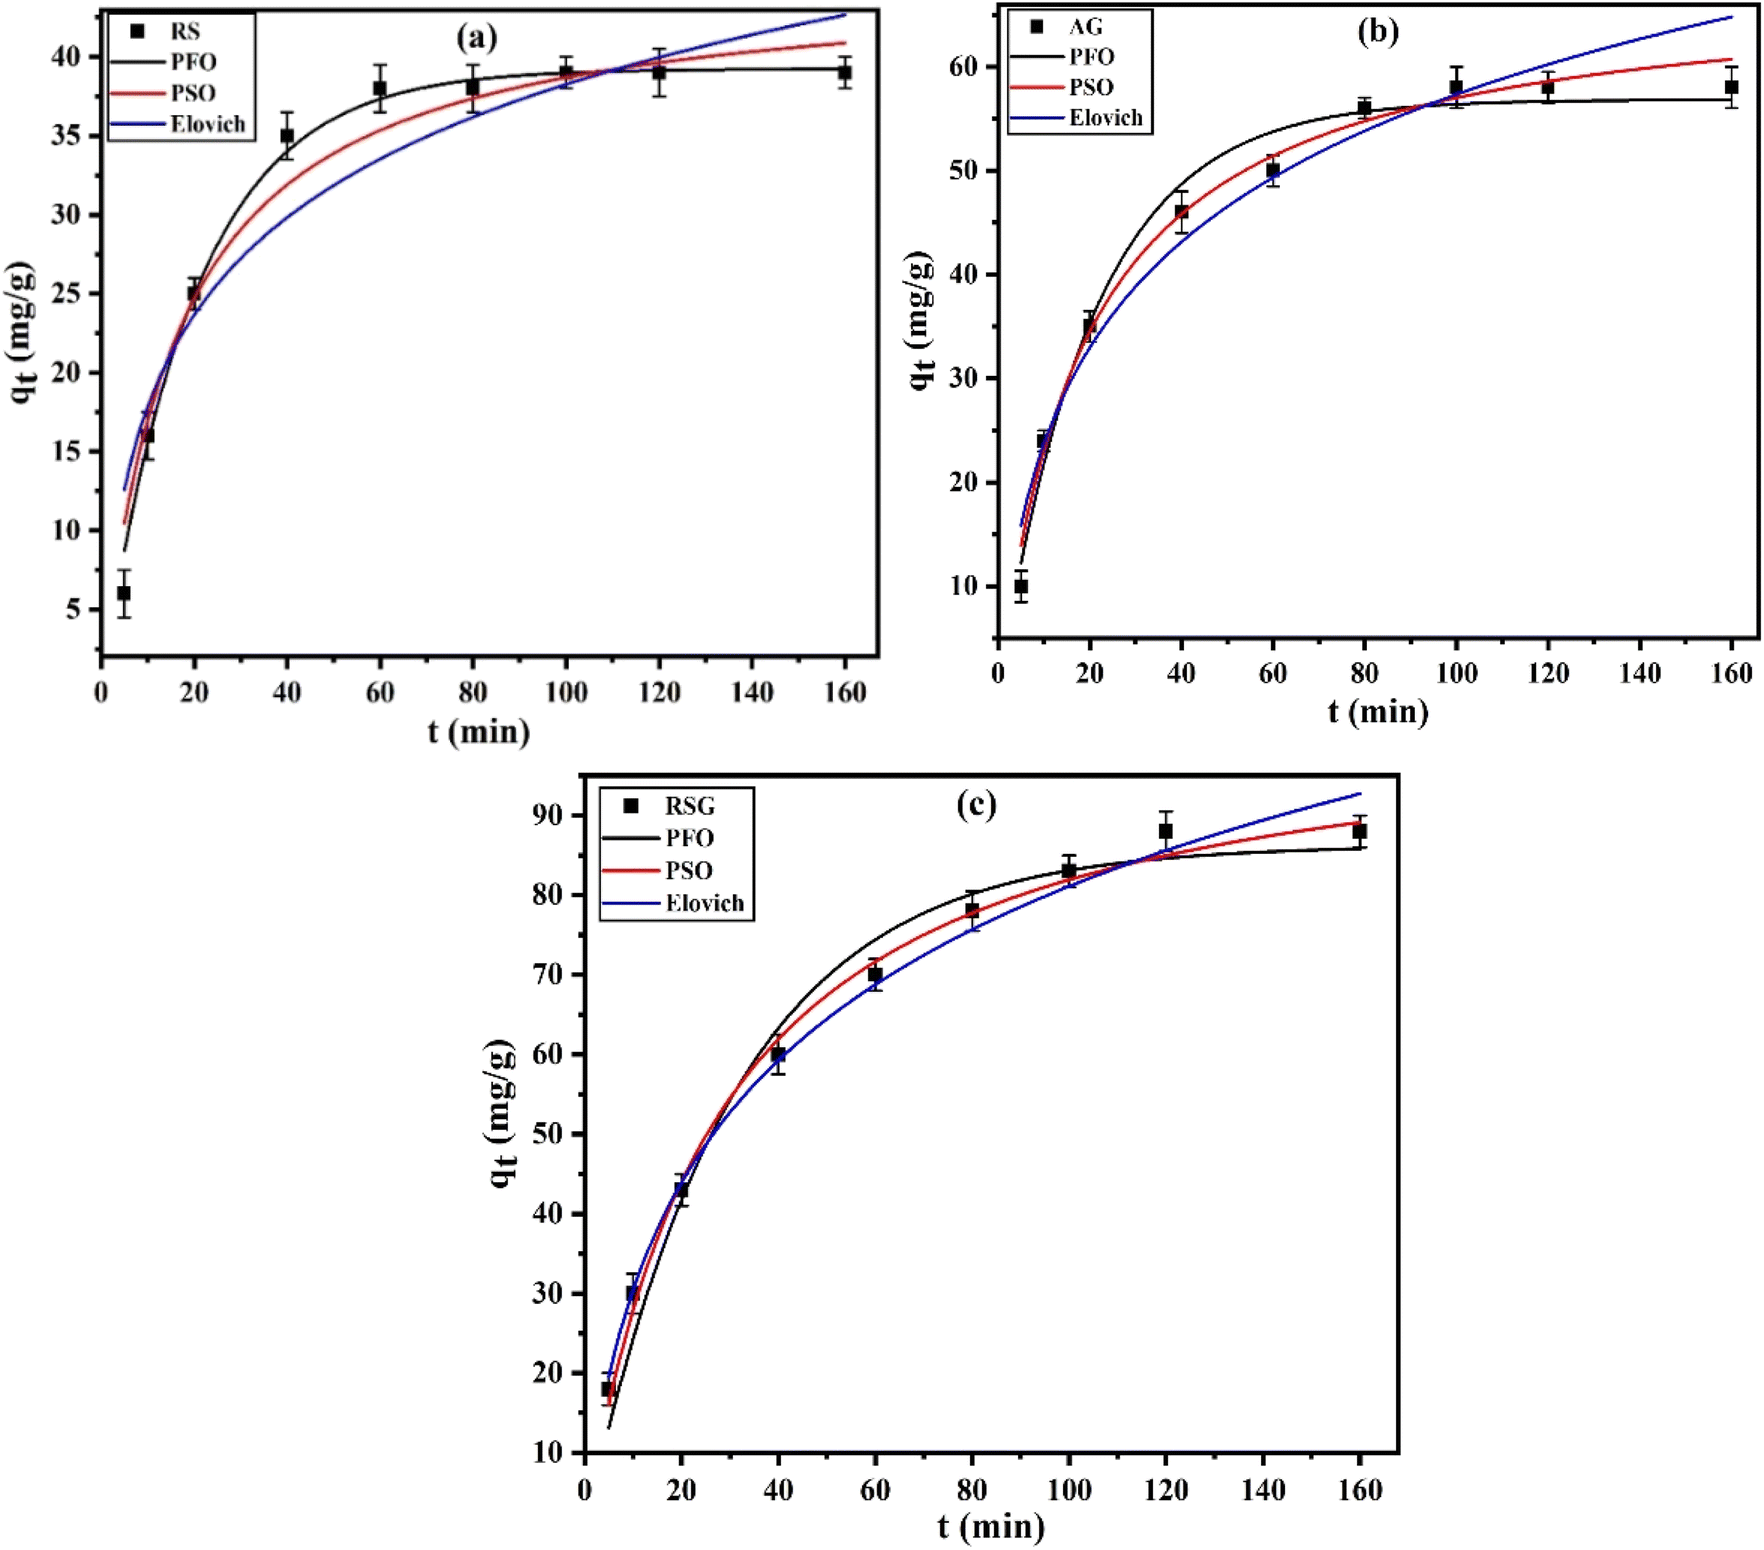
3.2.3. Effect of contact time and adsorption kinetics. The adsorption kinetics and the time needed to achieve the equilibrium state are directly affected by the absorbent/adsorbate contact time, which makes it essential to understand the adsorption mechanism. The influence of shaking time on adsorption was investigated at various agitation times up to 160 min, with a 25 mL solution containing 200 mg L−1 of phenol and 3 g L−1 of adsorbent dose, at pH 7 and 20 °C. Fig. 4a–c showed the influence of shaking duration as displayed by dots beside the PFO (eqn (6)), PSO (eqn (7)), and Elovich (eqn (8)) nonlinear kinetic models for phenol adsorption onto RS (Fig. 4a), AG (Fig. 4b), and RSG (Fig. 4c) at 20 °C, respectively and the calculated kinetics parameters are displayed in Table 2. Within the first 120 min (equilibrium time), it was evident that the adsorption capacity increased rapidly for RS, AG, and RSG by 6.5, 11.6, and 4.9 times, respectively. The result was caused by the high availability of binding sites on the adsorbent surface during the first step and the strong driving force of the concentration of phenol ions in the solution.22 When the adsorption capacity was saturated with phenolate ions at 120 min, there was no apparent rise in it. Based on the analysis of the data in Table 2, (i) the most appropriate choice for fitting the phenol adsorption onto the three tested adsorbents (RS, AG, and RSG) was determined to be a pseudo-second-order nonlinear kinetic model, where correlation coefficients (R2) are greater than 0.9809 and there is a slight difference (0.1–4.1%) between the Langmuir model (qm) and the calculated adsorption capacities of PSO (qexp). The rate constants (k2) of PSO ranged between 3.457 × 10⁻⁴ to 12.300 × 10⁻⁴ g mg−1 min−1. (ii) Although possessing higher R2 values (0.9772–0.99909), the PFO kinetic model is not suitable to represent the phenol adsorption onto the prepared samples because of the significant difference (15.9, 15.4, and 14.3% for RS, AG, and RSG, respectively) between qm and qexp values. (iv) The calculated Elovich correlation coefficient values (>0.9557) proved the best function of this model for phenol adsorption onto the investigated solid adsorbents. The observed initial rate constant (α) for RSG > AG > RS (5.8143 > 5.5050 > 4.4003 mg g−1 min−1), representing the increase in the initial rate of phenol adsorption. Conversely, β tendency (RS > AG > RSG) shown the faster surface coverage of RS with phenolate ion.46 Correlation coefficients R2 (0.8820–0.9788) indicated the best fitting of Weber-Morris (intra-particle diffusion) model for phenol adsorption onto the prepared adsorbents. The intercept (C) values show that the intra-particle diffusion effect was not the only factor affecting phenol adsorption.20 The positive C values (0.2492–5.2449) indicated the quick adsorption of phenol, particularly onto the RSG surface. A greater attraction force between the phenol molecules and the newly chemical functional groups on the RSG surface was displayed by the rate constant (ko) values.
 |
| | Fig. 4 Effect of shaking time as dots, PFO, PSO, and Elovich nonlinear kinetic models for phenol adsorption onto RS (a), AG (b), and RSG (c) at 20 °C, respectively. | |
Table 2 Pseudo-first, pseudo-second order, Elovich, Langmuir, Freundlich, and Temkin parameters for adsorption of phenol onto RS, AG, and RSG at 20 °C
| Models |
Parameters |
RS |
AG |
RSG |
| PFO |
qexp (mg g−1) |
39.32 |
57.32 |
86.31 |
| k1 (min−1) |
0.0500 |
0.0449 |
0.0330 |
| R2 |
0.9909 |
0.9846 |
0.9772 |
| PSO |
qexp (mg g−1) |
46.02 |
67.65 |
104.77 |
| k2 (g mg−1 min−1) × 10−4 |
12.300 |
7.550 |
3.457 |
| R2 |
0.9809 |
0.9870 |
0.9943 |
| Elovich |
α (mg g−1 min−1) |
4.4003 |
5.5050 |
5.8143 |
| β (g mg−1) |
0.0967 |
0.0644 |
0.0388 |
| R2 |
0.9557 |
0.9635 |
0.9912 |
| Weber-Morris |
ko (mg g−1 min−1/2) |
4.7591 |
5.8281 |
7.9503 |
| C |
0.2492 |
4.1516 |
5.2449 |
| R2 |
0.8820 |
0.9231 |
0.9788 |
| Langmuir |
qm (mg g−1) |
46.72 |
67.71 |
100.55 |
| b (L mg−1) |
0.1274 |
0.1423 |
0.1707 |
| RL |
0.0763 |
0.0558 |
0.0362 |
| R2 |
0.9918 |
0.9858 |
0.9819 |
| Freundlich |
n |
2.8769 |
2.6254 |
2.6911 |
| KF |
11.0784 |
15.0912 |
24.5388 |
| R2 |
0.9356 |
0.9619 |
0.9618 |
| Temkin |
bT (J mol−1) |
250.198 |
164.637 |
125.163 |
| KT (L g−1) |
1.3493 |
2.0440 |
2.3411 |
| R2 |
0.9817 |
0.9847 |
0.9834 |
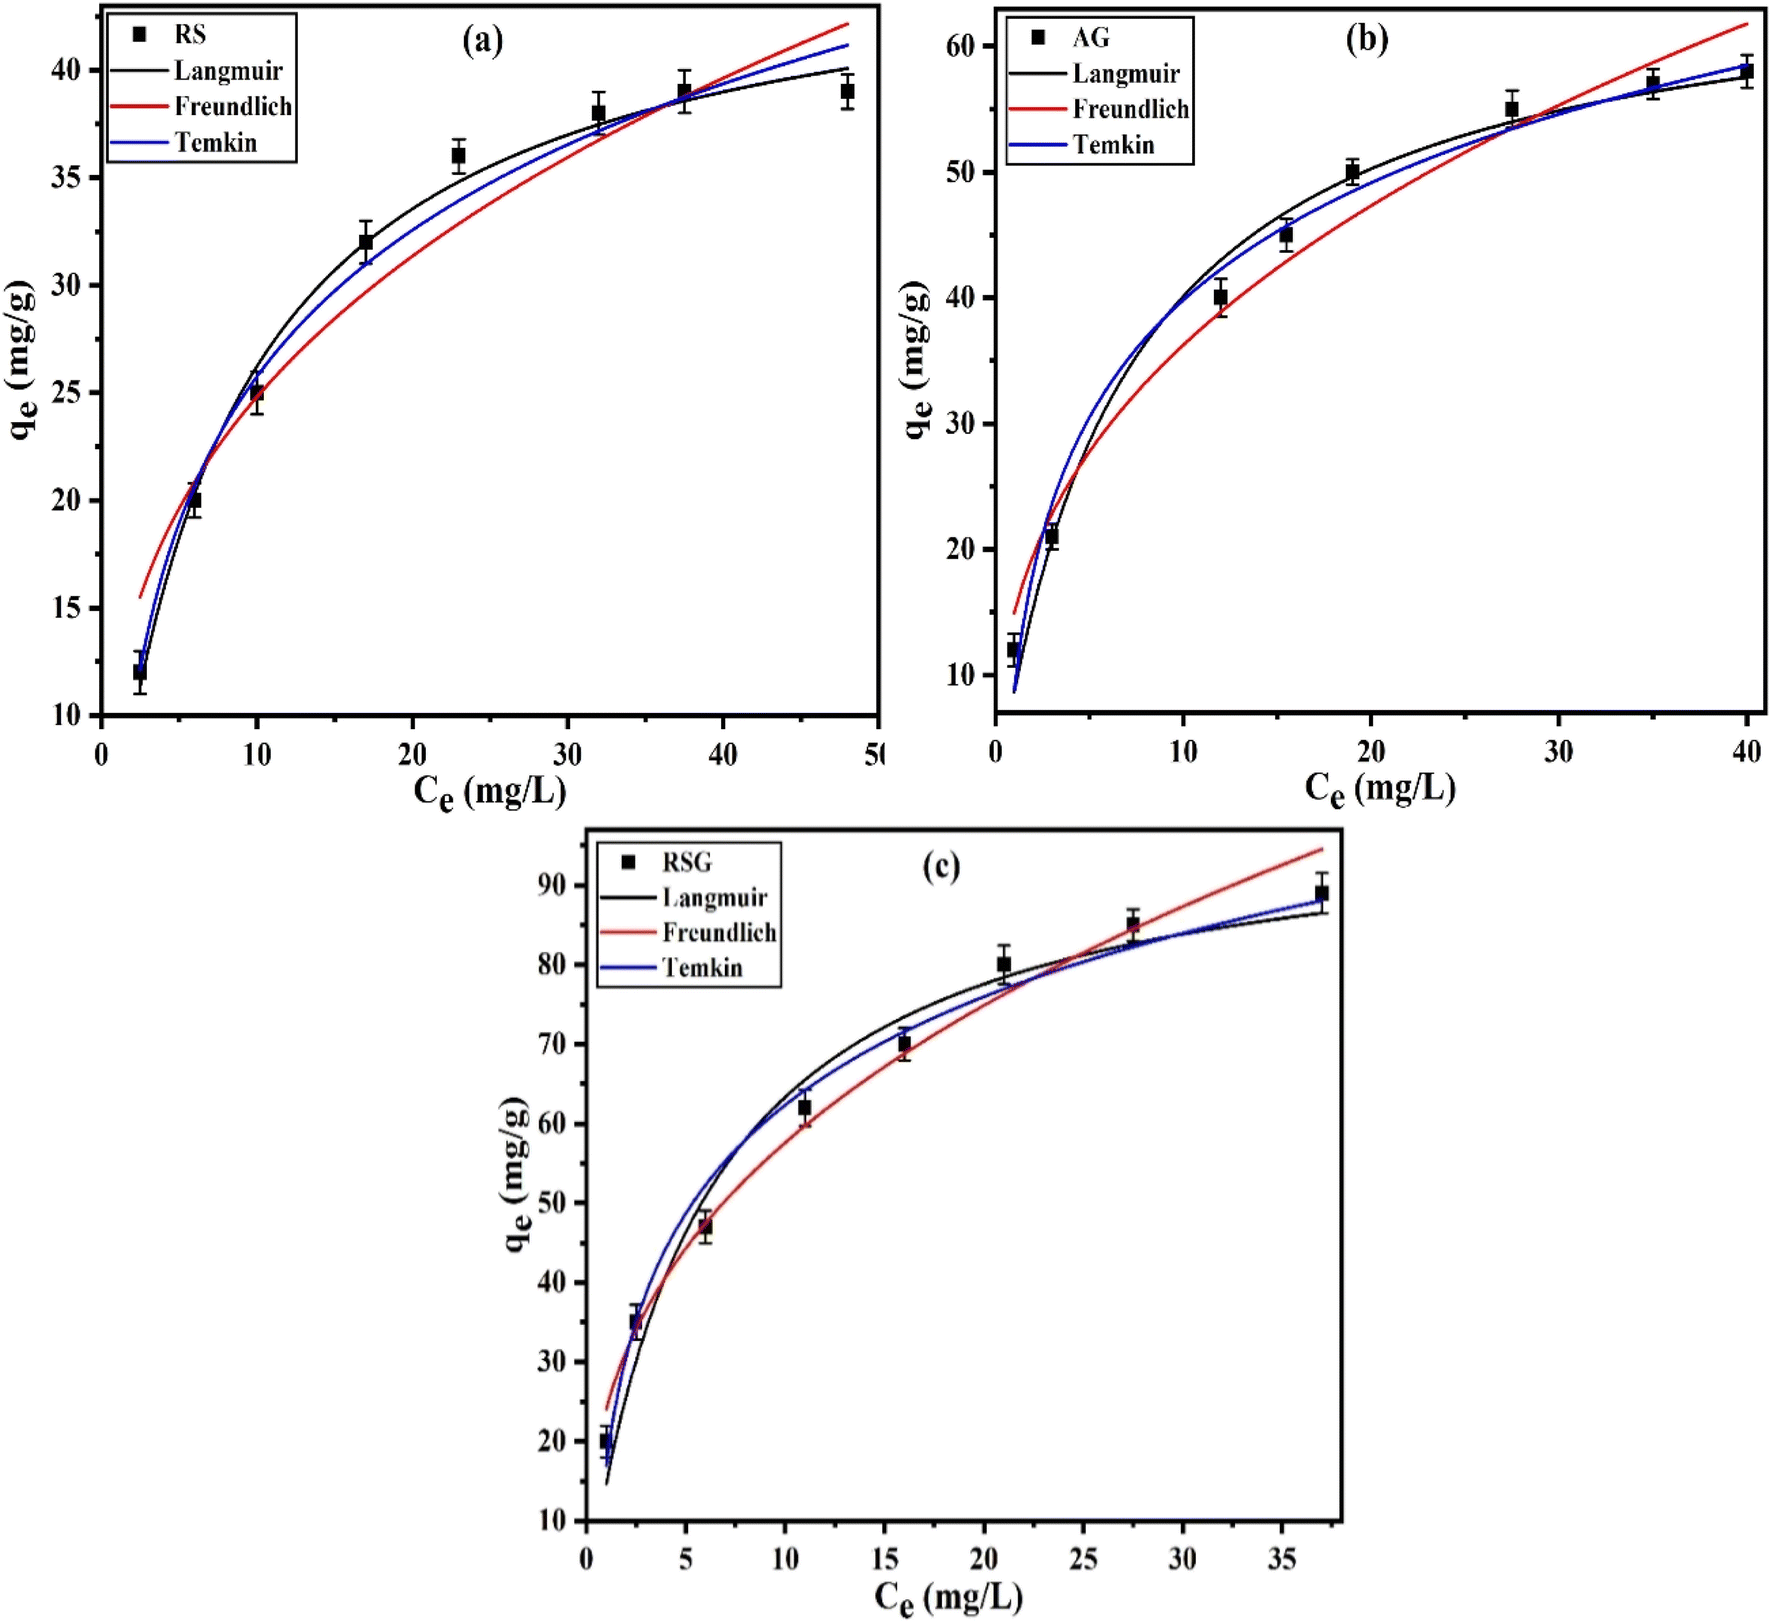
3.2.4. Adsorption isotherm and effect of initial phenol concentration. Studying the influence of adsorbate initial concentration on the adsorption process enables an improved understanding of the adsorption behavior and provides vision into the adsorption mechanism and identify the maximum adsorption capacity. As shown in the dots of curves of Fig. 5a–c, the effect of starting phenol concentration in the range of 20–300 mg L−1 for the removal of adsorbate onto RS, AG, and RSG was investigated using 3 g L−1 of solid dosage at 20 °C and pH 7 for 120 min of shaking time. At the beginning of the increase in initial adsorbate concentrations, significant enhancement in the adsorption capacity (qe, mg g−1) was observed because of the high affinity of phenol to the solid surface. After that, this capacity started to stabilize at the high initial concentrations, which was associated with the saturation of the active adsorption sites.
 |
| | Fig. 5 Effect of initial concentration, Langmuir, Freundlich, and Temkin nonlinear adsorption isotherm plot for the adsorption of phenol on RS (a), AG (b), and RSG (c) at 20 °C, respectively. | |
Nonlinear adsorption isotherms, specifically the Langmuir, Freundlich, and Temkin nonlinear adsorption isotherms (eqn (10), (12) and (13), respectively), which are the most commonly utilized approaches were applied for the adsorption process as depicted in Fig. 5a–c, where the calculated data listed in Table 2. Langmuir model is the most accepted model for explaining phenol adsorption onto the solids under investigation. This is because it has higher coefficients (R2) (>0.9819), which confirm that there is no common interaction between the adsorbed molecules and that monomolecular layer adsorption occurs on its surface. The adsorption capacity of RS is the higher adsorption capacity (100.55, 67.71, and 46.72 mg g−1 for RSG, AG, and RS, respectively) due to its relative higher surface area (452.4 m2 g−1) and the presence of many surfaces chemical functional groups originated from the mixing between silica and alginate. Langmuir constant (b, L mg−1) for RSG > AG > RS and indicating the strong attraction between RSG active sites and phenol. The dimensionless separation factor (RL) values were found to be less than 0.0763 and larger than 0.0362, indicating that all produced solid adsorbents had favorable adsorption for phenol.
Nonlinear Freundlich model displayed R2 values less than that calculated for Langmuir model (0.9356–0.9619), demonstrating that Freundlich isotherm is less accepted when compared with Langmuir model for phenol adsorption. KF values of RSG > AG > RS (24.5388, 15.0912, and 11.0784) are similar to the same order of Langmuir adsorption capacity. In addition, the adsorption intensity values in the range 2.6254–2.8769 (1 < n < 10) demonstrated the excessive rapidity and favorability of phenol adsorption. These values of n are less than 10, showing that phenol is physically adsorbed onto the adsorbents.46
The Temkin nonlinear adsorption model possessed R2 values greater than 0.9817, indicating that this isotherm is well fitting. The Temkin parameter values are slighter than 8000 J mol−1 (bT, 125.163–250.198 J mol−1) and signifying the physical adsorption of phenol onto the used adsorbents, also following the sequence (RS > AG > RSG) which displayed that RSG needed the least heat during the adsorption process.47 The advanced phenol uptake of phenol by RSG can be evaluated from the highest value of Temkin constant (KT, 2.3411 L g−1).
Finally, it is concluded that Langmuir nonlinear adsorption model is more accepted than Freundlich model beside the well application of Temkin model. RSG showed the maximum adsorption capacity when compared with RS and AG.
3.2.5. Effect of temperature and thermodynamics. The effect of adsorption temperature and thermodynamics parameters, involving Gibbs free energy change (ΔG°, kJ mol−1), enthalpy change (ΔH°, kJ mol−1) and entropy change (ΔS°, kJ mol−1 K−1) were considered for the adsorption of phenol onto all the prepared solid adsorbents by applying eqn (14) and (16). It is achieved by mixing 0.075 g of adsorbent with 25 mL of 300 mg L−1 phenol at pH 7 and at temperatures of 20, 25, 30, 35, and 40 °C. Van 't Hoff plot is portrayed in Fig. 6a and the calculated thermodynamic parameters presented in Table 3. Considering the data in Table 3. (i) The higher correlation coefficient values (0.9763–0.9993) reflect how effectively Van't Hoff plots are applied for phenol adsorption onto all solid materials. (ii) Endothermic adsorption processes are suggested by the rise in the change in enthalpy (ΔH°, 0.0078–0.0103 kJ mol−1) that occurs with the phenol's adsorption on all solid adsorbents. (iii) The phenol molecules at the adsorbent/adsorbate phases are more random due to the positive values of entropy change (ΔS°, 0.0319–0.0383 kJ mol−1 K−1).48 (iv) The negative free energy values at all the examined temperatures depict the spontaneous nature of pollutant adsorption onto RS, AG, and RSG surfaces. The increase in ΔG° with temperature indicates the improvement of phenol adsorption at a higher applied temperature. It has been determined that physical and chemical adsorption occur when ΔG° changes between 0 and −20 and −80 and −400 kJ mol−1, respectively. Consequently, ΔG° values (−9.339 to −11.978 kJ mol−1) reveal the physical adsorption of phenol onto all the investigated solids.12,48
 |
| | Fig. 6 Van't Hoff plot for phenol adsorption onto RS, AG, and RSG (a) at 20, 25, 30, 35, 40 °C. Desorption of phenol from the surface of RSG and inserted reusability curve (b) at 20 °C. | |
Table 3 Thermodynamic parameters for phenol adsorption on RS, AG, and RSG at 293, 298, 303, 308, and 313 K
| Parameters |
|
RS |
AG |
RSG |
| R2 |
|
0.9993 |
0.9763 |
0.9806 |
| ΔH° (kJ mol−1) |
|
0.0103 |
0.0102 |
0.0078 |
| ΔS° (kJ mol−1 K−1) |
|
0.0372 |
0.0383 |
0.0319 |
| −ΔG° (kJ mol−1) |
293 K |
10.889 |
11.212 |
9.339 |
| |
298 K |
11.075 |
11.403 |
9.498 |
| |
303 K |
11.261 |
11.595 |
9.658 |
| |
308 K |
11.447 |
11.786 |
9.817 |
| |
313 K |
11.633 |
11.978 |
9.977 |
3.2.6. Reusability of RSG composite. Adsorbents reusability study is essential because it plays a major role in establishing the adsorbents effectiveness environmental sustainability, and viability from an economic standpoint. Fig. 6b showed the desorption of phenol from the surface of RSG and the reusability curve as inserted. Sodium hydroxide solution seemed as the most effective eluent solution as it helps to regenerate the RSG composite by removing 94% of phenol from the adsorbate surface which can be related to the formation of soluble sodium phenolate.49 After seven cycles of phenol adsorption/desorption cycle regenerating the RSG composite loss about 8.8% from the removal efficiency% and can be related to the loss of some surface-active sites beside the possible particle coagulation result in decrease in surface area.50The intermolecular attraction between the solid adsorbent and the phenol, resulting in the phenol molecules accumulating on the adsorbent surface, is the starting point for the adsorption process. The adsorption mechanisms that take place between the phenol and the generated composite (RSG) involve physical interactions such as hydrophilicity, π–π interactions, electrostatic attraction, H-bonding, and coulombic attraction. For example, H-bonding between –OH groups of phenol and the –OH groups of prominent outward from the silica or –OH groups of alginates. Furthermore, the surface of the composite becomes more hydrophilic by the presence of –OH and –COO−, which encourages hydrophobic interactions with organic contaminants that have a high degree of hydrophobicity.51,52
3.3. RSG efficiency in comparison with other materials
The maximum Langmuir adsorption capacity of RSG for the removal of phenol via adsorption in contrast with that of the other adsorbents is presented in Table 4.15,38,43,44,48,49,53,54
Table 4 Comparing the maximum adsorption capacity of RSG with other materials
| Adsorbents |
qm (mg g−1) |
References |
| Cellulose-based thermosensitive supramolecular hydrogel |
80.71 |
15 |
| Immobilized Chlorophyta algae |
5.56 |
38 |
| Ziziphus leaves adsorbent |
15 |
43 |
| Multi-functional core–shell pomegranate peel amended alginate beads |
119.48 |
44 |
| Rice stalk-derived activated carbon |
80.37 |
48 |
| Activated carbon |
94.72 |
49 |
| Moroccan clay/hematite composite |
20.24 |
53 |
| Hematite iron oxide nanoparticles |
5.35 |
54 |
| Silica/alginate nanocomposite |
100.55 |
[This study] |
The increased surface area and the presence of several chemical functional groups on surfaces may be the reasons for RSG's better efficiency when compared to the tabulated solid materials. The results in Table 4 demonstrate that RSG is a feasible solid adsorbent for the removal of phenol from an aqueous medium due to its higher adsorption capacity.
4. Conclusion
The use of natural adsorbents in systems for treating contaminated water is a very promising approach that improves the removal of organics from wastewater. This work focuses on the static adsorption of phenol from water using various kinds of adsorbents, such as calcium alginate matrix (AG), silica nanoparticles made from rice husk (RS), and silica/alginate nanocomposite (RSG). After full thermal, textural, and chemical characterization of that solid materials, RSG exhibited a unique property which enhanced its adsorption efficiency. RSG is characterized by a relatively higher surface area (452.4 m2 g−1), smaller average particle size (82 nm), and the presence of different surface chemical functional groups as presented by ATR-FTIR analysis. Static adsorption of phenol using all the solid materials showed the higher efficiency of RSG with 100.55 mg g−1 as adsorption capacity, favorable, spontaneous, and physical adsorption process. The equilibrium adsorption time was validated after 120 minutes, and kinetic investigations demonstrate the effective use of the PSO nonlinear model with an average rate constant of 7.967 × 10⁻⁴ g mg−1 min−1. The applicability of the Van't Hoff model with a higher correlation coefficient (0.9763–0.9993) was demonstrated by thermodynamic investigations. The positive free energy change in entropy (ΔS°, 0.0319–0.0383 kJ mol−1 K−1) and the negative free energy changes (ΔG°, −9.339 to −11.978 kJ mol−1) reflects the increases in randomness of phenol molecules at the solid adsorbent surface beside the spontaneous physical adsorption of pollutant ions. The fabricated composite's elevated adsorption capability towards phenol can be related to the existence of many active sites in addition to its greater surface area. The adsorption of phenols from aqueous medium with higher concentrations is a characteristic of the silica/alginate composite that is being employed. Studies on solid desorption and reusability have demonstrated that sodium hydroxide is a highly effective desorbing agent for phenol because it yields sodium phenolate ions. The produced composite is sustainable due to its many reusability phases and little adsorption capacity loss. RSG composite that is thermally stable, has a nearly neutral pHPZC point, a relatively higher surface area, and many surface chemical function groups. Phenols are effectively removed from the hydrogel matrix by introducing silica nanoparticles. According to previous studies, merging silica nanoparticles from rice husk, significant agricultural solid waste, with a calcium alginate matrix provides a useful, safe, and effective solid adsorbent for organic contaminants. As a recognized method of plant treatment, the resulting composite may be evaluated and tested for phenol removal from columns.
Data availability
The author declares that no primary research results, software or code have been included and no new data were generated or analyzed as part of this article.
Conflicts of interest
The author declares that they have no known competing financial interests or personal relationships that could have appeared to influence the work reported in the submitted manuscript.
Acknowledgements
No funding was received for this research work.
References
- C. Tortajada, npj Clean Water, 2020, 3, 22 CrossRef CAS.
- E.-J. Cho, C.-G. Lee, J.-K. Kang and S.-J. Park, Biomass Convers. Biorefin., 2024, 14, 9621–9638 CrossRef CAS.
- L. Lupa, N. S. Tolea, M. Iosivoni, B. Maranescu, N. Plesu and A. Visa, RSC Adv., 2024, 14, 4759–4777 RSC.
- P. Alimohammadi, M. Shahabi Nejad, M. R. Miroliaei and H. Sheibani, Chem. Eng. Process.: Process Intensif., 2022, 176, 108971 CrossRef CAS.
- Z. U. Zango, N. S. Sambudi, K. Jumbri, A. Ramli, N. H. H. A. Bakar, B. Saad, M. N. H. Rozaini, H. A. Isiyaka, A. M. Osman and A. Sulieman, Water, 2020, 12, 1–40 CrossRef.
- H. Jiang, Y. Fang, Y. Fu and Q. X. Guo, J. Hazard. Mater., 2003, 101, 179–190 CrossRef CAS PubMed.
- B. Boukoussa, A. Mokhtar, A. El Guerdaoui, M. Hachemaoui, H. Ouachtak, S. Abdelkrim, A. A. Addi, S. Babou, B. Boudina, A. Bengueddach and R. Hamacha, J. Mol. Liq., 2021, 333, 115976 CrossRef CAS.
- F. Sun, J. Guo, Y. Liu and Y. Yu, Int. J. Biol. Macromol., 2019, 137, 420–425 CrossRef CAS PubMed.
- Y. Zhou, J. Lu, Y. Zhou and Y. Liu, Environ. Pollut., 2019, 252, 352–365 CrossRef CAS PubMed.
- S. K. Papageorgiou, E. P. Kouvelos, E. P. Favvas, A. A. Sapalidis, G. E. Romanos and F. K. Katsaros, Carbohydr. Res., 2010, 345, 469–473 CrossRef CAS PubMed.
- K. S. Khairou, J. Therm. Anal. Calorim., 2002, 69, 583–588 CrossRef CAS.
- A. F. Hassan, A. M. Abdel-Mohsen and M. M. G. Fouda, Carbohydr. Polym., 2014, 102, 192–198 CrossRef CAS PubMed.
- A. Soumia, M. Adel, S. Amina, B. Bouhadjar, D. Amal, Z. Farouk, B. Abdelkader and S. Mohamed, Int. J. Biol. Macromol., 2020, 145, 466–475 CrossRef CAS PubMed.
- A. F. Hassan, A. M. Abdelghny, H. Elhadidy and A. M. Youssef, J. Sol-Gel Sci. Technol., 2014, 69, 465–472 CrossRef CAS.
- M. Guo, J. Wang, C. Zhang, X. Zhang, C. Xia, H. Lin, C. Y. Lin and S. S. Lam, Environ. Res., 2022, 214, 113863 CrossRef CAS PubMed.
- R. Benaddi, F. Aziz, K. El Harfi and N. Ouazzani, Desalin. Water Treat., 2021, 220, 297–308 CrossRef CAS.
- M. Elkady, E. Salama, W. A. Amer, E. Z. M. Ebeid, M. M. Ayad and H. Shokry, Environ. Sci. Pollut. Res., 2020, 27, 43077–43092 CrossRef CAS PubMed.
- S. K. Nadavala, K. Swayampakula, V. M. Boddu and K. Abburi, J. Hazard. Mater., 2009, 162, 482–489 CrossRef CAS PubMed.
- A. Marjani, M. H. Zare, M. H. Sadeghi, S. Shirazian and M. Ghadiri, J. Environ. Chem. Eng., 2021, 9, 104884 CrossRef CAS.
- G. R. Mahdavinia, A. Massoudi, A. Baghban and E. Shokri, J. Environ. Chem. Eng., 2014, 2, 1578–1587 CrossRef CAS.
- G.-M. Gao, D.-R. Liu, H.-F. Zou, L.-C. Zou and S.-C. Gan, Powder Technol., 2010, 197, 283–287 CrossRef CAS.
- A. F. Hassan, G. A. El-Naggar, A. G. Braish, M. M. A. El-Latif, W. A. Shaltout and M. S. Elsayed, J. Inorg. Organomet. Polym. Mater., 2024, 34, 190–206 CrossRef CAS.
- C. Buttersack, Phys. Chem. Chem. Phys., 2019, 21, 5614–5626 RSC.
- Z. A. Alothman, Materials, 2012, 5, 2874–2902 CrossRef CAS.
- M. C. D. Dominic, K. V. Neenu, P. M. S. Begum, R. Joseph, D. dos Santos Rosa, Y. Duan, A. Balan, T. G. Ajithkumar, M. Soumya, A. Shelke, J. Parameswaranpillai and M. Badawi, J. Cleaner Prod., 2023, 413, 137476 CrossRef.
- S. Radoor, J. Karayil, A. Jayakumar, D. R. Kandel, J. T. Kim, S. Siengchin and J. Lee, Carbohydr. Polym., 2024, 323, 121339 CrossRef CAS PubMed.
- Z. A. A. Halim, M. A. M. Yajid and M. Hasbullah Idris, AIP Conf. Proc., 2019, 2068 DOI:10.1063/1.5089405.
- A. F. Hassan, G. A. El-Naggar, A. G. Braish, M. M. Abd El-Latif, W. A. Shaltout and M. S. Elsayed, Int. J. Biol. Macromol., 2023, 249, 126075 CrossRef CAS PubMed.
- W. Zhao, Y. Qi, Y. Wang, Y. Xue, P. Xu, Z. Li and Q. Li, Polymers, 2018, 10, 1–11 CrossRef PubMed.
- Y. L. Lai, M. Thirumavalavan and J. F. Lee, Toxicol. Environ. Chem., 2010, 92, 697–705 CrossRef CAS.
- A. Naderahmadian, B. Eftekhari-Sis, H. Jafari, M. Zirak, M. Padervand, G. Mahmoudi and M. Samadi, Int. J. Biol. Macromol., 2023, 247, 125753 CrossRef CAS PubMed.
- X. Hou, Z. Xue, Y. Xia, Y. Qin, G. Zhang, H. Liu and K. Li, Int. J. Biol. Macromol., 2019, 125, 1289–1298 CrossRef CAS PubMed.
- S. Wang, X. Huang and M. Elimelech, J. Membr. Sci., 2020, 605, 118109 CrossRef CAS.
- X. Chen, L. Sun, H. Wang, S. Cao, T. Shang, H. Yan and Q. Lin, Colloids Surf., B, 2023, 228, 113413 CrossRef CAS PubMed.
- E. Guerrini and S. Trasatti, Russ. J. Electrochem., 2006, 42, 1017–1025 CrossRef CAS.
- S. Joshi and R. K. Srivastava, Environ. Monit. Assess., 2019, 191, 1–9 CrossRef CAS PubMed.
- B. Wang, T. Wu, S. Angaiah, V. Murugadoss, J.-E. Ryu, E. K. Wujcik, N. Lu, D. P. Young, Q. Gao and Z. Guo, ES Mater. Manuf., 2018, 2, 35–44 Search PubMed.
- D. S. Alobaidi and A. I. Alwared, Heliyon, 2023, 9, e14851 CrossRef CAS PubMed.
- M. Karamipour, S. Fathi and M. Safari, Int. J. Environ. Anal. Chem., 2023, 103, 3853–3864 CrossRef CAS.
- I. Haydari, K. Aziz, S. Kaya, T. Daştan, N. Ouazzani, L. Mandi and F. Aziz, Process Saf. Environ. Prot., 2023, 170, 1079–1091 CrossRef CAS.
- M. Li, J. Mu, Y. Liu, H. Wang, Y. Wang and H. Song, Res. Chem. Intermed., 2023, 49, 2209–2232 CrossRef CAS.
- S. A. Younis, E. A. Motawea, Y. M. Moustafa, J. Lee and K.-H. Kim, J. Hazard. Mater., 2020, 397, 122792 CrossRef CAS PubMed.
- A. Al Bsoul, M. Hailat, A. Abdelhay, M. Tawalbeh, A. Al-Othman, I. N. Al-kharabsheh and A. A. Al-Taani, Sci. Total Environ., 2021, 761, 143229 CrossRef CAS PubMed.
- M. El-Qelish, A. M. Elgarahy, H. S. Ibrahim, H. K. El-Kholly, M. Gad and M. E. M. Ali, Biochem. Eng. J., 2023, 195, 108932 CrossRef CAS.
- N. Wang, F. Song, Y. Niu, W. Chen, B. Liu and W. Xie, Sep. Purif. Technol., 2023, 326, 124757 CrossRef CAS.
- A. F. Hassan, G. A. El-Naggar, G. Esmail and W. A. Shaltout, Appl. Surf. Sci. Adv., 2023, 13, 100388 CrossRef.
- S. Melhi, M. Algamdi, A. A. Alqadami, M. A. Khan and E. H. Alosaimi, Chem. Eng. Res. Des., 2022, 177, 843–854 CrossRef CAS.
- N. M. Y. Almahbashi, S. R. M. Kutty, A. H. Jagaba, A. Al-nini, B. N. S. Al-Dhawi and U. Rathnayake, Case Stud. Chem. Environ. Eng., 2023, 8, 100471 CrossRef CAS.
- B. Özkaya, J. Hazard. Mater., 2006, 129, 158–163 CrossRef PubMed.
- T. T. Firozjaee, N. Mehrdadi, M. Baghdadi and G. R. N. Nabi Bidhendi, Desalin. Water Treat., 2017, 79, 291–300 CrossRef CAS.
- K. Sadhu, A. Mukherjee, S. K. Shukla, K. Adhikari and S. Dutta, Desalin. Water Treat., 2014, 52, 6492–6504 CrossRef CAS.
- M. F. Gasim, Z. Y. Choong, P. L. Koo, S. C. Low, M. H. Abdurahman, Y. C. Ho, M. Mohamad, I. W. K. Suryawan, J. W. Lim and W. Da Oh, Catalysts, 2022, 12, 1–26 CrossRef.
- Y. Dehmani, M. Mobarak, R. Oukhrib, A. Dehbi, A. Mohsine, T. Lamhasni, Y. Tahri, H. Ahlafi, S. Abouarnadasse, E. C. Lima and M. Badawi, J. Mol. Liq., 2023, 386, 122508 CrossRef CAS.
- A. Dehbi, Y. Dehmani, H. Omari, A. Lammini, K. Elazhari, S. Abouarnadasse and A. Abdallaoui, Surf. Interfaces, 2020, 21, 100637 CrossRef CAS.
|
| This journal is © The Royal Society of Chemistry 2024 |
Click here to see how this site uses Cookies. View our privacy policy here. 
 Open Access Article
 This Open Access Article is licensed under a Creative Commons Attribution-Non Commercial 3.0 Unported Licence
 *
*