
 Open Access Article
 This Open Access Article is licensed under a Creative Commons Attribution-Non Commercial 3.0 Unported Licence
Highly efficient and stable adsorption of lithium from brine with microcapsules containing 1-phenylazo-2-naphthol and trioctylphosphine oxide
Tian Xieab,
Han Quab,
Chao Zhang *ab and
Zheng Li*cd
*ab and
Zheng Li*cd
aSchool of Chemical Engineering, Qinghai University, Xining 810016, Qinghai, China. E-mail: zhangchaoqhu@126.com
bSalt Lake Chemical Engineering Research Complex, Qinghai University, China
cCAS Key Laboratory of Green Process and Engineering, Institute of Process Engineering, Chinese Academy of Sciences, Beijing 100190, China. E-mail: zli@ipe.ac.cn
dSchool of Chemical Engineering, University of Chinese Academy of Sciences, Beijing 100408, China
First published on 8th July 2024
Abstract
Lithium extraction from salt lake brine is still challenging due to the existence of similar elements, e.g. sodium. In the present work, polysulfone (PSF) microcapsules containing 1-phenylazo-2-naphthol (HS) and trioctylphosphine oxide (TOPO) as extractants were successfully prepared by microfluidic technology for the separation of Li+ from brine with Li+ and Na+. The morphology, composition, and structure of HS-TOPO-based microcapsules were characterized systematically. The results showed that microcapsules consisting of 20 wt% (m m−1) polysulfone and 80 wt% (m m−1) 1-phenylazo-2-naphthol-trioctylphosphine oxide as the extractant, which was labeled as PSF/HS-TOPO-2/8, exhibited the best performance for Li+ adsorption. The separation factor (SF) of Li+ over Na+ is up to 653 and the adsorption capacity for Li+ in the simulated brine could reach 3.67 mg g−1 for microcapsules PSF/HS-TOPO-2/8, which demonstrated that Li+ can be separated with high selectivity. Besides, the kinetic results demonstrated that the adsorption followed quasi-secondary adsorption kinetic models, indicating that the adsorption mechanism of lithium by microcapsules involved chemisorption. After ten cycles of adsorption–elution, the maximum equilibrium adsorption capacity still remained at 87%. All these results demonstrate that PSF/HS-TOPO-2/8 microcapsules can be used as an efficient adsorber for the adsorption of Li+ from brine with high selectivity and stability.
1 Introduction
As the first metallic element in the periodic table, lithium is the lightest metal with excellent properties such as active chemistry, high specific heat capacity and low coefficient of expansion.1 It is currently developing rapidly in the fields of rechargeable lithium-ion batteries (LIBS), consumer electronics, new energy vehicles (EVs) and energy storage.2 Furthermore, it is an indispensable critical raw material for developing the new energy vehicle industry at this stage.3 China is estimated to have 4.5 million tons of lithium, over 71% of which is stored in salt lake brines.4 Currently, the industrial method of extraction of lithium from the salt lake brine is based on adsorption,5 membrane separation6 and solvent extraction.7 Among them, the solvent extraction method has been rapidly developed for lithium extraction from the salt lake brine due to advantages of high selectivity, simple operation and low cost.8Among these, the chelating extraction system is a special method. For example, Serine9 et al. reported that the chelating extraction system has inferior extraction ability for most alkali metal ions except for Li+ because Li+ can be chelated to form bonds, which are difficult to form with other alkali metal ions (e.g., Na+). Therefore, the chelating extraction system always exhibits good selectivity for extracting lithium. Yan10 et al. studied the LiX54-Cyanex923 synergistic chelating extraction system, which was applied to lithium–sodium separation, and the lithium extraction rate was up to 99%. He11 et al. studied the ionic liquid chelating extractant system with 1-phenylazo-2-naphthol as an extractant and alkyl quaternary ammonium salts as the ionic binding agent, which can effectively extract lithium from alkaline or near-neutral alkaline mixed alkali metal salt aqueous solution. Yan12 et al. studied 1-phenylazo-2-naphthol chelating agent in the co-extraction of lithium with trioctylphosphine oxide and the results exhibited that the system owns a high partition ratio and separation factor for lithium–sodium separation. Meanwhile, the 1-phenylazo-2-naphthol-trioctylphosphine oxide system is chemically stable, abundant and inexpensive. However, the solubility of 1-phenylazo-2-naphthol in less polar solvents is poor. Besides, the extraction system usually requires a large amount of organic solvents as a diluent, which leads to the residue of the organic solvents in brine during the extraction, resulting in environmental pollution. Furthermore, other problems such as emulsification and phase separation still need to be resolved.
Microencapsulation technology provides a new idea to solve the above problems. Microencapsulation is a technology that uses polymers to encapsulate liquid functional molecules or substances to form tiny particles with a sealed capsule membrane.13 Microcapsules have a small dispersion volume and a large surface area, making it easy for tiny ions to pass through the film, while the extractant molecules are not free to pass through. It can change the traditional solvent extraction method of liquid–liquid mass transfer to solid–liquid mass transfer, avoiding the problem of emulsification and phase separation simultaneously. On this basis, it also has the advantage of solvent extraction.14 In addition, microencapsulation technology requires a small amount of organic solvent and is environmentally friendly. In recent years, the combination of microencapsulation technology and solvent extraction method has been successfully applied and achieved remarkable results. For instance, micro polymer inclusion beads (μPIBs) consisting of D2EHPA for adsorption of La3+,15 μPIBs loaded with extractants of Aliquat336 and 1-tetradecano for selectively extracting Au(III),16 microcapsules with Aliquat 336 applied for the recovery of Cr(VI),17 microcapsules coated with bis(2-ethylhexyl) phosphoric acid for the extraction of europium (Eu3+),18 microcapsules encapsulated ionic liquids [A336][P507] for the extraction of La3+, Sm3+ and Er3+ from dilute aqueous solutions,19 etc., have been reported. From these reports, it may be that microcapsules loaded with different extractants were successfully prepared, and could be used for the efficient separation of various nonferrous metal ions, which could overcome the problem of traditional solvent extraction and also show excellent performance.
The separation of Li+ from salt lake is still tough work and the microcapsules loaded with functional extractants for this target have scarcely been reported. Only polymer inclusion membranes (PIMs) and solvent-impregnated resin (SIR) have been reported for Li+ extraction, and the unsatisfactory Li+ flux of PIMs or the instability impedes their practical applications in metal separation and recovery. Xu20 et al. investigated the PIMs of TBP-[C4mim][NTf2] for the extraction of Li+ from simulated brine in a salt lake, and the selectivity of Li/Mg was as high as 23.87. Though the PIMs were an interesting innovation, their small specific surface area resulted in a poor mass transfer rate, whereas microcapsules have a high specific surface area, which makes their mass transfer rate faster and more favourable for lithium adsorption. Onishi21 et al. investigated the application of SIR containing both 1-phenyl-1,3-tetradecanedione (C11phβDK) and TOPO for the selective adsorption of Li+ in aqueous chloride media, and the average elution loss was about 3.1% for every single usage. However, there has yet to be a report on microencapsulated 1-phenylazo-2-naphthol-trioctylphosphine oxide system for lithium extraction from salt lake brines.
Therefore, the present work describes the preparation of microcapsules with polysulfone as the matrix polymer for microcapsules, trioctylphosphine oxide and 1-phenylazo-2-naphthol as extractants. The microcapsules were prepared by adopting the recently developed microfluidic technique.22–27 Compared to other methods of preparing microcapsules, microfluidic technology prepared microcapsules with controllable size and small dispersion, which is suitable for preparing microcapsules for lithium adsorption. In this study, PSF/HS-TOPO-4/6, PSF/HS-TOPO-3/7, and PSF/HS-TOPO-2/8 microcapsules were successfully prepared and compared for the adsorption performance under the same adsorption conditions, and their maximum equilibrium adsorption capacity of Li+ reached 3.67 mg g−1, and the SF(Li+/Na+) could reach 653.3. The adsorption kinetic data were fitted with quasi-primary and quasi-secondary adsorption kinetic models, indicating that the adsorption mechanism of lithium by microcapsules is chemisorption. After ten cycles of adsorption and stripping, the maximum equilibrium adsorption capacity was still reached at 87%.
2 Experimental
2.1 Chemicals
Polysulfone (PSF, average Mw = 35![[thin space (1/6-em)]](https://www.rsc.org/images/entities/char_2009.gif) 000) Shanghai Aladdin Biochemical Technology. Tetrahydrofuran (THF) was obtained from Tianjin Fuyu Fine Chemical. Trioctylphosphine oxide (TOPO) was obtained from Chengdu Ekeda Chemical Reagent. 1-Phenylazo-2-naphthol (HS) was obtained from Shanghai Bide Pharmaceutical Technology. Tween 80 was obtained from Tianjin Fuyu Fine Chemical. Sodium hydroxide (NaOH) was obtained from Sinopharm Group Chemical Reagents. Sodium chloride (NaCl) was obtained from Sinopharm Group Chemical Reagent. Lithium hydroxide monohydrate (LiOH·H2O) was obtained from Shanghai Aladdin Biochemical Science and Technology. Concentrated hydrochloric acid was a commercially available reagent of analytical purity.
000) Shanghai Aladdin Biochemical Technology. Tetrahydrofuran (THF) was obtained from Tianjin Fuyu Fine Chemical. Trioctylphosphine oxide (TOPO) was obtained from Chengdu Ekeda Chemical Reagent. 1-Phenylazo-2-naphthol (HS) was obtained from Shanghai Bide Pharmaceutical Technology. Tween 80 was obtained from Tianjin Fuyu Fine Chemical. Sodium hydroxide (NaOH) was obtained from Sinopharm Group Chemical Reagents. Sodium chloride (NaCl) was obtained from Sinopharm Group Chemical Reagent. Lithium hydroxide monohydrate (LiOH·H2O) was obtained from Shanghai Aladdin Biochemical Science and Technology. Concentrated hydrochloric acid was a commercially available reagent of analytical purity.
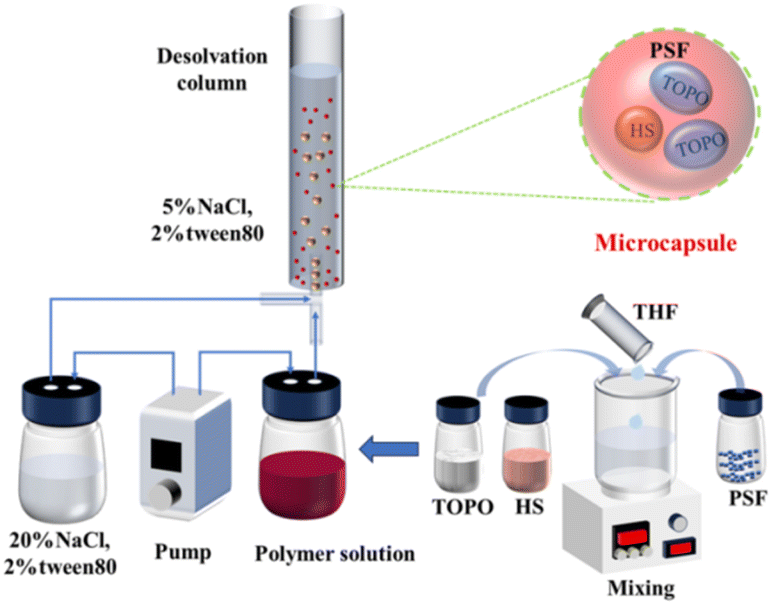
2.2 Preparation of microcapsules
A 12% (m/v) polymer solution was prepared by dissolving appropriate amounts of PSF, TOPO and HS in THF, where the TOPO:HS = 2:1 (molar ratio) was kept constant, which was used as a dispersed phase. The mass ratios of HS-TOPO and PSF were 60:40, 70:30, and 80:20. NaCl and Tween 80 were dissolved in deionised water to prepare NaCl–Tween 80 aqueous solutions, which was used as continuous phase (20%/2%) and collecting liquid (5%/2%). All aqueous solutions were prepared using deionised water.
Microcapsule preparation was implemented using the Microdroplet and Particle Preparation and Observation System (DDGSYS-2000) from microfluidic technology. The preparation process consists of two Flow EZ pressure pumps, which were used to deliver NaCl–Tween 80 (20%/2%) aqueous solution and the 12% polymer solution at 1000 μL min−1 and 90 μL min−1 flow rate through a tube to a 3D droplet generation chip. In the 3D droplet generation chip, the 12% polymer solution was forced into droplets using the NaCl–Tween 80 aqueous solution (20%/2%), and the droplet and particle preparation and observation system was equipped with a high-speed microscopic observation system for real-time observation of droplet generation. Another pressure pump was used to deliver NaCl–Tween 80 aqueous solution (5%/2%) as a collecting liquid into a desolvation column with an internal diameter of about 4.5 cm. The microdroplets moved upwards by buoyancy due to their low density and the high solubility of THF in 5% NaCl aqueous solution. Then, the desolvation process was accompanied during the rising process of the microdroplets. Since the density of the solid-forming PSF microcapsules was higher than that of the NaCl–Tween 80 aqueous solution (5%/2%), the PSF microcapsules settled at the bottom of the column after complete desolvation. As a consequence, PSF coated HS-TOPO microcapsules consisting of 40 wt% PSF and 60 wt% HS-TOPO extractant, 30 wt% PSF and 70 wt% HS-TOPO extractant, and 20 wt% PSF and 80 wt% HS-TOPO extractant were prepared and named as PSF/HS-TOPO-4/6, PSF/HS-TOPO-3/7 and PSF/HS-TOPO-2/8, respectively. The preparation process of microcapsules is illustrated in Scheme 1.
 | ||
| Scheme 1 Preparation process of the microcapsules. | ||
2.3 Adsorption experiment of lithium by microcapsules
An appropriate amount of LiOH·H2O, NaOH, and NaCl was dissolved in deionised water to prepare a simulated brine solution. The simulated brine consisted of 0.08 mol L−1 LiOH, 0.1 mol L−1 NaOH and 0.1 mol L−1 NaCl. Then, the concentrated hydrochloric acid was diluted in deionised water to 1 mol L−1, which was used as a desorption solution.About 10 g of dried PSF/HS-TOPO-4/6, PSF/HS-TOPO-3/7, PSF/HS-TOPO-2/8 was taken and added to three 100 mL wide-mouth bottles. Then, 40 mL of the simulated brine was added to each bottle and oscillated for 6 hours at a constant temperature (25 ± 1) °C on a thermostatic incubator shaker (THZ-100). Then, an equal volume of HCl was taken for the desorption solution and oscillated for 1 hour at a constant temperature (25 ± 1) °C on a thermostatic incubator shaker. Similar adsorption and desorption operations were repeated for long-time cycling experimental research. About 1 mL of adsorbed solution and the desorption solution were drawn and diluted for testing the concentration of lithium by inductively coupled plasma spectrometer (ICP-OES) model ICAP6300. Deionised water was used to prepare all aqueous solutions.
2.4 Characterisation of microcapsules
The particle size and distribution of the microcapsules were observed using the SMZ-25 stereomicroscope. The surface morphology and structure of the microcapsules were observed with a scanning electron microscope (SEM) model JSM-6610LV. The extractant microcapsules were recorded in the wave number range of (4000–500) cm−1 using a spectrum Two™ Fourier transform infrared spectrometer (FT-IR). Thermogravimetric analysis of microcapsules for thermal stability and extractant encapsulation was carried out using a simultaneous thermal analyser model STA449F3-DSC200F3 in the temperature range of 30–1000 °C, with a temperature increase rate of 10 °C min−1 and an ambient atmosphere of N2. XRD analysis was carried out using an X-ray diffractometer (XRD) model D-max2500 PC at 5–90° (2θ). The photoelectron spectra of the microcapsules were scanned using a multifunctional X-ray photoelectron spectrometer (ESCALABX) model at 200–230 V AC, 50 A, 50–60 Hz.2.5 Instrumentation
A model THZ-100 constant temperature culture shaker (Shanghai Yiheng Scientific Instrument) was used. A JSM-6610LV Scanning Electron Microscope (SEM), Nippon Electron was used. An ICAP6300 Inductively Coupled Plasma Spectrometer (ICP-OES), Suzhou Sainz Instrument was used. A DDGSYS-2000 Micro Droplet and Particle Preparation and Observation System, Microna Cube Technology (Beijing) was used. A Spectrum Two™ Fourier Transform Infrared (FT-IR) spectrometer, PerkinElmer AG, STA449F3-DSC200F3 Synchrotron Thermal Analyser, NETZSCH Instruments GmbH, Germany, SMZ-25 stereo microscope, Nikon Corporation, Model D-max2500 PC X-ray Diffractometer (XRD), Rigaku Corporation, Japan, ESCALABX Multifunction X-ray Photoelectron Spectrometer, Thermo Fisher Scientific were used.3 Results and discussion
3.1 Morphology characterization of microcapsules
The surface morphology of the microcapsules PSF/HS-TOPO-4/6, PSF/HS-TOPO-3/7, and PSF/HS-TOPO-2/8 was examined using a body-viewing microscope. The typical morphology is illustrated in Fig. 1. The microcapsules exhibited a tendency towards a smoother surface as the mass fraction of the extractant HS-TOPO increased from 60% to 80%. This phenomenon could be attributed to the accelerated solidification of the organic phase precipitated by the elevated concentration of PSF during microcapsule preparation, which resulted in the appearance of wrinkles on the morphology. From the particle size and distribution statistics of PSF/HS-TOPO-4/6, PSF/HS-TOPO-3/7, and PSF/HS-TOPO-2/8 (illustrated in Fig. 2), it could be determined that the majority of the particles fall within the range of 600–750 μm. Microcapsules with PSF/HS-TOPO-4/6, PSF/HS-TOPO-3/7, and PSF/HS-TOPO-2/8 had average particle sizes of 655.8 μm, 688.5 μm, and 691.9 μm, respectively. Furthermore, the dispersibility of PSF/HS-TOPO-4/6, PSF/HS-TOPO-3/7, and PSF/HS-TOPO-2/8 did not present obvious differences.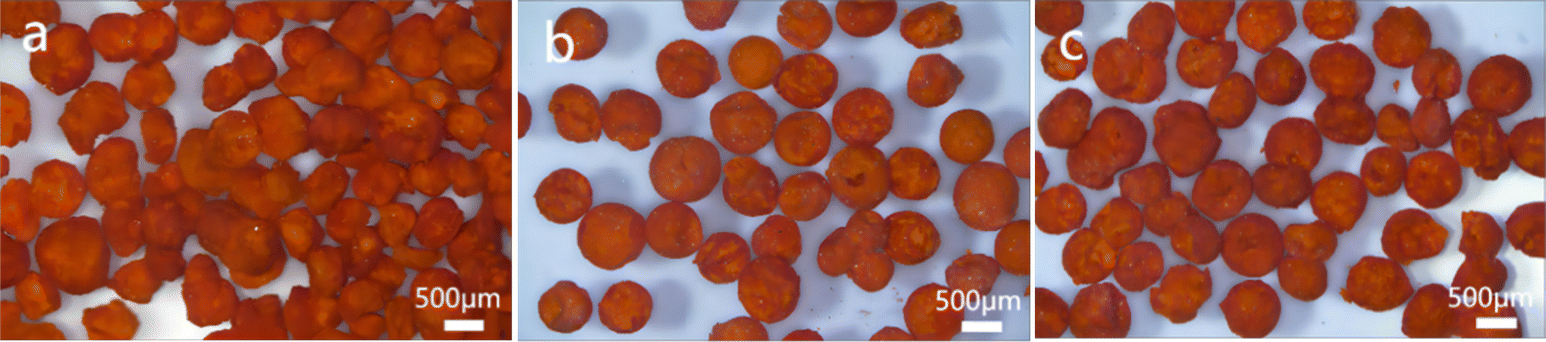 | ||
| Fig. 1 Optical microscopy images (2× magnification, scale bar 500 μm) of microcapsules (a) PSF/HS-TOPO-4/6, (b) PSF/HS-TOPO-3/7, (c) PSF/HS-TOPO-2/8. | ||
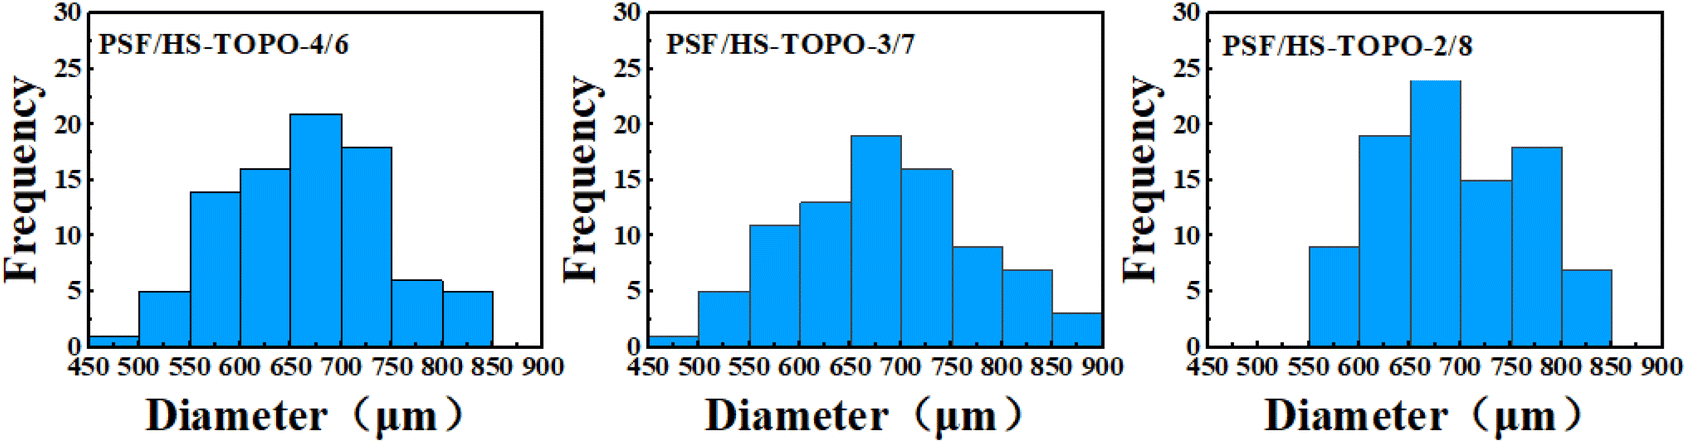 | ||
| Fig. 2 Histogram of the particle size distribution of microcapsules with different extractant contents. | ||
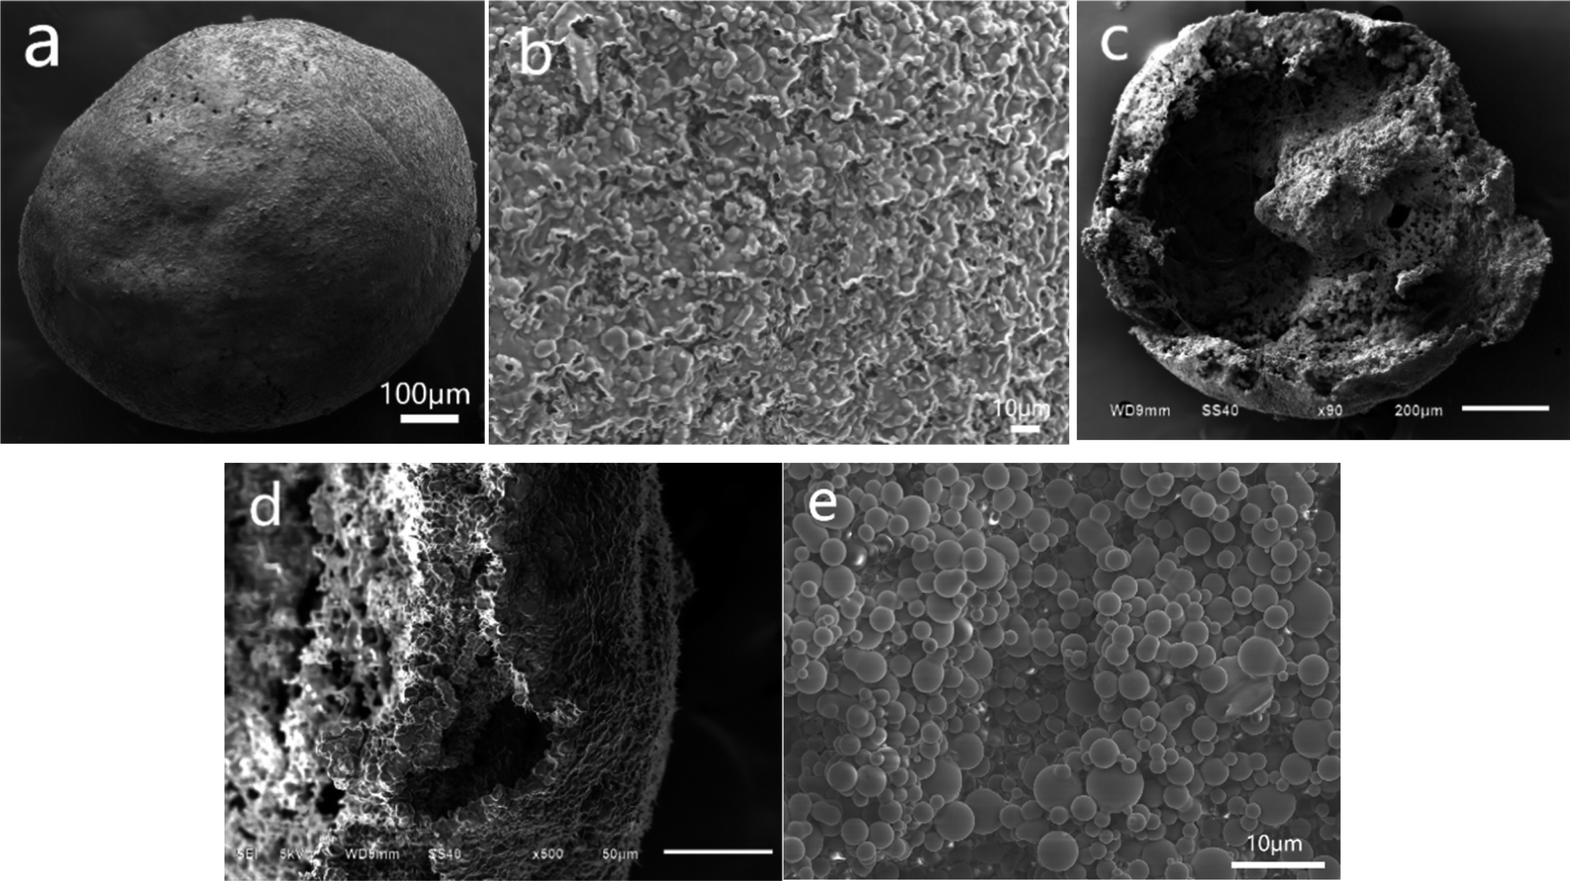
The microcapsules of PSF/HS-TOPO-4/6, PSF/HS-TOPO-3/7, and PSF/HS-TOPO-2/8 were observed using scanning electron microscopy (SEM), and the microcapsule microimages are shown in Fig. 3. Fig. 3a illustrates a typical image of the surface of a single PSF/HS-TOPO-4/6 microcapsule, which indicated that PSF/HS-TOPO-4/6 was basically a spherical shape with a less smooth surface. When the surface is magnified as shown in Fig. 3b, it can be seen that the surface of PSF/HS-TOPO-4/6 mainly exhibits a dense and less uniform texture, which was consistent with the results obtained from Fig. 1 and was due to the large concentration of PSF during the microcapsule preparation process. Besides, plenty of voids with different sizes on the surface of the PSF/HS-TOPO-4/6 could be seen, which may allow the ions to be adsorbed across from the surface into the interior. In this way, the adsorbed ions can enter the microcapsule through the voids and be extracted by the extractant in the microcapsule, while the extractant particles within the microcapsule are not free to pass through the capsule membrane. The cross-section of PSF/HS-TOPO-4/6 is shown in Fig. 3c, which indicates that the microcapsule was a rough, hollow, and porous structure inside the microcapsule. Magnifying the cross-section as shown in Fig. 3d, it can be seen that the thickness of the capsule membrane of PSF/HS-TOPO-4/6 was thicker. There are some aggregates near the inner part of the capsule membrane, which may be due to the higher concentration of PSF and the poor diffusion ability during the phase transition process. Magnifying the internal surface of PSF/HS-TOPO-4/6 by 2000 times (as shown in Fig. 3e), it was clearly seen the presence of aggregates with a large number of spherical particles with less uniform size and distribution on the surface inside the microcapsules, which may have an adverse effect on the adsorption behaviour of lithium by the microcapsule.
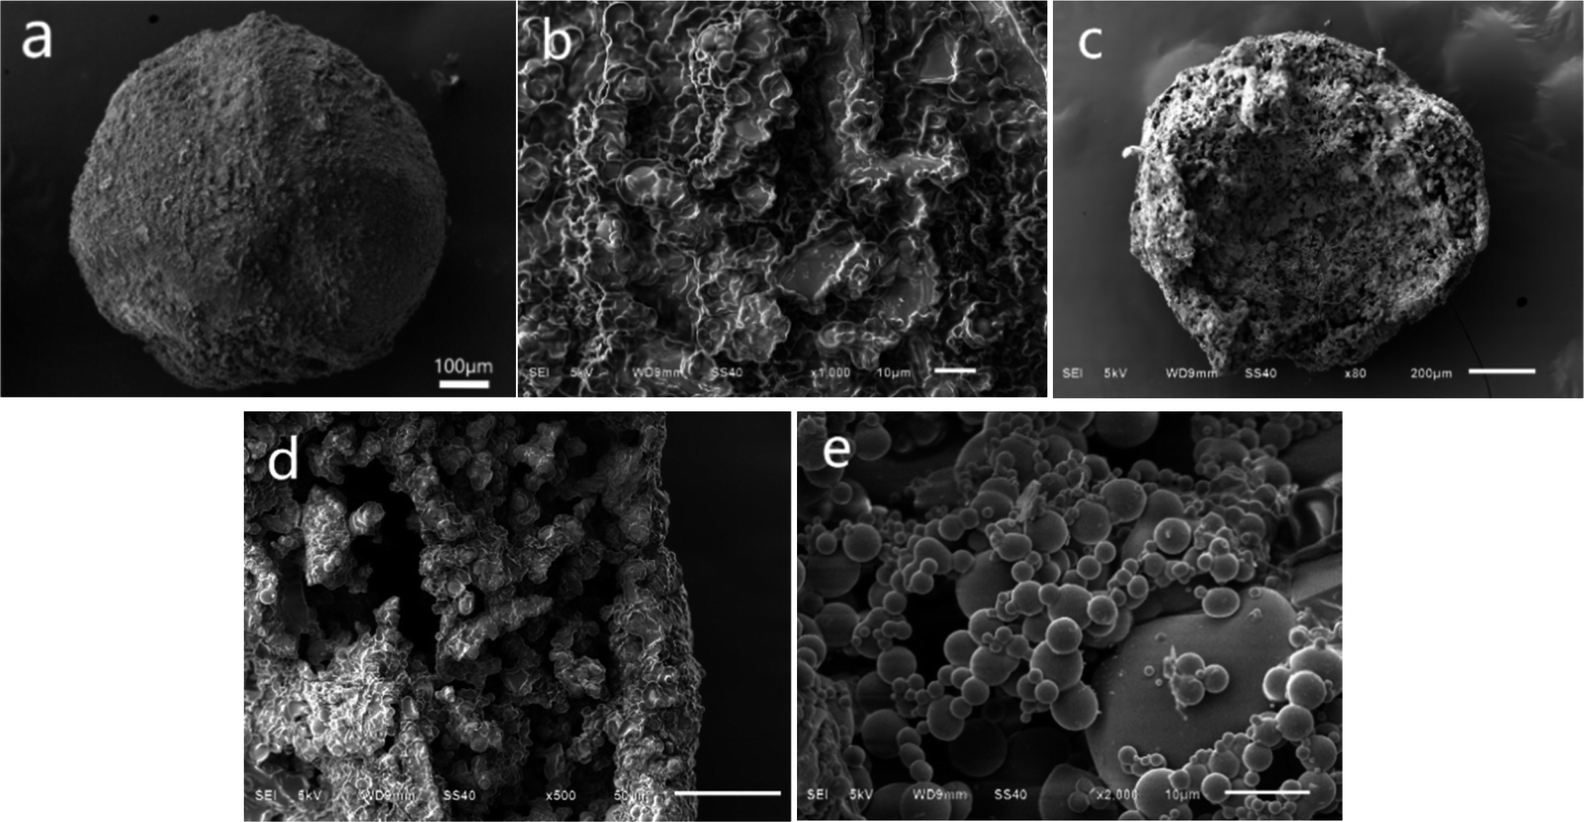 | ||
| Fig. 3 Different perspective images of PSF/HS-TOPO-4/6 microcapsules: (a) overall image, (b) enlarged view of surface, (c) overall sectional image, (d) partial sectional view, (e) enlarged view of internal surface. | ||
Microscopic images of PSF/HS-TOPO-3/7 microcapsules with different perspectives are shown in Fig. 4. Fig. 4a shows a typical image of a single PSF/HS-TOPO-3/7 surface. When compared to PSF/HS-TOPO-4/6, the surface morphology of the microcapsule PSF/HS-TOPO-3/7 exhibited a smoother spherical shape. When the surface was magnified as shown in Fig. 4b, it can be seen that the texture on the surface of PSF/HS-TOPO-3/7 was dense and homogeneous, which confirmed that PSF/HS-TOPO-3/7 was smoother than that of PSF/HS-TOPO-4/6. The cross-section of PSF/HS-TOPO-3/7 is shown in Fig. 4c, and the interior also exhibited rough, hollow, and porous structure. When the cross-section was magnified as shown in Fig. 4d, it can be seen that the thickness of the vesicle membrane of PSF/HS-TOPO-3/7 was thicker, and the aggregates present near the vesicle membrane were closer to the vesicle membrane and were more distinctly layered. Magnifying the internal surface of PSF/HS-TOPO-3/7 microcapsule by 2000 times (as shown in Fig. 4e), more aggregates of spherical particles with a more uniform distribution existing within the microcapsules can be clearly seen.
 | ||
| Fig. 4 Different perspective images of PSF/HS-TOPO-3/7 microcapsules: (a) overall image, (b) enlarged view of surface, (c) overall sectional image, (d) partial sectional view, (e) enlarged view of internal surface. | ||
Furthermore, microscopic images of PSF/HS-TOPO-2/8 are shown in Fig. 5. Fig. 5a is a typical image of the surface of a single PSF/HS-TOPO-2/8 microcapsule, which appeared as a smooth spherical shape. The magnified image of the outer surface of PSF/HS-TOPO-2/8 is shown in Fig. 5b, which indicates that with the increase in the mass fraction of the extractant, HS-TOPO, from 60% to 80%, the texture of the outer surface of the microcapsules became denser and more uniform. The structure of the microcapsules was more stable. The cross-section of PSF/HS-TOPO-2/8 is shown in Fig. 5c, and the interior also exhibited a rough, hollow, and porous structure. It may indicate that the hollow structure was easily formed inside the microcapsules when the concentration of PSF was low. When the cross-section was magnified as shown in Fig. 5d, it can be seen that the thickness of the vesicle membrane of PSF/HS-TOPO-2/8 was thinner, indicating that the thickness of the vesicle membrane was correlated with the concentration of PSF. The aggregates presented near the vesicle membrane were almost dependent on the vesicle membrane. Furthermore, a 2000 times magnification of the internal surface of PSF/HS-TOPO-2/8 (shown in Fig. 5e) clearly showed denser and more uniformly distributed aggregates of spherical particles. By comparison, it was reasonable to suggest that the more uniformly distributed these aggregates and the closer they were to the surface of the vesicle membrane, the more stable the extraction of extractant molecules would be, which is well consistent with the results of the adsorption results.
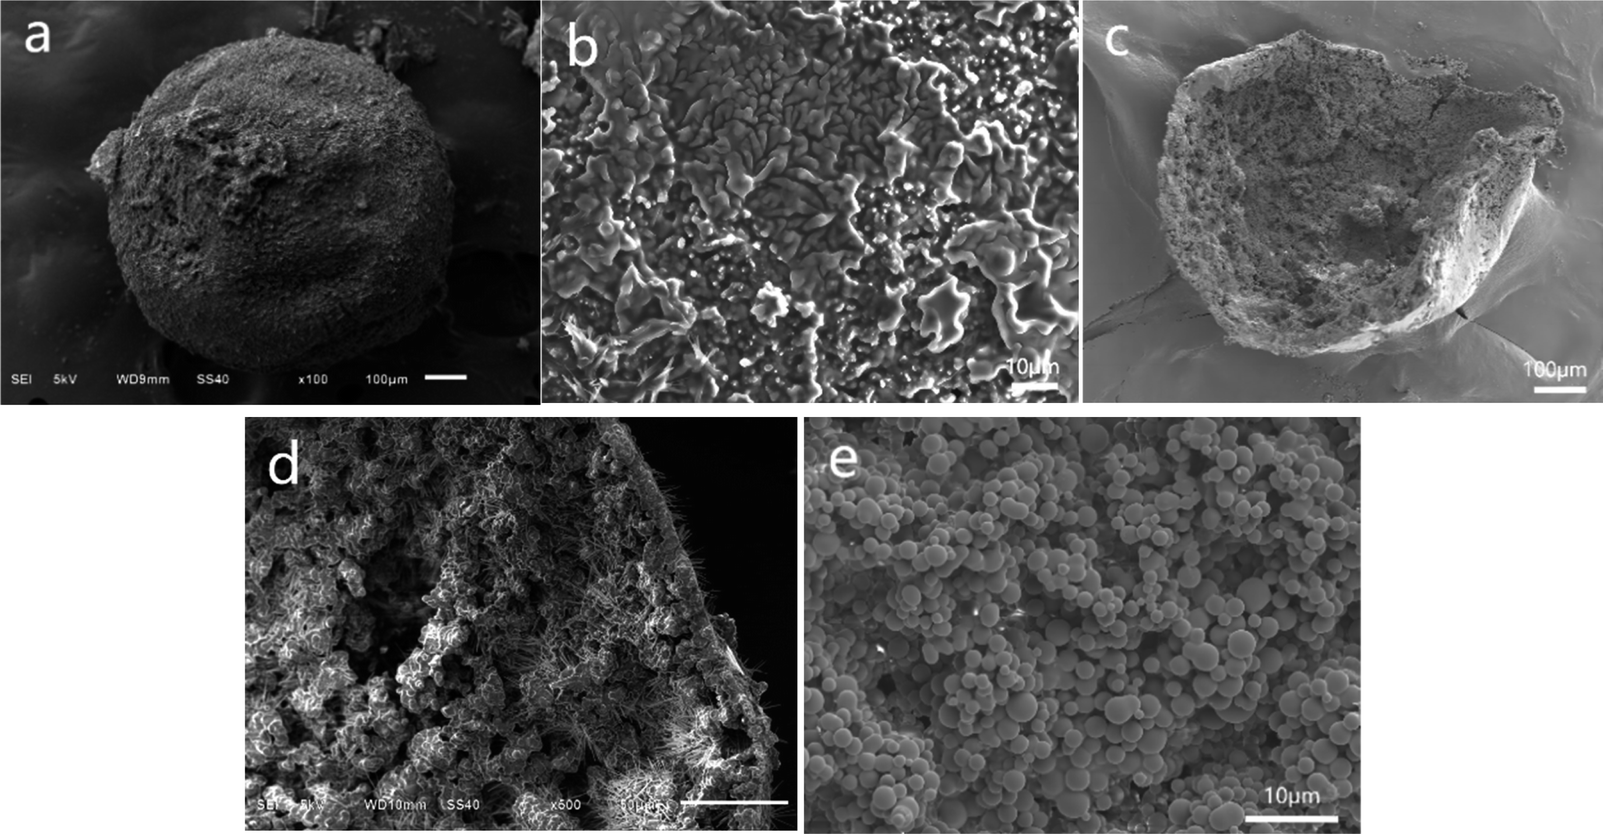 | ||
| Fig. 5 Different perspective images of PSF/HS-TOPO-2/8 microcapsules: (a) overall image, (b) enlarged view of surface, (c) overall sectional image, (d) partial sectional view, (e) enlarged view of internal surface. | ||
3.2 Structure characterization of microcapsules
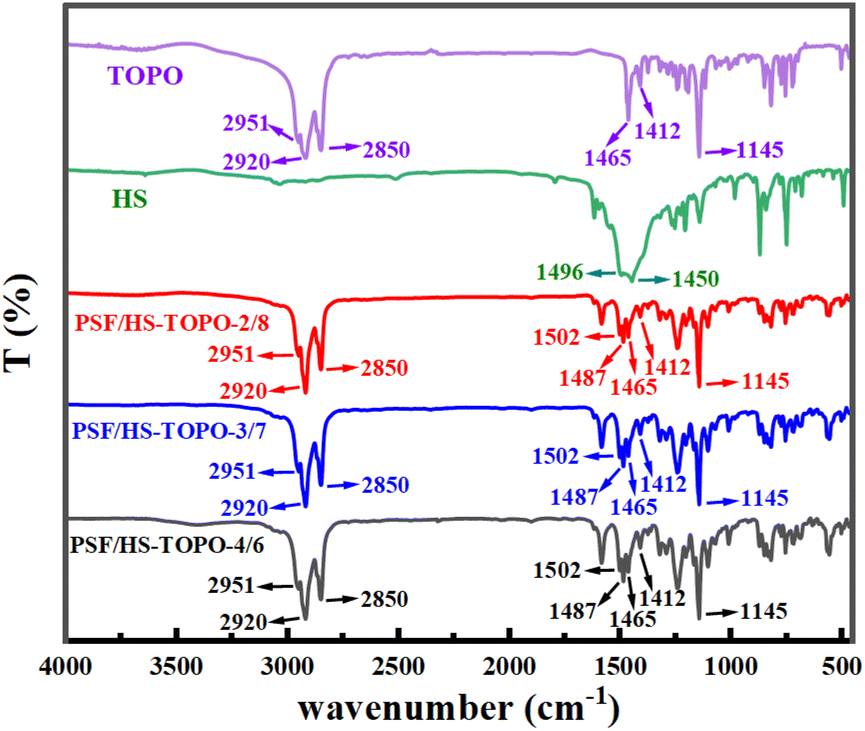
FT-IR spectra of the target microcapsules are illustrated in Fig. 6. Upon comparing the FT-IR spectra of pure TOPO and HS with those of PSF/HS-TOPO-4/6, PSF/HS-TOPO-3/7, and PSF/HS-TOPO-2/8 microcapsules, it is clearly seen that the characteristic peaks of pure TOPO and HS remain essentially unchanged. This suggested that the microcapsules completely encapsulate both TOPO and HS. By comparing FT-IR spectra of PSF/HS-TOPO-4/6, PSF/HS-TOPO-3/7, and PSF/HS-TOPO-2/8, it became evident that the positions of the characteristic peaks in each system were virtually identical, which confirmed that all the microcapsules with different composition of PSF/HS-TOPO were encapsulating both TOPO and HS extractants. Stretching vibrational peaks emanating from the positive octyl group of TOPO were observed at 2951 cm−1, 2920 cm−1, and 2850 cm−1 in the range of 2800–3000 cm−1. At 1412 cm−1 and 1465 cm−1, the deformation vibrational peaks emanating from TOPO methylene could be seen. The vibrational absorption peak at 1145 cm−1 emanated from the P![[double bond, length as m-dash]](https://www.rsc.org/images/entities/char_e001.gif) O region of TOPO. The 1502 cm−1 represented –OH absorption peak from the benzene ring of HS. The –N–N stretching vibration peak from HS is located at 1487 cm−1. Some characteristic peaks of HS at 700–900 cm−1 are not visible because they are covered by absorption peaks of TOPO.
O region of TOPO. The 1502 cm−1 represented –OH absorption peak from the benzene ring of HS. The –N–N stretching vibration peak from HS is located at 1487 cm−1. Some characteristic peaks of HS at 700–900 cm−1 are not visible because they are covered by absorption peaks of TOPO.
 | ||
| Fig. 6 FT-IR spectra of PSF/HS-TOPO-4/6, PSF/HS-TOPO-3/7, PSF/HS-TOPO-2/8, TOPO and HS. | ||
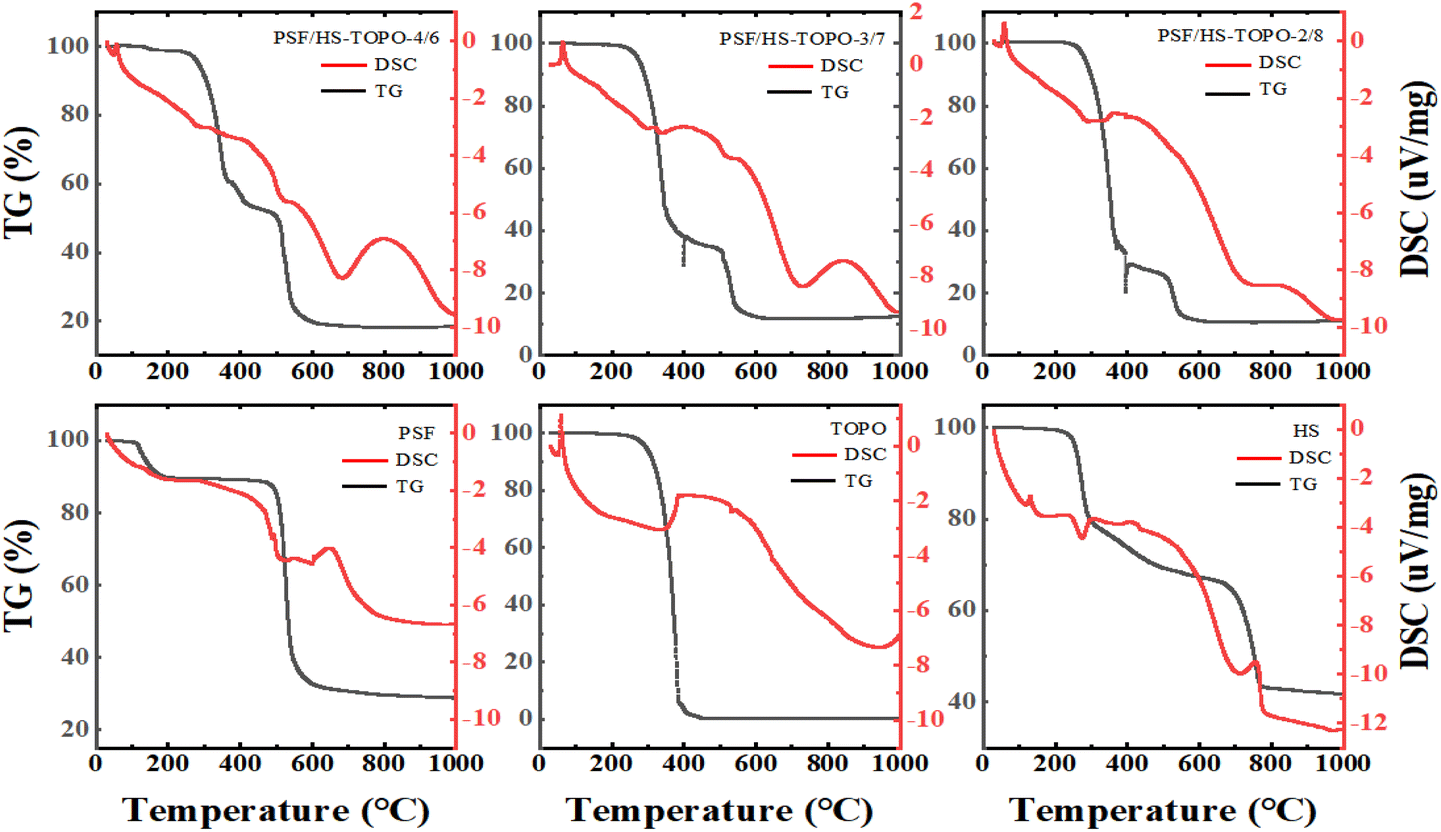
Thermogravimetric analysis to study the thermal stability of microcapsules was carried out using a thermal analyser at a temperature range of 30–1000 °C with a temperature increase rate of 10°C min−1 and an ambient atmosphere of N2.
The thermogravimetric analysis (TG) of the samples' weight changes as the temperature increases is illustrated in Fig. 7. At temperature ranges of 120–200 °C, 240–460 °C, and 500–640 °C, three primary phases were identified. The primary cause of weight loss during the initial stage (120–200 °C) was water and THF evaporation. The thermal decomposition of the extractants TOPO and HS caused the weight loss during the second stage (240–460 °C): 46.02% for PSF/HS-TOPO-4/6, 63.51% for PSF/HS-TOPO-3/7, and 72.45% for PSF/HS-TOPO-2/8.
 | ||
| Fig. 7 TG and DSC profiles of PSF/HS-TOPO-4/6, PSF/HS-TOPO-3/7, PSF/HS-TOPO-2/8, PSF microspheres, TOPO and HS. | ||
Based on the weight loss data of the second stage, it may be evident that PSF/HS-TOPO-2/8 exhibits the highest extractant encapsulation efficiency, encapsulating 80% of the initial microcapsule content. The discrepancy between the encapsulated and initial microcapsule contents was negligible, suggesting that the extractant loss during microcapsule preparation was minimal. In theory, when conducting adsorption experiments utilizing microcapsules at equal mass, PSF/HS-TOPO-2/8 contains a greater quantity of the extractant HS-TOPO. Furthermore, assuming minimal extractant loss during microcapsule preparation and a stable structure, it was reasonable to anticipate that the adsorption performance of PSF/HS-TOPO-2/8 was superior to that of PSF/HS-TOPO-4/6 and PSF/HS-TOPO-3/7. However, previous research had shown that encapsulation of the extractant by microcapsules was unstable when the extractant mass to polymer mass ratio exceeded 6:4. The thermogravimetric results indicated that PSF was capable of efficiently encapsulating 80% of the extractant, so it can be hypothesized that PSF/HS-TOPO-2/8 has the most effective adsorption performance for lithium. The reduction in mass during the third phase (500–640 °C) could be attributed to the incomplete breakdown of PSF and HS. By comparing the TG patterns of PSF/HS-TOPO-4/6, PSF/HS-TOPO-3/7, PSF/HS-TOPO-2/8, and PSF, it is evident that the temperature range of mass loss for the extractant and the polymer remained constant. These results provide confirmation that the extractant was encapsulated within the microcapsule and that the principal components of the microcapsule do not engage in any chemical interactions. The thermogravimetric test revealed minimal residue of the extractant TOPO, leaving only HS and PSF as residual substances. It was possible to deduce from the calculation that the residual substances consisted of both HS and PSF, thereby providing confirmation that the extractant HS was effectively encapsulated within the microcapsules. Nevertheless, the visual determination of the mass ratio between TOPO and HS encapsulated in the microcapsules was not feasible from the thermogravimetric data due to the substantial weight loss exhibited by HS across all three temperature ranges.
The crystal structure of the microcapsules was characterised by XRD (as shown in Fig. 8). The XRD pattern of PSF showed distinct organic peaks, indicating that PSF was not crystallised, which was consistent with the nature of PSF. The XRD pattern of PSF/HS-TOPO-4/6, PSF/HS-TOPO-3/7, PSF/HS-TOPO-2/8, HS and TOPO revealed the same group of characteristic peaks, and the intensity of the characteristic peaks enhanced as the extractant's content increased, indicating that HS and TOPO were successfully encapsulated in the microcapsules, which corresponds to the results of FT-IR, XPS and TG.
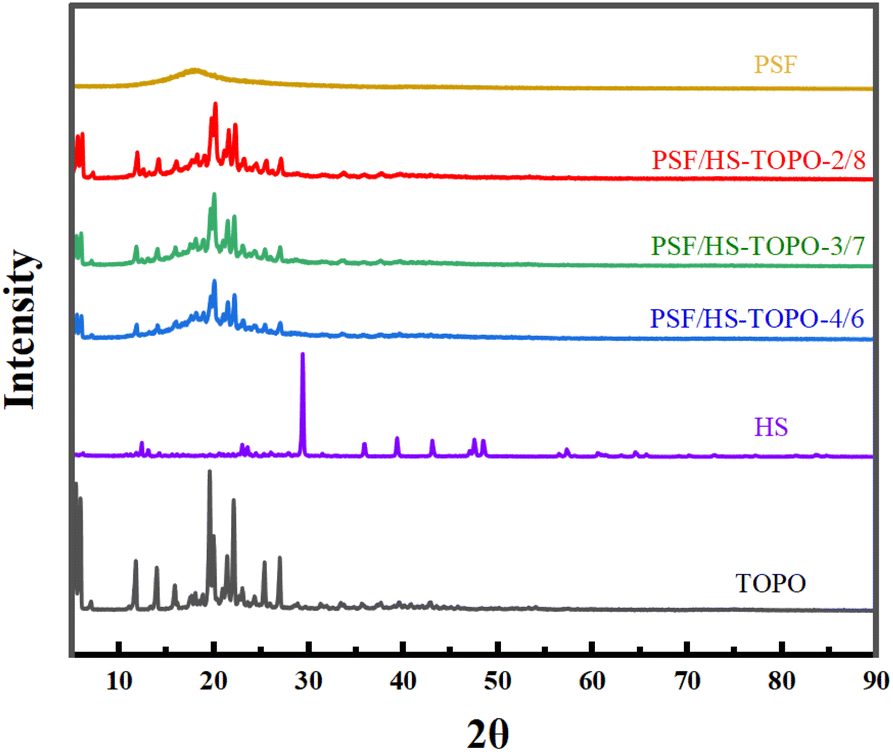 | ||
| Fig. 8 XRD patterns of PSF/HS-TOPO-4/6, PSF/HS-TOPO-3/7, PSF/HS-TOPO-2/8, PSF microspheres, TOPO and HS. | ||
In order to provide additional evidence that the extractant HS-TOPO was encapsulated within the microcapsules, XPS analysis was performed on the microcapsules PSF/HS-TOPO-2/8. Then, the XPS spectra of PSF/HS-TOPO-2/8 are depicted in Fig. 9. It is evident from the total spectrum (Fig. 9a) that the primary elements comprising PSF/HS-TOPO-2/8 were C, O, N, S, and P. Fig. 10 illustrates the XPS spectrum of pure PSF microspheres.
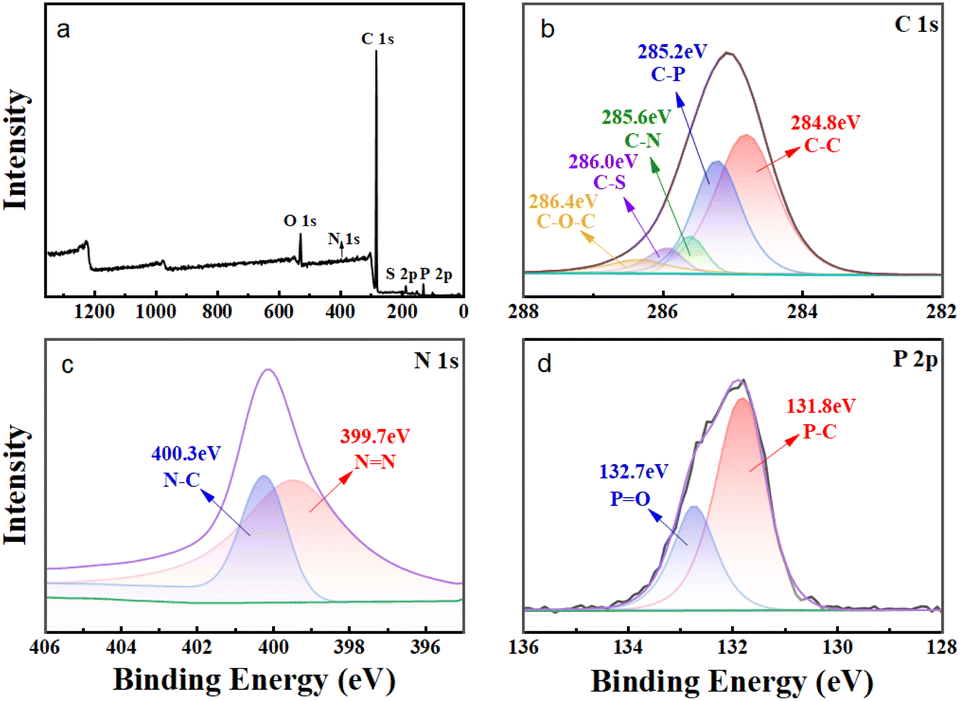 | ||
| Fig. 9 XPS spectrum of PSF/HS-TOPO-2/8 microcapsules, (a) total spectra, (b) C 1s spectra, (c) N 1s spectra, and (d) P 2p spectra. | ||
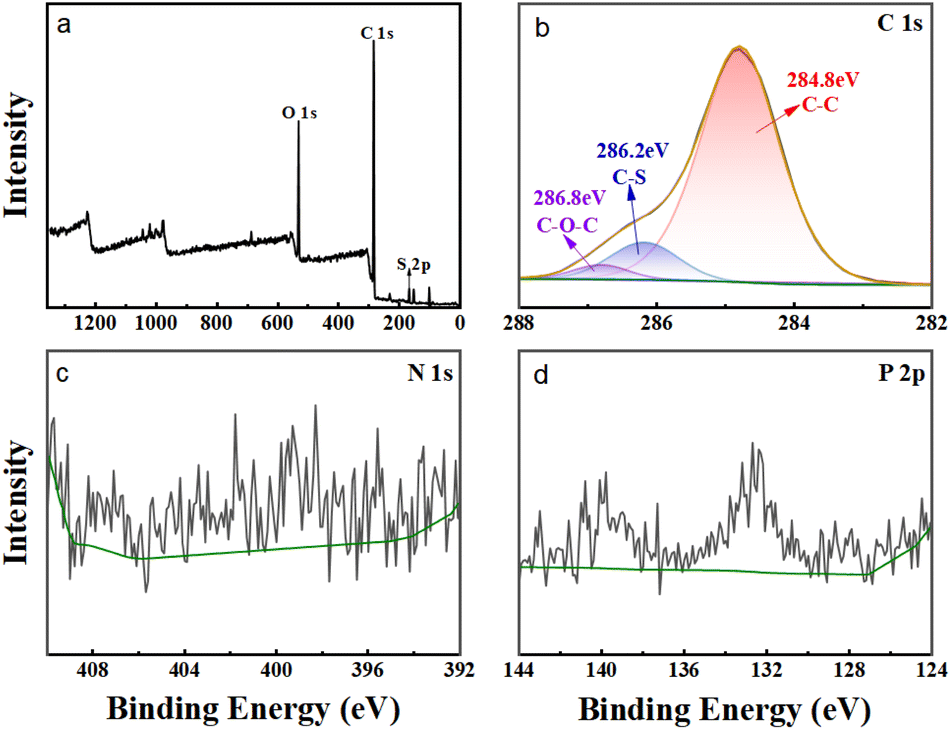 | ||
| Fig. 10 XPS patterns of pure PSF microspheres, (a) total spectra, (b) C 1s spectra, (c) N 1s spectra, and (d) P 2p spectra. | ||
A comprehensive analysis of the spectrum (Fig. 10a) revealed that the primary elements present in PSF microspheres were C, O, and S. It was indicated that the elements N and P were almost undetectable. The XPS spectrum of HS exhibited two peaks at 399.7 eV and 400.3 eV for N, which correspond to NN and N–C, respectively. The XPS spectrum of TOPO revealed two peaks at 131.8 eV and 132.7 eV for P, corresponding to P–C and PO, respectively. However, the binding energies of S 2p and P 2p on the profiles of PSF microspheres were not detected. Subsequently, the C 1s XPS spectra of PSF/HS-TOPO-2/8 were compared to those of PSF microspheres. Specifically, the characteristic peaks of C–P and C–N could be identified for the PSF/HS-TOPO-2/8 in C 1s XPS spectra, while these were missing for pure PSF. It was confirmed the successful encapsulation of the target HS-TOPO in PSF/HS-TOPO-2/8 microcapsules was well consistent with the outcomes of FT-IR, XRD, and TG analysis.
3.3 Adsorption behaviour of lithium on microcapsules
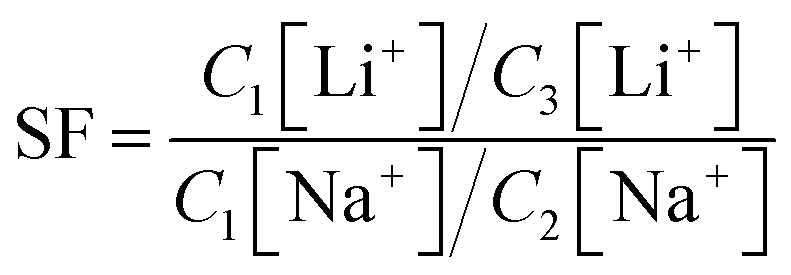
The adsorption performance of lithium over sodium using PSF/HS-TOPO-4/6, PSF/HS-TOPO-3/7, and PSF/HS-TOPO-2/8 microcapsules with varied concentration of extractant TOPO and HS was investigated. From Fig. 11, it is evident that as the extractant content is increased, so did the adsorption capacity of the microcapsules for Li+, while the adsorption capacity of the microcapsules for Na+ was kept at a low level. The separation factor (SF) of Li+/Na+ could be calculated using the following eqn (1).
 | (1) |
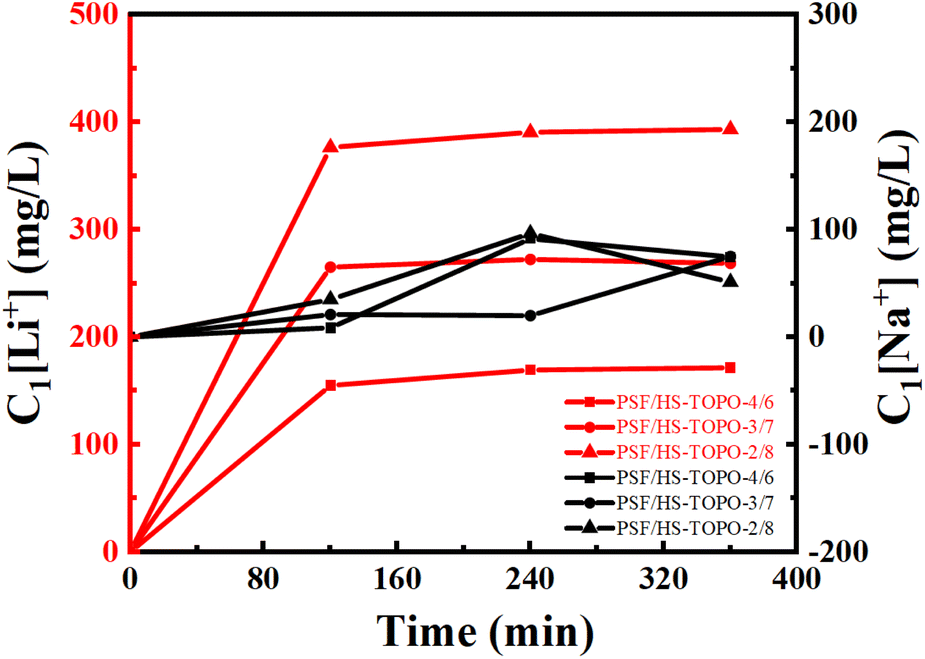 | ||
| Fig. 11 Li+ adsorption rate curves of microcapsules at different contents of the carrier (HS-TOPO), C1[Li+] is the adsorbed Li+ concentration in microcapsules (mg L−1), C1[Na+] is the adsorbed Na+ concentration in microcapsules (mg L−1). | ||
The SF(Li+/Na+) of PSF/HS-TOPO-4/6, PSF/HS TOPO-3/7, and PSF/HS-TOPO-2/8 were 89.0, 181.5 and 653.3, respectively (shown in Fig. 12). As can be seen the SF(Li+/Na+) increased significantly with the increase of the extractant content and reached high up to 653.3 when the extractant content was 80 wt%, which confirmed that SF/HS-TOPO-2/8 possessed the best adsorption performance of lithium over sodium.
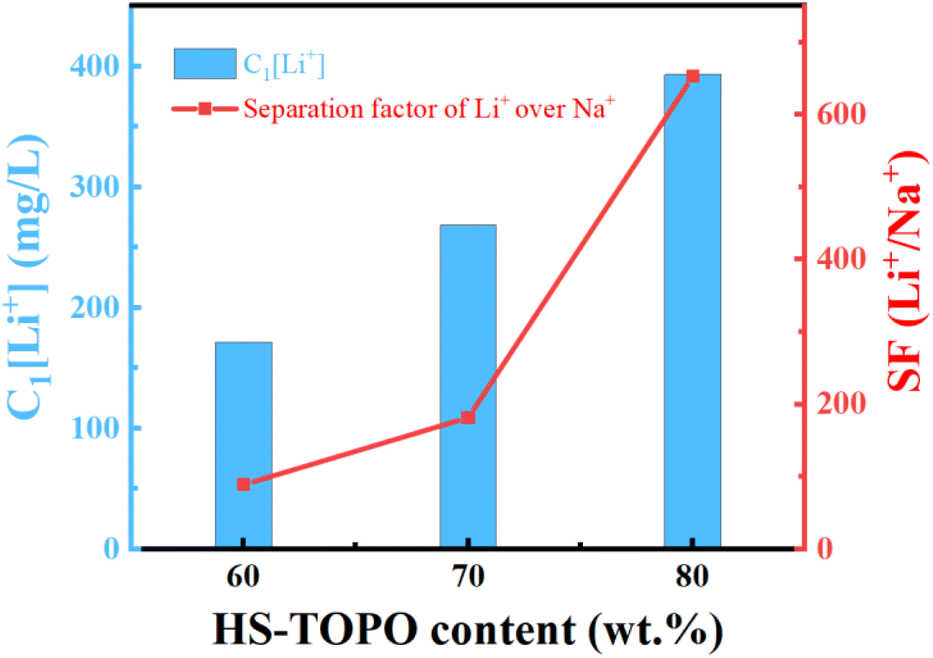 | ||
| Fig. 12 Li+ separation performance of the microcapsules with different contents of the carrier (HS-TOPO), C1[Li+] is the adsorbed Li+ concentration in the microcapsules (mg L−1). | ||
The desorption experiments were conducted by utilizing 1 mol L−1 HCl, in which H+ was utilized as a substitute for Li+. The time-dependent Li+ concentration changes during the HCl stripping of microcapsules PSF/HS-TOPO-4/6, PSF/HS-TOPO-3/7, and PSF/HS-TOPO-2/8 are depicted in Fig. 13. The obtained results indicated that the equilibrium could be attained for PSF/HS-TOPO-4/6, PSF/HS-TOPO-3/7, and PSF/HS-TOPO-2/8 in one hour of stripping. Notably, the desorption procedure was executed in a shorter duration than the adsorption process, which indicated that the obtained microcapsule was really easy to recycling.
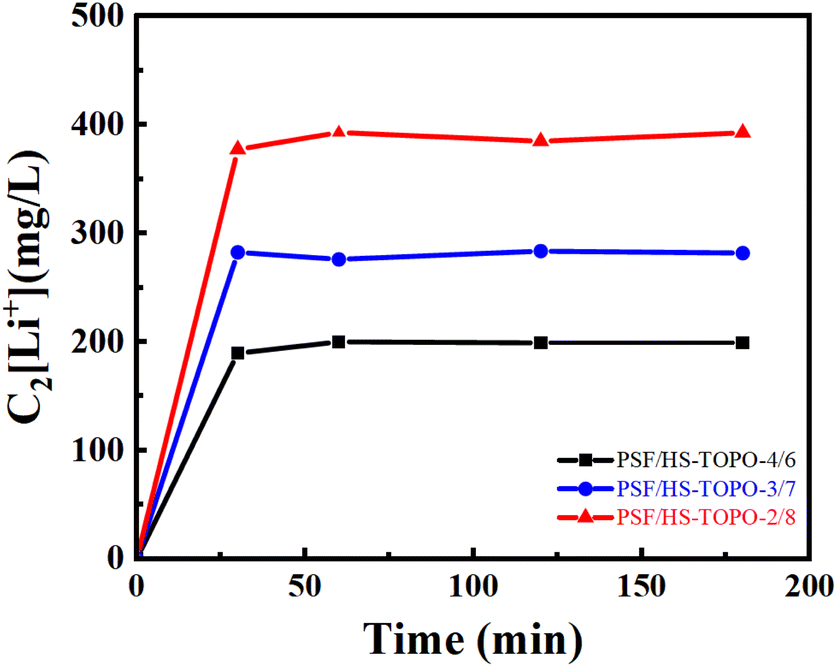 | ||
| Fig. 13 Curves of Li+ concentration changing by HCl desorption with time, C2[Li+] is the concentration of Li+ in HCl desorption solution (mg L−1). | ||
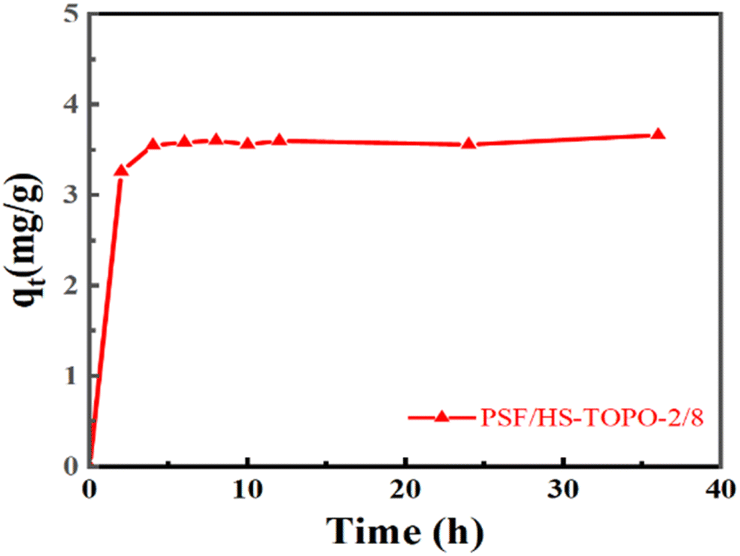
The adsorption rate curve of Li+ by PSF/HS-TOPO-2/8 is shown in Fig. 14. It may be concluded that the adsorption equilibrium was reached at 6 h for PSF/HS-TOPO-2/8. As PSF/HS-TOPO-2/8 exhibited the best adsorption performance, the corresponding adsorption kinetic data were fitted using the quasi-primary adsorption kinetic model and quasi-secondary adsorption kinetic model by eqn (2) and (3). The obtained results are shown in Fig. 15.
| qt = qe − exp(ln(qe) − k1 × t) | (2) |
| qt = t/((1/k2 × qe2) + t/q) | (3) |
 | ||
| Fig. 14 The adsorption rate curve of Li+ by PSF/HS-TOPO-2/8. | ||
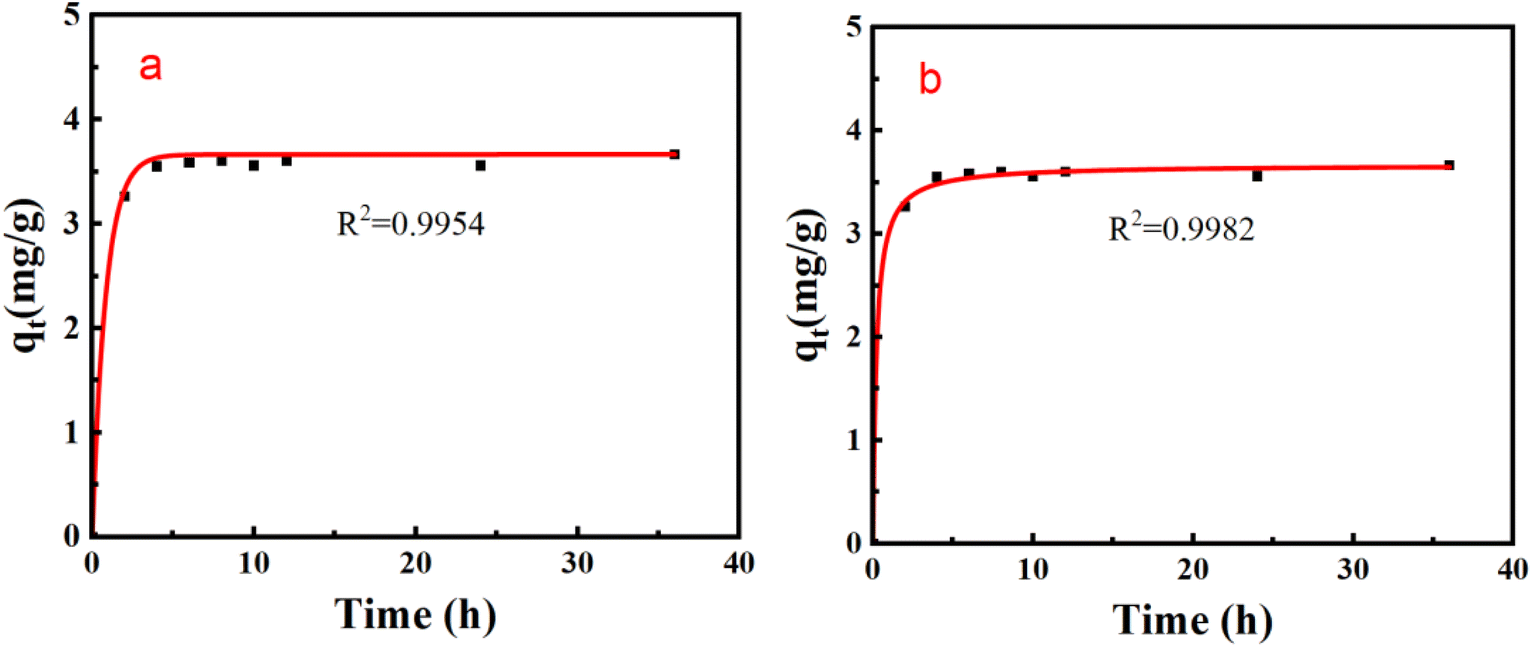 | ||
| Fig. 15 Adsorption kinetics fitting curve of PSF/HS-TOPO-2/8 (a) quasi-primary adsorption kinetics fitting curve, and (b) quasi-secondary adsorption kinetics fitting curve. | ||
In order to investigate the desorption and reusing stability of PSF/HS-TOPO-2/8, ten consecutive adsorption–desorption cycling experiments were conducted. The outcomes are illustrated in Fig. 16. It may concluded that 1 mol L−1 HCl could strip almost most of the adsorbed Li+ during each adsorption–desorption cycle. Following ten cycles of adsorption–desorption experiments, PSF/HS-TOPO-3/7 and PSF/HS-TOPO-2/8 maintained 85% and 87% of their initial adsorption capacities, respectively. However, the initial adsorption capacity was only preserved at 66% for PSF/HS-TOPO-4/6 to that of the initial adsorption after ten cycles of adsorption experiments. These encouraging outcomes demonstrated that the surface and internal structures of PSF/HS-TOPO-3/7 and PSF/HS-TOPO-2/8 were more stable, thus validating the conclusions drawn from the previous SEM image analyses. Among these, the PSF/HS-TOPO-2/8 composite exhibited the most consistent and superior adsorption performance for Li+ and it may show great potential in the application for the separation of Li+ over the Na+ in the salt lake brines.
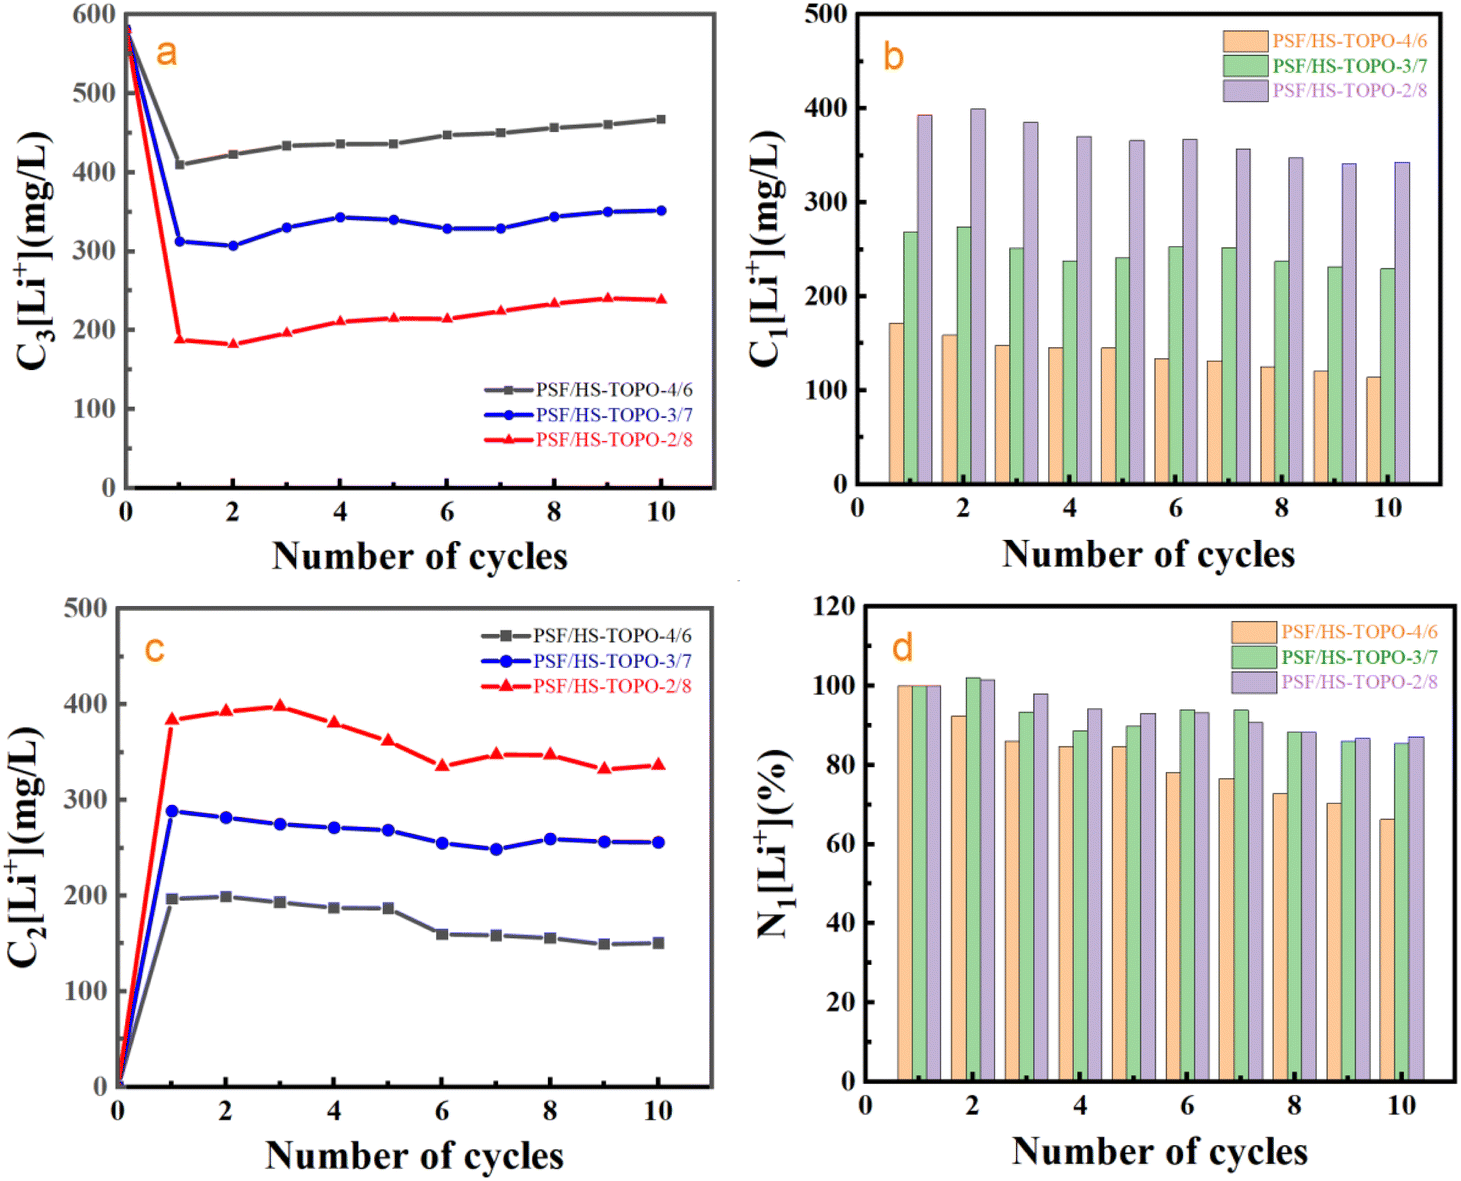 | ||
| Fig. 16 (a) Variation curves of Li+ concentration in simulated brine with the number of cycles and C3[Li+] is the residual Li+ concentration in the simulated brine (mg L−1), (b) variation curve of the adsorbed Li+ concentration in microcapsules with the number of cycles and C1[Li+] is the adsorbed Li+ concentration in microcapsules (mg L−1), (c) variation curve of Li+ concentration in HCl stripping solution with the number of cycles and C2[Li+] is the concentration of Li+ in HCl stripping solution(mg L−1), (d) variation curve of the percentage normalised to the first adsorption with the number of cycles and N1[Li+] is the percentage (%) normalised to the first adsorbed concentration. | ||
4 Conclusions
In this paper, PSF microcapsules containing both HS and TOPO as extractants were successfully prepared by microfluidic technology. With the increase of the extractant content, the more the aggregates existed in the vicinity of the capsule membrane, the better the adsorption performance of the microcapsules for Li+. The equilibrium adsorption capacity of PSF/HS-TOPO-2/8 for Li+ in simulated brine reached 3.67 mg g−1, and the SF(Li+/Na+) of Li+ over Na+ could reach 653.3. The adsorption kinetic data were fitted better by the quasi-secondary adsorption kinetic model, which indicated that the adsorption mechanism of Li+ on microcapsules belonged to chemisorption. The present microcapsules exhibited highly efficient and stable adsorption of Li+ over Na+, which could be easily reused for repeated processing. It can be expected that the microcapsules obtained in our work can be applied as a highly potential adsorbent for efficient separation of Li+ over other alkali metal ions in the salt lake. Besides, the strategies used in our work also could be adopted for the preparation of microcapsules with the ability to separate other ions by changing the composition or ingredients of polymers and extractants.Conflicts of interest
There are no conflicts to declare.Acknowledgements
This work is financially supported by the Project of Qinghai Science and Technology Department (Grant No. 2023-HZ-805), the Open Project of Salt Lake Chemical Engineering Research Complex, Qinghai University (No. 2023-DXSSZZ-05).References
- J. Wu, X. Ren and Q. Wei, Research progress on separation and extraction of lithium from salt-lake brine, Inorg. Chem.: Indian J., 2020, 52, 1–6 Search PubMed
.
- L. Cui, K. Jiang, J. Wang, K. Dong and F. Cheng, Role of ionic liquids in the efficient transfer of lithium by Cyanex 923 in solvent extraction system, AIChE J., 2019, 65, 1–12 CrossRef
- Q. Wang, Y. Zhao, Y. Liu, Y. Wang, M. Wang and X. Xiang, Progress of magnesium-lithium separation and lithium extraction technology in high Mg/Li ratio salt lake, CIESC J., 2021, 72, 2905–2921 CAS
- U.S. Geological Survey, Mineral commodity summaries 2020, U.S. Geological Survey, 2020, p. 200, https://pubs.er.usgs.gov/publication/mcs2020 Search PubMed.
- T. Ding, M. Zheng, X. Zhang, Q. Wu and X. Zhang, Development of lithium extraction technology and industrialization in brines of salt lake, Sci. Technol. Rev., 2020, 38, 16–23 CAS
- P. Ma, X. Deng and X. Wen. Separation of magnesium and concentration of lithium from brine of a salt lake, CN200310122238.3, 2005
- H. Zhu, J. Gao, Y. Guo and T. Deng, Progresses on solvent extraction for lithium recovery from brines, Guangdong Trace Elem. Sci., 2010, 17, 25–30 CAS
- C. Zhang, J. Song, T. Huang, H. Zheng and T. He, Increasing lithium extraction performance by adding sulfonated poly(ether ether ketone)into block-copolymer ethylene vinyl alcohol membrane, J. Chem. Technol. Biotechnol., 2020, 95, 1559–1568 CrossRef CAS
- T. Serine, Y. Takahashi and N. Ihara, The Distribution of 2-thenoyltrifluoroacetone between several organic solvents and an aqueous solution and its extraction of sodium (I) into methyl isobutyl ketone, Bull. Chem. Soc. Jpn., 1973, 46, 388–391 CrossRef
- J. Yan, Y. Chen, W. Ye, H. Feng, E. Zhao, G. Sun and H. Sheng, Selective extraction of lithium by SudanI neutral co-extraction system, J. Org. Chem., 1981, 1, 28–33 CAS
- G. He, G. Zhang, L. Zeng, W. Guan, S. Wu, Q. Li and Z. Cao, Synergistic extraction and separation of lithium and sodium from lithium-containing sodium sulfate solutions by LIX54/Cyanex923, Rare Met. Cem. Carbides, 2023, 51, 8–15 Search PubMed
- H. Sheng, B. Li, Y. Chen, Q. Yuan, Q. Xu, J. Yan, J. Yao, W. Ye, H. Long and P. Dai, A new extraction system for lithium, Acta Chim. Sin., 1995, 53, 689–694 CAS
- J. Cui, Y. Zhang, J. Zhang, M. Bo, J. Guo and B. Yang, Progress in research and application of microcapsule preparation technology and its polymer-based functional composites, Paint Coat. Ind., 2018, 48, 15–22 CAS
- S. Nishihama, N. Sakaguchi, T. Hirai and I. Komasawa, Extraction and separation of rare earth metals using microcapsules containing bis(2-ethylhexyl)phosphinic acid, Hydrometallurgy, 2002, 64, 35–42 CrossRef CAS
- C. Croft, M. Almeida and S. Kolev, Development of micro polymer inclusion beads (μPIBs) for the extraction of lanthanum, Sep. Purif. Technol., 2022, 285, 120342 CrossRef CAS
- Y. Zhang, C. Croft, R. Cattrall and S. Kolev, Microfluidic fabrication of micropolymer inclusion beads for the recovery of gold from electronic scrap, ACS Appl. Mater. Interfaces, 2021, 13, 61661–61668 CrossRef CAS PubMed
- N. Ochoa, C. Illanes, J. Marchese, C. Basualto and F. Valenzuela, Preparation and characterization of polymeric microspheres for Cr(VI) extraction, Sep. Purif. Technol., 2006, 52, 39–45 CrossRef CAS
- M. Momen and M. Dietz, High-capacity extraction chromatographic materials based on polysulfone microcapsules for the separation and preconcentration of lanthanides from aqueous solution, Talanta, 2019, 197, 612–621 CrossRef CAS PubMed
- Y. Wang, Y. Wang, Y. Jing, J. Chen and Y. Liu, Microcapsules containing ionic liquid [A336] [P507] for La3+/Sm3+/Er3+ recovery from dilute aqueous solution, J. Rare Earths, 2016, 34, 1260–1268 CrossRef CAS
- L. Xu, X. Zeng, Q. He, T. Deng, C. Zhang and W. Zhang, Stable ionic liquid-based polymer inclusion membranes for lithium and magnesium separation, Sep. Purif. Technol., 2022, 288, 120626 CrossRef CAS
- K. Onishi, T. Nakamura, S. Nishihama and K. Yoshizuka, Synergistic solvent impregnated resin for adsorptive separation of lithium ion, Ind. Eng. Chem. Res., 2010, 49(14), 6554–6558 CrossRef CAS
- M. Fuerstman, P. Garstecki and G. Whitesides, Coding/decoding and reversibility of droplet trains in microfluidic networks, Science, 2007, 315, 828–832 CrossRef CAS PubMed
- Q. Xu, M. Hashimoto, T. Dang, T. Hoare, D. Kohane, G. Whitesides, R. Langer and D. Anderson, Preparation of monodisperse biodegradable polymer microparticles using a microfluidic flow-focusing device for controlled drug deliver, Small, 2009, 5, 1575–1581 CrossRef CAS PubMed
- T. Nisisako, T. Torii and T. Higuchi, Droplet formation in a microchannel network, Lab Chip, 2002, 2, 24–26 RSC
- T. Nisisako, T. Torii and T. Higuchi, Novel microreactors for functional polymer beads, Chem. Eng. J., 2004, 101, 23–29 CrossRef CAS
- L. Chu, A. Utada, R. Shah, J. Kim and D. Weitz, Controllable monodisperse multiple emulsions, Angew. Chem., Int. Ed., 2007, 46, 8970–8974 CrossRef CAS PubMed
- A. Utada, L. Chu, A. Nieves, D. Link and D. Weitz, Dripping, jetting, drops and wetting: the magic of microfluidics, MRS Bull., 2007, 32, 702–708 CrossRef CAS
| This journal is © The Royal Society of Chemistry 2024 |