
 Open Access Article
 This Open Access Article is licensed under a Creative Commons Attribution-Non Commercial 3.0 Unported Licence
Identification of coke species on Fe/USY catalysts used for recycling polyethylene into fuels†
Yongli Wang,
Na Yan and
Zezhou Chen *
*
Department of Engineering, Huzhou University, 759 Erhuan North Road, Huzhou, 313000, China. E-mail: chenzezhou@zjhu.edu.cn
First published on 12th July 2024
Abstract
The Fe/USY catalyst used for converting plastic waste into fuels faces coking problems. A comprehensive understanding of coke distribution and structure is crucial for catalyst design, enabling resistance to coke deposition and facilitating regeneration. In this study, we analyze the coke deposition on Fe/USY catalysts after catalytic pyrolysis of polyethylene for fuel oil, and present insights into the coke distribution over the metal and acid sites, as well as its specific molecular structure. The coke distributes over both the metal and acid sites, exhibiting distinct TPO peaks corresponding to metal-site coke (370 °C) and acid-site coke (520 °C). The total coke yields range from 2.0% to 2.4%, with distribution on metal and acid sites dependent on Fe loading and acidity. Structurally, the coke is highly-condensed, containing more than four aromatic rings with limited alkyl groups. The acid-site coke is more condensed than the metal-site coke, showing lower H/C ratios (0.5–0.75) relative to the acid-site coke (0.75–0.9). Identified by MALDI-TOF mass analysis, the predominant molecular structures of the coke located on metal and acid sites are illustrated. The metal-site cokes typically exhibit 4–7 aromatic rings, while the acid-site cokes display even greater condensation with 5–12 aromatic rings.
Introduction
Plastic pollution has emerged as a critical global environmental challenge, necessitating large-scale mitigation efforts. Currently, most waste plastics are disposed through landfill or incineration, resulting in relatively low recycling rates.1 Elevating waste plastic recycling beyond current levels offers several advantages, including mitigating plastic accumulation in ecosystems, reducing greenhouse gas emissions, and recovering the economic value inherent in waste plastics.2 Pyrolysis is an effective chemical recycling technique for large-scale recycling of waste plastics.3,4 By breaking down the polymers into lower-molecular-weight products, pyrolysis provides an efficient way to recover fuels from waste plastics, especially polyolefins such as polyethylene (PE) and polypropylene (PP).5 This promising recycling technology serves as a renewable alternative to fossil fuels, contributing to energy conservation and carbon emissions reduction.Thermal pyrolysis typically occurs at high reaction temperatures (usually above 500 °C), yielding long-chain paraffins with a broad distribution due to random cracking behavior.6 To lower the reaction temperature and enhance the selectivity of fuel-range products, catalysts become essential. Zeolites including HZSM-5, HY, Hβ and USY are the predominant catalysts employed.7,8 Unlike the radical mechanism observed in thermal pyrolysis, catalytic pyrolysis with these zeolite catalysts is mainly driven by carbenium ion mechanism based on the acid sites of the zeolite,9 resulting in the formation of normal or isomeric short-chain hydrocarbons. The catalytic performance is mainly influenced by catalyst acidity, porosity and morphology. Catalysts with distinct features exhibit varying catalytic behaviors. For example, the HZSM-5 which has high acidity and small pore size favors light olefin production, while those large pore-size and medium-acidity zeolites like HY, USY or FCC catalysts are more suitable for liquid fuel production.6
During the catalytic pyrolysis of polyolefins, the catalysts often suffer from deactivation due to coke deposition, primarily influenced by catalyst acidity and porosity. While high catalyst acidity benefits polymer cracking and light olefin production, it also leads to the formation of coke precursors, which subsequently grow into condensed polyaromatics. For example, Elordi et al. observed a significant reduction in coke formation on ZSM-5 zeolites during the catalytic cracking of HDPE when the SiO2/Al2O3 ratio increased from 30 to 80.10 Another critical factor affecting coke formation is the pore size and topology of the zeolites. Costa et al. reported that zeolites with similar Si/Al ratios exhibit lower coke yields when they have smaller pore sizes.11 The coke structure varies across different zeolites: the coke on ZSM-5 can be single-ring aromatics with multiple aliphatic chains attached; the coke on β zeolite contain 3–4 aromatic rings along with olefins on the aliphatic chains; the coke on Y zeolite is the most condensed, featuring aromatic rings up to 7 with few aliphatic chains.12
In recent years, extensive research has focused on bifunctional metal/zeolite catalysts for catalytic pyrolysis of polyolefins. The application of these metal/zeolite catalysts shows several advantages. They can improve conversion efficiency and product selectivity by fine-tuning the acidity of the zeolites.13,14 They also facilitate hydrocracking by their hydrogenation/dehydrogenation activities derived from the supported metallic compounds.15–17 Moreover, the incorporation of metal on zeolites significantly influences coke formation on the catalyst surface. By activating the C–H bonds of polyolefin molecules, metal/zeolite catalysts generate additional H2, effectively reducing coke deposition. For example, Jacob et al. observed significant H2 generation over a Ni/β-zeolite catalyst, disrupting the formation of coke species in the decomposition of dotriacontane and hexadecane.18 Likewise, Yao et al. found that the Ni/ZSM-5 effectively resisted coke formation in the pyrolysis of HDPE due to its high yield of H2.19
A number of metals, including Pt, Pd, Zn, Ga, Ni, Fe etc., have been applied on the metal/zeolite catalysts.9 Among these metals, Fe is the most cost-effective and exhibits remarkable catalytic activity in the pyrolysis of diverse polymers such as polyethylene,20 polystyrene,21 polycarbonate,22 or mixed waste plastics.23–25 The Fe-doped zeolites typically yield more liquid oils and improve the selectivity of some specified products. For examples, impregnating 5% Fe on HZSM-5 zeolite during mixed PE and PP pyrolysis increases liquid yield from 60% to 76% and fuel-range hydrocarbon fractions (C6–C20) from 47% to 66%.26 An 8% Fe loading on USY in PE pyrolysis elevates the oil yield from 56.6% to 72.5% and enriches the aromatics and alkenes in oil.27 However, coking behaviors differ from that observed on pure zeolites due to Fe doping, which not only alters acidity and porosity but also facilitates H2 production.28 For example, adding Fe to a Ni–V/USY catalyst significantly reduces coke formation and increases the olefin-to-paraffin ratio during n-hexane cracking.29 Clear identification of coke distribution and structure on Fe-based zeolites can guide the design of catalyst structures to resist coke deposition. It also helps catalyst regeneration and prolong their lifetime. Therefore, in this study, we detailly analyzed the coke deposited on the Fe-based USY catalysts used in the catalytic pyrolysis of PE for fuel oil. Characteristics of the coke distribution over metal and acid sites were reported, and the specific molecular chemical structure of the coke were also identified.
Experimental
Fresh catalyst preparation
The powdered USY zeolites with Si/Al ratios of 20, 60, 80 and 120 were obtained from Eco Environmental Technology Co. Ltd. Their texture properties were shown in Table S1.† Prior to use, the zeolites were calcined at 600 °C for 4 h. The Fe-doped USY catalysts were prepared by incipient wetness impregnation method using Fe(NO3)3·9H2O as the Fe precursor materials. After impregnation, the Fe-impregnated USY catalysts were sequentially dried in air at room temperature for 6 h, in oven at 80 °C for 6 h and at 110 °C for 6 h. Finally, they were calcined in a muffle furnace at 450 °C for 6 h to obtain the Fe/USY catalysts. The Fe loading contents included 2%, 5% and 10% by weight. The Fe species have been confirmed to be Fe2O3 (Fig. S1†).Coke deposition on catalysts after pyrolysis
The USY and Fe/USY catalysts underwent coke deposition after employed in the catalytic pyrolysis of PE for fuels. The catalytic pyrolysis apparatus, including the thermal and condensing units, is depicted in Fig. S2.† All the pyrolytic tests were conducted under identical reaction conditions. In each test, 10 g PE pellets and 1 g catalyst (based on the USY weight) were loaded in the reactor, which was then purged with N2 to remove the oxygen inside. The reaction temperature was within 450–460 °C, which allows complete generation of the nascent volatiles from PE pyrolysis (Fig. S3†) and the subsequent reforming over the catalysts to produce liquid fuel oils. The PE was completely converted after 30 min, and the catalysts were deposited with coke. After the reactor was cooled to room temperature, the spent catalysts that deposited with coke were obtained.Characterization of the spent catalysts
The characterization methods mainly include temperature-programmed oxidation (TPO), scanning electron microscope (SEM) and transmission electron microscope (TEM), matrix-assisted laser desorption ionization-time of flight-mass spectrometry (MALDI-TOF-MS), Fourier transform infrared spectroscopy (FTIR) and ultraviolet–visible spectroscopy (UV-Vis).The TPO tests were conducted on a thermal gravimetric (TG, NETZSCH TG 209 F3) analyzer using air as carrier gas. In each test, approximately 10 mg PE samples were placed in a crucible, followed by maintenance at 300 °C for 30 min under N2 atmosphere and then heated up to 700 °C with a ramp of 20 °C min−1 at an air flow rate of 10 ml min−1. Some of the TPO tests were combined with TCD detector to analyze the CO2, CO and H2O concentration for in situ detection of H/C ratio.
SEM images were obtained in a microscope (HITACHI SU8010) with a tungsten filament (resolution 3.5 nm) and operated at 15 kV. TEM images were obtained using a microscope (FEI Tecnai F20) at an accelerating voltage of 200 kV.
The MALDI-TOF-MS measurements were performed using a mass spectrometer (Bruker ultrafleXtreme) equipped with a N2 laser (v = 355 nm) operating at an acceleration voltage of 2000 Hz. In each test, 0.2 g spent catalyst was suspended in tetrahydrofuran and mixed with dihydroxybenzoic acid as MALDI matrix. After sonication, 1 μL solution was deposited on the sample holder and dried at room temperature. A pulsed ion extraction was optimized to 170 ns, and a total of 500 shots were provided.
FTIR analysis was performed on a FTIR spectrometer (Thermo Scientific Nicolet iS5). The wavenumber scan range was in 1000–4000 cm−1 with a resolution of 4 cm−1. UV-vis analysis was performed on a spectrometer (Shimadzu 3600-plus) at the wavelength of 200–800 nm with a resolution of 1 nm. A tungsten lamp was used for illumination and the BaSO4 powder was used as the substrate.
Results and discussion
Distribution of coke on metal and acid sites
The spent catalysts, including USY and Fe/USY, first underwent TPO analysis using a TG analyzer. The DTG curves provided insights into the nature of coke deposited on the metal and acid sites (Fig. 1). The USY zeolites with Si/Al ratios ranging from 20 to 120 show a single DTG peak centered around 560 °C, suggesting similar coke species on these zeolites. The intensity of the DTG peaks decreases with increasing Si/Al ratio (Fig. 1a), indicating that higher acidity favors coke deposition, as the USY zeolites with lower Si/Al ratios exhibit higher acidity (Table 1). An exception was observed for USY zeolite with a Si/Al ratio of 120, which shows higher coke deposition despite lower acidity, probably because of its comparatively larger size (Table S1†) that allow more coke deposition.30 When Fe2O3 was loaded on USY, the DTG curves show two deconvoluted peaks corresponding to coke deposited on metal (Fe2O3) and acid (USY) sites (Fig. 1b). The low-temperature peak around 370 °C is attributed to the metal-site coke, showing an evident increase with Fe loading content. The high-temperature peak around 520 °C represents the acid-site coke on USY, characterized by greater condensation than the metal-site coke due to the higher DTG peak temperature.31 As the Fe2O3 loading causes an acid drop of the catalyst (Table 1), the DTG intensity of acid-site coke decreases with increasing Fe loading. Notably, the peak temperature of acid-site coke shifts to lower temperature (520 °C) compared to that on pristine USY (560 °C), suggesting reduced condensation of the coke due to acid drop of the catalyst. For Fe/USY catalysts with the same 10% Fe loading, the DTG intensity of metal-site coke remained consistent, while that of the acid-site coke varies with Si/Al ratio (Fig. 1c). The decrease in acidity after Fe2O3 loading contributes to the lower DTG intensity of acid-site coke in Fe/USY catalysts compared to pristine USY. | ||
| Fig. 1 DTG curves of the coke-deposited catalysts during TPO process (deconvoluted by Gaussian curves). (a) USY zeolite with varied Si/Al ratios; (b) Fe/USY catalysts with varied Fe loading contents; (c) Fe/USY catalysts with varied Si/Al ratios. | ||
| Catalysts | Acidity (μmol NH3 per g·Cat) |
|---|---|
| USY(20) | 637.2 |
| USY(60) | 618.3 |
| USY(80) | 599.2 |
| USY(120) | 567.7 |
| 2% Fe/USY(80) | 532.9 |
| 5% Fe/USY(80) | 514.3 |
| 10% Fe/USY(80) | 497.7 |
Based on the DTG curves obtained from TPO analysis, the yields of coke deposited on both the metal and acid sites of the Fe/USY catalysts were determined (Fig. 2). Across all four Fe/USY catalysts with varied Si/Al ratios, the total coke yields fall within the range of 2.0% to 2.4%, while their distribution on metal and acid sites is different. Notably, at low Fe loading content, the acid-site coke dominates over the metal-site coke on the Fe/USY catalysts. As the Fe loading content increases, the yield of metal-site coke rises while that of the acid-site coke declines. Higher Fe loading content correlates with reduced acidity (Table 1), resulting in decreased acid-site coke production. Furthermore, the yield of acid-site coke on the Fe/USY(20) catalyst falls within the range of 1.1% to 1.8% (Fig. 2a), while the corresponding yield on Fe/USY(80) is within 1.0% to 1.3% (Fig. 2c). It highlights the pivotal role of catalyst acidity in acid-site coke formation.
 | ||
| Fig. 2 Yields of coke deposited on the acid and metal sites of the spent Fe/USY catalysts. (a) Fe/USY(20); (b) Fe/USY(60); (c) Fe/USY(80); (d) Fe/USY(120). | ||
The morphologies of fresh and spent Fe/USY catalysts were characterized by SEM and TEM (Fig. 3). The fresh Fe/USY catalyst shows a nodular surface (Fig. 3a), indicative of the Fe2O3 particles adhering to the crystal skeletons of the USY zeolite.32 The surface of the spent Fe/USY catalyst is much rougher (Fig. 3b), primarily due to coke deposition. The coke layer displays a wide and snowy-like distribution, covering both the metal and acid sites on the Fe/USY catalysts. TEM images show a clear and well-dispersed distribution of the Fe2O3 particles over the USY framework (Fig. 3c). However, identifying the coke — both metal-site coke and acid-site coke — is difficult due to its amorphous structure (Fig. 3d),30 which is obviously obtained on Y-zeolite at 400–500 °C.33 Unlike some previous studies,30,34–36 no filamentous coke is observed on the zeolite in this research, probably due to the lower pyrolysis temperature employed, as filamentous coke was significantly observed at temperatures higher than 500 °C in those studies.
 | ||
| Fig. 3 Electron microscopy analysis on the spent 10%Fe/USY(80) catalysts. (a) and (b) SEM; (c) and (d) TEM. | ||
General structures of coke on Fe/USY catalysts
To elucidate the chemical composition of the coke deposited on Fe/USY catalysts, we employed a series of characterization techniques. FTIR analysis results were utilized to illustrate the alkyl groups within the coke. The FTIR bands are mainly focused on the regions of 1000–1800 cm−1 and 2500–3200 cm−1 (Fig. 4a), excluding those above 3600 cm−1 mainly attributed to Al–OH–Si groups.37,38 Both fresh and spent Fe/USY catalysts show nearly identical FTIR signals, with bands mainly observed at 1000–1300 cm−1, corresponding to vibrational modes of the SiO4 or AlO4 tetrahedral lattice units within the USY framework.39 Spectral regions corresponding to alkyl groups (2800–3100 cm−1 and 1300–1700 cm−1)12 show negligible intensity, indicating that the coke deposited on Fe/USY catalysts contains few alkyl groups. Given the high pyrolysis temperature (450–460 °C), substantial cracking of branched alkyl chains in alkyl-aromatics occurred,40 limiting the abundance of alkyl structures within the coke. Moreover, the absence of bands corresponding to aromatics (1450–1600 cm−1)38 may suggest a severe conjugative effect within the coke, resulting in a shift of vibrational frequencies toward the ultraviolet region. To investigate the aromatic constituents further, UV-vis analysis was employed (Fig. 4b). The spent Fe/USY catalyst shows distinct absorbance signals compared to the fresh catalyst, with much stronger intensity particularly at wavelength above 410 nm. This heightened absorbance signifies a highly-condensed coke structure containing more than four aromatic rings.31 Overall, spectral analysis confirms sufficient PE decomposition on the catalyst, resulting in a generally highly-condensed coke structure with minimal alkyl substituents. | ||
| Fig. 4 Spectral analysis on the fresh and spent 10%Fe/USY(80) catalysts. (a) FTIR spectra; (b) UV-vis spectra. | ||
To further investigate the condensation of the coke structure, we performed an in situ detection of H/C ratios during TPO process of the spent Fe/USY catalyst (Fig. 5). The varying H/C ratio of the coke provides insight into the structural changes on metal and acid sites. The metal-site coke shows H/C ratios within the range of 0.75–0.9, whereas the acid-site coke displays lower H/C ratios primarily falling in the range of 0.5–0.75. This observation indicates that the acid-site coke is more condensed than the metal-site coke, consistent with the DTG findings. The acid site plays a pivotal role in PE cracking and subsequent aromatization via a carbocation mechanism.9 Meanwhile, the Fe2O3 plays an assistant role, although its catalytic cracking activity is lower than that of USY zeolite.27 Consequently, even though the metal-site coke content exceeds that of the acid-site under high Fe loading conditions, the coking process is more pronounced on the acid site than on the metal site.
 | ||
| Fig. 5 H/C ratios of the coke on the spent 10% Fe/USY(80) catalysts during TPO process. | ||
With the basic structural information from spectral analysis and H/C ratio assessments, we further investigated the spent Fe/USY catalysts through MALDI-TOF mass analysis to identify specific molecular structures of the coke. By comparing mass spectra from two spent Fe/USY catalysts with different Fe loading contents (Fig. 6), we distinguished the coke structures associated with metal and acid sites. Since the MALDI-TOF mass spectra preserve the general material structure with minimum ion fragments,41,42 the main eight MS peaks at m/z = 258, 282, 308, 356, 382, 396, 432 and 476 were ascribed to distinct coke structures. As Fe loading content increases from 5% to 10%, the relative MS intensity of the coke species at m/z = 258 and 356 increases, while that at m/z = 282, 308, 382, 396, 432 and 476 shows minor changes or a decrease. Previous discussion indicated that this increase in Fe loading primarily leads to a slight increase in metal-site coke production while the acid-site coke formation decreases a bit (Fig. 2c). Consequently, we infer that the coke species at m/z = 258 and 356 mainly represent metal-site cokes, while those at m/z = 282, 308, 382, 396, 432 and 476 are attributed to acid-site cokes or their fragments. Considering the H/C ratio range and the general coke structure — characterized by few alkyl groups but condensed structures with more than four aromatic rings — we illustrated the molecular structures of these cokes (Table 2). The metal-site cokes typically exhibit 4–7 aromatic rings, with H/C ratios ranging from 0.90 to 0.71. The acid site cokes display greater condensation, featuring 5–12 aromatic rings and lower H/C ratios ranging from 0.83 to 0.53. These results are generally accordant with the H/C ratio analysis shown in Fig. 5. Interestingly, although the molecular weight of the coke generally increases over time during pyrolysis,43 the increase of Fe loading from 5% to 10% has little influence on the molecular weight change. This suggests that the coke structure is not significantly influenced by Fe loading. It may also imply that the Fe/USY struggles to provide dissociated H species to restrict polyaromatic formation without a Ni component.44 The larger molecular weight of the acid-site coke than metal-site coke primarily results from the coke formation mechanism, where the hydrocarbon feeds follow cracking, coupling, oligomerization and cyclization reactions over the acid sites, especially the Brønsted acid sites, resulting in the coke deposition, pore blockage and catalyst deactivation.45,46
 | ||
| Fig. 6 MALDI-TOF mass spectra of the coke on the spent Fe/USY(80) catalysts. | ||
| m/z | Molecular structure | Formula | H/C | Location |
|---|---|---|---|---|
| 258 |  |
C20H18 | 0.90 | Metal site |
| 282 |  |
C22H18 | 0.82 | Acid site |
| 308 |  |
C24H20 | 0.83 | Acid site |
| 356 |  |
C28H20 | 0.71 | Metal site |
| 382 |  |
C30H22 | 0.73 | Acid site |
| 396 |  |
C31H24 | 0.77 | Acid site |
| 432 | 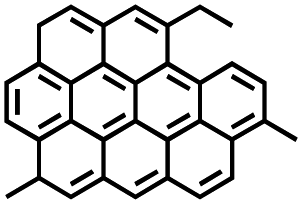 |
C34H24 | 0.71 | Acid site |
| 476 |  |
C38H20 | 0.53 | Acid site |
On the metal–acid bifunctional catalysts, cokes are often distinguished into three types according to their location and morphology.47 The metal-site coke (type I), usually termed as encapsulating coke, forms primarily from secondary reactions of the feed, followed by subsequent condensation of the coke precursors over the metal particle surface, resulting in a coke film that covers the metal particle. This encapsulating coke formed during PE pyrolysis has a relatively higher proportion of H but evolves into a more condensed filamentous coke (type II) over time.35 Such filamentous coke typically appears at the metal–support interface, resembling carbon nanotubes.48 Its formation usually requires higher temperatures (ca. 500 °C) and the presence of Ni as the metal species. The acid-site coke (type III), also known as pyrolytic coke, mainly forms on the acid site. It becomes particularly evident over extended reaction times when the metal site is fully covered with coke, leading to a drastic decrease in catalyst activity. The acid-site coke on Y-zeolites during PE pyrolysis usually contains 4–7 aromatic rings,12,43,49 higher than that observed on ZSM-5 zeolites due to the wider pores of the Y-zeolites. The acid-site coke is generally much more condensed than the metal-site coke,47 as observed in our studies. However, the acid-site coke remains comparatively less abundant than metal-site coke due to lower temperatures and shorter reaction times, especially at high Fe loading content. Increasing the Fe loading, while facilitating the liquid fuel production,27 may accelerate catalyst deactivation if the encapsulating cokes accumulate to cause pore plugging.47
The BET analysis of fresh and spent Fe/USY shows a significant decrease in micropore surface area, from 467.2 m2 g−1 to 289.9 m2 g−1, after coke deposition (Table 3). This behavior is similar to the coking observed on an Fe/BEA catalyst.44 The micropore volume also decreased noticeably in the spent Fe/USY (0.086 cm3 g−1) compared to the fresh one (0.227 cm3 g−1). These phenomena suggest that the coke deposition primarily occurred within the micropores, which is observed mainly at the initial catalyst deactivation stage.50 As the coke accumulates, the initial coke condenses to form a large coke envelope around zeolite crystals, diffusing on both internal and external surface and blocking access to micropores and acid sites.43,50
| SBET (m2 g−1) | SMicro (m2 g−1) | SMeso (m2 g−1) | Vtotal (cm3 g−1) | Vmicro (cm3 g−1) | Vmeso (cm3 g−1) | |
|---|---|---|---|---|---|---|
| Fresh | 604.8 | 467.2 | 137.6 | 0.439 | 0.227 | 0.212 |
| Spent | 401.7 | 289.9 | 111.8 | 0.245 | 0.086 | 0.159 |
Conclusions
The coke species formed on the Fe/USY catalysts after catalytic pyrolysis of polyethylene into fuels have been identified. We present insights into the coke distribution over both the metal and acid sites, as well as the specific molecular chemical structure. The coke exhibits a dispersed morphology, distributing over both the metal and acid sites. Distinct TPO peaks correspond to metal-site coke and acid-site coke, with the former displaying a lower TPO temperature (370 °C) than the latter (520 °C). The total coke yields fall within the range of 2.0% to 2.4%, while their distribution on metal and acid sites is different. At low Fe loading content, the acid-site coke predominates over metal-site coke on the Fe/USY catalysts; however, as Fe loading content increases to 10%, metal-site coke surpasses acid-site coke. From a chemical structural perspective, the coke deposited on Fe/USY catalysts reveals a highly-condensed structure containing more than four aromatic rings, albeit with limited alkyl groups. The acid-site coke is more condensed than the metal-site coke, showing lower H/C ratios (0.5–0.75) relative to the acid-site coke (0.75–0.9). Identified by the MALDI-TOF mass analysis, the predominant molecular structures of the coke located on the metal and acid sites were illustrated. Specifically, the metal-site cokes typically exhibit 4–7 aromatic rings, while the acid-site cokes display even greater condensation, featuring 5–12 aromatic rings. The coke deposition primarily occurred within the micropores during the initial catalyst deactivation stage.Data availability
The data supporting this article have been included within the manuscript and its ESI.†Author contributions
Yongli Wang: data curation, formal analysis, investigation, writing– original draft; Na Yan: methodology, software, validation; Zezhou Chen: conceptualization, funding acquisition, resources, supervision, writing – review & editing.Conflicts of interest
There are no conflicts to declare.Acknowledgements
The authors acknowledge the financial support from National Natural Science Foundation of China (No. 52100143).Notes and references
- R. Geyer, J. R. Jambeck and K. L. Law, Sci. Adv., 2017, 3, 0782 CrossRef.
- I. Vollmer, M. J. F. Jenks, M. C. P. Roelands, R. J. White, T. van Harmelen, P. de Wild, G. P. van der Laan, F. Meirer, J. T. F. Keurentjes and B. M. Weckhuysen, Angew. Chem., Int. Ed., 2020, 59, 15402–15423 CrossRef CAS.
- R. Mishra, A. Kumar, E. Singh and S. Kumar, ACS Sustainable Chem. Eng., 2023, 11, 2033–2049 CrossRef CAS.
- S. H. Chang, Sci. Total Environ., 2023, 877, 162719 CrossRef CAS PubMed.
- M. Jahirul, M. Rasul, D. Schaller, M. Khan, M. Hasan and M. Hazrat, Energy Convers. Manage., 2022, 258, 115451 CrossRef CAS.
- G. Lopez, M. Artetxe, M. Amutio, J. Bilbao and M. Olazar, Renewable Sustainable Energy Rev., 2017, 73, 346–368 CrossRef CAS.
- L. O. Mark, M. C. Cendejas and I. Hermans, ChemSusChem, 2020, 13, 5808–5836 CrossRef CAS.
- Y. Peng, Y. Wang, L. Ke, L. Dai, Q. Wu, K. Cobb, Y. Zeng, R. Zou, Y. Liu and R. Ruan, Energy Convers. Manage., 2022, 254, 115243 CrossRef CAS.
- Z. Dong, W. Chen, K. Xu, Y. Liu, J. Wu and F. Zhang, ACS Catal., 2022, 12, 14882–14901 CrossRef CAS.
- G. Elordi, M. Olazar, M. Artetxe, P. Castaño and J. Bilbao, Appl. Catal., A, 2012, 415, 89–95 CrossRef.
- C. S. Costa, H. Dao Thi, K. M. Van Geem, M. Rosário Ribeiro and J. M. Silva, Sustainable Energy Fuels, 2022, 6, 3611–3625 RSC.
- P. Castaño, G. Elordi, M. Olazar, A. T. Aguayo, B. Pawelec and J. Bilbao, Appl. Catal., B, 2011, 104, 91–100 CrossRef.
- S. Kokuryo, K. Miyake, Y. Uchida, S. Tanaka, M. Miyamoto, Y. Oumi, A. Mizusawa, T. Kubo and N. Nishiyama, ACS Omega, 2022, 7, 12971–12977 CrossRef CAS PubMed.
- L. Dai, N. Zhou, Y. Lv, K. Cobb, Y. Cheng, Y. Wang, Y. Liu, P. Chen, R. Zou, H. Lei and R. Ruan, Energy Convers. Manage., 2021, 245, 114578 CrossRef CAS.
- B. C. Vance, P. A. Kots, C. Wang, Z. R. Hinton, C. M. Quinn, T. H. Epps, L. T. J. Korley and D. G. Vlachos, Appl. Catal., B, 2021, 299, 120483 CrossRef CAS.
- S. Liu, P. A. Kots, B. C. Vance, A. Danielson and D. G. Vlachos, Sci. Adv., 2021, 7, eabf8283 CrossRef CAS PubMed.
- J. E. Rorrer, G. T. Beckham and Y. Román-Leshkov, JACS Au, 2021, 1, 8–12 CrossRef CAS.
- J. H. Miller, A. K. Starace and D. A. Ruddy, ChemSusChem, 2022, 15, e202200535 CrossRef CAS PubMed.
- D. Yao, H. Yang, H. Chen and P. T. Williams, Appl. Catal., B, 2018, 227, 477–487 CrossRef CAS.
- E. Borsella, R. Aguado, A. De Stefanis and M. Olazar, J. Anal. Appl. Pyrolysis, 2018, 130, 320–331 CrossRef CAS.
- J.-S. Kim, W.-Y. Lee, S.-B. Lee, S.-B. Kim and M.-J. Choi, Catal. Today, 2003, 87, 59–68 CrossRef CAS.
- J. Wang, J. Jiang, X. Meng, M. Li, X. Wang, S. Pang, K. Wang, Y. Sun, Z. Zhong and R. Ruan, Environ. Sci. Technol., 2020, 54, 8390–8400 CrossRef CAS.
- A. López, I. De Marco, B. Caballero, M. Laresgoiti, A. Adrados and A. Aranzabal, Appl. Catal., B, 2011, 104, 211–219 CrossRef.
- K. Li, J. Lei, G. Yuan, P. Weerachanchai, J.-Y. Wang, J. Zhao and Y. Yang, Chem. Eng. J., 2017, 317, 800–809 CrossRef CAS.
- S. Malik, H. Gulab, K. Hussain, M. Hussain and M. Haleem, Int. J. Environ. Sci. Technol., 2022, 19, 4019–4036 CrossRef CAS.
- U. Dwivedi, S. Naik and K. Pant, Waste Manag., 2021, 132, 151–161 CrossRef CAS PubMed.
- Z. Chen, B. J. Erwin and L. Che, Fuel, 2024, 363, 131007 CrossRef CAS.
- S. Li, Y. Xue, Y. Lin, B. Wang and X. Gao, ACS Sustainable Chem. Eng., 2023, 11, 10108–10118 CrossRef CAS.
- A. S. Escobar, M. M. Pereira and H. S. Cerqueira, Appl. Catal., A, 2008, 339, 61–67 CrossRef CAS.
- G. Elordi, M. Olazar, G. Lopez, P. Castaño and J. Bilbao, Appl. Catal., B, 2011, 102, 224–231 CrossRef CAS.
- P. Castaño, G. Elordi, M. Ibañez, M. Olazar and J. Bilbao, Catal. Sci. Technol., 2012, 2, 504–508 RSC.
- Q. Liu, B. Peng, Q. Zhou, A. Zheng, X. Gao, Y. Qi, S. Yuan, Y. Zhu, L. Zhang, H. Song and Z. Da, Catal. Sci. Technol., 2022, 12, 4145–4156 RSC.
- Y. S. Zhang, R. E. Owen, P. R. Shearing, W. C. Maskell, D. J. L. Brett and G. Manos, J. Anal. Appl. Pyrolysis, 2019, 141, 104630 CrossRef CAS.
- C. Wu and P. T. Williams, Appl. Catal., B, 2010, 96, 198–207 CrossRef CAS.
- A. Ochoa, I. Barbarias, M. Artetxe, A. G. Gayubo, M. Olazar, J. Bilbao and P. Castaño, Appl. Catal., B, 2017, 209, 554–565 CrossRef CAS.
- Y. Fan, Y. Cai, X. Li, H. Yin and J. Xia, J. Ind. Eng. Chem., 2017, 46, 139–149 CrossRef CAS.
- P. Yan, S. Xi, H. Peng, D. R. G. Mitchell, L. Harvey, M. Drewery, E. M. Kennedy, Z. Zhu, G. Sankar and M. Stockenhuber, J. Am. Chem. Soc., 2023, 145, 9718–9728 CrossRef CAS PubMed.
- P. Yan, X. Tian, E. M. Kennedy and M. Stockenhuber, J. Catal., 2023, 427, 115102 CrossRef CAS.
- N. Ya’aini, N. A. S. Amin and S. Endud, Microporous Mesoporous Mater., 2013, 171, 14–23 CrossRef.
- Z. Chen, X. Zhang, Z. Liu, Q. Liu and T. Xu, Fuel Process. Technol., 2018, 178, 126–132 CrossRef CAS.
- L. Pinard, S. Hamieh, C. Canaff, F. Ferreira Madeira, I. Batonneau-Gener, S. Maury, O. Delpoux, K. Ben Tayeb, Y. Pouilloux and H. Vezin, J. Catal., 2013, 299, 284–297 CrossRef CAS.
- H. S. Cerqueira, C. Sievers, G. Joly, P. Magnoux and J. A. Lercher, Ind. Eng. Chem. Res., 2005, 44, 2069–2077 CrossRef CAS.
- Z. Chen, X. Zhang, F. Yang, H. Peng, X. Zhang, S. Zhu and L. Che, Appl. Catal., A, 2021, 609, 117873 CrossRef CAS.
- P. Yan, E. M. Kennedy, H. Zhang and M. Stockenhuber, Fuel, 2023, 332, 125946 CrossRef CAS.
- P. Yan, I. Nur Azreena, H. Peng, H. Rabiee, M. Ahmed, Y. Weng, Z. Zhu, E. M. Kennedy and M. Stockenhuber, Chem. Eng. J., 2023, 476, 146630 CrossRef CAS.
- P. Yan, M. Drewery, J. Mensah, J. C. Mackie, E. Kennedy and M. Stockenhuber, Top. Catal., 2020, 63, 778–792 CrossRef CAS.
- A. Ochoa, J. Bilbao, A. G. Gayubo and P. Castaño, Renewable Sustainable Energy Rev., 2020, 119, 109600 CrossRef CAS.
- A. Veksha, W. Chen, L. Liang and G. Lisak, J. Hazard. Mater., 2022, 435, 128949 CrossRef CAS PubMed.
- A. Marcilla, A. Gómez-Siurana and F. J. Valdés, Appl. Catal., A, 2009, 352, 152–158 CrossRef CAS.
- V. Daligaux, R. Richard, M. Marin-Gallego, V. Ruaux, L. Pinard and M. H. Manero, Appl. Catal., A, 2024, 671, 119581 CrossRef CAS.
Footnote |
| † Electronic supplementary information (ESI) available. See DOI: https://doi.org/10.1039/d4ra03608e |
| This journal is © The Royal Society of Chemistry 2024 |