
 Open Access Article
 This Open Access Article is licensed under a Creative Commons Attribution-Non Commercial 3.0 Unported Licence
Study of the correlation between the magnetic and electrical properties of the La0.6Sr0.4MnO3 compound†
H. Gharsallahab,
M. Jeddi a,
M. Bejar*ac,
E. Dhahria and
S. Nouarid
a,
M. Bejar*ac,
E. Dhahria and
S. Nouarid
aLaboratoire de Physique Appliquée, Faculté des Sciences, Université de Sfax, B. P. 1171, 3000 Sfax, Tunisia. E-mail: bejar_moez@yahoo.fr; Fax: +216 74 676 609; Tel: +216 98 333 873
bInstitut Préparatoire aux Études d'Ingénieur de Sfax, Université de Sfax, BP 1172, 3018 Sfax, Tunisia
cFaculté des Sciences de Monastir, Université de Monastir, Avenue de l'environnement, 5019 Monastir, Tunisia
dDepartment of Mechanical Engineering, King Fahd University of Petroleum and Minerals, Dhahran, Saudi Arabia
First published on 8th July 2024
Abstract
In this work, we investigated the relationship between the electrical and magnetic properties of the superparamagnetic (SPM) La0.6Sr0.4MnO3 (S1C0) compound prepared by the sol–gel method. The (S1C0) sample displayed a ferromagnetic metallic (FMM) behavior at low temperatures and a paramagnetic semiconductor (PMSC) behavior at high temperatures. The FMM behavior was described by the Zener Double Exchange (ZDE) polynomial law containing the contributions of the electron–electron (e–e) interactions and the electron–magnon (e–m) scattering. The PMSC behavior was described by the Mott Variable Range Hopping (Mott-VRH) transport model. The semiconductor/metallic transition temperature has been approximated at the blocking temperature. The Thermal Coefficient of Resistivity (TCR), which exhibits a linear variation around ambient temperature, can be used as a calibration curve for thermometry. Thus, our sample can be considered as a good candidate for the detection of infrared radiation used in night vision bolometer technologies.
1. Introduction
The manganites of perovskite structure, having the general formula RE1−xAExMnO3 (RE = trivalent Rare-Earth, AE = bivalent Alkaline Earth Ca, Sr and Ba), offer a high degree of chemical flexibility with a complex interplay between structure and the electronic and magnetic properties. This leads to a very rich phase diagram involving various metallic, insulating and magnetic phases.1–7 At high temperature, the paramagnetic (PM) phase has been detected. However, at low temperatures, both antiferromagnetic (AFM) and ferromagnetic (FM) phases have been observed. The FM phase can be either insulating for x < 0.2, or metallic for 0.2 < x < 0.45. For the higher concentration values (0.45 < x < 1), the ground state was found to be AFM and nonmetallic.8 In this type of compounds, manganese presents the Mn3+/Mn4+ mixed valence, which is controlled by the rate of substitution x. This valence is considered as a crucial parameter controlling the structural, electrical and magnetic properties of manganites. Jonker and Santen9 showed that, in this type of compounds, the FM properties can be understood as the result of a strong positive Mn3+/Mn4+ exchange interaction combined with a weak Mn3+/Mn3+ interaction and a negative Mn4+/Mn4+ interaction. These mixed valence manganites have attracted a lot of attention, since the middle of the twentieth century, due to their potential magnetic applications using their high magnetoresistance effect (MR) defined as a decrease of the resistivity when a magnetic field is applied.10,11 Also, these manganites are considered of great interest due to their specific features, such as metal–insulator transition, ferromagnetic-(FM–PM) phase transition, charge and orbital ordering and lattice degree of freedom.12,13 These materials are found to exhibit a ferromagnetic-metal (FMM) to paramagnetic-insulator (PMI) transition near the Curie temperature TC.From the last decade of the 20th century, numerous studies have been published on the magnetic and magnetoresistive properties of lanthanum manganites. The La1−xSrxMnO3 compounds are among those which have been the subject of the greatest number of publications concerning the properties of substituted lanthanum manganites.14–18 In fact, the phase diagram of La1−xSrxMnO3 (ref. 16) show that these compounds can exist in different magnetic and electric phases according to the value of the concentration (x) of the AE bivalent element.
Magnetic nanoparticles display physical and chemical properties different to those found in their corresponding bulk materials. These properties make them attractive in widespread applications, such as energy, electronics, sensor designs of all kinds, catalysts, magnetic refrigeration, optics and in various biomedical applications.17–19
For the reasons previously mentioned, we will study in this paper, the correlation between the electrical and magnetic properties of super-paramagnetic (SPM) nanoparticles La0.6Sr0.4MnO3 (S1C0), who exhibits the highest FM/PM temperature transition of the La1−xSrxMnO3 series.
2. Experiment
2.1. Sample preparation
The polycrystalline La0.6Sr0.4MnO3 (S1C0) sample was prepared by the citric-gel method using La(NO3)3·6H2O, Sr(NO3)2 and Mn(NO3)2·4H2O as precursors These precursors were dissolved in deionized water in a separate beaker and mixed with the solution of citric acid and ethylene glycol, at constant stirring, in the ratio of (1[Mn(NO3)2·4H2O])/1[citric acid]/⅔[ethylene glycol] to get a transparent stable solution. The obtained solution was then heated at 80 °C to eliminate excess water. The resulting solution was converted into viscous glassy gels and dried at 120 °C to get dark grayish products. In order to ensure the decomposition of nitrate/citrate complexes, the organic components and the residual organic compounds of the precursors, the obtained products were ground, calcined at 700 °C for 12 h and converted into pellets. Finally, these pellets were annealed at 900 °C for 18 h to get the desired nanoparticles manganite.202.2. Characterizations
The morphology of the surface and fracture surfaces of the sample as well as an elemental analysis by X-ray microanalysis (Energy Dispersion Spectroscopy EDS) were carried out by Transmission Electron Microscopy (TEM) at the Beni-Mellal Materials Physics Laboratory of the Faculty of Science and Technology; Sultan Moulay Slimane University (Morocco). A small amount of the sample was dissolved in ethanol and then exposed to ultrasound to ensure good dispersion. A drop is then deposited on a copper grid, which serves as a sample holder. Finally, the drop is dried by a lamp in order to evaporate the ethanol. Surfaces were covered with carbon before microscopic observation.The crystalline structure and phase purity of the prepared sample were examined by powder X-ray Diffraction (XRD) with Cu Kα radiation (λ = 1.5406 Å), at room temperature, by a step scanning of 0.016° in the range of 20° ≤ 2θ ≤ 90°. The data were analyzed by the Rietveld method using the Fullproof SOFTWARE.21,22
Magnetic measurements of magnetization (M) as a function of temperature (T), under different values of an applied magnetic field (μ0H), have been carried out with the BS1 and BS2 developed at the Louis Néel Laboratory in Grenoble. The isothermal magnetization curves M(μ0H), at a temperature of 5 K, were carried out under a magnetic field between 0 and 10 T. The hysteresis cycles, at different temperatures below the Curie temperature and at magnetic fields between (−10 T) and (10 T), were performed.
The temperature dependence of electrical resistance was measured with standard four-probe method in a commercial Physical Property Measurement System (Quantum Design PPMS) under different magnetic field.
3. Results and discussion
3.1. Purity, homogeneity and structure
The elemental composition and the homogeneity of our (S1C0) sample were studied by X-ray microanalysis (Energy Dispersion Spectroscopy: EDS). Fig. 1(a) shows the presence of the characteristic peaks of the La, Sr, Mn and O chemical elements introduced during the elaboration. These elements have practically the same proportions at different locations,4 which confirms the homogeneity of the sample. The characteristic copper (Cu) peaks correspond to the sample holders, while the carbon is used to prepare the sample for observation. | ||
| Fig. 1 (a) X-ray microanalysis (Energy Dispersion Spectroscopy: EDS). (b) TEM micrograph of particle size. (c) The dispersion in the number of grains (counts) according to their size (nm). (d) X-ray diffraction pattern: The observed (red circle), calculated (continuous black line) and difference patterns (blue line at the bottom) of X-ray diffraction data. Asterisks show the presence of the minority secondary phase Mn3O4. | ||
In order to study the grain size distribution, we have used the images provided by (TEM). Fig. 1(b) shows an example of the top view of the surface morphologies of (S1C0) sample. A manual statistical count of the grain size was performed on this image using the Image-J software. The results, showed in Fig. 1(c) as grain number (counts) versus grain size (nm), reveal a dispersion in the grain size following a Lorentzian law with a most common size around 78 nm and an average value of 96 nm. The goodness of fit was assessed by the square of the linear correlation coefficient (R2). The obtained value of (R2) reaches 99.9%.
The refinement of the structure as well as the lattice parameters were carried out by the Rietveld method,17 using the “Full Prof” program.18 As mentioned in our previous work,20 the Rietveld refinements of the XRD data revealed that our sample is indexed in the orthorhombic structure with the Pbnm space group. The Rietveld refinement of the XRD Pattern is presented in Fig. 1(d) showing the most intense reflections (hkl) peaks. The related refined structural parameters are given in Table S1 (seeESI).†
The crystallite size (DSC) and the micro strain (ε) were determined, using the following relationships:23–26
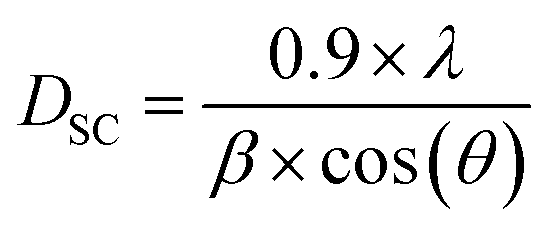 | (1) |
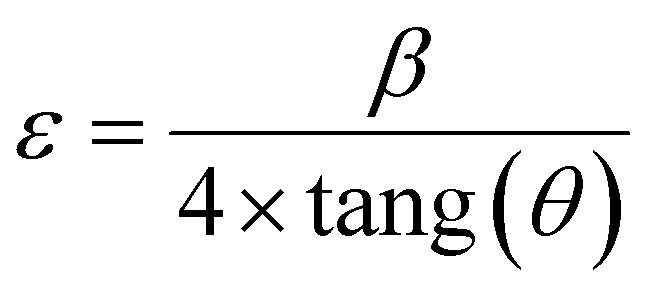 | (2) |
The obtained values are then DSC = 27 nm and ε = 4.50 × 10−3.20,27
The agglomeration rate, defined as the ratio of the average grain size to that of the crystallites, is about 3.59. This can explain the relatively high value of micro strain compared to those obtained with thin films, in TiSiN, having micro strain varying from 1.6 × 10⁻³ to 2.58 × 10⁻³, as mentioned by Bushroa et al.28
3.2. Magnetic properties
Fig. 2(a) shows the variation of magnetization as a function of temperature in Zero-Field-Cooled (ZFC) and Field-Cooled (FC) modes, under an applied magnetic field of 0.05 T. From the FC mode, it is clear that (S1C0) sample exhibits a PM behavior at high temperatures and a FM order at low temperatures. This FM behavior is confirmed by the evolution, at 5 K, of the magnetization as a function of the applied magnetic field, in the inset of Fig. 2(a). In fact, the magnetization increases abruptly by application of weak fields and saturates for fields greater than 1 T. The transition temperature TC, called Curie temperature, corresponding to the minimum of the first derivative dMFC/dT was found to be equal to TC = 365 K. | ||
| Fig. 2 (a) The temperature dependence of the magnetization measured under a magnetic field of 0.05 T, in the ZFC and FC modes. In the insert, the applied magnetic field-dependence of the magnetization measured at temperature of 5 K. (b) The complete M(μ0H) hysteresis loop for S1C0 at 5 and 300 K. The inset of (b) a zoom of the hysteresis cycles for weak magnetic fields. | ||
The irreversibility between the M(T) curves in FC and ZFC modes, below a so-called irreversibility temperature Ti ≈ 350 K, indicates the presence of a magnetic anisotropy within (S1C0) sample.27,29 The ZFC curve describes a broad peak centered on the blocking temperature TB = 195 K. This magnetic anisotropy is observed with nanoparticles, having the stable monodomain configuration, where the magnetization has a preferential direction.30 This magnetization can reverse spontaneously under the effect of thermal agitation or magnetic field. This regime of magnetic fluctuations is quite simply the paramagnetism of the macro spin of the monodomain and it is thus called superparamagnetism (SPM). For temperatures below the blocking temperature (TB), the magnetic anisotropy energy outweighs the thermal agitation energy, which explain the increase of the magnetization when the temperature rises. For temperatures above the blocking temperature, the thermal agitation energy predominates leading to the usual decrease in magnetization when increasing the temperature, characteristic of the SPM phenomenon. These observations are confirmed by the variation of the inverse of the magnetic susceptibility (χ−1) as a function of the temperature (T), represented in Fig. S1 (see ESI).† The χ−1(T) curve presents two linear branches. The first one is fitted with the Curie–Weiss law,31 indicating the PM–FM transition at θWC = 368 K value quite equal to the Curie temperature TC ≈ 365 K. On the other hand, the linear adjustment of the second branch, shows the existence of another temperature characteristic of the magnetic properties Ti ≈ 350 K. This indicates the existence of (SPM) clusters within the (FM) phase in the temperature interval between TB and TC. So, the irreversibility temperature Ti can be defined as the temperature of a SPM/PM transition.
In order to confirm the single-domain configuration and the existence of (SPM) clusters in the (FM) phase in the temperature range between TB and TC, hysteresis cycles, for magnetic fields ranging from −10 T to 10 T at different temperatures, were performed in Fig. 2(b). These curves clearly indicate very low hysteresis losses for very low temperatures, which justifies the monodomain configuration of our sample. The inset of Fig. 2(b) shows that, when the temperature increases between TB and TC, the remanent magnetization and the coercive field decrease and become zero, confirming the presence of a SPM behavior. These results are similar to those obtained by Manh et al.,30 revealing that nanometric particles, of La0.7Sr0.3MnO3 solution sintered at 700 °C, are the site of a superparamagnetism phenomenon.
3.3. Magneto-transport study
The temperature dependence of electrical resistance R(T) (proportional to the resistivity ρ(T)) of the (S1C0) sample is shown in Fig. 3(a), for the temperature range of 100 to 500 K and under different applied magnetic fields of 0, 2 and 5 T. By decreasing temperature, (S1C0) sample exhibits a single insulator (or semiconductor)–metallic (I–M) transition at TR. This transition temperature is found to increase from 200 K in the absence of the magnetic field, to 235 K for 5 T. We can also note the decrease in resistance by the increase of the magnetic field (Table 1) revealing that a magnetic field promotes the electrical conduction. This transition is the result of the competition between the double exchange (DE) mechanism, favoring the FM interaction, and the super exchange (SE) one, approving the AFM interaction.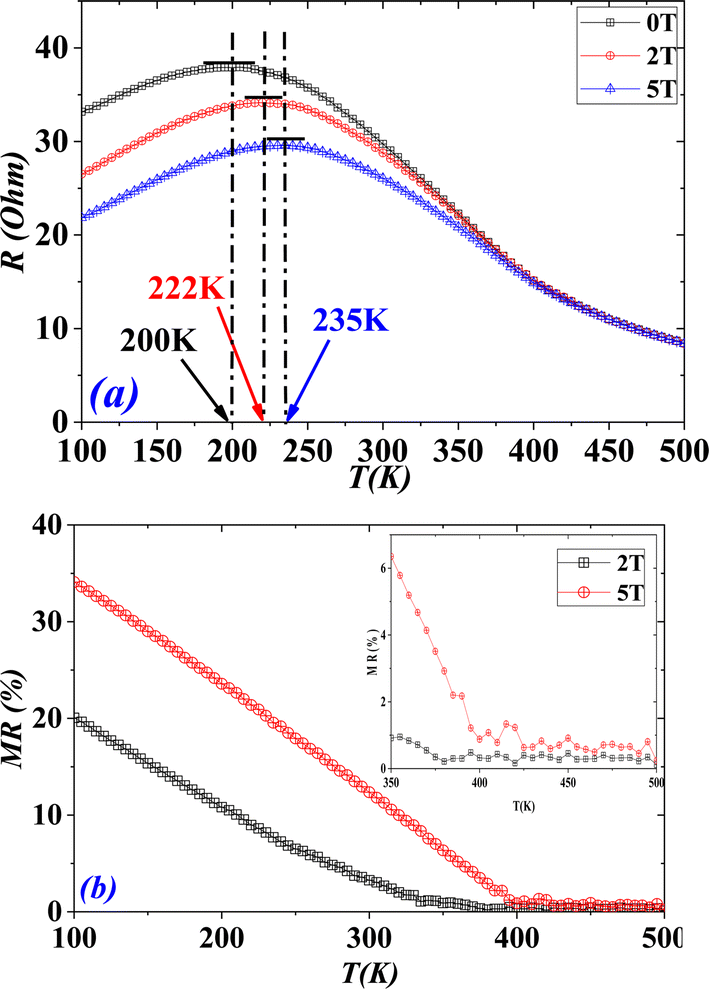 | ||
| Fig. 3 (a) Temperature dependence of resistance R(T) for (S1C0) under different applied magnetic fields of 0, 2 and 5 T. (b) The variation of MR% (T,μ0H), as a function of temperature for 2 T and 5 T. | ||
| μ0H (T) | 0 | 2 | 5 |
|---|---|---|---|
| TR (K) | 200 | 222 | 235 |
| Rmax (Ω) | 37.907 | 34.266 | 29.632 |
 |
100 | 90.39 | 78.17 |
| MRmax (%) | 20.1 | 34.1 | |
| T(MRmax) (K) | 100 | 100 | |
| 100 × |TCR (K−1)|max | 0.88 | 0.84 | 0.75 |
| T(|TCR|max) (K) | 370 | 370 | 370 |
The (DE) model introduced by Zener32,33 and taken up by Anderson and De Gennest34,35 aims to explain the FMM behavior of certain doped compounds.36 This coupling considers the hop of electrons eg between Mn3+ (3t2g1eg) and Mn4+ (3t2g) ions, using oxygen as the jump intermediate. Thus, an electron eg from Mn3+ jumps to the O2− ion, at the same time as an electron from the O2− ion jumps to the Mn4+ cation. The hop probability of the electrons eg being governed by the scalar product between the core spins of the electrons t2g of the Mn3+ and Mn4+ ions in order to satisfy Hund's rule. As a result, the hop of an electron eg will be all the easier if the spins of the two considered Mn3+ and Mn4+ ions are parallels. This leads to a very strong parallel between magnetism and transport properties, where ferromagnetism favoring electronic conduction and vice versa.
The (SE) theory was developed by several physicists as early as 1934 by Kramers,37 Anderson,38–40 Van Vleck41 and Goodenough.42,43 The super exchange, explained by the Goodenough–Kanamori rules for a Mn–O–Mn bond,44 makes it possible to explain, among other things, the AFM coupling between the manganese ions Mn3+–O2−–Mn3+. In fact, the eg orbitals of Mn3+ cations each have one electron. Electrons placed on the 2p orbitals of oxygen can occupy the eg orbitals, provided that each of their spins is in an antiparallel configuration with respect to the eg electrons, and this in accordance with the Pauli principle. We can therefore predict AFM and strong Mn3+–O2−–Mn3+ interactions due to the strong hybridization of the eg orbitals. SE theory assumes localized electrons. Therefore, a compound in which the magnetic structure is dominated by SE shows, at the level of electrical conductivity, the behavior of an insulator. These explanations are perfectly illustrated in Fig. S2(a)–(c) (see ESI),† where we have represented, on the same graph, the variations according to the temperature of the magnetization and the electrical resistance of (S1C0) sample. At low temperatures, the metallic behavior (dρ(T)/dT > 0) is associated with a FM comportment. While the insulator behavior (or semiconductor) (dρ(T)/dT < 0), at high temperatures, is associated with a magnetic disorder. It remains to be noted that the metal/insulator (M/I) transition temperature is significantly lower than that of the magnetic (FM/PM) one. The same comportment has been observed for many studies.19,45,46 In our case, TC ≈ 365 K for a magnetic field of 0.05 T and TR ≈ 200 K for a zero magnetic field. This last temperature is substantially equal to the Blocking temperature TB ≈ 195 K. This seems to be logical, since this temperature TB is the limit of dominance of the magnetic anisotropy energy (for T lower than TB) which favors the orientation of the macro spins along a preferential direction. Under these conditions, electrical conduction is favored. Hence the metallic behavior for T lower than TB. For temperatures higher than TB, it is the energy of thermal agitation which prevails, hence the fluctuation of the macro spins and the SPM behavior of the material for such temperatures. This explains the insulating (or semi-conducting) dependence of the material at high temperatures and hence the increase of the TR temperature value with increasing the magnetic field (μ0H).
The coexistence of the FM order and the metallic behavior, at low temperatures, causes a relative decrease of the resistance under the effect of a magnetic field known under the name of the magnetoresistance (MR) effect (Fig. 3(a)). This effect can be evaluated by the following relationship:1,3,45,46
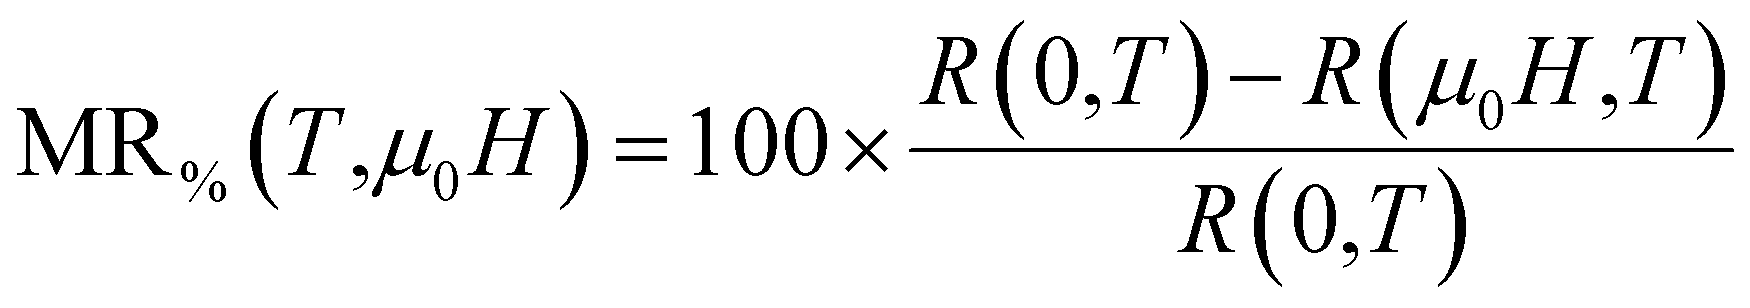 | (3) |
These values and this behavior are similar to those obtained by Fu Yonglai and C. K. Ong,47 in the bulk polycrystalline samples of La0.7Ca0.3−xSrxMnO3 for x = 0.05, 0.15 and 0.2. Also, these characteristics are similar to those obtained by Y. K. Lakshmi and P. V. Reddy,48 in the case of nanocrystalline La0.7Ca0.3−xAgxMnO3, for x = 0 over the entire temperature range of the measurements, but different for x = 0.1, 0.2 and 0.3, where we note the existence of a peak around the (M/I) transition temperature.
The MR observed at low temperatures, qualified as extrinsic MR (EMR), is due to the spin tunneling effect through the grain boundaries.49,50 However, the MR observed near the transition temperature TR, qualified as intrinsic MR (IMR), takes place in the volume of the grain and is governed by the DE mechanism.32,51–53 A comparative study of the electrical properties of (S1C0) with those of the compound mentioned above as well as other compounds has been summarized in Table S2 (see ESI†).45–48,52–55
To probe the sensitivity of infrared detector to temperature, in oxide-based manganites, a key requirement is to have materials with high thermal coefficient of resistivity (TCR) value, expressed by equation:
 | (4) |
The (TCR) represents an important parameter for device applications concerning the infrared detectors (IR) for night vision technologies (bolometer).56–60 The temperature dependence of (TCR), for 0, 2 and 5 T, have been plotted in Fig. 4(a). Our (S1C0) sample is characterized by a positive (TCR) value for low temperatures (related to metallic behavior) and a negative (TCR) one for high temperatures (related to insulating or semiconductor behavior). We can remark that the (TCR) values, for our compound, are not very sensitives to the application of an external magnetic field (Fig. 4(a)). In fact, it's clear that the application of an external magnetic field leads to a slightly increase of the (TCR) value in the (FM) phase without any effect in the (PM) one. Over the entire measurement temperatures range, |TCR| does not exceed 1%. For a zero magnetic field, the maximums of |TCR| is obtained around the FM/PM transition Curie temperature: |TCR|peak (0 T, 375 K) = 0.0080 K−1.
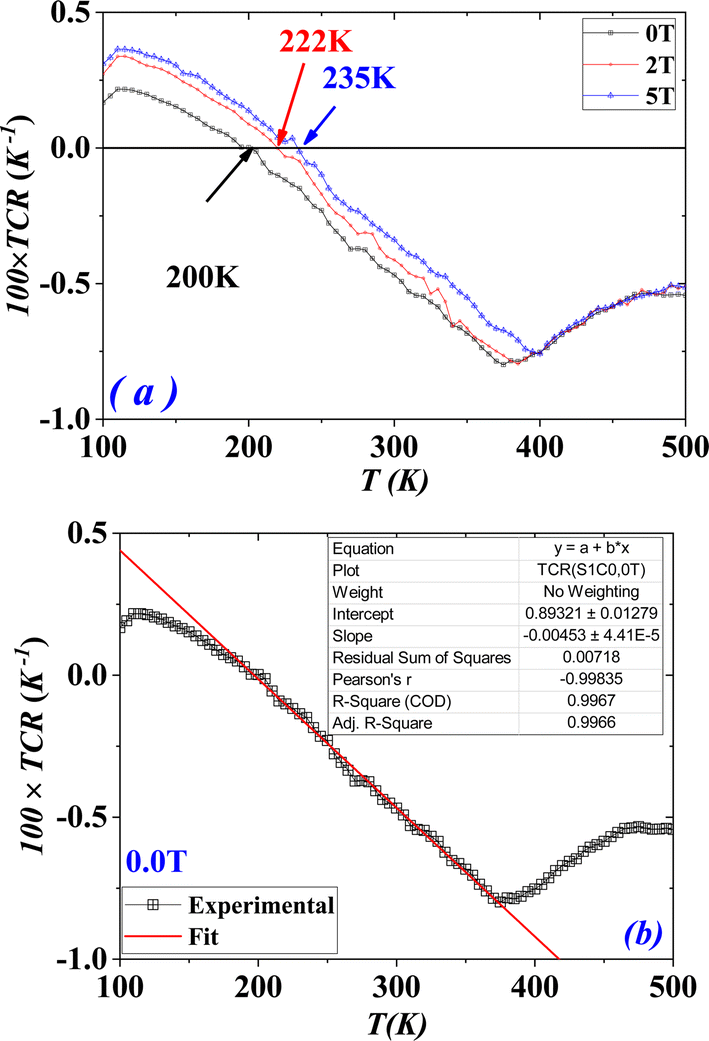 | ||
| Fig. 4 (a) The temperature dependence of (TCR), for 0, 2 and 5 T. (b) The adjustment of the TCR, in the absence of a magnetic field, according to the temperature shows a linear evolution between 195 and 375 K. This curve can therefore be used to calibrate a measuring thermometer in the temperature range indicated above. Thus, our sample can be considered as a good candidate for the detection of infrared radiation used in night vision bolometer technologies. | ||
In the presence of a magnetic field, we obtain practically the same maximum value of |TCR|peak, for FM/PM transition temperatures (|TCR|peak (2 T, 385 K) = 0.0080 K−1 and |TCR|peak (5 T, 400 K) = 0.0076 K−1) (Table 2) slightly higher than that obtained in the absence of the magnetic field. This is predictable, since the application of a magnetic field favors magnetic order in favor of magnetic disorder. We also note that the variation of the TCR, as a function of temperature, is practically linear over a wide temperature range around room temperature, whatever the magnetic field applied. For example, the adjustment of the TCR, in the absence of a magnetic field, according to the temperature shows a linear evolution between 195 and 375 K (Fig. 4(b)). This curve can therefore be used to calibrate a measuring thermometer in the temperature range indicated above. Thus, our sample can be considered as a good candidate for the detection of infrared radiation used in night vision bolometer technologies. A comparative study of the sensitivity, of our (S1C0) compound with other samples, to infrared radiation has been summarized in Table S2 (see ESI).†
| μ0H (T) | 0 | 2 | 5 |
|---|---|---|---|
| Model ① | R(T) = R0 + R2T2 + R4.5T4.5 | ||
| R0 (Ω) | 29.09 | 21.66 | 17.57 |
| R2 (Ω K−2) | 4.44 × 10⁻⁴ | 5.22 × 10⁻⁴ | 4.57 × 10⁻⁴ |
| R4.5 (Ω K−4.5) | −0.41 × 10⁻⁹ | −0.40 × 10⁻⁹ | −0.31 × 10⁻⁹ |
![[thin space (1/6-em)]](https://www.rsc.org/images/entities/char_2009.gif) |
|||
| Model ② | R(T) = R0 + R2T2 + R5T5 | ||
| R0 (Ω) | 29.30 | 21.86 | 17.73 |
| R2 (Ω K−2) | 4.09 × 10⁻⁴ | 4.88 × 10⁻⁴ | 4.30 × 10⁻⁴ |
| R5 (Ω K−5) | −0.26 × 10⁻¹⁰ | −0.25 × 10⁻¹⁰ | −0.20 × 10⁻¹⁰ |
|
|||
| Model ③ |  |
||
| R0 (Ω) | 16.66 | 8.53 | 6.39 |
| R2 (Ω K−2) | 93.78 × 10⁴ | 30.72 × 10⁴ | 3.05 × 10⁴ |
| T2 (K) | 25182 |
8226 | 10309 |
| Rn (Ω K−n) | 2.17 | 1.48 | 1.02 |
| n | 0.44 | 0.54 | 0.54 |
3.4. Transport mechanism
To better understand the transport mechanism in the (S1C0) compound, we tried to test the validity of some theoretical model.At low temperatures, the behavior is metallic and the resistivity is therefore interpreted in terms of elastic and inelastic scattering. The different diffusion mechanisms are generally temperature dependent with particular power laws. Thus, the resistivity is often described by a polynomial in T, of the form ρ(T) = ρ0 + ∑ρnTn, where ρ0 is the residual resistivity, at T = 0 K, caused by grain boundaries.61,62 Based on previous work,63–69 we choose to work with the models described by the eqn (5) and (6) based on the Zener Double Exchange (ZDE) polynomial law and eqn (7) based on the Small Polaron Conduction Mechanism (SPCM):70
| ρ(T) = ρ0 + ρ2T2 + ρ4.5T4.5 | (5) |
| ρ(T) = ρ0 + ρ2T2 + ρ5T5 | (6) |
 | (7) |
The variation in T2 has been attributed to the electron–electron (e–e) interactions.63,64 The term ρ4.5T4.5 is caused by the contribution of the electron–magnon (e–m) scattering.65,66 However, the ρ5T5 term is due to the electron–phonon (e–ph) interactions.67–69 Finally, in the (SPCM) model proposed by Alexandrov and Bratkovsky,70 where E is a constant proportional to the effective mass of polarons; i.e., the (e–ph) coupling strength; ωs is the average frequency of the softest optical mode and ρn is the fitting coefficient.
The fittings of the experimental curves of resistance R(T), with the eqn (5)–(7), show, in Fig. S3 (see ESI),† a good agreement between the experiment and the chosen model. The quality of these fittings was evaluated by the squared linear correlation coefficients (R2). The obtained values of (R2), for all field, were as high as 99.9%. Plots of the best fits to the data are shown by red solid lines in the main panels of Fig. 5 and the corresponding parameters are listed in Table 2. At first sight, the three models are suitably adapted to describe the mechanism responsible for electrical conduction in the metallic region of our sample. To select the most appropriate model, the relative difference in resistance  , in the absence of the magnetic field, was plotted in Fig. 5, using the adjustment parameters listed in Table 2. According to Fig. 5, the relative error for the (ZDE) polynomial, with (e–m) interactions, is the smallest. So, we can suggest that this model is the better one to describe the charge transport behavior in the metallic region.
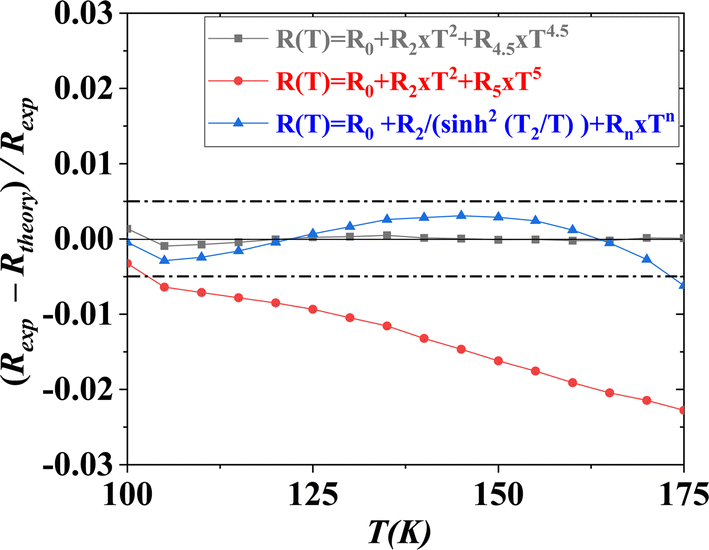 | ||
Fig. 5 The relative difference in resistance 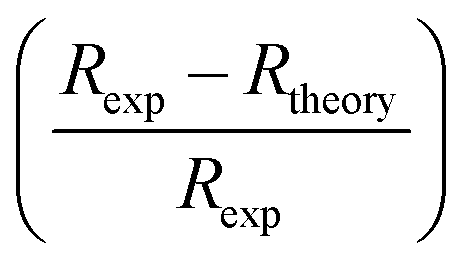 vs. T plots for the three models under the zero applied magnetic field. vs. T plots for the three models under the zero applied magnetic field. | ||
The coefficients R0, R2 and R4.5, relating to this model, have different signs (Table 2). In fact, coefficients R0 and R2 have a positive contribution in the electrical resistance of the studied material while the R4.5 one has a negative contribution. Fig. 6(a)–(c) show that the R0 residual term presents the main contribution in the electrical resistance. The term R2T2, relating to (e–e) interactions, comes second while the lowest contribution is that of the term R4.5T4.5, relating to (e–m) interactions. Fig. 6(d) shows that the residual term R0 decreases with both temperature and the applied magnetic field. This decrease is for the benefit of the (e–e) interactions which increase with both temperature and the applied magnetic field (Fig. 6(d)). Fig. 6(e) shows that the negative contribution of (e–m) interactions is negligible at low temperatures, whether in the absence of the applied field or under a field of 2 or 5 T. By increasing the temperature, this term promotes electrical conduction. The influence of the applied magnetic field is random.
 | ||
| Fig. 6 Evolution, as a function of temperature, of the different terms and, of the (ZDE) polynomial model with (e–m) interactions, under different applied magnetic fields of 0, 2 and 5 T, respectively. (a)–(c) Applied magnetic field was maintained constant for different n values. (d)–(f) n value was maintained constant for different applied magnetic field values. | ||
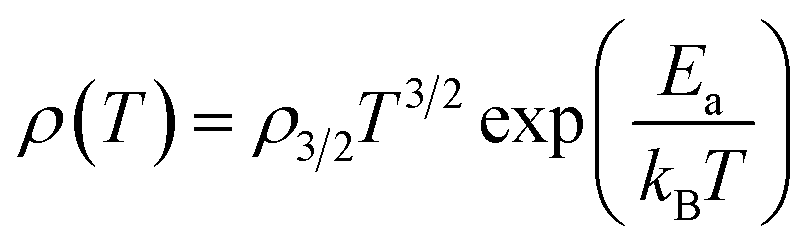
At high temperatures, the behavior is that of an insulator or a semiconductor, where the electrical conductivity is governed by electron jumps. Three major mechanisms are possible: the thermally activated hopping (TAH) model,71,72 the model of small polaron hopping (SPH) between nearest neighbors62 and the Mott Variable Range hopping (Mott-VRH) transport model.73
- The (TAH) model, governed by the Boltzmann factor, is written by the relation:
 | (8) |
- The model, of (SPH) between nearest neighbors in an adiabatic limit, is governed by the equation:
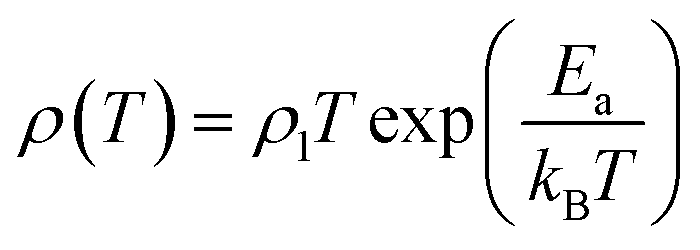 | (9) |
The strong electron–polaron coupling, in a non-adiabatic limit, causes a slow motion of the charge carriers and leads to the following law:
 | (10) |
- In the (Mott-VRH) transport model, the resistivity is governed by the law:
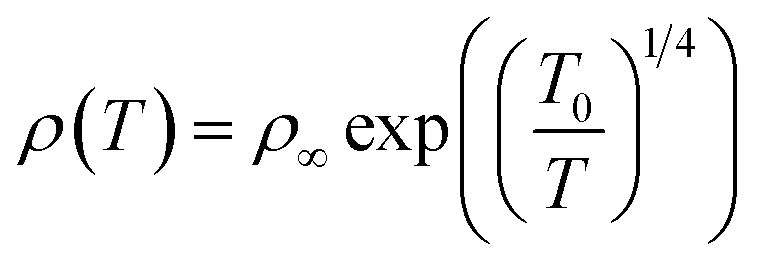 | (11) |
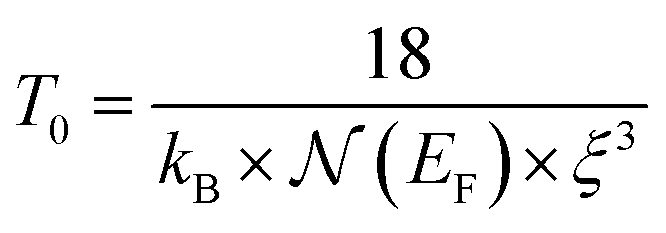 denotes the characteristic temperature of Mott.
 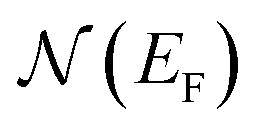 is the density of state at the Fermi level and ξ represents the localization length dMn–O.
On the different components of Fig. S4 (see ESI),† we tried to model the experimental data of the resistance, at high temperatures, by the four eqn (8)–(11).
In order to search for the model giving the best fit of the experimental data, a fit with the three relations (12), (13), (14) and (15) was performed on Fig. 7(a), (b), (c) and (d), respectively.
 | (12) |
 | (13) |
 | (14) |
 | (15) |
 | ||
Fig. 7 (a) The experimental and the theoretical R(T) curves for the four models. (b) The  vs. T plots for the four models under μ0H = 0 T. vs. T plots for the four models under μ0H = 0 T. | ||
The fit of the experimental curves, shows a good agreement between the experiment and the models mentioned above. The obtained values of the squared linear correlation coefficients (R2), for all field, were as high as 99.9% and are listed in Table 3.
| μ0H (T) | 0 | 2 | 5 |
|---|---|---|---|
| Model ① |  |
||
| ln(R∞) | −0.19203 | −0.18252 | −0.13683 |
| Ea (meV) | 100.50 | 100.07 | 98.04 |
|
|||
| Model ② | 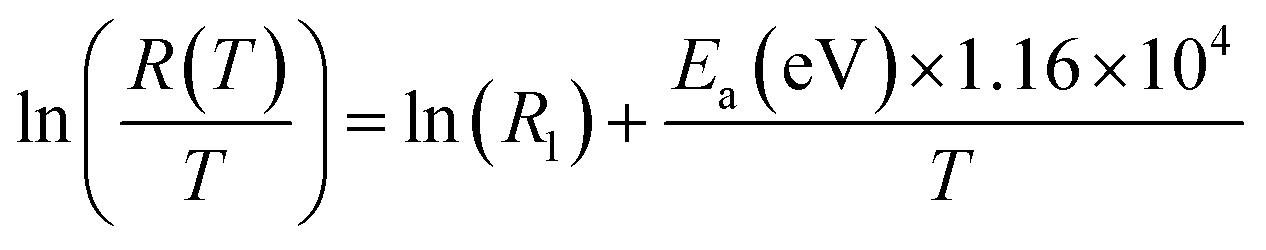 |
||
| ln(ρ1) | −7.27236 | −7.21314 | −7.15460 |
| Ea (meV) | 138.06 | 135.70 | 133.16 |
|
|||
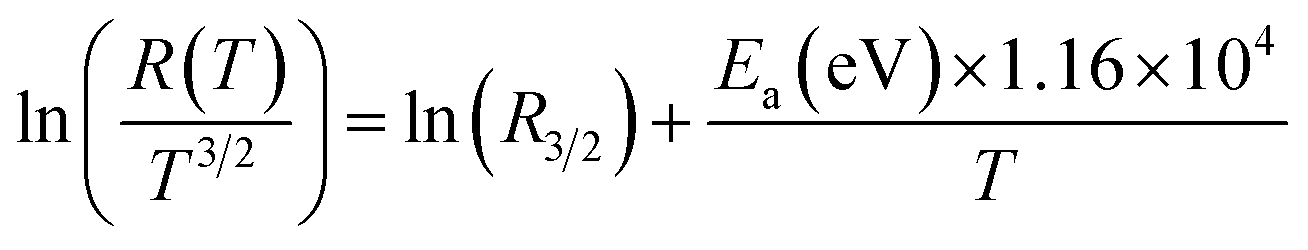
| Model ③ |  |
||
| ln(R3/2) | −10.8023 | −10.67394 | −10.49935 |
| Ea (meV) | 156.44 | 151.43 | 144.43 |
|
|||
| Model ④ |  |
||
| ln(R∞) | −8.39416 | −8.14518 | −7.93170 |
| T0 (106 K) | 6.12013 | 5.57338 | 5.11946 |
| NEF (1021 (eV)−1 cm−3) | 4.48064 | 4.92019 | 5.35644 |
Using the adjustment parameters, the curves of eqn (8)–(11), relative to the resistance R(T) were plotted on the same graph with the experimental curve (Fig. 7(a)). We note a good agreement between the experiment and the models studied for high temperatures. The divergence of the theoretical models is obtained at temperatures 355, 365, 367 and 340 K for the laws described by eqn (8)–(11), respectively. It is therefore clear that the (Mott-VRH) model is the most appropriate to describe the electrical resistance in the (PM) phase. This is confirmed by the curve giving the evolution of  as a function of temperature in Fig. 7(b). In fact,
  of the (Mott-VRH) model is the smallest and does not exceed 1% over the extended temperature range between 345 and 500 K. The resistance in the (PM) phase is so characterized by a semiconductor behavior, which is best described by the (Mott-VRH) mechanism. This model describes low-temperature conduction in strongly disordered systems with localized charge-carrier states.74,75 From values of the characteristic temperature
  of Mott, listed in Table 3, we are able to determine the state density
  at the Fermi level, for different values of the magnetic field listed in Table 3. Fig. 8(a) shows that
  , which is of the order of 1021 (eV)−1 cm−3, increases slightly with the magnetic field. This evolution, confirms the previous findings. In fact, even in the PM phase, the application of an external magnetic field increases the magnetization, due to the suppression of magnetic domain scattering,76 which promotes conduction and gives a positive MR even if it is weak. These results are similar to those obtained by Venkataiah and Venugopal Reddy77 in the orthorhombic Nd0.67A0.33MnO3, (A = Ca, Sr, Pb and Ba), and those obtained by N. Hasanli et al.78 in the orthorhombic La05 Sr05A0.5 Rh0.5O3, (A = Mn and Fe). In the (Mott-VRH) model, the activation energy is a function of temperature.79 We have examined the temperature variation of the local activation energy, using the following low:
 | (16) |
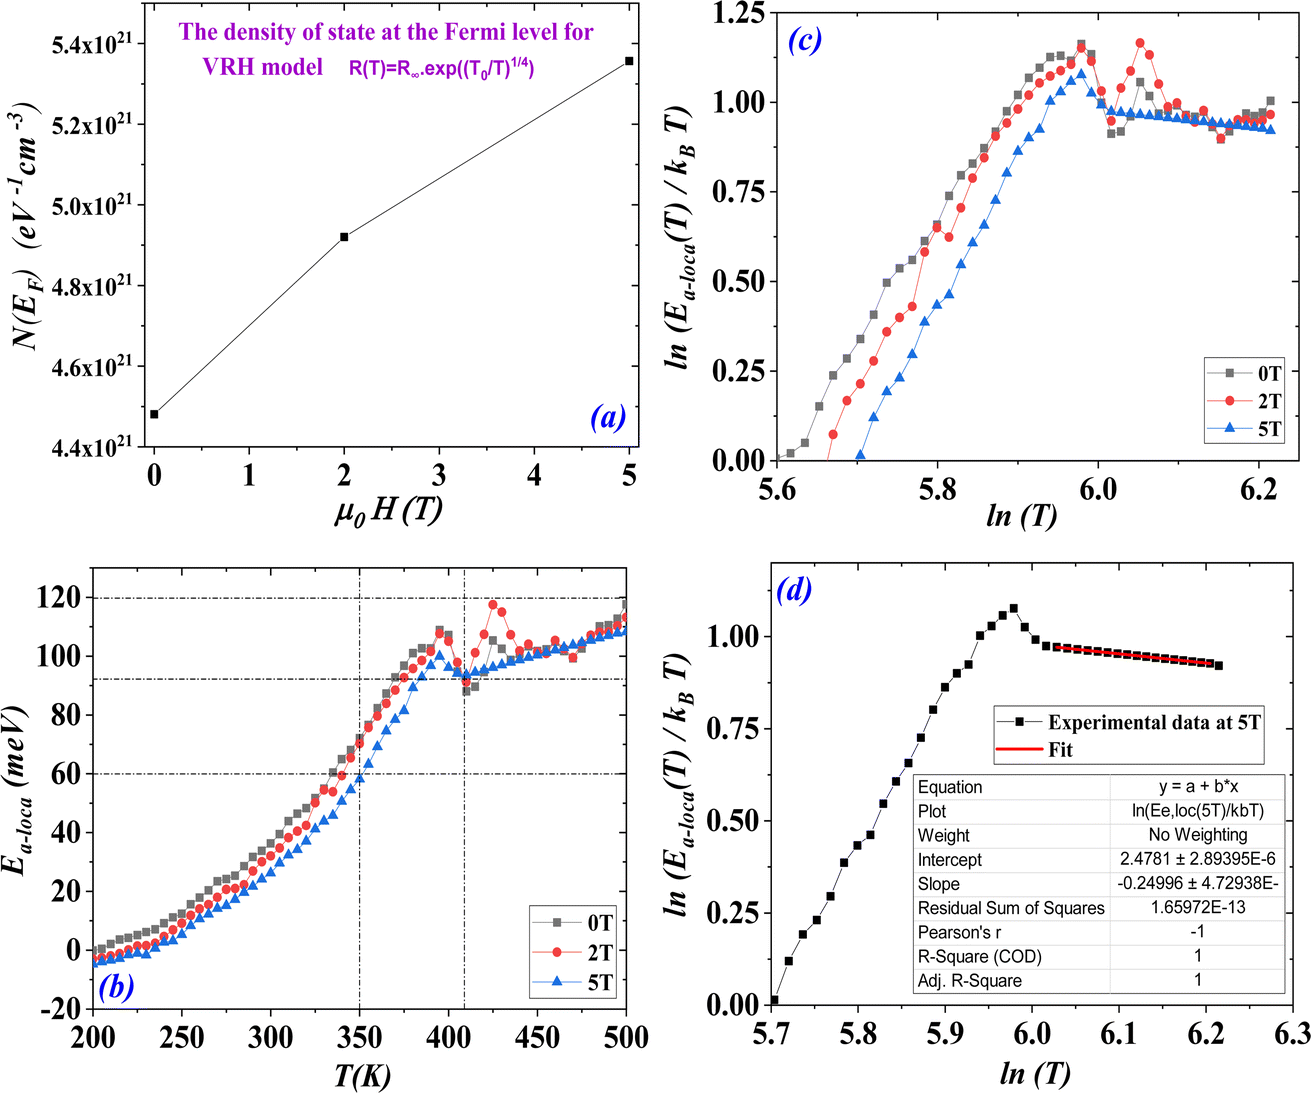 | ||
| Fig. 8 (a) The density of state at the Fermi level, for (VRH) model, under different magnetic fields of 0, 2 and 5 T. (b) The temperature dependence of the local activation energy, under different magnetic fields of 0, 2 and 5 T. (c) The evolution of ln(Ea-loca(T)/kBT) as a function of ln(T) under different magnetic fields of 0, 2 and 5 T. | ||
In order to confirm these results, we have plotted on Fig. 8(c), the evolution of ln(Ea-loca(T)/kBT) as a function of ln(T). These curves show, for high temperatures and for zero and 2 T magnetic field, the presence of fluctuations around  . The fit of the linear part Fig. 8 (d), for a 5 T magnetic field, shows a negative slope of (−1/4). This confirms the validity of the (Mott-VRH) model to describe the conduction mechanism in the studied compound at high temperatures90
Thus, there is a FMM at low temperatures and a semiconducting-paramagnetic one (PMSC) at high ones.
In the intermediate temperatures range, around the transition, there is coexistence of (FM), (PM) or (SPM) clusters (macro spin paramagnetism). This can be justified by the second-order transition width, which is manifested by a dispersion in the temperature transition. To describe the behavior of the resistivity between the (FMM) and (PMSC) transition, we will adopt the percolation model, based on the phase segregation mechanism. This model, proposed by Li et al.,91 assumes that materials are composed by FMMand PMSC regions, of volume fractions (f) and (1 − f), respectively. Thus, the electrical resistance of the system at any temperature is determined by the following expression:
| R(T) = f × RFMM(T) + (1 − f)RPMSC(T) | (17) |
| RFMM(T) = R0 + R2T2 + R4.5T4.5 | (18) |
 | (19) |
The f function satisfies well the Fermi–Dirac distribution given by:
 | (20) |
So, we have:


The adjustment of the experimental resistance curves over the entire temperature range, using the eqn (17)–(20), allows us to determine the U0 and TmodC parameters. After, we can go back up to the f function given by eqn (20) and afterwards determine the volume fractions of each phase. The R0, R2, R4.5 , T0 and R∞ parameters are initiated with those listed in Tables 2 and 3.
Fig. 9(a) presents the experimental results of R(T) as well as the simulated curves (red line) obtained at magnetic field of 0, 2 and 5 T. The good agreement between the experimental data and the simulated curves affirm that the percolation model describes well the behavior of the resistivity in a wide temperature range including the phase transition region whatever the applied magnetic field. The best fit of the U0 and TmodC parameters are given in Table 4. With these two parameters only, we have drawn using relation 20, in Fig. 9(b), the curves giving, the temperature dependence on the volume fraction of the FM phase fFMM under different magnetic fields. The application of an external magnetic field has practically no effect on the volume fractions of the FMM and PMSC phase, at low and at high temperatures. In the transition temperature range, a magnetic field favors the volume fraction of the FMM phase over the PMSC phase, leading to the increase in the conductivity and, as consequence, the appearance of the colossal magnetoresistance around the transition. These interpretations are in agreement with the evolution of TmodC according to applied magnetic field, in the inset of Fig. 9(b). The PMSC/FMM transition temperature TmodC, increases with the application of the magnetic field (Fig. 9(b) and (c)), which favors the FMM phase. These interpretations are in good consistency with the evolution of U0 according to applied magnetic field, traced in Fig. 9(c). The energy difference U0 between the FM and PM states at T = 0 K, proved to decrease with the application of the magnetic field, which promotes electrical conduction. However, the PMSC/FMM transition temperature TmodC, increases with the application of the magnetic field, which favors the FMM phase. All these results prove the strong correlation between magnetic and electrical properties.
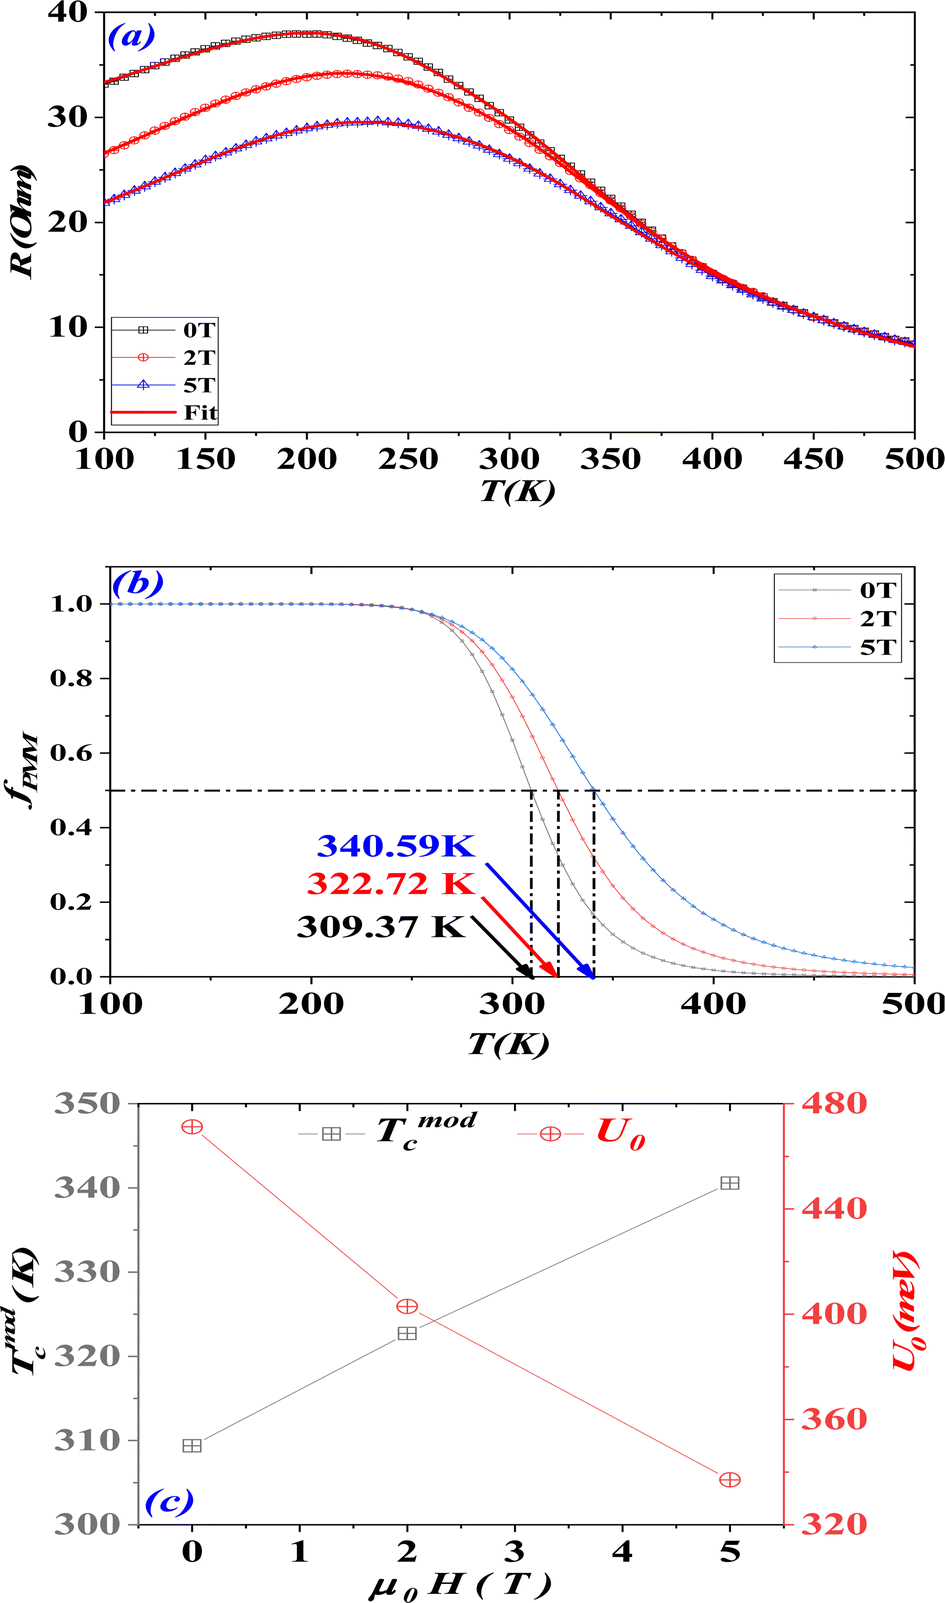 | ||
Fig. 9 (a) Fit of the temperature dependence of resistance, over the whole temperature range, under different applied magnetic fields of 0, 2 and 5 T, with the theoretical models: of percolation. (b) The temperature dependence on the volume fraction of the ferromagnetic phase fFMM under different magnetic fields of 0, 2 and 5 T, (c) the evolution of TmodC and of U0 according to applied magnetic field. (d) The fit of the linear part at high temperatures, for a 5 T field, of  as a function of ln(T). as a function of ln(T). | ||
| μ0H (T) | 0 | 2 | 5 |
|---|---|---|---|
| U0 (meV) | 471.20 | 402.97 | 337.08 |
| TmodC (K) | 309.37 | 322.72 | 340.59 |
4. Conclusion
The correlation between the electrical and the magnetic properties of nanoparticles La0.6Sr0.4MnO3 (S1C0) compound has been studied. By decreasing the temperature, the (S1C0) compound was found to undergo a transition, of a second order, from a paramagnetic (PM) phase to a ferromagnetic (FM) one. The images, obtained using a transmission electron microscope, have showed a dispersion in grain size. The dispersion in the transition (PM/FM) temperature has been related to the presence of an irreversibility between the magnetization in (ZFC) and (FC) modes. This irreversibility, at the temperature Ti ≈ 350 K below the critical temperature of the PM/FM transition TC ≈ 365 K, indicated a magnetic anisotropy around this temperature. So, we have deduced that our compound is the seat of a superparamagnetism (SPM) phenomenon justified by the absence of hysteresis losses.The study of the electrical properties showed a semiconductor behavior (SC) at high temperatures and a metallic one (M) at low temperatures. The SC/M transition temperature, which was found to increase under the effect of a magnetic field, has been approximated at the Blocking temperature. The conduction mechanisms have been tested by three models at low temperatures as well as at high ones. The Zener double exchange (ZDE) polynomial model, with the electron–magnon interaction, was found to be the best one to describe the electrical conduction in the metallic region, verifying a deviation relative to the experimental data closest to zero.
At high temperatures, the Mott variable range hopping (Mott-VRH) transport model was considered as the most appropriate one to describe the electrical conduction. Finally, we have adopted the percolation model R(T) = f × RFMM(T) + (1 − f)RPMSC(T), based on the phase segregation mechanism, to describe the conduction mechanism over the whole temperature range, where the function (f), giving the volume fraction of the ferromagnetic metallic (FMM) regions, satisfies the Fermi–Dirac distribution.
Data availability
The data are not publicly available.Conflicts of interest
There are no conflicts to declare.References
- M. B. Salomon and M. Jaime, The physics of manganites: Structure and transport, Rev. Mod. Phys., 2001, 73, 583 CrossRef.
- R. N. Pramod, M. S. Murari and D. D. Mamatha, Influence of heat sintering on the physical properties of bulk La0.67Ca0.33MnO3 perovskite manganite: role of oxygen in tuning the magnetocaloric response, Phys. Chem. Chem. Phys., 2024, 26, 5237 RSC.
- P. K. Siwatch, H. Siugh and O. N. Srivastava, Low field magnetotransport in manganites, J. Phys.: Condens. Matter, 2008, 20, 273201 CrossRef PubMed.
- M. Jeddi, H. Gharsallah, M. Bekri, E. Dhahri and E. K. Hlil, Structural characterization and ZFC/FC magnetization study of La0.6Ca0.4-xMnO3 nanoparticle, Appl. Phys. A, 2020, 126, 6 CrossRef CAS.
- X. Yu, S. Jin, X. Guan, Y. Yan, K. Wu, L. Zhao and X. Liu, Large temperature coefficient of resistivity (TCR) of La1-xCaxMnO3 films prepared by spin-coating method, J. Alloys Compd., 2021, 890, 161788 CrossRef.
- C. Yun, E. M. Choi, W. Li, X. Sun, T. Maity, R. Wu, J. Jian, S. Xue, S. Cho, H. Wang and J. L. MacManus-Driscoll, Achieving ferromagnetic insulating properties in La0.9Ba0.1MnO3 thin films through nanoengineering, Nanoscale, 2020, 12, 9255 RSC.
- F. Elleuch, M. Bekri, M. Hussein, M. Triki, E. Dhahri, E. K. Hlild and L. Bessais, A-site-deficiency effect on critical behavior in the Pr0.6Sr0.4MnO3 compound, Dalton Trans., 2015, 44, 17712 RSC.
- J. J. Neuweier, M. F. Handley, J. D. Thompson and R. H. Heffner, Phys. Rev. B: Condens. Matter Mater. Phys., 1995, 62(10), R7006–R7009 Search PubMed.
- G. Jonker and J. V. Santen, Ferromagnetic compounds of manganese with perovskite structure, Physica, 1950, 16, 337 CrossRef CAS.
- E. O. Wollan and W. C. Koehler, Neutron diffraction study of the magnetic properties of the serie of perovskite-type compound La1-xCaxMnO3, Phys. Rev., 1955, 100, 545 CrossRef CAS.
- A. Dhahri, F. I. H. Rhouma, J. Dhahri, E. Dhahri and M. A. Valente, Structural and electrical characteristics of rare earth simple perovskite oxide La0. 57Nd0. 1Pb0. 33Mn0. 8Ti0. 2O3, Solid State Commun., 2011, 151, 738 CrossRef CAS.
- E. Dagotto, Nanoscale phase separation and colossal magnetoresistance: the physics of manganites and related compounds, Springer Series in Solid-State Sciences, Springer, Berlin, 2003, vol 136 Search PubMed.
- M. Bejar, N. Sdiri, M. Hussein, S. Mazen and E. Dhahri, Magnetocaloric effect on strontium vacancies in polycrystalline La0.7Sr0.3_x□xMnO3, J. Magn. Magn. Mater., 2007, 316, e566 CrossRef CAS.
- L. H. Nguyen, L. X. Hung, N. X. Phuc, P. H. Nam, L. T. T. Ngan, N. V. Dang, L. V. Bau, P. H. Linh and P. T. Phong, Composites (1-x)La0.7Ca0.3MnO3/xLa0.7Sr0.2Ca0.1MnO3: Electrical transport properties and enhancing of low-field-magnetoresistance and colossal magnetoresistance, J. Alloys Compd., 2020, 849, 156607 CrossRef CAS.
- X. Yu, T. Sun, Q. Chen, Y. Duan and X. Liu, Modulation of room-temperature TCR and MR in La1−xSrxMnO3 polycrystalline ceramics via Sr doping, J. Sol-Gel Sci. Technol., 2019, 90, 221 CrossRef CAS.
- O. Chmaissem, B. Dabrowski, S. Kolesnik, J. Mais, J. D. Jorgensen and S. Short, Structural and magnetic phase diagrams of La1-xSrxMnO3 and Pr1-ySryMnO3, Phys. Rev., 2003, 67, 094431 Search PubMed.
- H. S. Lee, C. S. Park and H. H. Park, Effect of La3+ substitution with Gd3+ on the resistive switching properties of La0.7Sr0.3MnO3 thin films, Appl. Phys. Lett., 2014, 104, 1 Search PubMed.
- D. Xu, L. Luo, Y. Ding and P. Xu, Sensitive electrochemical detection of glucose based on electrospun La0.88Sr0.12MnO3 naonofibers modified electrode, Anal. Biochem., 2015, 489, 38 CrossRef CAS PubMed.
- E. M. Materón, C. M. Miyazaki, O. Carr, N. Joshi, P. H. S. Picciani, C. J. Dalmaschio, F. Davis e and F. M. Shimizu, Nanoparticles in biomedical applications: A review, Appl. Surf. Sci. Adv., 2021, 6, 100163 CrossRef.
- H. Gharsallah, M. Bejar, E. Dhahri and E. K. Hlil, Effect of the annealing temperature on the structural and magnetic behaviors of 0.875La0.6 Ca0.4MnO3/0.125La0.6Sr0.4MnO3 compositions, J. Magn. Magn. Mater., 2016, 401, 56 CrossRef CAS.
- J. Rodriguez-Carvajal, FULLPROF-A Program for Rietveld, Profile Matching and Integrated Intensities Refinement of X-Ray And/or Neutron Data, Laboratoire Leon Brillouin: CEA-Saclay, France, 2000 Search PubMed.
- H. M. Rietveld, Line profiles of neutron powder-diffraction peaks for structure refinement, Acta Crystallogr., 1967, 22, 151 CrossRef CAS.
- P. Scherrer, Nachr. Ges. Wiss. Goettingen, Math.-Phys. Kl., 1918, 2, 98 Search PubMed.
- A. Souissi, A. Boukhachem, Y. Ben Taher, A. Ayadi, A. Mefteh, M. Ouesleti, S. Guermazi and M. Amlouk, Structural and vibrational studies of Mo and In-doped ZnO sprayed thin films, Optik, 2014, 125, 3344 CrossRef CAS.
- R. Tripathi, A. Kumar, C. Bharti and T. P. Sinha, Dielectric relaxation of ZnO nanostructure synthesized by soft chemical method, Curr. Appl. Phys., 2010, 2, 676 CrossRef.
- S. J. S. Qazi, A. R. Rennie, J. K. Cockcroft and M. Vickers, J. Colloid Interface Sci., 2009, 338, 105 CrossRef CAS PubMed.
- H. Gharsallah, A. Souissi, M. Bejar, E. Dhahri and E. K. Hlil, Magnetic anisotropy and superparamagnetism in La0.6Ca0.4MnO3, La0.6Sr0.4MnO3 and their mixed composition 0.875 La0.6Ca0.4MnO3/0.125 La0.6Sr0.4MnO3, agglomerated at different temperatures, Mater. Chem. Phys., 2016, 182, 429 CrossRef CAS.
- A. R. Bushroa, R. G. Rahbari, H. H. Masjuki and M. R. Muhamad, Approximation of crystallite size and microstrain via XRD line broadening analysis in TiSiN thin films, Vacuum, 2012, 86, 1107 CrossRef CAS.
- P. Dey and T. K. Nath, Tunable room temperature low-field spin polarized tunneling magnetoresistance of La0.7Sr0.3MnO3 nanoparticles, Appl. Phys. Lett., 2006, 89, 163102 CrossRef.
- D. H. Manh, P. T. Phong, P. H. Nam, D. K. Tung and N. X. Phuc, In-Ja Lee, Structural and magnetic study of La0.7Sr0.3MnO3 nanoparticles and AC magnetic heating characteristics for hyperthermia applications, Phys. B, 2014, 444, 94 CrossRef CAS.
- A. H. Morrish, The Physical Principles of Magnetism, IEEE Press, New York, 2001 Search PubMed.
- C. Zener, Interaction between the d-shells in the transition metals, Phys. Rev., 1951, 81, 440 CrossRef CAS.
- C. Zener, Interaction between the d-shells in the transition metals. II - Ferromagnetic compounds of manganese with perovskite structure, Phys. Rev., 1951, 82, 403 CrossRef CAS.
- A. Anderson and Z. Hazegawa, Considerations on double exchange, Phys. Rev., 1955, 100, 675 CrossRef.
- P. G. De Gennes, Effects of double exchange in magnetic crystals, Phys. Rev., 1959, 118, 141 CrossRef.
- H. Jonker and J. H. van Santen, Ferromagnetic compounds with perovskite structure, Physica, 1950, 16, 337 CrossRef.
- H. A. Kramers, L'interaction entre les atomes magnétogènes dans un cristal paramagnétique, Physica, 1934, 1, 182 CrossRef CAS.
- P. W. Anderson, Antiferromagnetism. Theory of superexchange interaction, Phys. Rev., 1950, 79, 350 CrossRef.
- P. W. Anderson, New approach to the theory of superexchange interactions, Phys. Rev., 1959, 115, 2 CrossRef CAS.
- P. W. Anderson, Theory of magnetic exchange interactions: exchange in insulators and semiconductors, Solid State Phys., 1963, 14, 99 CAS.
- J. H. Van Vleck, The Jahn-Teller Effect and Crystalline Stark Splitting for Clusters of the Form XY6, J. Chem. Phys., 1939, 7, 72 CrossRef CAS.
- J. B. Goodenough, Theory of the Role of Covalence in the Perovskite-Type Manganites [La, M (II)] MnO3, Phys. Rev., 1955, 100, 564 CrossRef CAS.
- J. B. Goodenough and A. L. Loeb, Theory of ionic ordering, crystal distortion, and magnetic exchange due to covalent forces in spinels, Phys. Rev., 1955, 98, 391 CrossRef CAS.
- J. B. Goodenough, A. Wold, R. J. Arnott and N. Menyuk, Relationship between crystal symmetry and magnetic properties of ionic compounds containing Mn3+, Phys. Rev., 1961, 124, 373 CrossRef CAS.
- M. Jeddi, J. Massoudi, H. Gharsallah, E. Dhahri and E. K. Hlil, Impact of potassium substitution on structural, magnetic, magnetocaloric and magneto-transport properties of Nd0.6Sr0.4−xKxMnO3 (0.0 ≤ x ≤ 0.2) manganite, J. Mater. Sci.: Mater. Electron., 2021, 32, 18751 CrossRef CAS.
- A. Dhahri, M. Jemmali, E. Dhahri and E. K. Hlil, Electrical transport and giant magnetoresistance in La0.75Sr0.25Mn1−xCrxO3 (0.15, 0.20 and 0.25) manganite oxide, Dalton Trans., 2015, 44, 5620 RSC.
- Y. Fu and C. K. Ong, The magnetoresistance effect of La-Ca-Sr-Mn-O perovskites under a very low magnetic field, J. Magn. Magn. Mater., 2000, 208, 69 CrossRef.
- Y. K. Lakshmi and P. V. Reddy, Influence of silver doping on the electrical and magnetic behavior of La0.7Ca0.3MnO3 manganites, Solid State Sci., 2010, 12, 1731e1740 Search PubMed.
- H. Y. Hwang, S. W. Cheong, N. P. Ong and B. Batlogg, Spin-Polarized Intergrain Tunneling in La2/3Sr1/3MnO3, Phys. Rev. Lett., 1996, 77, 2041 CrossRef CAS PubMed.
- A. Gupta and J. Z. Sun, Spin-polarized transport and magnetoresistance in magnetic oxides, J. Magn. Magn. Mater., 1999, 200, 24 CrossRef CAS.
- A. J. Millis, P. B. Littlewood and B. I. Shraiman, Double Exchange Alone Does Not Explain the Resistivity of La1−xSrxMnO3, Phys. Rev. Lett., 1995, 74, 5144 CrossRef CAS PubMed.
- S. Zemni, J. Dhahri, K. Cherif, J. Dhahri, M. Oumezzine, M. Ghedira and H. Vincent, Structure, magnetic and electrical properties of La0.6Sr0.4−xKxMnO3 perovskites, J. Alloys Compd., 2005, 392, 55 CrossRef CAS.
- N. Amri, M. Nasri, M. Triki and E. Dhahri, Synthesis and characterization of (1-x) (La0.6Ca0.4MnO3)/x(Sb2O3) ceramic composites, Phase Transitions, 2019, 92, 52 CrossRef.
- N. Assoudi, I. Walha and E. Dhahri, Physical properties of double-doping Lanthanum manganite for bolometer applications, Chem. Phys. Lett., 2019, 731, 136609 CrossRef CAS.
- S. Vadnala, T. D. Rao, P. Pal and S. Asthana, Study of structural effect on Eu-substituted LSMO manganite for high temperature coefficient of resistance, Phys. B, 2014, 448, 277 CrossRef CAS.
- M. N. Muralidharan, P. R. Rohini, E. K. Sunny, K. R. Dayas and A. Seeman, Effect of Cu and Fe addition on electrical properties of Ni–Mn–Co–O NTC thermistor compositions, Ceram. Int., 2012, 38, 6481 CrossRef CAS.
- R. Tripathi, V. P. S. Awana, H. Kishan and G. L. Bhalla, Search for room temperature high-TCR manganite/silver composites, J. Magn. Magn. Mater., 2008, 320, 89 CrossRef.
- J. H. Kim and A. M. Grishin, Uncooled bolometer based on Mn1.56Co0.96Ni0.48O4 thin films for infrared detection and thermal imaging, Appl. Phys. Lett., 2005, 87, 033502 CrossRef.
- T. Sun, S. Zhao, F. Ji and X. Liu, Enhanced room-temperature MR and TCR in polycrystalline La0.67(Ca0.33-xSrx)MnO3 ceramics by oxygen assisted sintering, Ceram. Int., 2018, 44, 2400 CrossRef CAS.
- G. J. Yong, M. Rajeswari, S. Adhikari, O. B. Drury, C. Gardner, R. M. Bionta and S. Friedrich, Heteroepitaxy of Nd0.67Sr0.33 MnO3 on silicon for bolometric x-ray detector application, Rev. Sci. Instrum., 2010, 81, 113906 CrossRef CAS PubMed.
- A. Urushibara, Y. Moritomo, T. Arima, A. Asamitsu, G. Kido and Y. Tokura, Insulator-metal transition and giant magnetoresistance in La1−xSrxMnO3, Phys. Rev. B: Condens. Matter Mater. Phys., 1995, 51, 14103 CrossRef CAS PubMed.
- G. J. Snyder, R. Hiskes, S. DiCarolis, M. R. Beasley and T. H. Geballe, Intrinsic electrical transport and magnetic properties of La0.67Ca0.33MnO3 and La0.67Sr0.33MnO3 MOCVD thin films and bulk material, Phys. Rev. B: Condens. Matter Mater. Phys., 1996, 53, 14434 CrossRef PubMed.
- P. T. Phong, N. V. Khiem, N. V. Dai, D. H. Manh, L. V. Hong and N. X. Phuc, Electrical transport of (1−x) La0.7Ca0.3MnO3+x Al2O3 composites, J. Magn. Magn. Mater., 2009, 321, 3330 CrossRef CAS.
- M. W. Shaikh and D. Varshney, Structural properties and electrical resistivity behavior of La1−xKxMnO3 (x = 0.1, 0.125 and 0.15) manganites, Mater. Chem. Phys., 2012, 134, 886 CrossRef CAS.
- D. Varshney and N. Dodiya, Metallic and semi-conducting resistivity behavior of La0.7 Ca0.3-xKxMnO3 (x= 0.05, 0.1) manganites, J. Theor. Appl. Phys., 2015, 9, 45 CrossRef.
- G. Venkataiah and P. Venugopal Reddy, Structural, magnetic and magnetotransport behavior of some Nd-based perovskite manganites, Solid State Commun., 2005, 136, 114 CrossRef CAS.
- A. Tozri, J. Khelifi, H. Baaziz, E. Dhahri and E. K. Hlil, Electrical transport studies on the La0.7−xPrxBa0.3MnO3 (x=0, 0.1 and 0.2) manganite: Double metal–insulator transitions and low-temperature resistivity minimum, Mater. Lett., 2014, 131, 61 CrossRef CAS.
- M. Prunnila, J. Ahopelto, A. M. Savin, P. P. Kivinen, J. P. Pekola and A. J. Manninenc, Electron–phonon coupling in degenerate silicon-on-insulator film probed using superconducting Schottky junctions?, Phys. E, 2002, 13, 773 CrossRef.
- M. Khlifi, M. Bejar, E. Dhahri, P. Lachkar and E. K. Hlil, Influence of Ca-deficiency on the magneto-transport properties in La0.8Ca0.2MnO3 perovskite and estimation of magnetic entropy change, J. Appl. Phys., 2012, 111(1–6), 78 Search PubMed.
- A. S. Alexandrov and A. M. Breshkovsky, Carrier Density Collapse and Colossal Magnetoresistance in Doped Manganites, Phys. Rev. Lett., 1999, 82, 141 CrossRef CAS.
- R. M. Kusters, J. Singleton, D. A. Keen, R. McGreevy and W. Hayes, Magnetoresistance measurements on the magnetic semiconductor Nd0.5Pb0.5MnO3, Phys. B, 1989, 155, 362 CrossRef CAS.
- N. F. Mott, Conduction in Non-Crystalline Materials, Clarendon Press, Oxford, 1993 Search PubMed.
- A. Banerjee, S. Pal and B. K. Chaudhuri, Nature of small-polaron hopping conduction and the effect of Cr doping on the transport properties of rare-earth manganite La0.5Pb0.5Mn1−xCrxO3, J. Chem. Phys., 2001, 115, 1550 CrossRef CAS.
- R. M. Hill, Variable-range hopping, Phys. Status Solidi A, 1976, 34, 601 CrossRef CAS.
- N. F. Mott, Conduction in non-crystalline materials, Philos. Mag., 1969, 19(160), 835 CrossRef CAS.
- J. M. De Teresa, M. R. Ibarra, J. Blasco, J. Garcia, C. Marquina and P. A. Algarabel, Spontaneous behavior and magnetic field and pressure effects on La2/3Ca1/3MnO3 perovskite, Phys. Rev. B: Condens. Matter Mater. Phys., 1996, 54, 1187 CrossRef CAS PubMed.
- G. Venkataiah and P. Venugopal Reddy, Structural, magnetic and magnetotransport behavior of some Nd-based perovskite manganites, Solid State Commun., 2005, 136, 114 CrossRef CAS.
- N. Hasanli, A. Scrimshire, P. A. Bingham, R. G. Palgrave and M. A. Hayward, Structure and magnetism of the Rh4+-containing perovskite oxides La0.5Sr0.5Mn0.5Rh0.5O3 and La0.5Sr0.5Fe0.5Rh0.5O3, Dalton Trans., 2020, 49, 11346 RSC.
- B. I. Shklovskii, and A. L. Efros, Electronic Properties of Doped Semiconductors, Springer, Berlin, 1984 Search PubMed.
- R. D. Shannon, Revised effective ionic radii and systematic studies of interatomic distances in halides and chalcogenides, Acta Crystallogr., Sect. A, 1976, 32, 751 CrossRef.
- W. Jiang, X. Z. Zhou, G. Williams, Y. Mukovskii and K. Glazyrin, Is a Griffiths Phase a Prerequisite for Colossal Magnetoresistance, Phys. Rev. Lett., 2007, 99, 177203 CrossRef PubMed.
- W. Jiang, X. Z. Zhou, G. Williams, Y. Mukovskii and K. Glazyrin, Extreme sensitivity of the Griffiths phase to magnetic field in single crystal La0.73Ba0.27MnO3, Phys. Rev. B: Condens. Matter Mater. Phys., 2007, 76, 092404 CrossRef.
- W. Jiang, X. Z. Zhou, G. Williams, Y. Mukovskii and K. Glazyrin, Griffiths phase and critical behavior in single-crystal La0.7Ba0.3MnO3: Phase diagram for La1−xBaxMnO3 (x⩽0.33), Phys. Rev. B: Condens. Matter Mater. Phys., 2008, 77, 064424 CrossRef.
- L. M. Rodriguez-Martinez and J. P. Attfield, Cation disorder and size effects in magnetoresistive manganese oxide perovskites, Phys. Rev. B: Condens. Matter Mater. Phys., 1996, 54(R1), 15622 CrossRef PubMed.
- A. Tozri, M. Bejar, E. Dhahri and E. K. Hlil, Structural and magnetic characterisation of the perovskite oxides La0.7Ca0.3−xNaxMnO3, Cent. Eur. J. Phys., 2009, 7, 89 CAS.
- M. Oumezzine, O. Peña, T. Guizouarn, R. Lebullenger and M. Oumezzine, Impact of the sintering temperature on the structural, magnetic and electrical transport properties of doped La0.67Ba0.33Mn0.9Cr0.1O3 manganite, J. Magn. Magn. Mater., 2012, 324(18), 2821 CrossRef CAS.
- M. Bejar, H. Feki, E. Dhahri, M. Ellouze, M. Balli and E. K. Hlil, Effects of substituting divalent by monovalent ion on the physical properties of La0.7Ca0.3−xKxMnO3 compounds, J. Magn. Magn. Mater., 2007, 316(2), e707 CrossRef CAS.
- S. P. Liu, Y. Xie, G. D. Tang, Z. Li, D. Ji, Y. F. Li and D. Hou, Investigation on cation distribution and magnetic properties in self-doped manganites La0.6−xSr0.4MnO3−δ, J. Magn. Magn. Mater., 2012, 324, 1992 CrossRef CAS.
- M. Bejar, E. Dhahri, E. K. Hlil and S. Heniti, Influence of A-site cation size-disorder on structural, magnetic and magnetocaloric properties of La0.7Ca0.3−xKxMnO3 compounds, J. Alloys Compd., 2007, 440, 36 CrossRef CAS.
- M. Triki, E. Dhahri, E. K. Hlil and J. L. Garden, Enhanced magnetoresistance induced by oxygen deficiency in La0.4Ca0.6MnO3 oxides, J. Appl. Phys., 2014, 115, 103709 CrossRef.
- G. Li, H. D. Zhou, S. L. Feng, X. J. Fan and X. G. Li, Competition between ferromagnetic metallic and paramagnetic insulating phases in manganites, J. Appl. Phys., 2002, 92, 1406 CrossRef CAS.
Footnotes | |
| † Electronic supplementary information (ESI) available. See DOI: https://doi.org/10.1039/d4ra03528c | |
‡ The cation disorder σ2 is given by 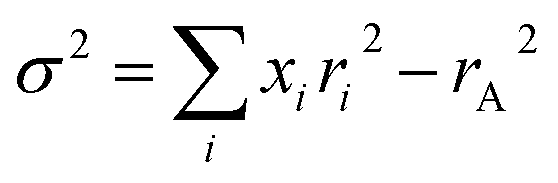 where xi and ri are the atomic fraction and ionic radii of i-type ions at A-site, respectively. where xi and ri are the atomic fraction and ionic radii of i-type ions at A-site, respectively.
|
| This journal is © The Royal Society of Chemistry 2024 |