 Open Access Article
Coprecipitation and hydrothermal synthesis of CaO from dolomite in the presence of Sapindus rarak extract for biodiesel production: catalysts characterization and optimization
Nuni Widiartia,
Holilah Holilah*b,
Hasliza Bahruji c,
Reva Edra Nugrahad,
Suprapto Suprapto
 *e,
Yatim Lailun Ni'mahe and
Didik Prasetyoko
 e
e
aChemistry Department, Faculty of Mathematics and Science, Universitas Negeri Semarang, Semarang 50229, Indonesia
bResearch Center for Biomass and Bioproducts, National Research and Innovation Agency of Indonesia (BRIN), Cibinong, 16911, Indonesia. E-mail: holi003@brin.go.id
cCentre of Advanced Material and Energy Sciences, Universiti Brunei Darussalam, Jalan Tungku Link, BE 1410, Brunei
dDepartment of Chemical Engineering, Faculty of Engineering, Universitas Pembangunan Nasional “Veteran” Jawa Timur, Surabaya, East Java 60294, Indonesia
eDepartment of Chemistry, Faculty of Science and Data Analytics, Institut Teknologi Sepuluh Nopember, Keputih, Sukolilo, Surabaya 60111, Indonesia. E-mail: suprapto@chem.its.ac.id
First published on 24th July 2024
Abstract
High-purity CaO cubic crystallites extracted from limestone exhibited excellent activity as base catalysts for waste cooking oil (WCO) conversion into biodiesel. Saponin from Sapindus rarak extract acted as a surfactant in CaO extraction and transformation into well-defined cubic microcrystallites. The application of saponin from Sapindus rarak extract as a surfactant for CaO production results in a high level of CaO purity and particle size reduction compared to directly calcined limestone (CaO–MgO). The catalytic activity was evaluated on CaO from hydrothermal and co-precipitation synthesis, MgO and CaO–MgO derived from limestone, giving hydrothermal CaO catalysts enhanced biodiesel yield. Optimization of transesterification conditions using Box Behnken Design response surface methodology achieved 92.40% biodiesel yield at 65 °C, 3 h reaction time and when using 5% of CaO catalysts.
Introduction
The exponential growth in population, urbanization, and industrialization has witnessed a surge in energy consumption, escalating to a 2.3% increase annually.1 The high dependency on energy from fossil fuels contributes to the depletion and price fluctuation. Researchers have focused on exploring renewable and sustainable energy with a green impact on the environment.2,3 Biodiesel has gathered considerable interest as an alternative fuel from renewable sources like vegetable oils and animal fats.4 Biodiesel offers numerous advantages, including biodegradability, technical feasibility, minimal greenhouse gas emissions, non-toxicity, and carbon neutrality.5 Biodiesel comprises fatty acid alkyl esters, synthesized through a chemical process known as transesterification of triglycerides.6,7 However, utilizing animal fats or cooking oils for biodiesel production may not be sustainable due to competition with the food industry, compromising food security.8–10Researchers have actively sought non-edible raw materials for biodiesel production, including waste cooking oil (WCO). Waste cooking oil refers to vegetable oil used for deep frying that can be acquired at less price than pure vegetable oil.11 Conversion of WCO to biodiesel is an environmentally friendly approach to recycling waste cooking oil while providing a source of low-pollution renewable energy.12 The transesterification of WCO into biodiesel requires the conversion of triglycerides compound in the waste oil into fatty acid methyl esters (FAME) and glycerol. One triglyceride molecule reacts with three methanol molecules to form FAME, often catalyzed by base catalysts.13
An ideal catalyst for transesterification should be high conversion and selectivity, easily separated from the product, not corrosive, and resistant to deactivation or prevent subsequent reaction of FAME.14,15 Heterogeneous catalysts offer a simple and straightforward separation from liquid products, improving reusability.6,13 CaO extracted from natural limestone is becoming an attractive choice as a non-toxic catalyst, ensuring negligible environmental effects despite having a high basicity.16–19 Strong Lewis bases that are able to give electron pairs are indicated by strong basicity. Previous studies have shown that catalysts with higher basicity and basic strength are linked to better biodiesel yields. Higher basic strength catalysts have more active sites available for transesterification processes, which makes them more favourable for methanol molecule adsorption and breakdown.20 Direct calcination of limestone produced CaO–MgO catalysts that were reported to have 15% to 75% biodiesel yield.21 The presence of MgO more than 50% reduced the catalytic activity of CaO due to the lower basicity of MgO compared to CaO. In the catalysis, the presence of MgO can improve the stability of catalytic deactivation.22 CaO is extracted from natural limestone, such as dolomite, using HCl or NaOH to remove the MgO component and other impurities.23,24 Green solvents are necessary to extract CaO from dolomite to reduce harmful and toxic acidic waste.
Sapindus rarak is a native Indonesian plant traditionally used as a natural soap for delicate fabric. The saponin extract from the Sapindus rarak fruit has similar properties to CTAB surfactant. The saponin has been applied as a natural surfactant in synthesizing mesoporous materials such as ZnO,25 and manganese oxide.26 Recently, Azis et al. (2024)27 have used Sapindus rarak extract as an agent for forming mesopores in NaP zeolites. Generally, saponin consists of amphiphilic glycol conjugate with a lipophilic tail and one or two hydrophilic glycoside chains attached to the aglycone backbone. In this study, Sapindus Rarak extract which contains saponin compounds, was used in the extraction of CaO from dolomite and crystallization into cubic microcrystallites. The crystallization method was conducted using co-precipitation or hydrothermal method in order to evaluate the changes in CaO morphology. The catalytic performance between CaO, MgO and CaO–MgO derived from limestone as a base catalyst in the transesterification of used cooking oil will be compared. Transesterification parameters were optimized using response surface methodology (RSM) to evaluate the effect of CaO loading, reaction time, and reaction temperature. The RSM input based on the Box Behnken Design was chosen to reduce the number of experiments needed to obtain optimum reaction conditions for the desired reaction.28 RSM uses multivariate equations to solve multivariate data from well-designed experiments,29 and provides optimized response conditions or the optimum response regions as a function of input factors using statistical methods.30
Experimental
Materials
Natural limestone was obtained from Madura, Indonesia. Sapindus rarak extract was prepared using the maceration process of Sapindus rarak fruit in ethanol (1![[thin space (1/6-em)]](https://www.rsc.org/images/entities/char_2009.gif) :
:![[thin space (1/6-em)]](https://www.rsc.org/images/entities/char_2009.gif) 4) for 48 h. The chemical used i.e. hydrochloric acid (Merck, 37%) n-hexane (Merck, 99%), sodium hydroxide (Merck), sodium carbonate anhydrous (Merck), methanol (Merck, 99%), and distilled water was purchased from the local store in Semarang. Waste cooking oil was obtained from the traditional market in Semarang, Indonesia.
4) for 48 h. The chemical used i.e. hydrochloric acid (Merck, 37%) n-hexane (Merck, 99%), sodium hydroxide (Merck), sodium carbonate anhydrous (Merck), methanol (Merck, 99%), and distilled water was purchased from the local store in Semarang. Waste cooking oil was obtained from the traditional market in Semarang, Indonesia.
Modification CaO–MgO dan CaO by Sapindus rarak solution
A calcined natural limestone CaO–MgO (10 g) was dissolved in 30% Sapindus rarak solution (100 mL), and the mixture was stirred at 60 °C for 2 h. The mixture was filtered to separate the filtrate that contained dissolved CaO, and solid residue that primarily contained MgO. The separated solid residue and the liquid filtrate will be further used for synthesizing MgO and CaO catalysts. The solid residue was calcined at 800 °C for 3 h to obtain MgO. On the other hand, the liquid filtrate underwent co-precipitation or hydrothermal synthesis to produce CaO–C (co-precipitation) and CaO–H (hydrothermal). HCl solution (0.1 M) was added to the filtrate until the pH reached 6. Na2CO3 solution (1 M) as a precipitating agent was added dropwise to the filtrate until the mixture reached pH 12. The mixture was stirred for 2 h, sonicated for 1 h, poured into a Teflon-line autoclave and hydrothermally heated at 100 °C for 72 h. The resulting white precipitate was washed with hot water until the pH was neutral. The precipitate was dried at 110 °C overnight to remove water and calcined at 800 °C for 3 h to obtain CaO–H. CaO–C was obtained following steps similar to CaO–H but without undergoing hydrothermal.31Characterization of catalysts
Crystallinity and mineral phase were characterized using the PHILIPS binary (scan) PW 3050/60 X-ray Diffractometer, with Cu Kα radiation and generator settings of 30 mA and 40 kV. The catalyst functional group was characterized using Fourier Transform Infrared (FTIR 8400S Shimadzu) with a KBr: sample ratio of 99![[thin space (1/6-em)]](https://www.rsc.org/images/entities/char_2009.gif) :
:![[thin space (1/6-em)]](https://www.rsc.org/images/entities/char_2009.gif) 1 and measured at 400–4000 cm−1. The morphology was investigated using a JEOL JSM 6010LV scanning microscope at an accelerated voltage of 10 kV. Particle size was measured using Zetasizer nm (Malvern).
1 and measured at 400–4000 cm−1. The morphology was investigated using a JEOL JSM 6010LV scanning microscope at an accelerated voltage of 10 kV. Particle size was measured using Zetasizer nm (Malvern).
Catalytic activity
The trans-esterification reaction was carried out in a Batch reactor. The treated WCO was heated at 110 °C for 30 minutes to remove water, and then the free water of oil put in to the mixture of methanol catalyst (CaO–MgO, MgO, CaO–C, and CaO–H). The mole ratio of oil![[thin space (1/6-em)]](https://www.rsc.org/images/entities/char_2009.gif) :
:![[thin space (1/6-em)]](https://www.rsc.org/images/entities/char_2009.gif) methanol was 1
methanol was 1![[thin space (1/6-em)]](https://www.rsc.org/images/entities/char_2009.gif) :
:![[thin space (1/6-em)]](https://www.rsc.org/images/entities/char_2009.gif) 9 and the composition of the catalyst was 5% of the weight of the oil. The mixture was heated in a batch reactor at 65 °C and stirred at 500 rpm for 3 hours. The FAME obtained from the transesterification reaction was analyzed using GC-MS with methyl heptadecanoate as an internal standard.
9 and the composition of the catalyst was 5% of the weight of the oil. The mixture was heated in a batch reactor at 65 °C and stirred at 500 rpm for 3 hours. The FAME obtained from the transesterification reaction was analyzed using GC-MS with methyl heptadecanoate as an internal standard.
Design experiment
The Box–Behnken experimental design was used to study the factors used to optimize the transesterification reaction of waste cooking oil, such as catalyst loading, reaction temperature, and reaction time. Box Behnken Design Response surface methodology was used to study the optimization of independent variables and response variables. The parameters used in this study consisted of 3 parameters, each with 3 levels, so 15 trials were carried out as listed in Table 1.| Parameter | Unit | −1 | 0 | 1 |
|---|---|---|---|---|
| Catalyst loading (A) | % | 2 | 5 | 8 |
| Temperature (B) | °C | 60 | 65 | 70 |
| Reaction time (C) | h | 2 | 3 | 4 |
Results and discussion
Phase and crystallinity analysis
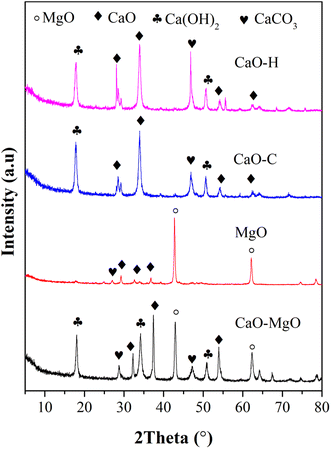
Crystallinity and mineral phase analysis was carried out on the CaO–MgO and the resulting solids to identify the successful separation of CaO and MgO using saponin extract. The as-received CaO–MgO powder consists of CaO, Ca(OH)2 and MgO mixtures. MgO was obtained from the calcination of the separated solid product when mixing the CaO–MgO with Sapindus rarak solution. The XRD pattern in Fig. 1 shows that MgO has a sharp peak at 2θ = 43° and 62.15° corresponds to (200) and (220) crystal planes of MgO cubic crystal (JCPDS no 00-075-0447). The peaks appeared at similar positions as in CaO–MgO. The peaks at 2θ = 22.5°; 29, 25°; 39.27°; 43.27°; 47.20° and 48.38° ascribed to rhombohedral CaCO3 crystal (JCPDS no 00-086-2340) and the peaks at 2θ = 18.03; 34.12 and 36.71° assigned to hexagonal Ca(OH)2 (JCPDS no 00-081-2481). The CaCO3 and Ca(OH)2 peaks appeared at low intensity, implying the significant removal of CaO producing high purity of MgO. XRD analysis on the CaO–C and CaO–H obtained from the liquid solution showed high intensity CaO, Ca(OH)2 and CaCO3 peaks. The CaO peaks appeared at 2θ = 32.37 (111), 2θ = 37.27 (200), 53.8 (220), 67.34 (222) ascribed to CaO cubic structure (JCPDS no. 000-481-467).32 The Ca(OH)2 at 2θ = 17.95 (001) and 50.67 (012) (JCPDS no 00-084-1273) indicate the formation of hexagonal crystals. However, no peaks assigned to MgO that confirmed the separation of MgO and CaO in the limestone following Ca2+ dissolution in saponin extract. The crystallite size was calculated using the Scherrer equation and summarized in Table 2.| Sample | Crystallize size (nm) |
|---|---|
| CaO–MgO | 73.47 |
| MgO | 12.03 |
| CaO–C | 36.69 |
| CaO–H | 31.74 |
Functional group analysis
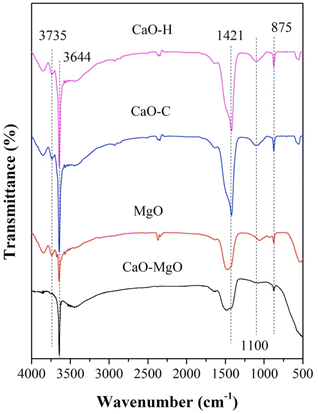
FTIR analysis was performed on CaO–MgO, MgO, CaO–H, and CaO–C as shown in Fig. 2. A strong absorption band at 3644 cm−1 assigned to the characteristic band of the hydroxyl group in Ca(OH)2.33 The hydroxyl band for CaO–MgO and MgO showed weaker intensity than CaO–H and CaO–C. CaO is a compound that readily reacts with moisture to form Ca(OH)2.34 The CO32− vibrations of the sodium carbonate were observed at 875 cm−1 and 1421 cm−1. The high intensity CO32− band was observed on CaO–H and CaO–C, indicating the carbonization of CaO with sodium carbonate.22 In the MgO and CaO–MgO samples, the OH vibrational peak corresponds to the OH group from CaO and MgO appeared at 3650–3700 cm−1. The peak intensity at 3650–3700 cm−1 of MgO is lower than CaO–MgO because the domination of MgO phase dominates following CaO removal.Morphology analysis
The SEM analysis of CaO–MgO (Fig. 3a) shows the presence of large cubic crystallites with the aggregation of non-uniform small particles deposited randomly on the surfaces. The large cubic structures were identified as CaO particles, while the non-uniform small aggregates covering the cube surfaces are MgO particles. Fig. 3b shows the morphology of MgO that appeared as small aggregates with no visible large CaO cubic structures. The morphology analysis further evidenced the removal of CaO crystallites during extraction with saponin solution. CaO–C obtained by co-precipitation method (Fig. 3c) shows uniformed size cube crystals, a typical CaO structure.35 The cubic microcrystallite appeared at significantly smaller dimension than the CaO–MgO. The hydrothermal process produced CaO–H with slightly larger crystallites than the CaO–C, with well-defined cubic structures (Fig. 3d). The absence of small non-uniform aggregates in CaO–H and CaO–C indicates the removal of MgO in the catalysts.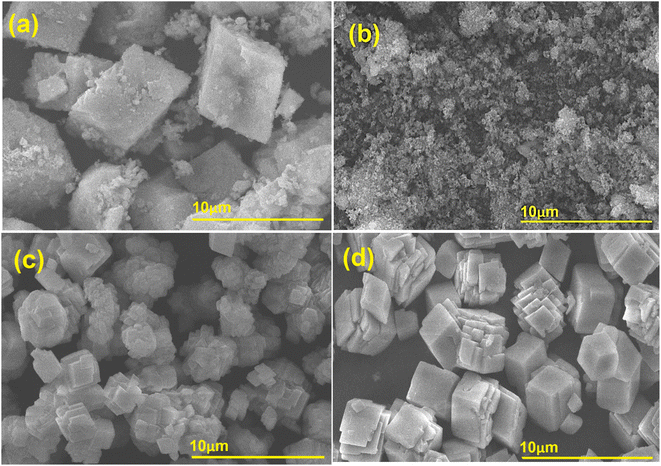 | ||
| Fig. 3 SEM image of (a) CaO–MgO, (b) MgO, (c) CaO–C from co-precipitation and (d) CaO–H from hydrothermal. | ||
Particle size analysis
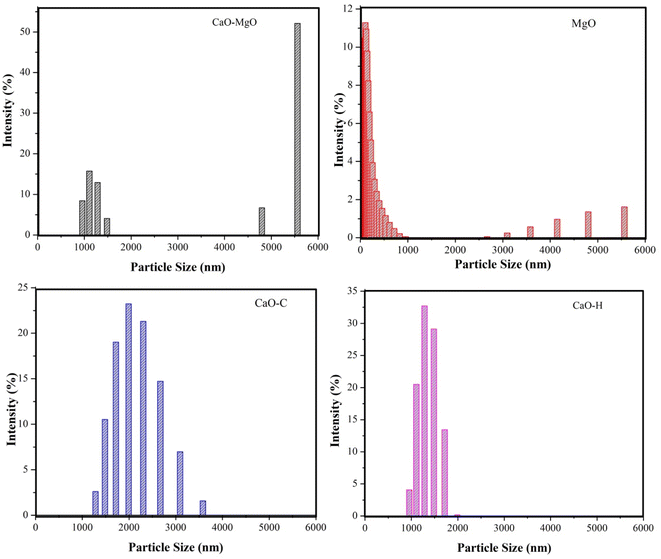
The particle size analysis on CaO–MgO, MgO, CaO–H and CaO–C in Fig. 4 shows the effect of mineral separation and crystallization using saponin on the size of the catalysts. The calcined CaO–MgO was predominately present as large and small aggregates with an average diameter of 6.27 μm. As evidenced by SEM analysis, CaO predominantly existed as large crystallites, while MgO appeared as small clusters. When MgO was separated from CaO–MgO, the resulting catalysts showed that most of the particles existed with sizes of less than 1 μm. CaO–H obtained from hydrothermal treatment showed a narrow particle size diameter between 1 to 2 μm, suggesting the formation of uniform size particles. CaO–C produced from co-precipitation shows particle sizes ranging from 1.0–4.0 μm. The results suggest the saponin role in reducing particle size and preventing agglomeration between particles. These results are in line with the previous studies which reported that the presence of surfactants played an important role in forming CaCO3 precipitate nanoparticles to prevent the aggregation by electrostatic repulsions.36,37 The hydrothermal process directly favor the growth of more regular crystals compared to co-precipitation method.36Catalysts activity on transesterification of WCO
The activity of CaO–MgO, MgO, CaO–C and CaO–H catalysts in the transesterification of used cooking oil was carried out at 65 °C, with 9![[thin space (1/6-em)]](https://www.rsc.org/images/entities/char_2009.gif) :
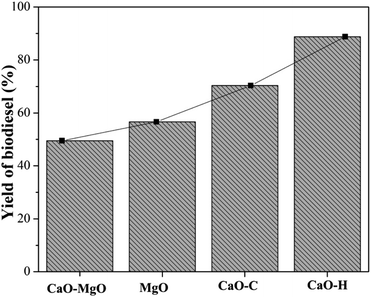
:![[thin space (1/6-em)]](https://www.rsc.org/images/entities/char_2009.gif) 1 molar ratio of methanol to oil. The amount of catalyst was used at 5% by weight of oil percentage, and the reaction time was conducted for 3 h. The biodiesel yield was determined based on the concentration of methyl esters compound determined using GCMS analysis (Fig. 5). The WCO transesterification showed a slight increase in biodiesel yield from 49.52% when using CaO–MgO to 56.61% when using MgO as the catalyst. The CaO–C obtained from co-precipitation produced 75.42% biodiesel yield, while 88.78% of biodiesel yield was obtained on CaO–H catalyst. Low catalytic activity of CaO–MgO and MgO was due to the weaker base properties of MgO than CaO.22,38 When MgO was removed from the catalysts (CaO–C and CaO–H), the catalytic activity improved significantly, suggesting the dominant role of CaO in the transesterification of WCO. Hydrothermal CaO–H catalyst exhibits high catalytic activity due to the uniform cubic particle structures that provide stable active sites for the reaction. The uniform particle shape and small particle size increased the surface area of the catalyst, thus increasing the active sites for WCO transesterification.39 Thanks for the correction: The hydrothermal CaO–H catalyst exhibits high catalytic activity due to the uniform cubic particle structure which provides stable active sites for the reaction. The uniform particle shape and small particle size increase the surface area of the catalyst, thus increasing the active sites for WCO transesterification.
1 molar ratio of methanol to oil. The amount of catalyst was used at 5% by weight of oil percentage, and the reaction time was conducted for 3 h. The biodiesel yield was determined based on the concentration of methyl esters compound determined using GCMS analysis (Fig. 5). The WCO transesterification showed a slight increase in biodiesel yield from 49.52% when using CaO–MgO to 56.61% when using MgO as the catalyst. The CaO–C obtained from co-precipitation produced 75.42% biodiesel yield, while 88.78% of biodiesel yield was obtained on CaO–H catalyst. Low catalytic activity of CaO–MgO and MgO was due to the weaker base properties of MgO than CaO.22,38 When MgO was removed from the catalysts (CaO–C and CaO–H), the catalytic activity improved significantly, suggesting the dominant role of CaO in the transesterification of WCO. Hydrothermal CaO–H catalyst exhibits high catalytic activity due to the uniform cubic particle structures that provide stable active sites for the reaction. The uniform particle shape and small particle size increased the surface area of the catalyst, thus increasing the active sites for WCO transesterification.39 Thanks for the correction: The hydrothermal CaO–H catalyst exhibits high catalytic activity due to the uniform cubic particle structure which provides stable active sites for the reaction. The uniform particle shape and small particle size increase the surface area of the catalyst, thus increasing the active sites for WCO transesterification.
Optimization of transesterification reaction
RSM optimization was performed with the variation of CaO–H loading, reaction temperature, and reaction time to obtain high biodiesel yield from WCO. Table 3 shows the biodiesel yield obtained at different transesterification parameters. The response surface and contour plots show the interaction between the variables and biodiesel output. According to these results, the maximum FAME yield of 92.40% can be obtained at the optimum reaction conditions of 5 wt% catalyst loading, 65 °C temperature and conducted in 3 h.| No. | Catalyst loading (wt%) | Temperature (°C) | Time (h) | Yield (%) |
|---|---|---|---|---|
| 1 | 2 | 60 | 3 | 87.80 |
| 2 | 8 | 60 | 3 | 89.29 |
| 3 | 2 | 70 | 3 | 92.00 |
| 4 | 8 | 70 | 3 | 92.36 |
| 5 | 2 | 65 | 2 | 84.54 |
| 6 | 8 | 65 | 2 | 91.27 |
| 7 | 2 | 65 | 4 | 90.04 |
| 8 | 8 | 65 | 4 | 91.43 |
| 9 | 5 | 60 | 2 | 77.90 |
| 10 | 5 | 70 | 2 | 78.32 |
| 11 | 5 | 60 | 4 | 83.80 |
| 12 | 5 | 70 | 4 | 87.80 |
| 13 | 5 | 65 | 3 | 92.16 |
| 14 | 5 | 65 | 3 | 90.40 |
| 15 | 5 | 65 | 3 | 92.40 |
Analysis of the variance of regression was performed in Table 4. Based on the three parameters used, reaction time is the dominating factor that significantly influences biodiesel yield. The reaction time showed the highest sequential number of squares at 55.335, while the reaction temperature and the amount of catalyst were 17.082 and 12.425, respectively. The analysis of variance and regression in Table 4 also shows that the regression P values of each variable amount of catalyst, temperature, and reaction time are 0, 934, 0.010, and 0.141, respectively. P value >0.05 indicates that the reaction temperature variable significantly affects the biodiesel product, while the amount of catalyst and reaction time does not affect the product. However, the P squared value of each variable <0.05 indicates a significant quadratic value and affects biodiesel yield. Table 3 also shows that the P value of the interaction between variables is greater than 0.05. This indicates that the interaction of each variable has no significant effect on biodiesel yield. The Lack of Fit analysis results obtained a P value = 0.172 which is greater than 0.05, indicating that the model used in the experiment fits the data.
| Sources | DF | Seg SS | Adj SS | Adj MS | F | P |
|---|---|---|---|---|---|---|
| Regression | 9 | 310.846 | 310.846 | 34.538 | 8.89 | 0.015 |
| Linear | 3 | 84.842 | 73.848 | 24.616 | 6.12 | 0.040 |
| A | 1 | 12.425 | 0.030 | 0.030 | 0.01 | 0.934 |
| B | 1 | 17.082 | 67.113 | 67.113 | 16.67 | 0.010 |
| C | 1 | 55.335 | 12.255 | 12.255 | 3.04 | 0.141 |
| Square | 3 | 215.352 | 215.352 | 71.784 | 17.84 | 0.004 |
| A2 | 1 | 51.937 | 34.057 | 34.057 | 8.46 | 0.033 |
| B2 | 1 | 56.924 | 69.160 | 69.160 | 17.18 | 0.009 |
| C2 | 1 | 106.491 | 106.491 | 106.491 | 26.46 | 0.004 |
| Interaction | 3 | 10.652 | 10.652 | 3.551 | 0.88 | 0.510 |
| AB | 1 | 0.319 | 0.319 | 0.319 | 0.08 | 0.790 |
| AC | 1 | 7.129 | 7.129 | 7.129 | 1.77 | 0.241 |
| BC | 1 | 3.204 | 3.204 | 3.204 | 0.80 | 0.413 |
| Residual error | 5 | 20.12 | 20.12 | 4.025 | ||
| Lack-of-Fit | 3 | 17.739 | 17.739 | 5.913 | 4.96 | 0.172 |
| Pure error | 2 | 2.385 | 2.385 | 1.193 | ||
| Total | 14 | 330.971 |
Fig. 6 shows the contour and surface responses of biodiesel yield under varying catalyst loading, reaction time, and temperature. The biodiesel yield enhanced with temperature increased from 60° to 65°, but reduced at 70 °C. High temperatures reduced biodiesel production due to the reaction of fatty acids with CaO to form soap.22 Increasing the reaction temperature also causes methanol evaporation, thus, it is necessary to reduce the contact of methanol with the catalyst and oil in the liquid phase.40 The use of catalyst loading affects the biodiesel production. The presence of a catalyst speeds up the reaction, increasing the yield of the final product. However, after reaching the optimum biodiesel yield, the excess catalyst will increase the production of FFA and leads to the formation of soap. The formation of soap increases the viscosity and decreases the homogeneity of reaction mixture which reduce reaction efficiency due to the mass transfer resistance.22 According to the plot of the contour and response surface, the yield of biodiesel rises as catalyst loading increases and didn't reach the optimum point. This can happen because the distance between the variables is too close.
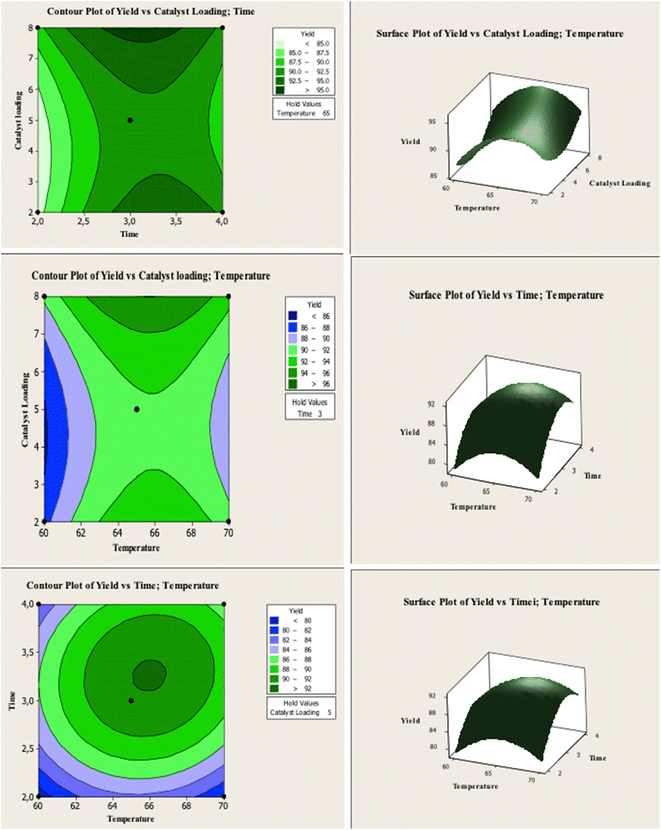 | ||
| Fig. 6 Contour plots and response surfaces of the biodiesel yield under varying catalyst loading, reaction time, and temperature. | ||
The effect of reaction temperature and catalyst amount on biodiesel production is shown in Fig. 6. The optimum reaction time is 3 h. If the reaction time is prolonged, a reaction equilibrium occurs between the products and the reactants, decreasing biodiesel production.22,41 The contour and surface interaction between temperature and reaction time on biodiesel yield Fig. 6 shows the similarity between the experimental results and calculation.
The optimum reaction temperature was determined at 65 °C and the optimum reaction time of 3 h. Increasing the reaction temperature and time after reaching the optimum condition reduced biodiesel yield. The transesterification reaction for biodiesel production is an equilibrium reaction, and adding reaction time after reaching the optimal time is inefficient for increasing biodiesel yield.22
The analysis of variance and regression (Table 4) shows that the regression P values of each variable amount of catalyst, temperature, and reaction time were 0.934; 0.010, and 0.141, respectively. P value >0.05 indicates that the reaction temperature variable influences biodiesel production, while the amount of catalyst and reaction time does not affect the product. However, the quadratic P value of each variable <0.05 indicates a significant quadratic value and affects the biodiesel yield. Table 3 also shows that the P value of the interaction between variables is greater than 0.05. This indicates that the interaction of each variable has no significant effect on biodiesel yield. The results of the Lack-of-Fit analysis obtained a P value = 0.172 which is greater than 0.05, and this indicates that the model used in the experiment is following the data.
Biodiesel characterization
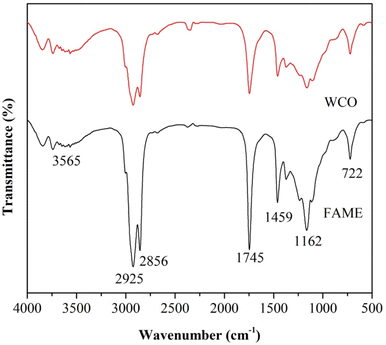
![[double bond, length as m-dash]](https://www.rsc.org/images/entities/char_e001.gif) O bond in the carbonyl group of the triglyceride structure.41 However, there are differences in the intensity of the FTIR spectra at different wavenumbers, such as the lower absorption peak observed at 3565.15 cm−1, which refers to the stretching vibration of the –OH group in water molecules, indicating lower water content in biodiesel. After the biodiesel manufacturing process, the range and intensity of the peak along the FTIR spectrum also became sharper at several wavenumbers, such as the absorption peak at 2925.85; 2856.42; 1745.36; 1459.37; and 1162.87 cm−1 are associated with the formation of methyl esters from biodiesel and clearly show the production of biodiesel from WCO.41 A sharper absorption peak at 1162.87 cm−1 along the FTIR spectrum is associated with the –OCH3 group in WCO-produced biodiesel.42 The properties of biodiesel are usually determined by the feedstock used. Biodiesel from vegetable oils generally has a low viscosity, low flash point, good lubricity, low flash point, and high vapor pressure. Table 4 shows the results of the physical properties of WCO biodiesel, such as density, kinematic viscosity, flash point, bale temperature, and acid value.
O bond in the carbonyl group of the triglyceride structure.41 However, there are differences in the intensity of the FTIR spectra at different wavenumbers, such as the lower absorption peak observed at 3565.15 cm−1, which refers to the stretching vibration of the –OH group in water molecules, indicating lower water content in biodiesel. After the biodiesel manufacturing process, the range and intensity of the peak along the FTIR spectrum also became sharper at several wavenumbers, such as the absorption peak at 2925.85; 2856.42; 1745.36; 1459.37; and 1162.87 cm−1 are associated with the formation of methyl esters from biodiesel and clearly show the production of biodiesel from WCO.41 A sharper absorption peak at 1162.87 cm−1 along the FTIR spectrum is associated with the –OCH3 group in WCO-produced biodiesel.42 The properties of biodiesel are usually determined by the feedstock used. Biodiesel from vegetable oils generally has a low viscosity, low flash point, good lubricity, low flash point, and high vapor pressure. Table 4 shows the results of the physical properties of WCO biodiesel, such as density, kinematic viscosity, flash point, bale temperature, and acid value.
Biodiesel properties
Table 5 summarizes the characteristics of WCO-derived biodiesel using CaO derived from CaO–MgO catalyst using rarasaponin by hydrothermal method. Biodiesel analysis results were also compared with ASTM D6751 and Zhang et al. (2020).42| Parameters | This study | ASTM D6751 | 42 |
|---|---|---|---|
| Density (g cm−3) | 0.88 | 0.86–0.90 | 0.887 |
| Kinematic viscosity at 40 °C (cSt) | 2.48 | 1.9–6.0 | 4.2 |
| Flashpoint (°C) | 131 | 100–170 | 196 |
| Cloud point (°C) | 24 | Max. 26 | — |
| Number of acids (mg KOH g−1) | 0.32 | <0.8 | 0.15 |
Analysis of physical properties of WCO biodiesel with a specific gravity of 0.88 g cm−3 according to ASTM standards. The synthesized biodiesel also has the similar density value, 0.887 g cm−3 as reported by Zhang et al. (2020).42 The biodiesel viscosity of WCO is ∼2.48 cSt, which is in line with the ASTM standard ranges but is lower than that of biodiesel produced by Zhang et al. (2020).42 The results of other analysis, such as flash point, fog point, and acid number, are 131 °C, 24 °C, and 0.32, respectively, which follow the standards set by ASTM 6751.
Conclusions
Hydrothermal production was employed to obtain CaO from a CaO–MgO mixture, utilizing the rarasaponin from Sapindus rarak fruit as natural surfactant. The application of rarasaponin as a surfactant for CaO production results in a remarkable purity level of up to 98% for CaO and a reduction in particle size compared to directly calcined limestone (CaO–MgO). The optimal conditions were determined by employing Response Surface Methodology (RSM) with CaO as the catalyst, yielding the highest biodiesel yield. These conditions included a catalyst quantity of five times the initial amount, a reaction duration of three hours, a reaction temperature of 65 °C, and a maximum biodiesel yield of 92.40%. The properties of biodiesel were evaluated to be within the ASTM standards.Data availability
The data supporting this study's findings are available from the corresponding author upon reasonable request.Author contributions
Nuni Widiarti: data curation, investigation, formal analysis, writing – original draft; Holilah Holilah: formal analysis, methodology, data curation, visualization; Hasliza Bahruji: supervision, validation, writing – review & editing; Reva Edra Nugraha: data analysis, formal analysis, investigation, visualization; Suprapto Suprapto: funding acquisition, supervision, validation, writing – review & editing; Yatim Lailun Ni'mah: validation, writing – review & editing; Didik Prasetyoko: conceptualization, supervision, validation, writing – review & editing.Conflicts of interest
There are no reported financial or personal conflicts of interest by the authors of this study.Acknowledgements
The authors acknowledge the Directorate of Research and Community Service (DRPM) of Institut Teknologi Sepuluh Nopember (ITS) under Penelitian Keilmuan research grant with contract number 1761/PKS/ITS/2023 for funding the research.Notes and references
- T. Roy, S. Sahani, D. Madhu and Y. Chandra, J. Clean. Prod., 2022, 265, 121440 CrossRef.
- N. Mansir, S. H. Teo, U. Rashid and Y. H. Taufiq-Yap, Fuel, 2018, 211, 67–75 CrossRef CAS.
- M. Afsharizadeh and M. Mohsennia, React. Kinet. Mech. Catal., 2019, 128, 443–459 CrossRef CAS.
- E. M. S. Faba, G. O. Ferrero, J. M. Dias and G. A. Eimer, Appl. Catal., A, 2020, 604, 117769 CrossRef.
- P. R. Pandit and M. H. Fulekar, J. Environ. Manage., 2017, 198, 319–329 CrossRef CAS PubMed.
- T. Maneerung, S. Kawi, Y. Dai and C. H. Wang, Energy Convers. Manag., 2016, 123, 487–497 CrossRef CAS.
- D. M. Marinkovi, M. V. Stankovi, A. V. Veli, J. M. Avramovi, M. R. Miladinovi, O. O. Stamenkovi, V. B. Veljkovi and M. Jovanovi, Renewable Sustainable Energy Rev., 2016, 56, 1387–1408 CrossRef.
- E. Pilorgé, Oilseeds Fats, Crops Lipids, 2020, 27, 1–11 Search PubMed.
- S. Uthandi, A. Kaliyaperumal, N. Srinivasan, K. Thangavelu, I. K. Muniraj, X. Zhan, N. Gathergood and V. K. Gupta, Crit. Rev. Environ. Sci. Technol., 2022, 52, 2197–2225 CrossRef.
- W. Murti, Eur. Res. Stud., 2017, 20, 568–580 CrossRef.
- E. M. Vargas, M. C. Neves, L. A. C. Tarelho and M. I. Nunes, Renewable Energy, 2019, 136, 873–883 CrossRef CAS.
- T. Anbessie, T. T. Mamo and Y. S. Mekonnen, Sci. Rep., 2019, 9, 1–8 CrossRef PubMed.
- W. Jindapon and C. Ngamcharussrivichai, Energy Convers. Manag., 2018, 171, 1311–1321 CrossRef CAS.
- X. Li, Y. Zuo, Y. Zhang, Y. Fu and Q. Guo, Fuel, 2013, 113, 435–442 CrossRef CAS.
- S. H. Teo, A. Islam, H. R. F. Masoumi, Y. H. Taufiq-Yap, J. Janaun, E. Chan and M. A. Khaleque, Renewable Energy, 2017, 111, 892–905 CrossRef CAS.
- N. Mansir, U. Rashid, S. H. Teo, Y. H. Taufiq-Yap, G. A. Alsultan, Y. P. Tan and M. I. Saiman, Renew. Sustain. Energy Rev., 2017, 82, 3645–3655 CrossRef.
- D. M. Marinković, M. V. Stanković, A. V. Veličković, J. M. Avramović, M. R. Miladinović, O. O. Stamenković, V. B. Veljković and D. M. Jovanović, Renew. Sustain. Energy Rev., 2016, 56, 1387–1408 CrossRef.
- W. Roschat, S. Phewphong, A. Thangthong, P. Moonsin, B. Yoosuk, T. Kaewpuang and V. Promarak, Energy Convers. Manag., 2018, 165, 1–7 CrossRef CAS.
- M. Kouzu, T. Kasuno, M. Tajika, Y. Sugimoto, S. Yamanaka and J. Hidaka, Fuel, 2008, 87, 2798–2806 CrossRef CAS.
- D. T. Oyekunle, M. Barasa, E. A. Gendy and S. K. Tiong, Process Saf. Environ. Prot., 2023, 177, 844–867 CrossRef CAS.
- N. Widiarti, H. Bahruji, H. Holilah, Y. L. Ni’mah, R. Ediati, E. Santoso, A. A. Jalil, A. Hamid and D. Prasetyoko, Biomass Convers. Biorefin., 2021, 1–15 Search PubMed.
- A. M. Rabie, M. Shaban, M. R. Abukhadra, R. Hosny, S. A. Ahmed and N. A. Negm, J. Mol. Liq., 2019, 279, 224–231 CrossRef CAS.
- D. Nie, A. Xue, M. Zhu, Y. Zhang and J. Cao, J. Rare Earths, 2019, 37, 443–450 CrossRef CAS.
- A. Abdulloh, A. A. Widati and O. Arizal, J. Chem. Technol. Metall., 2017, 6, 1150–1156 Search PubMed.
- E. Maryanti, D. Damayanti, I. Gustian and S. S. Yudha, Mater. Lett., 2014, 118, 96–98 CrossRef CAS.
- V. Jassal, U. Shanker and S. Gahlot, Appl. Phys. A, 2016, 122, 1–12 CrossRef CAS.
- A. Aziz, R. E. Nugraha, H. Holilah, H. Bahruji, M. Al Muttaqii, S. Suprapto and D. Prasetyoko, Inorg. Chem. Commun., 2024, 165, 112497 CrossRef CAS.
- E. M. Vargas, J. L. Ospina, L. A. C. Tarelho and M. I. Nunes, Energy Rep., 2020, 6, 347–352 CrossRef.
- B. Salamatinia, H. Mootabadi, S. Bhatia and A. Z. Abdullah, Fuel Process. Technol., 2010, 91, 441–448 CrossRef CAS.
- A. A. L. Zinatizadeh, A. R. Mohamed, M. D. Mashitah, A. Z. Abdullah and M. H. Isa, Biochem. Eng. J., 2007, 35, 226–237 CrossRef CAS.
- M. R. Abeywardena, R. K. W. H. M. K. Elkaduwe, D. G. G. P. Karunarathne, H. M. T. G. A. Pitawala, R. M. G. Rajapakse, A. Manipura and M. M. M. G. P. G. Mantilaka, Adv. Powder Technol., 2020, 31(1), 269–278 CrossRef CAS.
- M. J. Borah, A. Das, V. Das, N. Bhuyan and D. Deka, Fuel, 2019, 242, 345–354 CrossRef CAS.
- A. R. Gupta and V. K. Rathod, Waste Manag., 2018, 79, 169–178 CrossRef CAS PubMed.
- S. Suprapto, T. R. Fauziah, M. S. Sangi, T. P. Oetami, I. Qoniah and D. Prasetyoko, Indones. J. Chem., 2016, 16, 208–213 CrossRef.
- H. V. Lee, J. C. Juan and Y. H. Taufiq-Yap, Renewable Energy, 2015, 74, 124–132 CrossRef CAS.
- C. Liu, L. Zhang, J. Deng, Q. Mu, H. Dai and H. He, J. Phys. Chem. C, 2008, 112, 19248–19256 CrossRef CAS.
- M. M. M. G. P. G. Mantilaka, W. P. S. L. Wijesinghe, H. M. T. G. A. Pitawala, R. M. G. Rajapakse and D. G. G. P. Karunaratne, J. Natl. Sci. Found. Sri Lanka, 2014, 42, 221–228 Search PubMed.
- H. Yang, H. Dong, T. Zhang, Q. Zhang, G. Zhang, P. Wang and Q. Liu, Catal. Lett., 2019, 149, 778–787 CrossRef CAS.
- K. Seffati, B. Honarvar, H. Esmaeili and N. Esfandiari, Fuel, 2019, 235, 1238–1244 CrossRef CAS.
- K. Sudsakorn, S. Saiwuttikul, S. Palitsakun, A. Seubsai and J. Limtrakul, J. Environ. Chem. Eng., 2017, 5, 2845–2852 CrossRef CAS.
- J. Nisar, R. Razaq, M. Farooq, M. Iqbal, R. Ali, M. Sayed and A. Shah, Renewable Energy, 2017, 101, 111–119 CrossRef CAS.
- H. Zhang, F. Tian, L. Xu, R. Peng, Y. Li and J. Deng, Chem. Eng. J., 2020, 388(124214), 1–14 Search PubMed.
| This journal is © The Royal Society of Chemistry 2024 |

