 Open Access Article
Creative Commons Attribution 3.0 Unported Licence
Exploring dielectric and AC conduction characteristics in elemental selenium glass modified with silver halides
Anil Kumara,
Vishnu Saraswata,
A. Dahshan b,
H. I. Elsaeedyb and
Neeraj Mehta
 *a
*a
aDepartment of Physics, Banaras Hindu University, Varanasi 221005, India. E-mail: dr_neeraj_mehta@yahoo.ac.in
bDepartment of Physics, College of Science, King Khalid University, Abha 61413, Saudi Arabia
First published on 2nd July 2024
Abstract
In this research work, we have examined the influence of silver halide doping on the dielectric dispersion and AC conduction of elemental selenium. The in-depth investigation shows that when the dopant silver halides are incorporated, there are noticeable changes in the parent selenium's dielectric constant (ε′), dielectric loss (ε′′), and AC conductivity (σac). When we frame the discussion of the obtained results with the relevant transport models, we found that in pure selenium and Se95(AgI)5, conduction is primarily due to polaron hopping and follows the correlated barrier hopping (CBH) model. In contrast, Se95(AgBr)5 predominantly exhibits non-overlapping small polaron tunneling (NSPT). Interestingly, Se95(AgCl)5 demonstrates both NSPT and CBH conduction mechanisms, depending on the temperature range: NSPT is dominant between 303 K and 313 K, while CBH prevails from 318 K to 338 K. Additionally, our findings revealed the presence of both the Meyer–Neldel rule (MNR) and its reverse in the prepared silver halide chalcogenide alloys. The best optimization of dielectric constant and loss is observed for silver iodide as compared to silver chloride and silver bromide. Comparison with other silver-containing chalcogenide glasses indicates the better dielectric performance of the present silver halides containing selenium.
1. Introduction
Glasses and ceramics have emerged as pioneering subjects in advanced materials research, offering innovative solutions to contemporary global challenges across diverse domains such as energy, the environment, and information/communication technology. Their special qualities and broad range of uses drive technical progress and encourage long-term improvements in everything from optics and electronics to infrastructure and healthcare. Chalcogenide glasses (ChGs) have garnered significant attention due to their distinctive properties and capabilities, making them highly promising for applications in photonics and optoelectronics. ChGs are non-crystalline substances composed of chalcogen atoms (typically S, Se, or Te) and one or more electropositive atoms from the p-block of the periodic table.1,2 Ag-doped chalcogenides, in particular, are of considerable interest with a wide range of applications, and the understanding of their properties is rapidly advancing.3The slight disparity in electronegativity among the constituents makes ChGs predominantly covalently bonded, which results in a bonding strength lower than that of oxide materials. Consequently, glass formation is possible over a wide range of compositions, allowing for the creation of both homonuclear and heteronuclear connections and producing remarkable stability in non-stoichiometric molecules. This structural adaptability and diverse bonding nature enable unparalleled capacity for doping and alloying, facilitating precise manipulation of the optical and electrical properties of these materials. This versatility not only promotes groundbreaking advancements in optoelectronics but also holds potential for novel applications in emerging technologies such as flexible electronics, photovoltaics, and advanced sensing devices.4
Adding specific metallic modifiers as foreign elements to chalcogenide glasses provides valuable information on the temperature-dependent dielectric and AC conduction response at various audio frequencies, correlating the electrical properties with structural modifications.5–7 Dielectric relaxation is used to study dipole behavior in materials as a consequence of varying temperatures and frequencies, aiding in understanding the dielectric response. Examining the structure of chalcogenide glasses is crucial for gaining deeper insight into transport mechanisms. AC conductivity measurements are widely used to investigate defect centers in disordered systems, based on the assumption that these centers are responsible for this type of conduction. By examining a material's dielectric response, one can learn more about the dynamics of charge carriers and the underlying conduction mechanisms. For example, dielectric relaxation studies can provide insights into the presence and dynamics of localized centers and the frequency and temperature dependence of the dielectric constant and conductivity.8 The study of thermally triggered AC conduction as a function of temperature and frequency offers insights into the electrical relaxation of dielectric materials.9 When silver halides are added as a dopant, the electrical characteristics of selenium are improved, making them very well suited for use as nonlinear optical materials. This improvement has great potential for use in different applications, including actuators, sensors, and capacitors in solid-state electronic devices. Ferau et al.10 synthesized composites of silicate bioactive glasses and silver iodide (AgI) and reported their possible tissue engineering applications. Sayyed et al.11 observed that the radiation shielding effectiveness of borate glasses embedded with low amounts of CrO3, and high levels of Na2O can be improved by doping AgI. Marasanov et al.12 reported the formation of the Ag–AgBr nanostructures by using the low-temperature ion exchange method and followed heat treatment in bromide sodium–zinc–aluminosilicate glass. They observed that the presence of a photocatalyst with Ag–AgBr nanostructures in the surface layer of glass under ultraviolet irradiation leads to better photocatalytic properties and the samples can be applied in devices for the photocatalytic decomposition of water to produce hydrogen. Bokova et al.13 developed the potentiometric chemical sensors for sodium detection by doping metal halides in (Ga2S3)26(GeS2)44 chalcogenide glasses.
In present studies, we have doped silver halides in the elemental selenium glass instead of alloying silver with selenium or selenium-rich ChGs since the alloying of silver with chalcogens has already been performed by various research groups in the past.3 This paper unveils the outcomes of dielectric dispersion and AC conduction in Se(100−y)(AgX)y glass ceramics (X = Cl, Br, and I; y = 0 and 5 weight percentages).
2. Material preparation
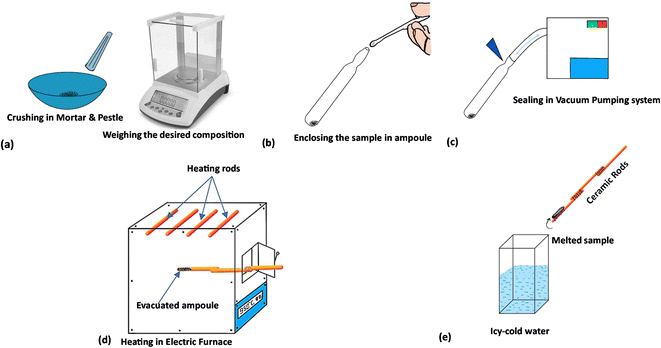
Materials Se100(AgX)0, Se95(AgCl)5, Se95(AgBr)5 and Se95(AgI)5 were produced using the conventional melt quench method. It has been reported that ionic conduction becomes dominant if we add the high silver and silver halide content in chalcogenides glasses.3,14 Thus, we have used 5 weight percentages of silver halides to maintain the electronic conduction in the obtained samples. In the first step, the elemental selenium and powdered silver halides (AgCl, AgBr, and AgI) were precisely weighed to synthesize the present samples. We have procured the 5 N pure selenium and 4 N pure silver halides from Thermo Fisher, USA to ensure the purity of the prepared samples. The materials were sealed inside the quartz ampoules by using a high vacuum pumping system (steps two and three), followed by continuous heating for ten hours in an electric furnace at 800 °C (step four). Eventually, the ampoules were taken out of the furnace and swiftly dipped into ice-cold water to cool the molten substance (step five), and the quartz ampoules were broken carefully to release the prepared bulk materials. Fig. 1 shows a pictorial representation of all the steps described above.3. Experimental basis
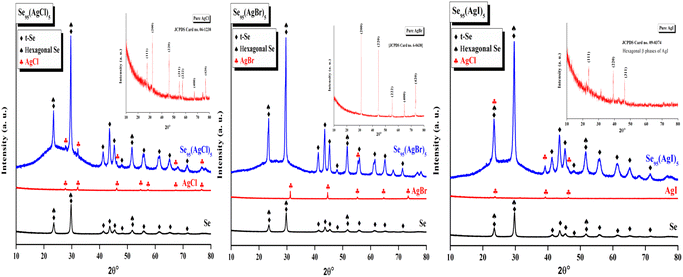
An X-ray diffractometer was used to record the XRD pattern of each produced sample.The XRD pattern of all the prepared samples was recorded by an X-ray diffractometer (Cu-Kα radiation λ = 1.54 Å). The tube was maintained at 45 kV and 40 mA. The XRD pattern of all Se95(AgX)5 samples is shown in Fig. 2 (blue) in comparison with parent selenium (black) and dopant silver halide salt (red). Only a few peaks of insignificant intensities were observed over the broad hump i.e., the first sharp diffraction peak (FSDP), which is indicative of intermediate-range ordering in the current samples, was one of only a few faintly visible peaks over the broad humps However, we have identified some distinguished peaks that can be indexed. XRD patterns indicate the presence of crystallinity, overlaying the amorphous glassy matrix. The materials having this kind of crystallinity are known as glass ceramics. Peaks are identified using literature review, X'Pert Highscore Plus software, and matched with the JCPDS database. The primary most intense peaks of crystalline t-Se i.e., trigonal Se (COD 9008579) are visible at 2θ values of 23.5°, 29.7°, and 51.7°, which correspond to the crystal planes (100), (101), and (201), respectively.15,16 Also, the lattice index obtained was close and consistent with standard data for hexagonal selenium (JCPDS 96-901-2502). For Selenium, recorded reflection peaks are 23.55°, 29.69°, 41.32°, 43.65°, 45.36°, 48°, 51.7°, 56.11°, 61.67°, 65.23° and 71.7° which correspond to the crystal planes (100), (101), (110), (10![[2 with combining macron]](https://www.rsc.org/images/entities/char_0032_0304.gif) ), (111), (200), (201), (112), (20
), (111), (200), (201), (112), (20![[2 with combining macron]](https://www.rsc.org/images/entities/char_0032_0304.gif) ), (210) and (113), respectively.17 Peaks of different silver halide salts are identified and presented in the inset of the XRD patterns. AgCl nanocrystal diffraction peaks at 27.7°, 32.2°, 46.18°, 67.3°, and 76.78° could be correlated with the (111), (200), (220), (400), and (420) planes of the cubic-phase AgCl. In the case of Se95(AgBr)5, AgBr nanocrystal the only diffraction peaks at 55.3° identified which could be correlated with the (222) plane of the cubic-phase AgBr and all other phases of AgBr are missing. AgI nanocrystal diffraction peaks at 23.8°, 39.2°, and 46.3° could be correlated with the (111), (220), and (311) planes of the cubic-phase AgI.
), (210) and (113), respectively.17 Peaks of different silver halide salts are identified and presented in the inset of the XRD patterns. AgCl nanocrystal diffraction peaks at 27.7°, 32.2°, 46.18°, 67.3°, and 76.78° could be correlated with the (111), (200), (220), (400), and (420) planes of the cubic-phase AgCl. In the case of Se95(AgBr)5, AgBr nanocrystal the only diffraction peaks at 55.3° identified which could be correlated with the (222) plane of the cubic-phase AgBr and all other phases of AgBr are missing. AgI nanocrystal diffraction peaks at 23.8°, 39.2°, and 46.3° could be correlated with the (111), (220), and (311) planes of the cubic-phase AgI.
The surface morphology of the prepared chalcogenide system is analyzed using a scanning electron microscope (SEM), as shown in Fig. 3 for the present samples. The whole surface of each sample has a non-uniform and irregular microstructure, as seen in the SEM image. However, when silver halides are incorporated into the parent selenium sample, the microstructural morphology changes. Now, the particles are aggregated with a more granular morphology that seems to be tightly packed with irregular shapes. Thus, we observe small, irregular, tightly packed granular particles aggregated in the selenium matrix after the incorporation of AgX. The TEM images of the present samples are depicted in Fig. 4. The particles exhibit a heterogeneous size distribution, with various lateral dimensions formed by stacked layers, indicative of microparticle clustering and the consolidation of these clusters within the glass matrix. Some layers have undergone exfoliation, leading to more refined edges, likely due to the formation of a passivation layer on the surface. Consequently, all samples display microstructural characteristics akin to materials with a glassy nature. However, a comparison of the electron diffraction patterns (EDP) between pristine selenium and silver halide-doped selenium samples reveals that the pristine selenium sample exhibits a single diffuse ring, while the Se-AgX samples display intermittent rings corresponding to indistinct reflections, signifying medium-range ordering (MRO). In chalcogenide glasses (ChGs), metastable clusters with extensive surfaces can be considered as undersized clusters with an internally ordered structure. The ChGs consist of perceived clusters that serve as intermediate-range ordered microstructural units of diverse geometries (i.e., each unit has a unique size and structure). Thus, these glasses may contain various configurational units. The intermediate-range ordered structure of glasses resembles that of fractional segments of chain-layered crystals. The glass network of Se95(AgX)5 glass-ceramics comprises a substantial fraction of Se–Se homopolar bonds and a small yet significant fraction of silver-halide salts. Consequently, the appearance of discontinuous rings in the electron diffraction pattern of the silver halide-doped sample can be attributed to the MRO.
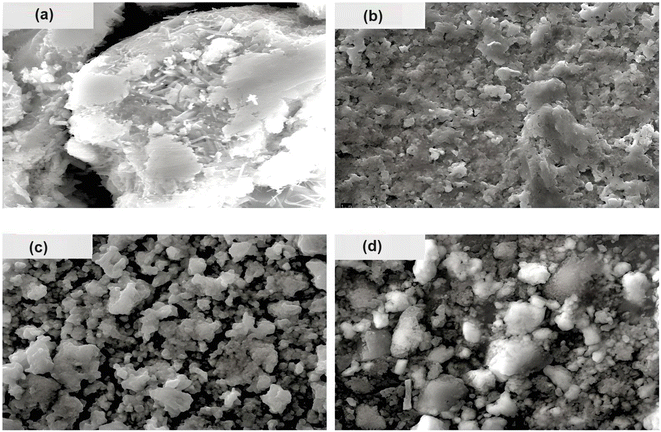 | ||
| Fig. 3 SEM images of the present samples: (a) Se, (b) Se95(AgCl)5, (c) Se95(AgBr)5, and (d) Se95(AgI)5. | ||
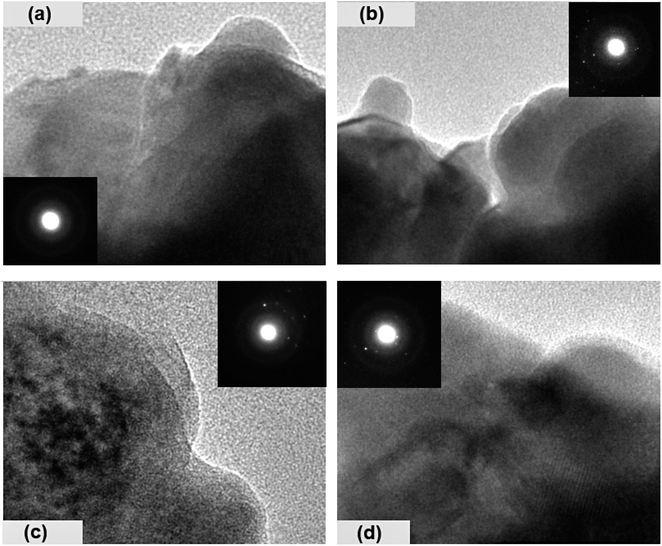 | ||
| Fig. 4 TEM images of the present samples: (a) Se, (b) Se95(AgCl)5, (c) Se95(AgBr)5, and (d) Se95(AgI)5. | ||
The aforementioned analysis, based on X-ray Diffraction (XRD), Scanning Electron Microscopy (SEM), and Transmission Electron Microscopy (TEM) characterization, elucidates the existence of crystallinity superimposed on an amorphous glassy matrix, thereby indicating the formation of glass-ceramics. When silver is incorporated into chalcogenide glasses (ChGs), it acts as a bridging atom among individual selenium chains, facilitating the formation of a network structure that ultimately leads to the development of a glassy material. Conversely, doping with silver halides may result in the shortening of selenium chains, as the monovalent halide ions can attach to the terminal points of the chains or interact with lone-pair electrons of selenium atoms within the chains. Thus, in contrast to silver-doped ChGs, silver halide doping does not lead to the formation of glass with short-range ordering but rather promotes the development of glass ceramics.
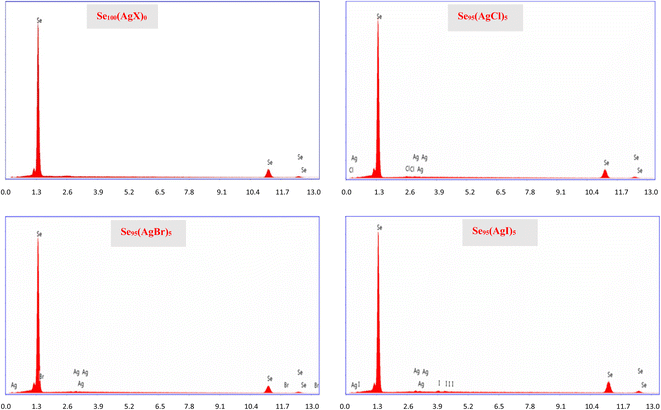
To ascertain the precise composition of the constituents within the samples, we employed energy-dispersive X-ray spectroscopy (EDX). Fig. 5 shows the EDX spectra of the present samples. In our examination of the EDX pattern, we did not find any discernible compositional variation. This became possible because of careful weighing in a sensitive weighing balance (Contech Electronic Balance, India; model: CA-44) of sensitivity 0.1 mg.
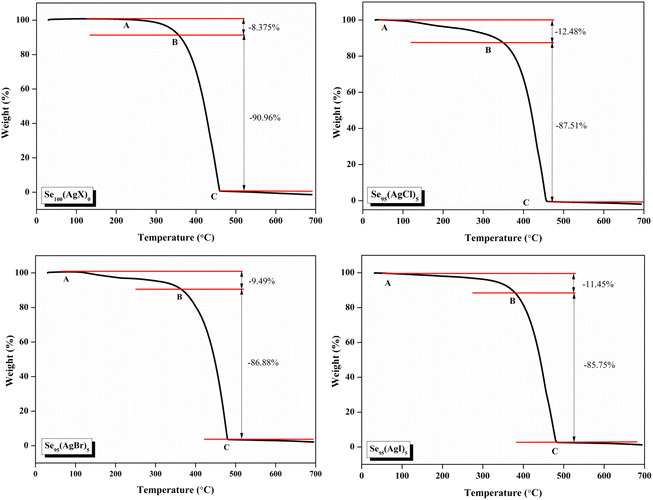
The thermal stability of these samples was investigated by Thermogravimetric analysis (TGA). A PerkinElmer thermal analyzer is used to obtain the TGA thermographs. The nitrogen gas was continuously flowed at a rate of 20 mL min−1, and the temperature was increased at a rate of 10 °C min−1 from 30 °C to 700 °C. TGA thermograms of the present samples are shown in Fig. 6. The sample exhibits a comparable two-stage deterioration, as shown by this figure, with a slow mass loss from about 100 °C to 380 °C, or about 10% of its initial weight lost, and a significantly quicker mass loss (about 85–89% of its initial weight lost) between 380 °C and 460 °C. These results show that the prepared samples have good thermal stability nearly up to 400 °C.
Using a digital LCR meter (Wayne Kerr Electronics, Model: 4100), we performed electrical measurements to examine the temperature/frequency dependence of ε′, ε′′, and σac. The loss tangent (tan(δ)), and capacitance (C) were measured directly in the frequency span of 0.5 kHz–500 kHz.
4. Theoretical basis
By considering only the existence of bound charges in chalcogenide polymers, we can use the relation σ = ωε0ε′′ to estimate the AC conductivity directly. Guintini and his fellow researchers developed a practical method for examining dielectric dispersion by evaluating variations in dielectric loss (ε′′) across a specified temperature (T) or frequency range.18
 | (1) |
| ε′′ = Bωm | (2) |
The constant B denoted in the above equation is represented by the following expression:
 | (3) |
 | (4) |
Many scientific theories have been proposed by researchers to establish a connection between the conduction mechanism of AC conductivity and the behavior of s(T) in amorphous (glassy) materials, which arises from electron hopping or tunneling processes. These theories encompass the following models: (i) CBH, (ii) NSPT, (iii) overlapping large polaron tunneling (OLPT) model, and (iv) the Quantum-Mechanical Tunnelling model (QMT). The central objective of these models is to provide insights into the underlying mechanism governing alternating current (AC) conduction.19 The CBH model demonstrates a decrease in the exponent s as temperature increases.20 In contrast, the NSPT model shows an increase in the exponent s with rising temperature.21 Upon an increase in temperature, the OLPT model indicates a decline in the parameter s, which attains a minimum at a specific temperature before exhibiting an upward trend once more.22 Conversely, the QMT model predicts that the exponent s remains largely invariant with temperature or exhibits a slight increment, maintaining a fixed value of 0.8.23
The electrical conductivity of chalcogenide samples, as indicated in ref. 24, is characterized by alternating current that varies with frequency due to the out-of-phase movement of charges “Universal dielectric response (UDR)”:
| σac(ω) = AωS | (5) |
The power law exponent “S” measures electrical conduction and relaxation behavior and it shows how strongly polarons and charge carriers interact with their environment. Importantly, s is also observed to be temperature-dependent.
According to the CBH model, conduction is affected by the motion of electrons that get stuck within two defect centers and pass across an isolated Coulomb barrier. This model, introduced by Pike20 in 1972 for the translocation of a single electron, was later expanded by Elliot in 1977 to accommodate the synchronized hopping of two electrons.25 Because of Coulomb interactions, the elevation of the barrier depends on the distance between the two defect states. The potential wells overlap and the barrier height from WM to W decreases as the locations grow closer together (a decrease in separation indicated by Rω), as described by the equation:
 | (6) |
According to the CBH model, exponent s can be expressed as:
 | (7) |
The AC conductivity is expressed as follows:
 | (8) |
The polaron hopping distance Rω is given by the expression:
 | (9) |
According to the NSPT model, exponent s can be expressed as:
 | (10) |
The AC conductivity in terms of the density of localized states N(Ef) is expressed as follows:
 | (11) |
In eqn (11), α−1 denotes the localization length of the wave function of small polaron.26,27
The Rω in terms of α can be expressed as:
 | (12) |
5. Result and discussion
The dielectric constant, which can be computed by dividing the material's capacitance by the vacuum's capacitance, indicates a material's capacity for conserving electrical energy.28 We have calculated the dielectric constant from the measured value of capacitance C in the following relation:
 | (13) |
Additionally, dielectric loss ε′′ is calculated by the relation:
ε′′ = ε′![[thin space (1/6-em)]](https://www.rsc.org/images/entities/char_2009.gif) tan tan![[thin space (1/6-em)]](https://www.rsc.org/images/entities/char_2009.gif) δ δ
| (14) |
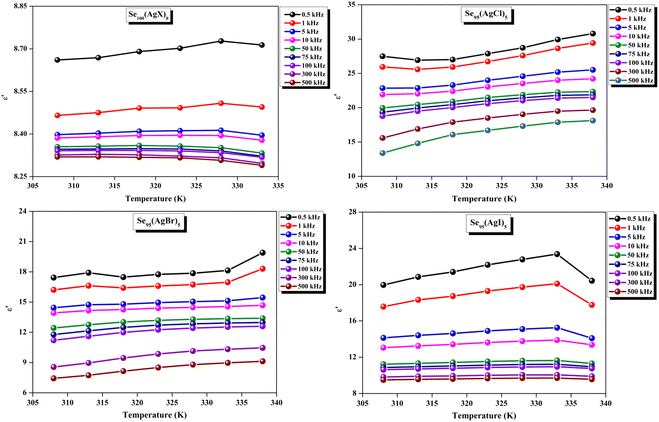
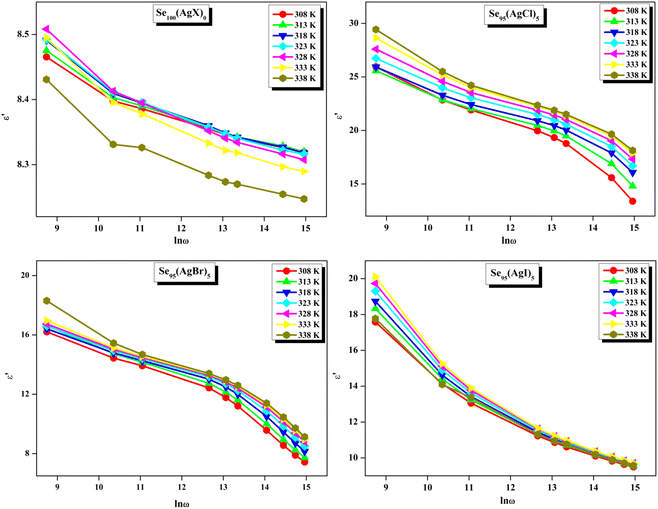
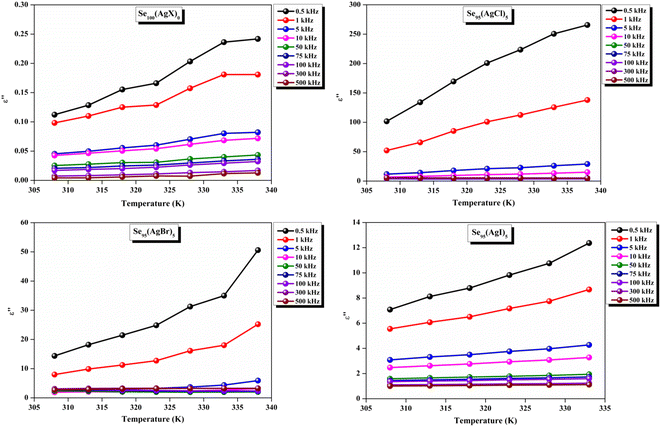
The loss tangent, which is symbolized as tan![[thin space (1/6-em)]](https://www.rsc.org/images/entities/char_2009.gif) δ, plays a role in computing the dielectric constant. In this context, ε′ stands for the real component of the dielectric constant. The variation of ε′ with temperature for prepared elemental glassy Selenium and multicomponent Se95(AgX)5 (X = Cl, Br, and I) chalcogenide glasses are depicted in Fig. 7. This shows that the ε′ increases with the applied temperature in the studied frequency range. However, the rate of increment is different for different audio frequencies. The observed phenomenon can be explained by the connection between the thermal movement of molecules, which make up the amorphous structural material, and dipolar polarisation. Because there is a lack of the necessary thermal energy to offset molecular interaction, dipoles are primarily frozen at lower temperatures. Nonetheless, the thermal energy of dipoles rises together with the system temperature. This facilitates the dipoles to orient themselves by lessening the impact of molecular interaction. In turn, this raises the dielectric constant and polarisation overall. Numerous research teams have documented this behavior in their articles.30–33 It can also be noticed that the value of ε′ increases with silver halide doping. A dielectric dispersion has been noticed at room temperature. The plots in Fig. 8 depict the correlation between the dielectric constant and frequency for various multicomponent chalcogenide alloys that have been prepared. It is noticeable that as the frequency increases at various temperatures, the ε′ shows a downward trend. Dimerization of dipolar polarization is responsible for the observed decrease in ε′ values across all compositions with increasing frequency of the applied external electric field. This occurs when the dipoles' oscillations start to lag behind the fields because they can no longer rotate swiftly enough. The material's dipoles are completely unable to keep up with the external field as the frequency increases. This causes the dipolar polarisation to rapidly diminish, which in turn causes the dielectric permittivity value to decrease. The dielectric loss variation of the current samples at various temperatures for constant audio frequencies is depicted in Fig. 9 through graphs. All of these samples experience an increase in dielectric loss with temperature; however, the rate of increase varies depending on the audio frequency. We observe that the ε′′ of silver halide doped samples increased as compared to the parent elemental selenium. However, the graph also shows that Se95(AgI)5 has a minimum increase in dielectric loss. This behavior could be the result of alloy structural orientations changing with temperature, which would reduce the amount of energy dissipated through the material. It is noteworthy that the dielectric loss behavior in these glass-ceramic alloys exhibits complexity and depends on various parameters, such as composition, and external factors (i.e., temperature, and applied frequency). Hence, a comprehensive analysis is necessary to comprehend the fundamental mechanisms that control the ε′′ in these materials. The decrease in the number of defect states in the band gap close to the Fermi level is responsible for the decrease in dielectric loss as the silver halides are incorporated.34–36
δ, plays a role in computing the dielectric constant. In this context, ε′ stands for the real component of the dielectric constant. The variation of ε′ with temperature for prepared elemental glassy Selenium and multicomponent Se95(AgX)5 (X = Cl, Br, and I) chalcogenide glasses are depicted in Fig. 7. This shows that the ε′ increases with the applied temperature in the studied frequency range. However, the rate of increment is different for different audio frequencies. The observed phenomenon can be explained by the connection between the thermal movement of molecules, which make up the amorphous structural material, and dipolar polarisation. Because there is a lack of the necessary thermal energy to offset molecular interaction, dipoles are primarily frozen at lower temperatures. Nonetheless, the thermal energy of dipoles rises together with the system temperature. This facilitates the dipoles to orient themselves by lessening the impact of molecular interaction. In turn, this raises the dielectric constant and polarisation overall. Numerous research teams have documented this behavior in their articles.30–33 It can also be noticed that the value of ε′ increases with silver halide doping. A dielectric dispersion has been noticed at room temperature. The plots in Fig. 8 depict the correlation between the dielectric constant and frequency for various multicomponent chalcogenide alloys that have been prepared. It is noticeable that as the frequency increases at various temperatures, the ε′ shows a downward trend. Dimerization of dipolar polarization is responsible for the observed decrease in ε′ values across all compositions with increasing frequency of the applied external electric field. This occurs when the dipoles' oscillations start to lag behind the fields because they can no longer rotate swiftly enough. The material's dipoles are completely unable to keep up with the external field as the frequency increases. This causes the dipolar polarisation to rapidly diminish, which in turn causes the dielectric permittivity value to decrease. The dielectric loss variation of the current samples at various temperatures for constant audio frequencies is depicted in Fig. 9 through graphs. All of these samples experience an increase in dielectric loss with temperature; however, the rate of increase varies depending on the audio frequency. We observe that the ε′′ of silver halide doped samples increased as compared to the parent elemental selenium. However, the graph also shows that Se95(AgI)5 has a minimum increase in dielectric loss. This behavior could be the result of alloy structural orientations changing with temperature, which would reduce the amount of energy dissipated through the material. It is noteworthy that the dielectric loss behavior in these glass-ceramic alloys exhibits complexity and depends on various parameters, such as composition, and external factors (i.e., temperature, and applied frequency). Hence, a comprehensive analysis is necessary to comprehend the fundamental mechanisms that control the ε′′ in these materials. The decrease in the number of defect states in the band gap close to the Fermi level is responsible for the decrease in dielectric loss as the silver halides are incorporated.34–36
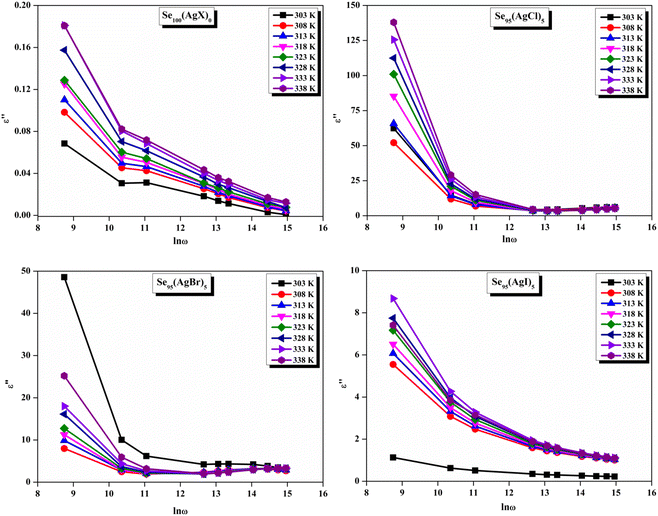
In other words, this reduction in dielectric loss is caused by a decrease in the number of charge carriers hopping within the defect states. Similar results were reported by other research group.37 As illustrated in Fig. 10, on the other hand, a drop in the value of ε′′ is observed to occur in tandem with an increase in the external field's frequency.
The CBH model describes the conduction mechanism in such substances, which further helps to explain the variation in dielectric loss with frequency.20,29,38 According to this paradigm, charge carriers bounce from a donor state to an acceptor state, allowing them to travel between localized sites. When an electron and a hole recombine, they form donor and acceptor sites. Each resulting pair of these sites constitutes a dipole, which exhibits susceptibility to frequency modulation by an external electric field. The energy of the barrier potential that the charge carriers must cross determines the relaxation time of each dipole. Due to the coulombic contact between adjacent sites that form a dipole, this potential barrier is created. This model states that conduction, dipole, and vibration losses are the three distinct mechanisms that give rise to dielectric relaxation.39
A close inspection of Fig. 7–10 reveals that the dielectric loss is minimal at all temperatures/frequencies in the case of the doping of AgI as compared to AgCl and AgBr. Numerous studies have elucidated the impact of AgI incorporation on augmenting the optical and electrical properties of various chalcogenide glasses.40–42 The Ag+ ionic mobility and the subsequent relaxation process account for the majority of the measured overall dielectric response. The remainder, or the localized defect relaxation, is most likely brought about by the host matrix's polarizability, which includes a highly polarizable I− anionic contribution that gets stronger when silver iodide is added to the structure as compared to silver chloride and silver bromide. This probably happened due to the higher polarizability of iodine than that of chlorine and bromine.
Fig. 11 presents straight-line fit plots of ln![[thin space (1/6-em)]](https://www.rsc.org/images/entities/char_2009.gif) ε′′ versus ln
ε′′ versus ln![[thin space (1/6-em)]](https://www.rsc.org/images/entities/char_2009.gif) ω for the present variety of amorphous alloys. Since all of the plots in this figure are straight lines with strong correlation coefficients, it sounds likely that a power law may adequately characterize the correlation between lnε′′ and lnω.24 Using eqn (2) and the tangent of these straight lines, the values of the power law exponent (m) have been determined. In the silver iodide doped sample, at the higher frequency, there is the conversion of lnε′′ values. The power law relationship between lnε′′ and lnω can be used to understand how the dielectric characteristics of various substances behave over a range of frequencies because it is an inherent feature of many of them. These findings suggest that the doping of silver halides significantly influences the temperature-dependent variation of dielectric parameters. The change in m against temperature is shown in Fig. 12. The linear dependence of these graphs on temperature agrees with relation (4), supporting the relevance of Guintini's hypothesis.18 The behavior of the dielectric characteristics of the amorphous selenium silver halide alloys is adequately explained by this theory. A popular idea to describe how materials behave dielectrically at different frequencies is called Guintini's theory. It suggests that the motion of charged particles in an electric field is connected to a material's polarisation response. In essence, these plots support the relevance of Guintini's theory. Therefore, the linear dependency of the m-scale magnitudes on temperature follows the relation outlined by eqn (4), aiding in comprehending the dielectric behavior of sample alloys. The temperature dependency of AC conductivity has been evaluated for all the prepared samples. Fig. 13 depicts the variation of lnσac against 1000/T for parent elemental selenium and silver halide doped chalcogenide samples. The plot of lnσac against 1000/T for all samples form a straight line, suggesting a thermally activated process for AC conduction. The diagrams indicate that the AC conductivity's reliance on temperature adheres to the Arrhenius equation:
ω for the present variety of amorphous alloys. Since all of the plots in this figure are straight lines with strong correlation coefficients, it sounds likely that a power law may adequately characterize the correlation between lnε′′ and lnω.24 Using eqn (2) and the tangent of these straight lines, the values of the power law exponent (m) have been determined. In the silver iodide doped sample, at the higher frequency, there is the conversion of lnε′′ values. The power law relationship between lnε′′ and lnω can be used to understand how the dielectric characteristics of various substances behave over a range of frequencies because it is an inherent feature of many of them. These findings suggest that the doping of silver halides significantly influences the temperature-dependent variation of dielectric parameters. The change in m against temperature is shown in Fig. 12. The linear dependence of these graphs on temperature agrees with relation (4), supporting the relevance of Guintini's hypothesis.18 The behavior of the dielectric characteristics of the amorphous selenium silver halide alloys is adequately explained by this theory. A popular idea to describe how materials behave dielectrically at different frequencies is called Guintini's theory. It suggests that the motion of charged particles in an electric field is connected to a material's polarisation response. In essence, these plots support the relevance of Guintini's theory. Therefore, the linear dependency of the m-scale magnitudes on temperature follows the relation outlined by eqn (4), aiding in comprehending the dielectric behavior of sample alloys. The temperature dependency of AC conductivity has been evaluated for all the prepared samples. Fig. 13 depicts the variation of lnσac against 1000/T for parent elemental selenium and silver halide doped chalcogenide samples. The plot of lnσac against 1000/T for all samples form a straight line, suggesting a thermally activated process for AC conduction. The diagrams indicate that the AC conductivity's reliance on temperature adheres to the Arrhenius equation:
 | (15) |
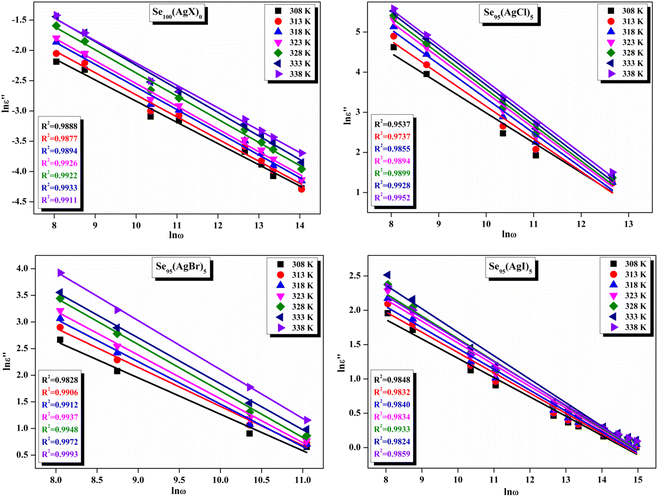 | ||
Fig. 11 The linear-fitted graph between the natural logarithm of dielectric loss (ln![[thin space (1/6-em)]](https://www.rsc.org/images/entities/char_2009.gif) ε′′) and the natural logarithm of angular frequency (ln ε′′) and the natural logarithm of angular frequency (ln![[thin space (1/6-em)]](https://www.rsc.org/images/entities/char_2009.gif) ω) for the current samples. ω) for the current samples. | ||
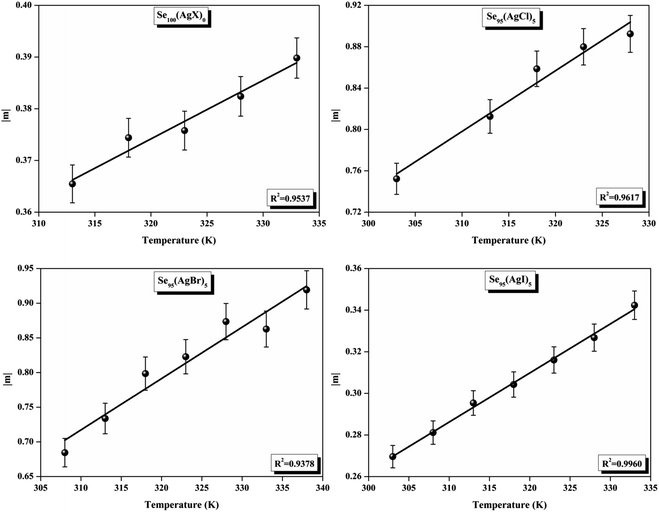 | ||
| Fig. 12 Linear fitted plots of frequency exponent m against temperature T (K) for the present samples. | ||
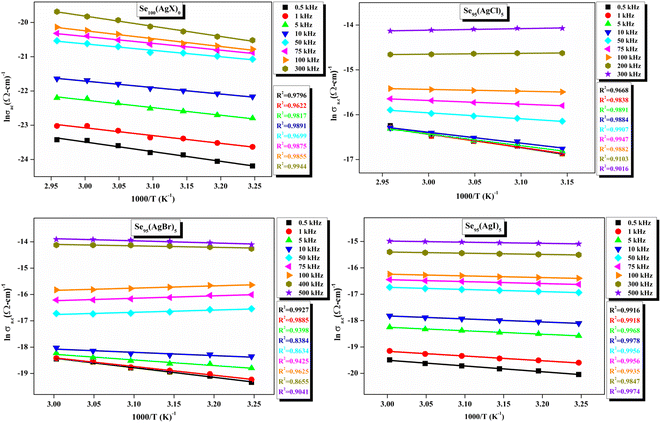 | ||
| Fig. 13 Linear-fitted Arrhenius temperature dependency of ac conductivity (σac) at various audio frequencies. | ||
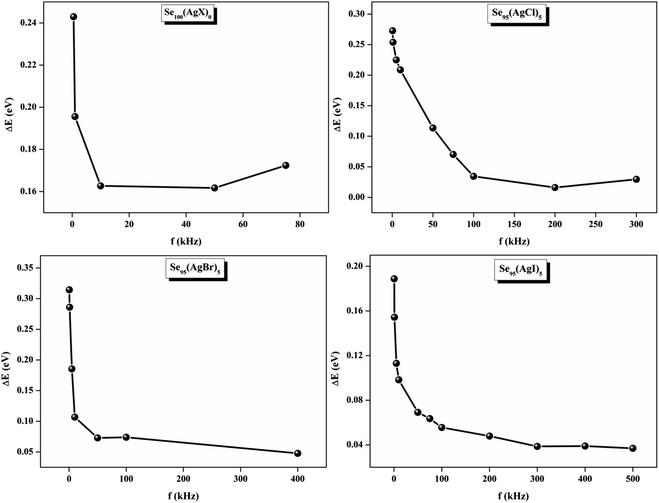
At higher frequencies, it can be observed that in the silver halide-doped samples conductivity became almost independent of the temperature. The correlation between electrical conductivity and temperature suggests a conduction behavior where electrons hop, activated by heat.43 Fig. 14 presents the frequency-dependent ΔEac for all the prepared materials. It shows that when frequency rises, activation energy decreases. While the observed pattern is nearly constant across all compositions, the values vary according to frequency. The activation energy, which represents the energy needed for charge carriers to move through the material, gets smaller as frequency increases. This implies that charge carriers will travel more easily at higher frequencies. This phenomenon is linked to localized states that trap and release charge carriers. At lower frequencies, these states can impede carrier motion and increase activation energy due to prolonged interaction time. Lower activation energy and freer carrier movement are made possible at higher frequencies by shorter contact times. Beyond a particular frequency, the activation energy stabilizes, suggesting that the higher frequencies have less of an impact from localized states. This behavior is consistent with the frequency-dependent dielectric constant and is typical of disordered materials. Essentially, the patterns seen in Fig. 15 and other compositions emphasize that activation energy possesses a frequency dependence that is a crucial characteristic of disordered materials.29,44 The experiments propose a correlation between the activation energy of thermally activated AC conduction and its corresponding pre-factors:
 | (16) |
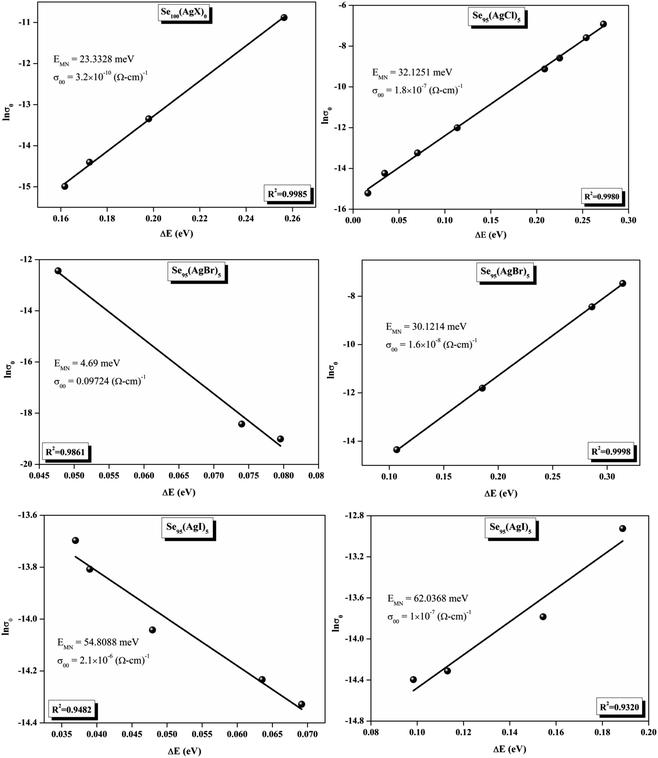
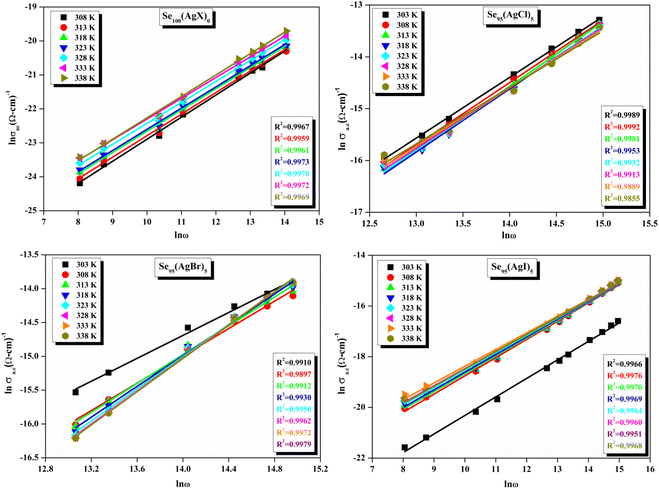
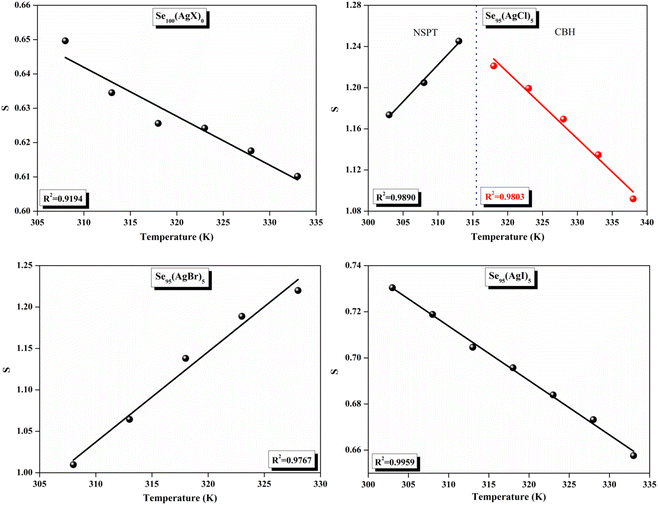
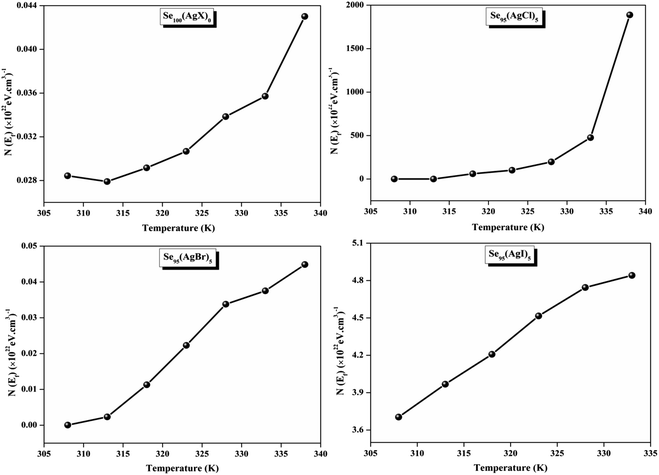
The relationship between the activation energy (ΔE) and AC conductivity, which is known as the Meyer–Neldel empirical rule,45 and the pre-factor σ0 is depicted in eqn (16). The term EMN is referred to as Meyer–Neldel energy. The Meyer–Neldel Rule (MNR), an established principle in the domain of materials science, finds application across diverse substances, notably chalcogenide glasses,46 and various semiconductor classifications. Through the utilization of the gradients inherent in these linear representations, the determination of the activation energy values (EMN) was achieved via linear regression analysis of the plotted data, as demonstrated in Fig. 15. Based on the graphs, it's observed that the value of EMN shows significant changes after silver halide doping in g-Se. We observed that the parent and sample doped with silver chloride followed the MNR rule, whereas the remaining samples followed MNR and reverse MNR in different regions of activation energy corresponding to AC conductivity. A rise in activation energy in the standard MNR is correlated with a boost in the pre-exponential factor. On the other hand, a drop in the pre-exponential component would be associated with an upsurge in activation energy in a reverse MNR trend. The detection of both MNR and reverse MNR trends in the samples doped with silver bromide and silver iodide may be the result of microstructure variations and accompanying shifts in the effective density of state distributions. However, interpreting these trends requires a deep understanding of the material's properties and the specific processes contributing to its behavior. Therefore, further investigation would be needed to determine the exact cause of these trends. Fig. 16 illustrates how the AC conductivity varies with frequency. The straight lines fitting that the least-squares fitting method produced is depicted in the graph by solid lines. As inferred from Fig. 16, within a temperature range of 303–338 K, the AC conductivity shows an upward trend with the rise in frequency. In disordered materials, there are often areas known as localized states. These are regions where, due to the disorder in the material's structure, charge carriers can become temporarily trapped. When an alternating current (AC) is applied to the material, it causes these charge carriers (D+ and D−) to hop in and out of these localized states. This hopping process contributes to the overall conductivity of the material. As the frequency of the σac increases, each cycle of the current is shorter. Charge carriers will therefore have fewer opportunities to get stuck in these localised states. Rather, they are more probable to aid in the material's ability to conduct current. Consequently, we see a boost in AC conductivity at higher frequencies. This is because more charge carriers are involved in conducting current rather than being trapped in localized states. This phenomenon is common in disordered materials and is a key factor in understanding their electrical properties. It is also important in the design and application of devices that use these materials. The frequency exponent s described in eqn (5) is calculated by slopes of straight lines. Fig. 17 displays the temperature variation of s for each sample. Fig. 17 makes it evident that for both the parent Se and the Se95(AgI)5 sample, the frequency exponents fall as the temperature rises, suggesting that the CBH model may be used to describe the conducting mechanisms in both cases.20 Hopping conduction phenomena are typically characterized by the value of the exponent s, which is in the range of 0 and 1.47,48 The energy barriers dividing localized states get thinner as temperature increases. As a result, conductivity may increase and the frequency exponent “s” may decrease. On the other hand, for Se95(AgCl)5 and Se95(AgBr)5 story looks different. For the Se95(AgCl)5 sample, the value of s increases first in the temperature range from 303 K to 313 K, and then s decreases in the temperature range 318 K to 338 K. In the first region, the NSPT model is an appropriate model for the conductivity whereas the modified CBH model best explains the conductivity in the second region. For the Se95(AgBr)5 sample, there is a rise in the value of s throughout the temperature range. The NSPT model could account for the conduction mechanism.49 In addition, we computed the density of defect states using the models that were used. Plots from Fig. 18 show that the density of localized states N(Ef) in all samples increases with temperature. The value of N(Ef) increases insignificantly, moderately, and drastically when we add AgBr, AgI, and AgCl in parent selenium glass respectively.34–36 Table 1 contains the resulting values of hopping length and density of localized states at temperature 308 K.
| Sample | Rω (Å) | N(Ef) (eV cm3)−1 |
|---|---|---|
| Se100(AgX)0 | 14.9 | 2.8 × 10²⁰ |
| Se95(AgCl)5 | 97.6 | 5.4 × 10²³ |
| Se95(AgBr)5 | 2049.2 | 4.0 × 10¹⁷ |
| Se95(AgI)5 | 5.8 | 3.7 × 10²³ |
To maximize the dielectric characteristics of multi-component ChGs including silver, such as low dielectric loss and a high dielectric constant, researchers have spent the last thirty-four years examining the dielectric behavior of these compounds with binary, ternary, and quaternary compositions. We have contrasted the ε′ and ε′′ values of the current samples with those of such multi-component ChGs.2,33,50–55 Table 2 tabulates the comparative analysis of these data. This table reveals that, in comparison to previous silver-containing multi-component ChGs published in the literature, the current system incorporating silver halide optimizes the dielectric properties better. Notably, the silver iodide-doped sample exhibits the best results.
| S. No. | Composition | ε′ | ε′′ | Reference |
|---|---|---|---|---|
| 1 | Se70Te28Ag2 | 742 | 936 | 50 |
| Se70Te26Ag4 | 806 | 810 | ||
| Se70Te24Ag6 | 704 | 1060 | ||
| Se70Te22Ag8 | 134 | 242 | ||
| Se70Te20Ag10 | 1085 | 325 | ||
| 3 | Se76Te20Sn2Ag2 | 62.2 | 895.4 | 51 |
| Se74Te20Sn2Ag4 | 91.9 | 1746.9 | ||
| Se72Te20Sn2Ag6 | 47.6 | 185.7 | ||
| 4 | Se98Ag2 | 6.85 | 0.9 | 52 |
| Se96Ag2In2 | 12.8 | 1.7 | ||
| Se94Ag2In4 | 9.5 | 0.66 | ||
| Se92Ag2In6 | 6.35 | 0.27 | ||
| 5 | Se75Ge20Ag5 | 21.5 | 2.5 | 53 |
| 6 | Se65Te20Ag15 | 30.5 | — | 54 |
| 7 | Se92Te4Ag4 | 45 | 25 | 55 |
| Se88Te4Ag8 | 23 | 14 | ||
| Se84Te4Ag12 | 20 | 10 | ||
| Se80Te4Ag16 | 17 | 8 | ||
| 10 | Se100(AgX)0 | 8.47 | 5.6 | Present work |
| Se95(AgCl)5 | 25.9 | 31.9 | ||
| Se95(AgBr)5 | 16.21 | 7.9 | ||
| Se95(AgI)5 | 17.58 | 5.5 |
6. Conclusions
This study investigates the AC conductivity and dielectric relaxation processes in newly developed chalcogenide semiconductors doped with silver halides (AgX, where X = Cl, Br, I) over a wide range of frequencies and temperatures. The observed changes in the dielectric constant (ε′) and dielectric loss (ε′′) are attributed to dipolar and electronic polarization, which are influenced by structural modifications within the material. Doping with AgX significantly enhances the dielectric properties, with an increase in defect state density[N(Ef)] explaining the variations in ε′ and ε′′. The samples exhibit AC conductivity dispersion consistent with Jonscher's universal power law. The Meyer–Neldel (MN) rule effectively explains the AC conductivity data. The results indicate that thermally stable silver halide-doped glass ceramics can be produced, with silver iodide providing the optimal balance of dielectric constant and loss, followed by silver chloride and silver bromide. These AgX-doped selenium glass ceramics demonstrate superior dielectric performance compared to other silver-containing chalcogenide glasses studied by different research groups. The incorporation of AgX enhances the electrical properties of chalcogenide materials, making them suitable for various solid state device applications.Author contributions
Anil Kumar, and Vishnu Saraswat: plotting graphs, wrote-original draft; A. Dahshan and H. I. Elsaeedy: wrote a revised version of the manuscript; N. Mehta: formal analysis, conceptualization, wrote-final draft.Conflicts of interest
There are no conflicts to declare.Acknowledgements
The authors extend their appreciation to the Deanship of Research and Graduate Studies at King Khalid University for funding this work through Large Research Project under grant number RGP2/160/45.References
- J. Chalker, R. Hu and J. Pyun, Introduction to Chalcogen-containing polymers, Polym. Chem., 2023, 14, 4252–4254 RSC.
- R. Woods-Robinson, Y. Han, H. Zhang, T. Ablekim, I. Khan, K. Persson and A. Zakutayev, Wide band gap chalcogenide semiconductors, Chem. Rev., 2020, 120, 4007–4055 CrossRef CAS PubMed.
- M. Frumar and W. Tomas, Ag doped chalcogenide glasses and their applications, Curr. Opin. Solid State Mater. Sci., 2003, 7, 117–126 CrossRef CAS.
- M. Bokova, S. Dumortier, C. Poupin, R. Cousin, M. Kassem and E. Bychkov, Potentiometric Chemical Sensors Based on Metal Halide Doped Chalcogenide Glasses for Sodium Detection, Sensors, 2022, 22, 9986 CrossRef CAS PubMed.
- S. Ojha, M. Roy, A. Chamuah, K. Bhattacharya and S. Bhattacharya, Transport phenomena of Cu–S–Te chalcogenide nanocomposites: frequency response and AC conductivity, Phys. Chem. Chem. Phys., 2020, 22, 24600–24613 RSC.
- J. Koaib, N. Bouguila, H. Abassi, N. Moutia, M. Kraini, A. Timoumi, C. Vázquez-Vázquez, K. Khirouni and S. Alayaet, Dielectric and electrical properties of annealed ZnS thin films, The appearance of the OLPT conduction mechanism in chalcogenides, RSC Adv., 2020, 10, 9549–9562 RSC.
- N. Chandel, M. M. Imran and N. Mehta, Comprehensive studies of temperature and frequency dependent dielectric and ac conducting parameters in third generation multi-component glasses, RSC Adv., 2018, 8, 25468–25479 RSC.
- A. M. Al-syadi, M. M. El-Desoky and M. S. Al-Assiri, Impedance spectroscopy of V2O5–Bi2O3–BaTiO3 glass–ceramics, Solid State Sci., 2013, 26, 72–82 CrossRef CAS.
- P. Priyadarshini, S. Das and R. Naik, A review on metal-doped chalcogenide films and their effect on various optoelectronic properties for different applications, RSC Adv., 2005, 12, 9599–9620 RSC.
- A. Feraru, Z. Tóth, K. Magyari, Z. Pap, M. Todea, M. Muresan-Pop, D. Vodnar, E. Licarete, K. Hernádi and L. Baia, Composites based on silicate bioactive glasses and silver iodide microcrystals for tissue engineering applications, J. Non-Cryst. Solids, 2020, 547, 120293 CrossRef CAS.
- M. I. Sayyed, M. A. Abdo, H. Ali and M. Sadeq, Transparent and radiation shielding effective Na2O–CrO3 borate glasses via AgI additives, Ceram. Int., 2022, 48, 30817–30825 CrossRef CAS.
- D. V. Marasanov, E. M. Sgibnev and N. V. Nikonorov, Photocatalytic properties of Ag-AgBr nanostructures in ion-exchanged layers of bromide sodium-zinc-aluminosilicate glass matrix, Sci. Tech. J. Inf. Technol., Mech. Opt., 2022, 22, 509–516 Search PubMed.
- M. Bokova, S. Dumortier, C. Poupin, R. Cousin, M. Kassem and E. Bychkov, Potentiometric chemical sensors based on metal halide doped chalcogenide glasses for sodium detection, Sensors, 2022, 22, 9986 CrossRef CAS PubMed.
- R. Zaiter, M. Kassem, D. Fontanari, A. Sokolov, T. Usuki, M. Bokova, A. Hannon, C. Benmore, F. Cousin, I. Ozheredov and E. Bychkov, Unexpected role of metal halides in a chalcogenide glass network, Mater. Des., 2022, 216, 110547 CrossRef CAS.
- V. Saraswat, S. Pal, N. Mehta, A. Kumar and M. Imran, Thermal analysis of novel third-generation phase-change materials with zinc as a chemical modifier, RSC Adv., 2023, 13, 3602–3611 RSC.
- M. A. R. Fresneda, J. D. Martín, J. G. Bolívar, M. Cantos, G. Bosch-Estévez, M. Moreno and M. Merroun, Green synthesis and biotransformation of amorphous Se nanospheres to trigonal 1D Se nanostructures: impact on Se mobility within the concept of radioactive waste disposal, Environ. Sci.: Nano, 2018, 5, 2103–2116 RSC.
- M. D. Senthamarai and M. R. Rajan, Comparative Study of Green and Chemical Synthesized Selenium Nanoparticles and Its Antibacterial Assay Against Fish Pathogens, J. Nanosci. Nanotechnol., 2023, 9, 981–985 Search PubMed.
- J. C. Giuntini, J. V. Zanchetta, D. Jullien, R. Eholie and P. Houenou, Temperature dependence of dielectric losses in chalcogenide glasses, J. Non-Cryst. Solids, 1981, 45, 57–62 CrossRef CAS.
- M. Jebli, C. Rayssi, J. Dhahri, M. Ben Henda, H. Belmabrouk and A. Bajahzar, Structural and morphological studies, and temperature/frequency dependence of electrical conductivity of Ba0.97La0.02Ti1−xNb4x/5O3perovskite ceramics, RSC Adv., 2021, 11, 23664–23678 RSC.
- G. E. Pike, AC conductivity of scandium oxide and a new hopping model for conductivity, Phys. Rev. B, 1972, 6, 1572–1580 CrossRef CAS.
- N. Chakchouk, K. Karoui, N. Drissi, F. Jomni and A. Ben Rhaiem, An investigation of structural, thermal, and electrical conductivity properties for understanding transport mechanisms of CuWO4 and α-CuMoO4 compounds, RSC Adv., 2024, 14, 46–58 RSC.
- F. Missaoui, K. Trablsi, K. Moufida, A. Ateş, A. Mahmoud, F. Boschini and A. B. Rhaiem, Structural, dielectric and transport properties of NaxFe1/2Mn1/2O2 (x = 1 and 2/3), RSC Adv., 2023, 13, 17923–17934 RSC.
- S. R. Elliott, Temperature dependence of a.c. conductivity of chalcogenide glasses, Philos. Mag. B, 1978, 37, 553–560 CAS.
- A. K. Jonscher, The ‘universal’ dielectric response, nature, 1977, 267, 673–679 CrossRef CAS.
- S. R. Elliott, A theory of ac conduction in chalcogenide glasses, Philos. Mag. Lett., 1977, 36, 1291–1304 CrossRef CAS.
- N. F. Mott, Conduction in non-crystalline materials: III. Localized states in a pseudogap and near extremities of conduction and valence bands, Philos. Mag. Lett., 1969, 19, 835–852 CrossRef CAS.
- D. Biswas, L. Singh and A. Das, An investigation of S–Se–Te semiconducting glassy alloys: structural characterization and electrical conductivity, J. Non-Cryst. Solids, 2019, 510, 101–111 CrossRef CAS.
- L. Li, J. Cheng, Y. Cheng, T. Han, Y. Liu, Y. Zhou, Z. Han, G. Zhao, Y. Zhao, C. Xiong, L. Dong and Q. Wang, Significantly enhancing the dielectric constant and breakdown strength of linear dielectric polymers by utilizing ultralow loadings of nanofillers, J. Mater. Chem. A, 2021, 9, 23028–23036 RSC.
- V. Saraswat, S. K. Pal, A. Dahshan and N. Mehta, Comprehensive studies of dielectric behaviour, resistive switching, and AC conduction in zinc-containing quaternary glasses of Se-Te-Sn, J. Non-Cryst. Solids, 2023, 617, 122487 CrossRef CAS.
- M. B. Bechir and F. Alresheedi, Interpretation of dielectric behavior and polaron hopping in lead-free antimony-based double perovskite, RSC Adv., 2023, 13, 34703–34714 RSC.
- A. Sharma and N. Mehta, Study of dielectric relaxation and thermally activated a.c. conduction in lead containing topological glassy semiconductors, RSC Adv., 2017, 7, 19085–19097 RSC.
- A. Sharma, N. Mehta and A. Kumar, Dielectric relaxation in Se80-xTe20Snx chalcogenide glasses, J. Mater. Sci., 2011, 46, 4509–4516 CrossRef CAS.
- L. Zhu, Exploring strategies for high dielectric constant and low loss polymer dielectrics, J. Phys. Chem. Lett., 2014, 5, 3677–3687 CrossRef CAS PubMed.
- J. Sharma and S. Kumar, Composition dependent of dielectric properties in Se100− xSnx glassy alloys, J. Alloys Compd., 2010, 506, 710–714 CrossRef CAS.
- J. Sharma and S. Kumar, Effect of impurity (Sb and Ag) incorporation on the ac conductivity and dielectric properties of a-Se70Te30 glassy alloy, Phys. B, 2012, 407, 457–463 CrossRef CAS.
- A. Ali, W. Shah, Z. Ullah, S. Malik, M. Rauf, S. Askar, N. Imran and H. Ahma, Narrowing of band gap and decrease in dielectric loss in La1-xSrxMnO3 for x = 0.0, 0.1, and 0.2 manganite nanoparticles, Front. Mater., 2024, 11, 1369122 CrossRef.
- N. Goyal, A. Zolanvari and S. K. Tripathi, Effect of silver dissolution on electrical properties of As2S3, J. Mater. Sci.: Mater. Electron., 2001, 12, 523–526 CrossRef CAS.
- A. Srivastava and N. Mehta, Enhancement of polaron-hopping-based AC conduction in semiconducting STS (Se-Te-Sn) glass by silver incorporation, Dalton Trans., 2018, 47, 10187–10194 RSC.
- J. O. Isard, A study of the migration loss in glass and a generalized method of calculating the rise of dielectric loss with temperature, Proc. IEE-Part B: Electron. Commun. Engin., 1962, 109, 440–447 Search PubMed.
- T. Petkova, B. Monchev, O. Kostadinova, P. Petkov and S. Yannopoulos, Vibrational modes and structure of (AgI)x(GeS1.5)100−x chalcohalide glasses, J. Non-Cryst. Solids, 2009, 355, 2063–2067 CrossRef CAS.
- S. Cui, D. Coq, C. Boussard-Pledel and B. Bureau, Electrical and optical investigations in Te–Ge–Ag and Te–Ge–AgI chalcogenide glasses, J. Alloys Compd., 2015, 639, 173–179 CrossRef CAS.
- S. Ding, Z. Liu, S. Dai, C. Liu and Z. Cao, Novel acousto-optic material based on Ge-Te-AgI chalcohalide glasses, Ceram. Int., 2021, 47, 12072–12077 CrossRef CAS.
- R. K. Tripathi, O. S. Panwar, I. Rawal, C. K. Dixit, A. Verma, P. Chaudhary, A. K. Srivastava and B. C. Yadav, Study of variable range hopping conduction mechanism in nanocrystalline carbon thin films deposited by modified anodic jet carbon arc technique: application to light-dependent resistors, J. Mater. Sci.: Mater. Electron., 2021, 32, 2535–2546 CrossRef CAS.
- S. K. Ghosh, V. Perla and K. Mallick, The electrical behaviour of ultrafine bismuth phosphate particles under a range of temperature and frequency conditions, Dalton Trans., 2022, 51, 5635–5644 RSC.
- W. V. Meyer and H. Neldel, Relation between the energy constant and the quantity constant in the conductivity–temperature formula of oxide semiconductors, Z. Phys., 1937, 18, 588–593 CAS.
- S. Pal, N. Mehta, V. Mikla and A. Horvat, Invariance of Meyer-Neldel compensation rule in thermally activated dc and ac conduction for as-prepared and aged glassy Selenium and As2Se3 glass, Solid State Sci., 2021, 117, 10661 CrossRef.
- A. Ladhar, M. Arous, H. Kaddami, M. Raihane, A. Kallel, M. Graça and L. Costa, AC and DC electrical conductivity in natural rubber/nanofibrillated cellulose nanocomposites, J. Mol. Liq., 2015, 209, 272–279 CrossRef CAS.
- A. Radon, D. Lukowiec, M. Kremzer, J. Mikula and P. Wlodarczyk, Electrical conduction mechanism and dielectric properties of spherical shaped Fe3O4 nanoparticles synthesized by co-precipitation method, Mater, 2018, 11, 735 CrossRef PubMed.
- A. E. Bekheet and N. A. Hegab, Ac conductivity and dielectric properties of Ge20Se75In5 films, Vacuum, 2008, 83, 391–396 CrossRef CAS.
- N. Choudhary and A. Kumar, Dielectric relaxation in glassy Se70Te30-xAgx, Indian J. Pure Appl. Phys., 2006, 44, 62–65 CAS.
- A. Srivastava and N. Mehta, Investigation of some thermo-mechanical and dielectric properties in multi-component chalcogenide glasses of Se–Te–Sn–Ag quaternary system, J. Alloys Compd., 2016, 658, 533–542 CrossRef CAS.
- C. Dohare and N. Mehta, Thermal transport, thermomechanical, and dielectric properties of chalcogenide Se98–x Ag2Inx (x = 0, 2, 4, 6) system, Can. J. Phys., 2014, 92, 648–653 CrossRef CAS.
- A. Dwivedi, R. Arora, N. Mehta, N. Choudhary and A. Kumar, Dielectric relaxation in Se80Ge20 and Se75Ge20Ag5 chalcogenide glasses, Semicond. Phys., Quantum Electron. Optoelectron., 2005, 8, 45–49 CrossRef CAS.
- N. Mehta, D. Sharma and A. Kumar, Effect of Ag additive on the photoelectric and dielectric properties of Se-Te alloys, Phys. B, 2007, 391, 108–112 CrossRef CAS.
- S. Kumar, M. Husain and M. Zulfequar, Effect of silver on dielectric properties of the Se-Te system, Phys. B, 2006, 371, 193–198 CrossRef CAS.
| This journal is © The Royal Society of Chemistry 2024 |

