 Open Access Article
Tannin-assisted interfacial polymerization towards COF membranes for efficient dye separation†
Weishan Deng‡
,
Zezhen Zhang‡,
Lulu Liu,
Zekun Zhou and
Lili Wu *
*
School of Materials Science and Engineering, Wuhan University of Technology, Wuhan 430070, China. E-mail: polym_wl@whut.edu.cn
First published on 20th May 2024
Abstract
Membrane separation has been shown to have significant potential in addressing the global shortage of clean water. Covalent organic frameworks (COFs) have gained significant attention in the field of membrane separation due to their structural stability and controllable pore size. Here, a modification of polyethersulfone ultrafiltration membranes with TA-assisted COFs is prepared by interfacial polymerization and co-deposition. Intriguingly, in comparison to the conventional COF synthesis method, the interfacial polymerization reaction used n-butanol as the oil-phase monomer to prevent substrate corrosion. More importantly, the TA-assisted co-deposition not only introduces a large number of environmentally friendly hydrophilic groups to enhance the hydrophilicity of the membrane surface, but also the phenolic hydroxyl group contained in TA generates a quinone group upon oxidation. This group can undergo a Michael addition reaction with the amine group, followed by interfacial polymerization to regulate the COFs pore size. Consequently, the optimized membrane exhibited a high permeation flux of 122.03 L m−2 h−1 bar−1 without altering the pore size structure of the original membranes and demonstrated separation performance for various dyes (Mw: 300–1300 g mol−1), with a retention rate of over 98%. Despite multiple filtrations of methyl blue dye, the membrane prepared by simple rinsing still exhibited high retention rates (>98%) with exceptional stability and retention performance. The optimized membrane demonstrated good hydrophilicity and dye separation performance, indicated promising potential for dye separation applications.
Introduction
Currently, the global scarcity of clean water resources presents a significant challenge in our living environment due to water pollution and reuse challenges. Membrane technology, compared to other separation methods, not only minimises wastewater discharge but also conserves water resources and reduces production costs. An effective means to achieve wastewater resources and reuse is the use of membrane technology to treat wastewater. Membrane separation has several advantages such as low energy consumption, ease of operation, and environmental friendliness. This makes it significant in reducing environmental pollution, saving water resources, and promoting sustainable development in the industry. The method is cost-effective and environmentally friendly for treating wastewater. Researchers aim to develop membrane materials with precise molecular separation and stable physicochemical properties. These materials have numerous advantages, such as exceptional separation properties and high selectivity, which make them suitable for various applications in different fields.Covalent organic frameworks (COFs) are ordered and porous crystalline materials with various advantages such as tailorable structure and function, low backbone density and high porosity, crystallinity and stability.1,2 By choosing different building blocks and synthesis conditions, COFs can exhibit distinct structures and properties, and the pore size of COFs-based membranes can be adjusted to separate molecules based on their size. There have been some studies reporting the synthesis of imine-linked COF at the water/organic interface for dye separation by Mariñas et al.3 and Banerjee et al.4 COFs have attracted attention from researchers in many fields due to their unique characteristics, including gas storage, catalysis, chemical sensing, optoelectronics and energy storage.5 However, in the process of interface synthesis, corrosive solvents such as trimethylbenzene, 1,4-dioxane, and dichloromethane are commonly used,6 which limits their application on most polymer substrates. There are still many challenges, such as how to efficiently and scalably produce COF membranes, as well as how to solve the adhesion problem between the COF layer and the substrate.
Polyphenols are frequently employed in surface engineering due to their catechol structure, which can be oxidized to quinone under alkaline conditions. This oxidation process has the potential to facilitate chemical reactions and membrane functionalization.7 However, the high cost of dopamine (DA), which is the most studied polyphenol, hinders the large-scale practical application of nanofiltration membranes.8 It is crucial to prepare nanofiltration membranes with low cost and excellent dye/salt separation performance. Tannic acid (TA), a cheap polyphenol found in plants, can be used for the synthesis and modification of membranes. The chemical can serve as a monomer for IP, an additive for non-solvent induced phase separation (NIPS), and a modifier for the base membrane. The catechol structure and amino radical can undergo Michael addition/Schiff base reaction in alkaline aqueous solution under harsh conditions such as ultraviolet light.9–11 The attachment of TA to the membrane surface enhances its hydrophilicity and provides reactive sites for the attachment of other functional groups. This makes it an effective natural surface modifier.
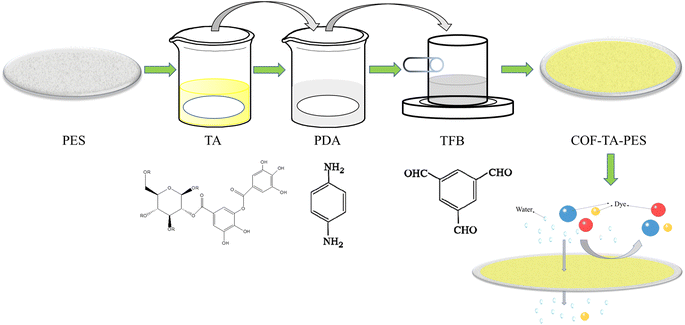
Herein, we fabricated the construction of a stable selective layer on the surface of PES ultrafiltration membranes through TA-assisted interfacial polymerisation co-deposition of COF.
The COF was synthesised by reacting p-phenylenediamine (PDA) and homotrimethylbenzene tris-carboxaldehyde (TFB). The use of TA in the COF synthesis process improved the hydrophilicity of the membrane. To prevent damage to the PES substrate from corrosive solvents like homotrimethylbenzene, 1,4-dioxane, and dichloromethane, n-butanol was selected as the oil-phase monomer for the experiments. At an IP reaction time of COF of 5 minutes, the concentration of PDA was 18 mol L−1, and TFB was 6 mol L−1, the modification resulted in the best membrane performance, with high permeate fluxes and permeation rates for a variety of dyes (Mw. 300–1300 g mol−1). The membrane exhibited stability and maintained good separation performance even after a prolonged period, despite the rejection rate being above 98% (Fig. 1).
Experimental methods
Chemicals and materials
PES ultrafiltration membrane (PES, UF0302, Guochu Technology Co., Ltd); tris(hydroxy-methyl)aminomethane, concentrated hydrochloric acid (HCl), glacial acetic acid were purchased from Sinopharm Chemical Reagent Co. Ltd. Anhydrous ethanol, tannic acid (analytical purity 98%), n-butanol, p-phenylenediamine(PDA), trimellitic anhydride(TFB), alizarin Crimson 8GX (ACB), Coomassie brilliant blue (BBG), methyl orange (MO), rhodamine B (RHB) were purchased from Aladdin Reagents Ltd; methylene blue (MB), congo red (CR), bengal rose red (RB) were purchased from Shanghai Yin Chemical Technology Co. Ltd (as shown in Table 1); deionized water was obtained from a deionized water generator system (RX-108, XINRUI, China). All chemical reagents were analytical grade and can be used without further purification.| Dye | Dye tape | Molecular weight (g mol−1) | Max absorption (nm) |
|---|---|---|---|
| MO | Anionic | 327.33 | 464 |
| RhB | Anionic | 479.01 | 550 |
| CR | Anionic | 696.68 | 498 |
| MB | Cationic | 799.80 | 573 |
| CBB | Anionic | 854.02 | 590 |
| RB | Cationic | 1017.64 | 508 |
| ACB | Cationic | 1298.88 | 620 |
Preparation of COF-TA-PES membrane
![[thin space (1/6-em)]](https://www.rsc.org/images/entities/char_2009.gif) :
:![[thin space (1/6-em)]](https://www.rsc.org/images/entities/char_2009.gif) 1, and the monomer PDA was slightly overdosed, mainly because it was considered that the amine group of part of the PDA would react with the TA on the PES membrane and thus consume part of the monomer12). Subsequently, the TA-PES membranes were immersed in the conFigd PDA monomer solution and removed after 1 min of standing to remove the excess PDA solution from the surface. In the end, it was placed in a homemade single-side modification device and TFB solution was added on the surface, and the membrane was removed after a certain reaction time. The membrane was heat-treated at 60 °C for 5 minutes to cure and enhance the adhesion between the modified layer and the substrate.13 The modified membrane was noted as COF-TA-PES membrane.
1, and the monomer PDA was slightly overdosed, mainly because it was considered that the amine group of part of the PDA would react with the TA on the PES membrane and thus consume part of the monomer12). Subsequently, the TA-PES membranes were immersed in the conFigd PDA monomer solution and removed after 1 min of standing to remove the excess PDA solution from the surface. In the end, it was placed in a homemade single-side modification device and TFB solution was added on the surface, and the membrane was removed after a certain reaction time. The membrane was heat-treated at 60 °C for 5 minutes to cure and enhance the adhesion between the modified layer and the substrate.13 The modified membrane was noted as COF-TA-PES membrane.Characterization and performance
 | (1) |
Permeation and dye separation performance
The membrane permeation and separation performance was tested using a laboratory misaligned cross-flow filtration device (effective membrane area of 18.1 cm2 and diameter of 4.8 cm). The misaligned cross-flow device is shown in Fig. S1.† Various dye solutions (100 ppm) configd in the laboratory were used as the feed solution. Before performing the permeation and retention tests, each membrane was pre-pressed at 3 bar for 30 minutes to achieve a stable permeation flux. Then, it was placed in the laboratory misaligned cross-flow filtration device and tested at room temperature under a pressure of 2 bar. During the experiment, the feed solution was continuously stirred to prevent concentration polarization. Each membrane was tested at least three times to obtain more reasonable data. The concentration of the feed and permeate was tested by UV spectrophotometer (UV, UV-2550, China) and calculated based on the standard curve of the dye. The rejection rate of the dye was calculated according to the following equations:
 | (2) |
Reusability performance and long-term stability
The membrane was filtered for 12 hours in a misaligned crossflow device using methyl blue. Appropriate amounts of permeate were taken out every 30 minutes to test the dye retention rate. It is important to note that all filtration were carried out at a pressure of 2.5 bar and 20 °C.The long-term stability of the membrane will directly affect its practical application. The long-term stability of the membrane was investigated from the permeability and dye retention performance of the nanofiltration membrane during the long-term separation process.14 A cycle is divided into three steps: first, the membrane is pre-pressed at 3 bar for 30 minutes to obtain a stable flux, then placed in a laboratory misaligned cross-flow filtration device, filtered with methyl blue (100 ppm) for 2 hours, then rinsed with deionized water for 30 minutes and repeated several times. The membrane rejection of dye and permeation was evaluated every 30 min during the antifouling test.
Results and discussion
Characterization of modified membrane
Fourier transform infrared spectroscopy (FTIR) can characterize the chemical structure of the pristine and the modified membranes.15 The infrared spectra of the pristine and the modified membranes were shown in Fig. 2. From Fig. 2(a), it can be seen that the PES membrane exhibits typical absorption peaks at 1579 cm−1 and 1487 cm−1, which are mainly related to the stretching vibration of the benzene ring.16 The absorption peak at 1297 cm−1 mainly comes from the stretching vibration of the S![[double bond, length as m-dash]](https://www.rsc.org/images/entities/char_e001.gif) O bond,17 which mainly comes from the PES membrane. A new characteristic peak appeared at 1725 cm−1 in the TA-PES membrane which was related to the stretching vibration of the C
O bond,17 which mainly comes from the PES membrane. A new characteristic peak appeared at 1725 cm−1 in the TA-PES membrane which was related to the stretching vibration of the C![[double bond, length as m-dash]](https://www.rsc.org/images/entities/char_e001.gif) O bond,18 indicating that TA was oxidized to the quinone group and coated on the surface of the TA-PES membrane. Fig. 2(b) was shown that the COF-TA-PES membrane exhibits a characteristic peak of N–H stretching band at 1515 cm−1, indicating that TA adsorbs a certain amount of PDA molecules, and the N–H bond comes from the –NH2 group in PDA. Due to the Michael addition reaction and Schiff base reaction between TA and PDA monomers, the COF-TA-PES film exhibits a vibration peak of N–H band at 1618 cm−1. These results demonstrate the successful loading of functional groups on the membrane surface. In COF-TA-PES, a C
O bond,18 indicating that TA was oxidized to the quinone group and coated on the surface of the TA-PES membrane. Fig. 2(b) was shown that the COF-TA-PES membrane exhibits a characteristic peak of N–H stretching band at 1515 cm−1, indicating that TA adsorbs a certain amount of PDA molecules, and the N–H bond comes from the –NH2 group in PDA. Due to the Michael addition reaction and Schiff base reaction between TA and PDA monomers, the COF-TA-PES film exhibits a vibration peak of N–H band at 1618 cm−1. These results demonstrate the successful loading of functional groups on the membrane surface. In COF-TA-PES, a C![[double bond, length as m-dash]](https://www.rsc.org/images/entities/char_e001.gif) N stretching peak appeared at 1618 cm−1, indicating that the two monomers have successfully undergone a condensation reaction on the membrane to generate COF.
N stretching peak appeared at 1618 cm−1, indicating that the two monomers have successfully undergone a condensation reaction on the membrane to generate COF.
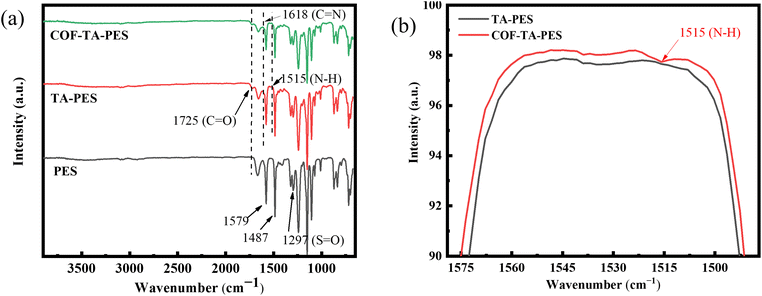 | ||
| Fig. 2 (a) ATR-FTIR spectra of PES membrane and modified membranes, (b) ATR-FTIR spectra of TA-PES and COF-TA-PES membranes at 1515 cm−1. | ||
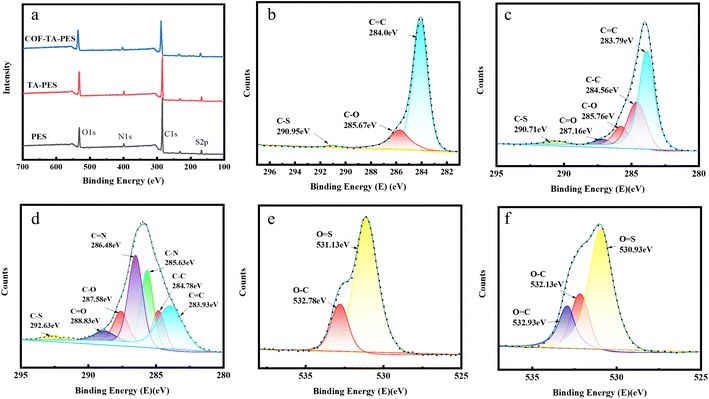
To further investigate the surface chemical composition of modified membranes, XPS analysis was carried out, testing and analyzing the composition and proportion of C, N, O, and S elements. As shown in Fig. 3(a), four characteristic peaks appeared at 287 eV (C 1s), 401 eV (N 1s), 533 eV (O 1s), and 161 eV (S 2p) for both the PES membrane and modified membranes. It can be seen from Table 2 that compared to the PES membrane (The N element may be related to the additive polyvinyl pyrrolidone added during the preparation of PES membranes.19), the TA-PES membrane had a significantly higher O content, increased from 15.00% to 20.34%, which is because the O content in the TA-PES membrane was higher than the PES membrane, indicated that TA was deposited on the surface of the PES membrane. Similarly, the TA–COF–PES membrane had a higher N content, increased from 3.38% to 4.15%, indicated that both COF and TA were deposited on the membrane surface. It is noteworthy that the increase in the N element content of the COF-TA-PES film compared to the TA-PES film is much higher than the increase in the O content, because the N content reacts extensively on the membrane surface to form COF, and COF does not contain O element, which justifies the successful progress of the interfacial polymerization reaction.20
| Membrane | Composition (atomic%) | |||
|---|---|---|---|---|
| C | N | O | S | |
| PES | 76.42 | 3.45 | 15.00 | 3.48 |
| TA-PES | 72.64 | 3.38 | 20.34 | 3.63 |
| COF-TA-PES | 72.23 | 4.15 | 19.86 | 3.70 |
The peaks of C and O elements on the PES original membrane and various modified membranes were fitted and divided in Fig. 3(b) to determine the chemical states of the elements. In the fitting of C peaks on the PES membrane, absorption peaks appeared at 284.0 eV, 285.67 eV, and 290.95 eV, which were related to C![[double bond, length as m-dash]](https://www.rsc.org/images/entities/char_e001.gif) C, C–O, and C–S.21 In the Fig. 3(c), two new peaks appeared at 284.56 eV and 287.16 eV, respectively, with the former belonging to C–C and the C
C, C–O, and C–S.21 In the Fig. 3(c), two new peaks appeared at 284.56 eV and 287.16 eV, respectively, with the former belonging to C–C and the C![[double bond, length as m-dash]](https://www.rsc.org/images/entities/char_e001.gif) O.22 This indicated that TA was oxidized to form benzoquinone and then applied on the surface of the PES membrane. In addition, two new peaks appeared at 285.63 eV and 286.48 eV (Fig. 4(d)), which were due to the formation of C–N and C
O.22 This indicated that TA was oxidized to form benzoquinone and then applied on the surface of the PES membrane. In addition, two new peaks appeared at 285.63 eV and 286.48 eV (Fig. 4(d)), which were due to the formation of C–N and C![[double bond, length as m-dash]](https://www.rsc.org/images/entities/char_e001.gif) N bonds between TA and PDA through Michael addition and Schiff base reactions,23 further demonstrated the successful interfacial polymerization reaction and coated on the membrane surface.
N bonds between TA and PDA through Michael addition and Schiff base reactions,23 further demonstrated the successful interfacial polymerization reaction and coated on the membrane surface.
The fitting of O peaks on the PES membrane in Fig. 3(e) showed that two absorption peaks appeared at 531.13 eV and 532.78 eV, which were attributed to O–C and O![[double bond, length as m-dash]](https://www.rsc.org/images/entities/char_e001.gif) S on the original PES membrane.24 In Fig. 3(f), a new absorption peak appeared at 532.93 eV on the TA-PES membrane, which was attributed to O
S on the original PES membrane.24 In Fig. 3(f), a new absorption peak appeared at 532.93 eV on the TA-PES membrane, which was attributed to O![[double bond, length as m-dash]](https://www.rsc.org/images/entities/char_e001.gif) C.25 Meanwhile, it can be seen that the proportion of the O–C peak did not change, which was due to the rich phenolic hydroxyl groups in TA, indicated that TA was oxidized to form benzoquinone and then applied on the surface of the PES membrane. This result was consistent with the FTIR result, confirming the successful reaction between the reaction compounds and the synthesis of COF.
C.25 Meanwhile, it can be seen that the proportion of the O–C peak did not change, which was due to the rich phenolic hydroxyl groups in TA, indicated that TA was oxidized to form benzoquinone and then applied on the surface of the PES membrane. This result was consistent with the FTIR result, confirming the successful reaction between the reaction compounds and the synthesis of COF.
The XRD results of the membranes are shown in Fig. S2,† and the TA-PES membrane shows a similar diffraction peak, which may be due to the small amount of TA modification and the overlap with the PES membrane. COF-TA-PES membrane shows an intense diffraction peak at 2θ = 4.8°.This peak represents a regularly repeating distance along the edges of the hexagonal lattice system, indicated the formation of an ordered hexagonal structure.
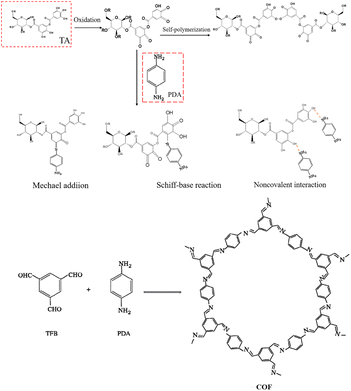
We propose a rapid approach for synthesising COF on the membrane surface via reaction, as shown in Fig. 4. The membrane surface was covered by TA through self-crosslinking and hydrogen bonding reactions, which occurs under the action of gravity.26 Its phenolic hydroxyl groups were oxidised to quinone groups under weakly alkaline conditions, leaving active sites for subsequent reactions. The PDA monomers attach to the TA-PES membrane through Michael addition, Schiff base reaction, and hydrogen bonding at these reaction sites. Following this, the PDA and TFB two-phase monomers undergo Schiff base reaction during interface polymerization, resulting in the generation of COF on the surface of the PES membrane.
Surface morphology of the modified membranes
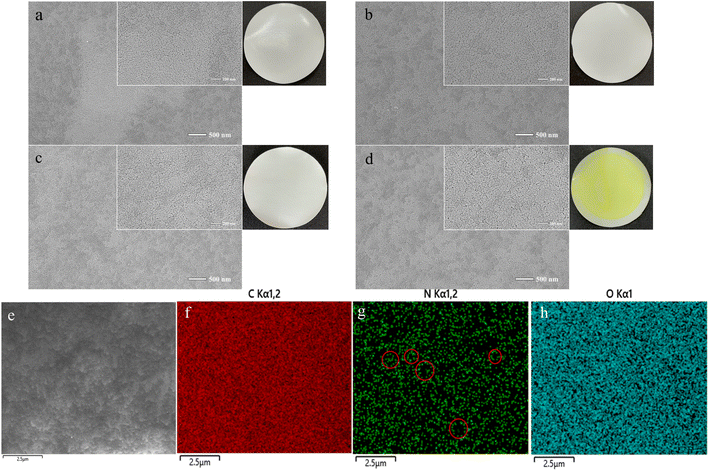
Surface morphology testing was one of the most intuitive methods for analyzing membrane surface modification, as shown in Fig. 5(a) and (b) were the photos of the pristine PES membrane and the modified membrane, respectively. It can be observed that after interface polymerization, the membrane surface turned bright yellow, indicating a chemical reaction on the surface of the membrane.27 The SEM images of the pristine PES membrane (Fig. 5(a)) and the modified membrane (Fig. 5(d)), respectively. It can be seen that the original PES membrane surface has a large number of uniform pores. With the deposition of TA and the progress of interface polymerization, the pore structure of the membrane surface did not change, and a large number of circular pores can still be observed on the surface. This indicated that the modification enhanced the dye separation performance of the membrane without changing the pore morphology.EDS can detect the distribution of C, N, and O elements, and observe the distribution of elements on the surface coating of the film. The O element comes from TA and partially unreacted TFB, the N element comes from PDA, and the C element belongs to the PES original film and three modifiers. As shown in Fig. 5(e–h), it can be seen that the distribution of the three elements were generally relatively uniform. The distribution of the N element indicated that the six-membered ring structure of the COF synthesis was uniform.
The influence of interfacial polymerization time and monomer concentration on membrane separation performance
The interfacial polymerization time of traditional polyamide nanofiltration membranes was found to be longer than that of the new ones. This was mainly due to the smaller kinetic rate constant of the polymerization between the synthesized COF monomers compared to that of traditional polyamide membranes,28 and the relatively low monomer activity, which was beneficial for controlling the interfacial polymerization reaction time. The duration and concentration of interfacial polymerization significantly affect the interfacial reaction. Once the appropriate interfacial polymerization time was determined, we investigated the impact of different interfacial reaction monomer concentrations on the permeability of modified membrane and separation performance. Table 3 below shows the monomer concentration formulation.| Membrane | TA concentration (g L−1) | TA deposition time (h) | PDA concentration (mmol L−1) | TFB concentration (mmol L−1) | Interface polymerization time (min) |
|---|---|---|---|---|---|
| 1# | 2 | 1 | 6 | 2 | 5 |
| 2# | 2 | 1 | 12 | 4 | 5 |
| 3# | 2 | 1 | 18 | 6 | 5 |
| 4# | 2 | 1 | 24 | 8 | 5 |
| 5# | 2 | 1 | 48 | 16 | 5 |
The duration of interfacial polymerization significantly affects the reaction. Fig. 6(a) demonstrates the impact of interfacial polymerization time on membrane performance. As the interfacial polymerization time increases from 1 to 20 minutes, the permeation of the modified membrane decreases from 153.73 L m−2 h−1 bar−1 to 35 L m−2 h−1 bar−1, and the rejection rate of methylene blue dye increases from 97.26% to over 99%. When the interfacial polymerization time was shorter, the COF synthesized only covered a portion of the pores on the surface of the PES-based membrane. As a result, the methylene blue rejection rate was slightly higher than that of the original membrane (95.21%). When the interfacial polymerization time was extended to 5 minutes, the thin active layer formed on the membrane surface, which evenly and densely covered the membrane surface. Consequently, the rejection rate approached 99%. When the interfacial polymerization time was extended to 10 minutes, the permeation of the modified membrane decreased significantly. This suggested that a longer interfacial polymerization time results in an active layer on the membrane surface, leading to greater water transport resistance and higher energy consumption for separation. These factors were not conducive to practical applications of dye separation.29 Therefore, it was recommended that 5 minutes be selected as the optimal time for interfacial polymerization reactions in future research.
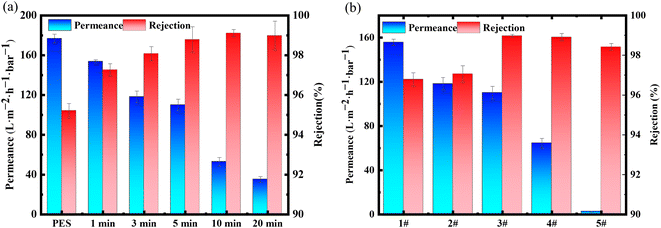 | ||
| Fig. 6 (a) The influence of monomer concentration on the interface (polymerization time fixed at 5 minutes), (b) the influence of polymerization time on the interface. | ||
The effect of different concentrations of monomers on the permeability and rejection performance of the synthesized modified membrane is shown in Fig. 6(b). As the monomer concentration increases, the permeability of the modified membrane for methylene blue decreases from 155.66 L m−2 h−1 bar−1 to 2.50 L m−2 h−1 bar−1, and the rejection rate for methylene blue gradually increases. The separation performance of modified membranes 1# and 2# for methylene blue was similar to that of the original membrane, as the low reaction concentration ultimately results in the layer, and the formed active layer has certain defects.30 As the monomer concentration increases, the permeation of methylene blue decreases sharply, mainly due to the formation of a thicker active layer at the two-phase interface by a large amount of monomers, which increases the resistance to water transport. Therefore, the formula of modified membrane 3# was selected for subsequent experiments.
Hydrophilic property of the composite membranes
The hydrophilicity of the membrane plays a significant role in reducing membrane fouling, as the hydrophilic groups on the membrane surface can attract water molecules to form a tight hydration layer, which can weaken the adhesion of pollutants on the membrane surface, thereby reducing membrane fouling.31 The static water contact angle of PES membrane and modified membrane was shown in Fig. 7(a), and the water contact angle of TA-PES membrane decreased from 61.53° to 44.26°, which was attributed to the large amount of phenolic hydroxyl groups in TA. These hydrophilic groups can better bind with water molecules, resulting in higher hydrophilicity of the modified membrane, while the pure water permeation decreased from 178.72 L m−2 h−1 bar−1 to 171.51 L m−2 h−1 bar−1, due to the formation of a modified layer on the membrane surface after TA deposition. Although hydrophilicity of TA made water molecules more easily to pass through the membrane pores, the formation of a modified layer on the membrane surface after TA deposition results in a slight decrease in pure water permeation.32 This also indirectly indicates that TA is coated on the membrane surface. After interfacial polymerization, the static water contact angle of COF-TA-PES membrane slightly increased, but it remains lower than that of the pristine PES membrane, and the pure water permeation decreased to 122.03 L m−2 h−1 bar−1, which was due to the formation of a thin active layer of COF on the membrane surface, which was evenly and densely covered, resulting in a decrease in permeation. The permeation of COF-TA-PES membrane prepared directly on the membrane surface was only 18.25 L m−2 h−1 bar−1, which also indirectly indicated that COF-TA-PES membrane overcomes the disadvantages of poor hydrophilicity and low permeation of COF, and has good performance.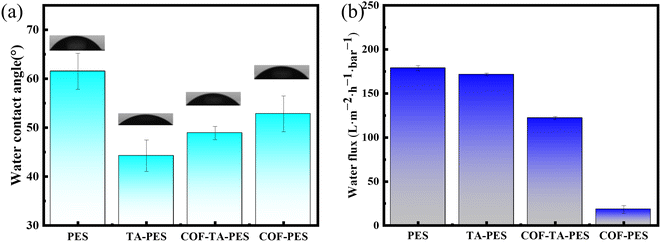 | ||
| Fig. 7 (a) Water contact angle of pristine PES membrane and modified membrane; (b) water flux of pristine PES membrane and modified membrane. | ||
Separation performance of the composite membrane
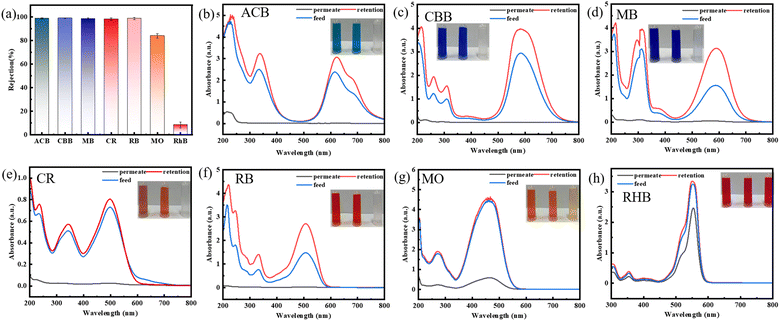
In order to investigate whether the best performance membrane has a rejection effect on different dyes. We selected dyes of different molecular sizes by the modified membranes. The structure and properties of dyes were shown in Table 1. Their relative molecular weights range from 300 to 1300 g mol−1 as shown in Fig. 8(a). The adsorption performance of the original membrane is low and the decrease in filtrate concentration is mainly related to the retention performance of the membrane as shown in Fig. S3.† The rejection rate of pristine membrane as shown in Fig. S4.† The rejection rate of modified membranes for RhB dye is about 8%, and the rejection rate for MO dye is about 84% (Due to the negative charge of the membrane surface, it repels methyl orange, which also carries a negative charge, resulting in a high rejection rate). However, the rejection rates for ACB, CBB, MB, CR, and RB are all above 97%. This was mainly due to the size screening effect.33 The molecular sizes of RhB and MO were relatively small, and the pore size of the modified layer can prevent the passage of larger molecular size dyes, while allowing the passage of smaller molecular size dyes. Therefore, the rejection rate of modified membranes for RhB was low. The concentration changes of the retention liquid, feed liquid, and filtered liquid of various dyes were tested using ultraviolet visible spectrophotometer. As shown in Fig. 8(b)–(h), the concentration of the rejection liquid of dyes was significantly higher than that of the feed liquid. Therefore, modified membranes have good separation performance for the dyes and have broad application prospects in the treatment of textile wastewater.Stability and reusability of the composite membranes
The stability and reusability of membrane materials were great significance for the industrial treatment of dye-containing wastewater.34 As shown in Fig. 9(a), the modified membrane still maintains a high rejection rate (greater than 97%) after multiple filtration of methylene blue dye solution, indicated that it has good anti-pollution performance. In addition, during the long-term filtration of methylene blue dye, the rejection rate of the modified membrane remains almost unchanged, staying above 98%, indicated that it maintain good separation performance in long-term use. At the same time, although the filtration process may cause the membrane pores to become blocked, resulting in a decrease in membrane permeation. As shown in Fig. 9(b) after 12 hours of permeate, the permeation can still be maintained at 84 L m−2 h−1 bar−1, indicated that the modified membrane has good stability.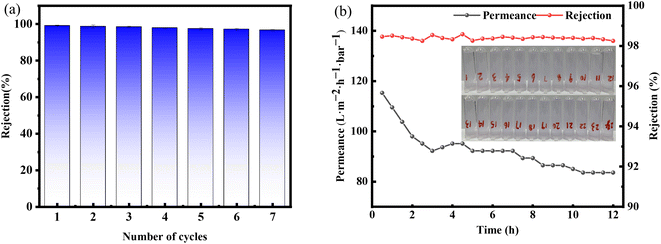 | ||
| Fig. 9 (a) Separation performance of MB dye in seven cycles of testing; (b) separation performance of modified membrane in separating methyl blue dye within 12 hours. | ||
Comparison with others works
To compare the modified membrane prepared in this work with other reported modified membranes, and highlight the dye separation performance of our membrane, Table 4 compares the molecular exclusion of our membrane with other reported membranes and polymer substrates or matrices. Due to a high molecular exclusion rate (e.g., 95%), many reported membranes have a permeation of less than 50 L m−2 h−1 bar−1.35 In this work, under optimized preparation conditions, a high molecular exclusion rate can be achieved while maintaining a high permeance (approximately 100 L m−2 h−1 bar−1), which is about 2–10 times higher than other membranes with polymer substrates or matrices, including membranes made with new materials such as graphene oxide (GO) and metal–organic frameworks (MOFs).36 The superior water permeability of the modified membrane should be attributed to the synergistic effect of TA and COF, including the hydrophilicity of TA and the additional channels provided by COF.| Membrane | Preparation | Dye rejection rate (%) | Permeation (L m−2 h−1 bar−1) | References |
|---|---|---|---|---|
| PAN/LZU1 | Spraying | MB: 98% | 39 | 37 |
| PVDF/LZU1 | Interfacial polymerization | CR: 98% | 200 | 38 |
| HPAN/TpPa-1 | In situ growth | ACB: 90% | 42 | 39 |
| COF-LZU1/PES | Interfacial polymerization | CB-T: 98% | 83 | 40 |
| TpPa/PSF | Interfacial polymerization | MB: 98% | 50 | 41 |
| TA–COF–PES | Interfacial polymerization | MB: 98% | 122 | This work |
Conclusions
In summary, we demonstrated a method for modifying commercial PES ultrafiltration membranes using an environmentally friendly TA-assisted COF interfacial polymerization co-deposition. The membranes were treated with a PDA concentration of 18 mol L−1, a TFB concentration of 6 mol L−1, and an interfacial polymerization reaction time of 5 minutes. As a result, the hydrophilicity of the membranes was increased, the membrane water contact angle was reduced to 48.9°, and the permeation capacity was increased to 122.03 L m−2 h−1 bar−1. The modified membrane achieved retention rates above 98% for a wide range of dyes (Mw: 300–1300 g mol−1) and maintained this performance over 6 cycles. TA was deposited on the membrane surface through hydrogen bonding. Upon oxidation, the resulting quinone group reacted with PDA in a Michael addition reaction. TFB was then added to polymerise at the interface of the membrane surface, forming COFs that were successfully attached to the membrane surface. This enhanced the stability of the COFs on the surface of the membrane, resulting in a modified membrane with improved separation performance. This work proposes a novel approach for producing high-performance, eco-friendly separation membranes. The stable and efficient coating strategy presented here can be applied to separate various liquids or to prepare membranes with controllable properties.Data availability
Data will be made available on request.Author contributions
Weishan Deng: responsible for conceptualization, data curation, formal analysis, conducting experiments, drafting the original manuscript, and review & editing; Zezhen Zhang: responsible for conceptualization, data curation, formal analysis, and software operation; Lulu Liu: responsible for validation, formal analysis, and methodology design; Zekun Zhou: responsible for validation, formal analysis, and conducting investigations; Lili Wu: responsible for project administration, resource acquisition, supervision, visualization, and review & editing.Conflicts of interest
The authors declare that they have no known competing financial interests or personal relationships that could have appeared to influence the work reported in this paper.Acknowledgements
This study was supported by Guangdong Pustar Adhesives & Sealants Co. Ltd and Major science and technology project in Zhongshan city, Guangdong province (2020AG028).References
- J. Nieminen, I. Anugwom, A. Pihlajamäki and M. Mänttäri, J. Membr. Sci., 2022, 659, 120786 CrossRef CAS.
- L. L. Xu, K. P. Wang, K. L. Li, S. Y. Zhao and J. Wang, Sep. Purif. Technol., 2022, 282, 120112 CrossRef CAS.
- L. Valentino, M. Matsumoto, W. R. Dichtel and B. J. Mariñas, Environ. Sci. Technol., 2017, 51, 14352–14359 CrossRef CAS PubMed.
- K. Dey, M. Pal, K. C. Rout, S. Kunjattu H, A. Das, R. Mukherjee, U. K. Kharul and R. Banerjee, J. Am. Chem. Soc., 2017, 139, 13083–13091 CrossRef CAS PubMed.
- M. Sianipar, S. H. Kim, C. Min, L. D. Tijing and H. K. Shon, J. Ind. Eng. Chem., 2016, 34, 364–373 CrossRef CAS.
- Y. Zeng, R. Zou, Z. Luo, H. Zhang, X. Yao, X. Ma, R. Zou and Y. Zhao, J. Am. Chem. Soc., 2015, 137, 1020–1023 CrossRef CAS PubMed.
- Y. Chen, F. Liu, Y. Wang, H. Lin and L. Han, J. Membr. Sci., 2017, 537, 407–415 CrossRef CAS.
- Z. Kang, Y. Peng, Y. Qian, D. Yuan, M. A. Addicoat, T. Heine, Z. Hu, L. Tee, Z. Guo and D. Zhao, Chem. Mater., 2016, 28, 1277–1285 CrossRef CAS.
- W. Zhang, L. Zhang, H. Zhao, B. Li and H. Ma, J. Mater. Chem. A, 2018, 6, 13331–13339 RSC.
- X. Cao, Z. Qiao, Z. Wang, S. Zhao, P. Li, J. Wang and S. Wang, Int. J. Hydrogen Energy, 2016, 41, 9167–9174 CrossRef CAS.
- D. Yu, X. Xiao, C. Shokoohi, Y. Wang, L. Sun, Z. Juan, M. J. Kipper, J. Tang, L. Huang, G. S. Han, H. S. Jung and J. Chen, Adv. Funct. Mater., 2022, 33, 2211983 CrossRef.
- X. Wu, B. Wang, Z. Yang and L. Chen, J. Mater. Chem. A, 2019, 7, 5650–5655 RSC.
- M.-Y. Lim, Y.-S. Choi, J. Kim, K. Kim, H. Shin, J.-J. Kim, D. M. Shin and J.-C. Lee, J. Membr. Sci., 2017, 521, 1–9 CrossRef CAS.
- S.-Y. Ding, J. Gao, Q. Wang, Y. Zhang, W.-G. Song, C.-Y. Su and W. Wang, J. Am. Chem. Soc., 2011, 133, 19816–19822 CrossRef CAS PubMed.
- Y. Tang, X. Lin, K. Ito, L. Hong, T. Ishizone, H. Yokoyama and M. Ulbricht, J. Membr. Sci., 2017, 544, 406–415 CrossRef CAS.
- M. O. Mavukkandy, Q. Zaib and H. A. Arafat, J. Environ. Chem. Eng., 2018, 6, 6733–6740 CrossRef CAS.
- S. Chandra, T. Kundu, S. Kandambeth, R. BabaRao, Y. Marathe, S. M. Kunjir and R. Banerjee, J. Am. Chem. Soc., 2014, 136, 6570–6573 CrossRef CAS PubMed.
- X. Chen, Y. He, Y. Fan, G. Zeng and L. Zhang, Sep. Purif. Technol., 2019, 212, 326–336 CrossRef CAS.
- F. Sun, J. Yang, Q. Shen, M. Li, H. Du and D. Y. Xing, J. Environ. Manage., 2021, 297, 113363 CrossRef CAS PubMed.
- J. Kotowicz, T. Chmielniak and K. Janusz-Szymańska, Energy, 2010, 35, 841–850 CrossRef CAS.
- Y. Cao, H. Zhang, S. Guo, J. Luo and Y. Wan, J. Membr. Sci., 2021, 629, 119287 CrossRef CAS.
- R. Nithya, A. Thirunavukkarasu, A. B. Sathya and R. Sivashankar, Environ. Chem. Lett., 2021, 19, 1275–1294 CrossRef CAS.
- J. Zhu, A. Uliana, J. Wang, S. Yuan, J. Li, M. Tian, K. Simoens, A. Volodin, J. Lin, K. Bernaerts, Y. Zhang and B. Van der Bruggen, J. Mater. Chem. A, 2016, 4, 13211–13222 RSC.
- Y. Xu, G. Peng, J. Liao, J. Shen and C. Gao, J. Membr. Sci., 2020, 601, 117727 CrossRef CAS.
- Y. Liu, K. Ai and L. Lu, Chem. Rev., 2014, 114, 5057–5115 CrossRef CAS PubMed.
- W.-Z. Qiu, Y. Lv, Y. Du, H.-C. Yang and Z.-K. Xu, RSC Adv., 2016, 6, 34096–34102 RSC.
- D. G. Barrett, T. S. Sileika and P. B. Messersmith, Chem. Commun., 2014, 50, 7265–7268 RSC.
- H. Wang, J. Wu, C. Cai, J. Guo, H. Fan, C. Zhu, H. Dong, N. Zhao and J. Xu, ACS Appl. Mater. Interfaces, 2014, 6, 5602–5608 CrossRef CAS PubMed.
- T. S. Sileika, D. G. Barrett, R. Zhang, K. H. A. Lau and P. B. Messersmith, Angew. Chem., 2013, 125, 10966–10970 CrossRef.
- Z. Zhang, Y. Zhao, X. Luo, S. Feng and L. Wu, Appl. Surf. Sci., 2022, 572, 151440 CrossRef CAS.
- Y. Xu, D. Guo, T. Li, Y. Xiao, L. Shen, R. Li, Y. Jiao and H. Lin, J. Colloid Interface Sci., 2020, 565, 23–34 CrossRef CAS PubMed.
- L. Wu, Q. Li, C. Ma, M. Li and Y. Yu, Chemosphere, 2022, 308, 136367 CrossRef CAS PubMed.
- N. Akther, Z. Yuan, Y. Chen, S. Lim, S. Phuntsho, N. Ghaffour, H. Matsuyama and H. Shon, Desalination, 2020, 484, 114421 CrossRef CAS.
- T. Mantel, E. Jacki and M. Ernst, Water Res., 2021, 201, 117318 CrossRef CAS PubMed.
- S. Han, W. You, S. Lv, C. Du, X. Zhang, E. Zhang, J. Zhu and Y. Zhang, Desalination, 2023, 548, 116300 CrossRef CAS.
- L. Yang, H. Yang, H. Wu, L. Zhang, H. Ma, Y. Liu, Y. Wu, Y. Ren, X. Wu and Z. Jiang, J. Mater. Chem. A, 2021, 9, 12636–12643 RSC.
- S. Hao, L. Jiang, Y. Li, Z. Jia and B. Van der Bruggen, Chem. Commun., 2020, 56, 419–422 RSC.
- C. Wu, X. Wang, T. Zhu, P. Li and S. Xia, Chemosphere, 2020, 261, 127580 CrossRef CAS PubMed.
- F. Pan, W. Guo, Y. Su, N. A. Khan, H. Yang and Z. Jiang, Sep. Purif. Technol., 2019, 215, 582–589 CrossRef CAS.
- Y.-Y. Su, X. Yan, Y. Chen, X.-J. Guo, X.-F. Chen and W.-Z. Lang, J. Membr. Sci., 2021, 618, 118706 CrossRef CAS.
- R. Wang, X. Shi, A. Xiao, W. Zhou and Y. Wang, J. Membr. Sci., 2018, 566, 197–204 CrossRef CAS.
Footnotes |
| † Electronic supplementary information (ESI) available. See DOI: https://doi.org/10.1039/d4ra02838d |
| ‡ These two authors contribute equally to this work. |
| This journal is © The Royal Society of Chemistry 2024 |

