 Open Access Article
Facile synthesis of a magnetic molecularly-imprinted polymer adsorbent for solid-phase extraction of diclofenac from water
Heba Ali Dakhlya,
Salwa A. H. Albohyb,
Aida A. Salmanb and
Ahmed S. Abo Dena *ac
*ac
aFaculty of Oral and Dental Medicine, Future University in Egypt (FUE), New Cairo, Egypt. E-mail: ahmed.abdelmawgood@fue.edu.eg; ahmed_said5899@yahoo.com
bChemistry Department, Faculty of Science (Girl's), Al-Azhar University, Youssif Abbas St., P.O. Box 11754, Nasr-City, Cairo, Egypt
cPharmaceutical Chemistry Department, National Organization for Drug Control and Research (NODCAR), Giza, Egypt
First published on 16th May 2024
Abstract
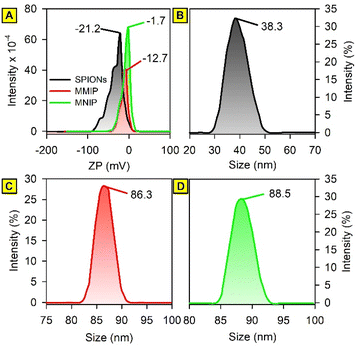
Numerous pollutants endanger the safety and purity of water, making water pollution a major worldwide concern. The health of people and aquatic ecosystems are at risk from these contaminants, which include hazardous microbes, industrial waste, and agricultural runoff. Fortunately, there appears to be a viable option to address this problem with adsorptive water treatment techniques. The present study presents a magnetic adsorbent (MMIP) based on molecularly imprinted polyaniline and magnetite nanoparticles for the solid-phase extraction of diclofenac, an anti-inflammatory medication, from industrial wastewater. The adsorbent nanomaterial was characterized using dynamic light scattering, zeta potential measurement, vibrating sample magnetometry, X-ray diffraction, and scanning electron microscopy. The MMIP demonstrated a particle size of 86.3 nm and an adsorption capacity of 139.7 mg g−1 at 600 mg L−1 of diclofenac and after a 200 min incubation period. The highest %removal was attained at pH range of 3–7. The adsorption process follows the pseudo-second order kinetic model. In addition, it was found that the adsorption process is enthalpy-driven and may occur via hydrogen bonding and/or van der Waals interactions.
Introduction
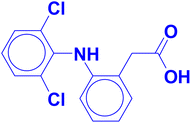
Water pollution from pharmaceutical compounds has become a crucial concern and is related to major health problems that can end up with catastrophic neurological, respiratory, cardiovascular and gastrointestinal complications. Contamination of waterways leads necessarily to a subsequent contamination in irrigation and municipal waters. This affects not only the health of human beings but also the viability of aquatic animals/plants and the annual crop yields. The effluents of the pharmaceutical factories usually contain hazardous compounds including the active drug molecules, their degradation products, and the organic byproducts resulting from their synthetic organic reactions. Preserving aquatic life, and animal and human health necessitates the removal of such hazardous molecules from industrial effluents before they drain into waterways.The sodium salt of diclofenac (DIC) is one of the most common active pharmaceutical ingredients in anti-inflammatory formulations. The IUPAC name of diclofenac is 2-[2-(2,6-dichloroanilino)phenyl]acetic acid. It is a non-steroidal anti-inflammatory drug which has the role of non-narcotic analgesic, antipyretic, prostaglandin-endoperoxide synthase inhibitor, drug allergen, xenobiotic, and is considered a serious water and environmental pollutant. The chemical structure of diclofenac is illustrated in Fig. 1.
Diclofenac has a carboxylic acid group which when ionized results in a single negative charge on the DIC ion. Another centre of ionization is the basic nitrogen atom of the secondary amine group in the centre of the molecule, which can be protonated in acidic media to form a positively-charged quaternary ammonium salt. Therefore, DIC molecule has a pKa and pKb values enabling it to acquire either a positive or a negative charge depending on the solution pH.
Recently, many nanoadsorbents were used to remove DIC from polluted water. For instance, PbO2/TiO2 materials,1 MIL-100-Fe-AMSA,2 polypyrrole doped GO/COF-300 (GO/COF-300/PPy) nanocomposite,3 and defective MOF-801,4 are the most commonly used materials for the remediation of DIC. Additionally, iron composite nanoparticles prepared using chitosan were also used for diclofenac removal.5 The removal capacity of nanoadsorbents used to remove diclofenac varies depending on the specific adsorbent and experimental conditions. A Fe2O3 nanoparticles-stabilized emulsion nanofluid membrane achieved a removal efficiency of 97%.6 A nanocellulose-based adsorbent prepared from sago waste showed a maximum removal percentage of 82.4% for diclofenac.7 In addition, magnetic Fe3O4–chitosan and Fe/Cu–chitosan nanocomposite beads achieved removal capacities of 92% and 84% for diclofenac, respectively.8 Moreover, a polystyrene supported ionic liquid material demonstrated a high removal efficiency (>99.9%) with a maximum adsorption capacity of 785.2 mg g−1.9 Furthermore, a poly(acrylic acid) hydrogel incorporating TEMPO oxidized cellulose nanofibers achieved a diclofenac adsorption capacity of 559.8 mg g−1.10 Although all the above nanoadsorbents are efficient and easy to synthesize, they lack selectivity and cannot be applied for solid-phase extraction of DIC from complex matrices and/or water samples. Therefore, proposing a novel selective and highly efficient nanoadsorbent for removal and solid-phase extraction of DIC is an urgent issue.
One of the most promising selective adsorptive materials is molecularly imprinted polymers (MIPs) which are designed specifically for a certain molecule, to mimic natural antibodies. The MIPs gained their versatility due to their high selectivity, safety, low cost, easy and fast synthesis, scalability, …etc. When combined with magnetite nanoparticles (MNPs), the MIPs can provide excellent adsorbents for the removal of the desired contaminants from water; therefore, the MIPs are also used for solid-phase extraction and chromatographic separation techniques. The integration of MNPs with the MIPs render them paramagnetic, and hence the MIP can be easily separated from solutions by applying an external magnetic field of a strong magnet.
In the present work, we aim at synthesizing a magnetic MIP (MMIP) for the removal of DIC from contaminated water. The designed MMIP incorporates DIC-imprinted polyaniline (PANI) and superparamagnetic iron oxide nanoparticles (SPIONs). It is hypothesized that the positively charged polyaniline MIP will increase the ability of the negatively charged DIC ions to attach to their binding sites on the MIP surface via electrostatic attraction. Moreover, PANI was selected for this purpose because it can be easily synthesized in aqueous solution without the need for special conditions such as high temperature, organic solvents, inert atmosphere, reflux, crosslinking, and so on. Furthermore, the PANI is an ecofriendly material that does not cause any hazards to the environment.
Materials and methods
Materials
The standard diclofenac sodium powder obtained from the National Organization for Drug Control and Research (NODCAR, Egypt) was used as template for the synthesis of the MMIP. Aniline (Al-Alamia for Chemical Industries, Egypt), and ammonium persulfate (APS) were used for the synthesis of the molecularly imprinted polyaniline. Ferric chloride hexahydrate (FeCl3·6H2O, Daejung Chemicals and Metals, South Korea), ethylene glycol (Honeywell International Inc., USA), and anhydrous sodium acetate (ADWIC, Egypt) were used in the solvothermal synthesis of SPIONs. Absolute ethyl alcohol was purchased from the international Company for Medical Industries, Egypt. Methyl alcohol, hydrochloric acid and glacial acetic acid used throughout the experimental work are ADWIC products (Egypt). Double distilled water was used for the preparation of all aqueous solutions. All reagents were analytical grade and used without any further purification.Apparatus
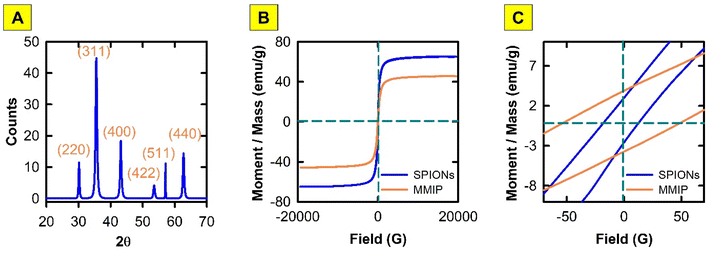
Fourier-transform infrared (FTIR) spectra were recorded in the 4000–400 cm−1 spectral window with the aid of a Nicolet iS10 Mid Infrared ATR-FTIR spectrometer (USA). Spectrophotometric measurements were performed using an evolution 60 Thermo Scientific Spectrophotometer (USA) equipped with two 1 cm quartz cuvettes. A field-emission scanning electron microscope (FE-SEM, VEGA3 TESCAN, Czech Republic) was used for imaging the synthesized nanomaterials. Average particle size and zeta potential of the MMIP were measured with the aid of a Malvern Panalytical apparatus (UK). A Lakeshore vibrating-sample magnetometer model 7410 was used to test the magnetic properties of the SPIONs before and after modification with the MIP. The X-ray diffraction spectra were recorded by a Discover-D8 instrument (Bruker, USA).Synthesis of magnetite nanoparticles (SPIONs)
A modified solvothermal method11–13 was used for the preparation of the SPIONs. Briefly, 6 g of anhydrous sodium acetate and 2 g of FeCl3·6H2O were dissolved in 65 mL of ethylene glycol. The formed solution was transferred to a Teflon-lined stainless-steel reactor and then heated to 200 °C in the oven (Heraeus, Thermo Electron Corporation, Germany) for 12 h. The prepared black magnetite nanoparticles were allowed to cool at room temperature, collected, and separated with a strong magnet. Distilled water and ethanol were used for washing the black magnetite nanoparticles for effective removal of the solvent, and then vacuum dried at room temperature for 24 h.Synthesis of magnetic MIP
Firstly, 1 g of SPIONs and 1 mL (ca. 10.95 mmol) of aniline, the functional monomer, were mixed in 20 mL of HCl (1.0 mol L−1) with constant stirring at 4 °C. Following, 0.87 g (ca. 2.7 mmol) of DIC sodium salt template were dissolved in 20 mL of DMSO and added to the above mixture with constant stirring. After that, 1.21 g (ca. 5.48 mmol) of APS, an initiator of the polymerization reaction, were dissolved in 5 mL of 1.0 mol L−1 HCl solution, and added dropwise to the mixture for about 1 h with constant stirring. The mixture was stirred continuously in an ice bath for 6 h. A dark green precipitate indicates the formation of the emeraldine salt of polyaniline (PANI), Fig. 2.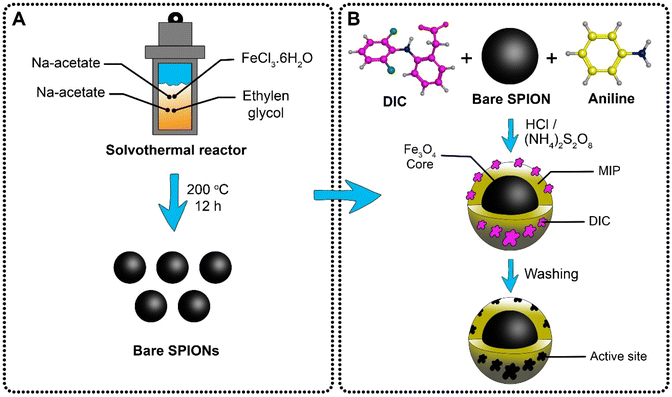 | ||
| Fig. 2 Hydrothermal synthesis of superparamagnetic magnetite nanoparticles (A), and preparation of magnetic molecularly imprinted polyaniline selective for DIC (B). | ||
The preparation of magnetic non-imprinted polymer (MNIP) is following the same procedure but without adding the template, DIC.
By using a strong magnet, the PANI/SPIONS nanocomposite was retained from the suspension, and washed with bidistilled water. The removal of DIC from the PANI/SPIONs nanocomposite was achieved by repeated washing with a mixture of methanol and 0.1% acetic acid solution (9![[thin space (1/6-em)]](https://www.rsc.org/images/entities/char_2009.gif) :
:![[thin space (1/6-em)]](https://www.rsc.org/images/entities/char_2009.gif) 1, v/v) till no DIC signal was observed at 276 nm with a spectrophotometer, and then the obtained solid was washed with methanol to remove the excess acid and DMSO. Thereafter, the obtained MMIP was left for 24 h to dry at ambient temperature. Also, the prepared MNIP was treated similarly in order to minimize any systematic errors.
1, v/v) till no DIC signal was observed at 276 nm with a spectrophotometer, and then the obtained solid was washed with methanol to remove the excess acid and DMSO. Thereafter, the obtained MMIP was left for 24 h to dry at ambient temperature. Also, the prepared MNIP was treated similarly in order to minimize any systematic errors.
Adsorption experiments
The batch method adsorption approach was applied to study the adsorption of DIC onto the synthesized MMIP. Glass-stoppered Erlenmeyer flasks containing 200 mg of the adsorbent and 10 mL of the DIC solution (of the appropriate concentration) were used throughout the adsorption experiments. Adsorption experiments were performed at room temperature. The suspension was placed in a temperature-controlled shaking water bath with a speed of 400 rpm. Working solutions of DIC were prepared from a 1 × 10³ mg L−1 stock solution, via dilution with double distilled water.The influence of the solution pH on the adsorption of DIC was studied by using the prepared aqueous working solutions of pH values ranging from 2 to 10. The pH of these working solutions was adjusted with 0.1 M HCl and/or NaOH solutions. A JENCO 6173 pH meter was used for pH measurements during the work.
During the adsorption experiments, an external magnetic field was used to separate the adsorbent after attaining equilibrium. The supernatant of the suspension was filtered and DIC concentration was determined from a calibration curve constructed via measuring the absorbance of standard DIC solutions at 290 nm. Eqn (1) was used to calculate the %removal of DIC, while eqn (2) was used to calculate the adsorption capacity of the MMIP.
 | (1) |
 | (2) |
One of the ways used to evaluate the selectivity of the prepared MMIP towards DIC is the imprinting factor (IF), which was calculated from eqn (3). The imprinting factor is calculated by dividing the adsorption capacity of the MMIP by that of the magnetic non-imprinted polymer (MNIP) counterpart.
 | (3) |
Adsorption isotherms
To understand the release/retention of DIC from/into the MMIP, adsorption isotherm models were investigated. An adsorption isotherm model is a relation that describes the adsorption equilibrium at constant temperature and pH. Langmuir isotherm (eqn (4)), Freundlich isotherm (eqn (5)), and Temkin isotherm (eqn (6)) are commonly used in the literature. Also, Scatchard (eqn (7)) and Hill (eqn (8)) plots can give some valuable information about the adsorbate surface.
 | (4) |
 | (5) |
 | (6) |
In Scatchard plot, the slope is equal to −k, the association constant, while the x-intercept is used to calculate the number of binding sites (Bmax). Meanwhile, Hill plot defines a saturation fraction v, equal to the amount of adsorbate (q) bound to the adsorbent surface, divided by the number of binding sites (qmax). The value of log(v/(1 − v)) is calculated and drawn against log![[thin space (1/6-em)]](https://www.rsc.org/images/entities/char_2009.gif) C, where C is the concentration of the adsorbate. A slope of 0.1 < q < 0.9 is the Hill coefficient (h), and is an index of cooperativity.
C, where C is the concentration of the adsorbate. A slope of 0.1 < q < 0.9 is the Hill coefficient (h), and is an index of cooperativity.
 | (7) |
 | (8) |
| q = qe(1 − e−k1t) | (9) |
 | (10) |
| qt = kidt1/2 + I | (11) |
![[thin space (1/6-em)]](https://www.rsc.org/images/entities/char_2009.gif) Ka vs. 1/T, the acquired Ka values were utilized to determine the adsorption thermodynamic parameters (ΔH and ΔS) using the van't Hoff equation (eqn (13)). Furthermore, eqn (14) was used to compute the change in Gibbs free energy (ΔG).
Ka vs. 1/T, the acquired Ka values were utilized to determine the adsorption thermodynamic parameters (ΔH and ΔS) using the van't Hoff equation (eqn (13)). Furthermore, eqn (14) was used to compute the change in Gibbs free energy (ΔG).| Kc = Cad/Ce | (12) |
 | (13) |
| ΔG = ΔH − TΔS | (14) |
Results and discussion
Characterization of the adsorbent
The successful formation of the desired nano MMIP and the synthesis of crystalline cubic magnetic crystals was proven by means of the following characterization techniques.Over the spectral window of 4000–400 cm−1, the infrared absorption spectra of DIC, PANI, washed MMIP, and unwashed MMIP (MMIP-DIC) were obtained. The Fe–O bond stretching was shown to be represented by a distinctive band at about 580 cm−1 in the FTIR spectrum of bare SPIONs. A metal-carboxylic (Fe–COO) connection may be the cause of the sharp band that appears at roughly 1628 cm−1, which could account for the surface negative charges of naked SPIONs. Furthermore, a broad band is present between 3000 and 3360 cm−1, that may be attributed to hydroxyl stretching.
The analysis of PANI's FTIR spectra confirms the combination between PANI and SPIONs. The existence of several distinguishing bands verified that PANI had formed an emeraldine salt. The band between 800 and 700 cm−1 was attributed to 1,4-disubstituted benzene and C–H in-plane bending. With B and Q representing the benzenoid and quinoid units respectively, the bond vibration of –NH+![[double bond, length as m-dash]](https://www.rsc.org/images/entities/char_e001.gif) , Q
, Q![[double bond, length as m-dash]](https://www.rsc.org/images/entities/char_e001.gif) NH+–B, or B–NH+˙–B is responsible for the strong broad band located at about 1000 cm−1. The presence of positively charged moieties in the PANI chain and the dihedral angles distribution between the B and Q rings are further confirmations of the emeraldine salt structure provided by this band. According to Prashar and Nihal's work,14 the two absorption bands at 1375 and 1635 cm−1 correspond to the quinonoid and benzenoid rings, respectively. The C–N+ bond was revealed by the absorbance band observed at 1225 cm−1. Additionally, C
NH+–B, or B–NH+˙–B is responsible for the strong broad band located at about 1000 cm−1. The presence of positively charged moieties in the PANI chain and the dihedral angles distribution between the B and Q rings are further confirmations of the emeraldine salt structure provided by this band. According to Prashar and Nihal's work,14 the two absorption bands at 1375 and 1635 cm−1 correspond to the quinonoid and benzenoid rings, respectively. The C–N+ bond was revealed by the absorbance band observed at 1225 cm−1. Additionally, C![[double bond, length as m-dash]](https://www.rsc.org/images/entities/char_e001.gif) N and C
N and C![[double bond, length as m-dash]](https://www.rsc.org/images/entities/char_e001.gif) C stretching vibrations are attributed to the bands at 1400 and 1545 cm−1, respectively. The broad absorption band above 2000 cm−1 appears to be a typical conducting PANI band. Several weak-to-moderate bands related to aromatic C–H stretching were noticed at 3300–2800 cm−1.
C stretching vibrations are attributed to the bands at 1400 and 1545 cm−1, respectively. The broad absorption band above 2000 cm−1 appears to be a typical conducting PANI band. Several weak-to-moderate bands related to aromatic C–H stretching were noticed at 3300–2800 cm−1.
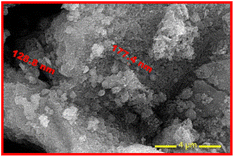
Understanding SPIONs interactions with biological systems and potential toxicity requires this information. Therefore, the plain SPIONs were investigated with the aid of SEM imaging (Fig. 5). The microscopic image of plain SPIONs shows agglomerates of small smooth nanoparticles. Individual nanoparticles are spherical or polygonal in shape. Almost all the SPIONs aggregates are less than 200 nm in size.
Effect of initial diclofenac concentration
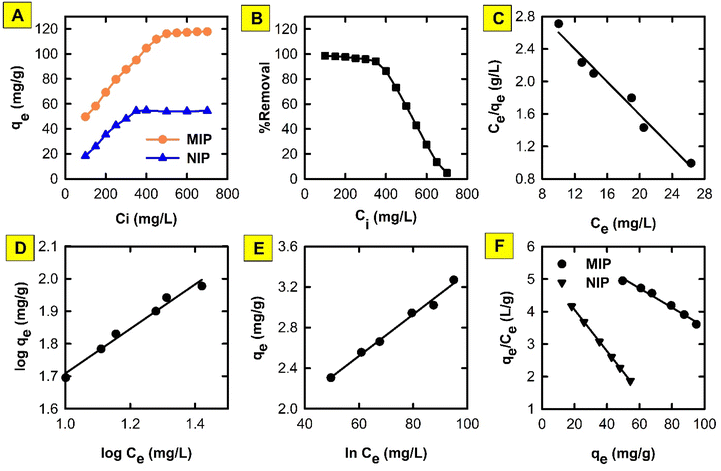
Studying the effect of adsorbate concentration in water treatment studies is important for several reasons. First, investigating the initial adsorbate concentration is very crucial for understanding adsorption isotherms. Researchers can map out the complete isotherm and determine important parameters like maximal adsorption capacity and adsorption affinity by altering the initial adsorbate concentration. This makes it possible to compare various adsorbent materials and forecast how they would behave in different scenarios. Second, the investigation of this parameter helps in exploring site saturation and competition. The adsorbent's accessible adsorption sites gradually fill up as the starting concentration increases. Understanding site saturation—the point at which further adsorption stops—is made easier by studying this effect. This information is essential for determining the ideal dosage and preventing harmful overdosing of the adsorbent. In addition, real-world scenarios often involve multiple pollutants in water. Potential competition for adsorption sites can be better understood by investigating the impact of initial concentration for certain pollutants. This makes it easier to comprehend how well the adsorbent eliminates particular pollutants when there are other contaminants present. Third, this information helps create regeneration procedures that increase the adsorbent's capacity, prolong its life, and decrease waste production.According to the above-mentioned items, the influence of varying the initial concentration of DIC on the adsorption of DIC onto the surface of the proposed MMIP (Fig. 6) was investigated. It was discovered that increasing the initial amount of DIC in solution (from 100 to 700 mg L−1) elevates its adsorbed amount (i.e. onto MMIP) from 49.6 to 117.8 mg g−1. On the other hand, the adsorption capacity in the case of MNIP was significantly lower than that of the MMIP, since it increased from 18.3 to 54.3 mg g−1 upon increasing the initial DIC concentration in the same manner. This reflects the higher selectivity of the MMIP towards the DIC molecules compared to the MNIP counterpart. In addition, the calculated selectivity/efficiency can be determined from the imprinting factor (IF), which was found to be 2.17.
According to the Langmuir isotherm (Fig. 6C), pollutants form a single layer on the surface of the adsorbent material in the context of a monolayer adsorption process.18 It proposes: (i) homogenous surface energy;19 (ii) reversible adsorption process; and (iii) distinct, identical adsorption sites with no interaction between adsorbed molecules.20 However, Langmuir isotherm have some limitations including: (i) in some cases it may not be able to describe real-world adsorption behaviour; and (ii) it does not account for multilayer adsorption, heterogeneous surfaces, or competitive adsorption between different pollutants. Herein, the Langmuir isotherm demonstrated an r2 value of 0.9746, a slope of −0.10 and an intercept of 3.62 indicating that qmax and b are −10 mg g−1 and −2.76, respectively. The negative value of the slope indicates that Langmuir isotherm does not fit the experimental results obtained in the present study. Therefore, monolayer adsorption cannot be confirmed from this theoretical model.
Other isotherms like Freundlich (Fig. 6D) or Temkin (Fig. 6E) are often used for more complex scenarios. An important tool for understanding and forecasting the adsorption of water contaminants onto different adsorbents is the Freundlich isotherm.21 The relationship between the equilibrium concentration of a pollutant in the solution (Ce) and the quantity of pollutant adsorbed onto the adsorbent (qe) at a fixed temperature is described by this empirical model. The adsorption process is assumed to approach equilibrium in this model, which means that the rates of adsorption and desorption are equal. It recognizes that there are variations in the affinities of distinct sites for the pollutant and that the adsorbent surface is not uniform. The Freundlich isotherm permits multilayer adsorption,22 where pollutant molecules can accumulate on top of one another, in contrast to the Langmuir isotherm, which presumes monolayer coverage. Herein, Freundlich isotherm showed an r2 value of 0.9792, an n value of 1.46 and a KF value of 10.53. The obtained value of the constant n indicates that the adsorption of DIC molecules becomes unfavourable upon increasing its initial concentration.23 On the other hand, due to its strong dependence on the particular system as well as the characteristics of the adsorbent and the adsorbate (pollutant), the KF constant in the Freundlich isotherm lacks a universal range. It displays the material's adsorption capacity, or the quantity of pollutant adsorbed per unit weight of the adsorbent at the equilibrium concentration of the adsorbate. The obtained high KF value indicates that the proposed adsorbent has a high adsorption capacity. Also, the Temkin isotherm, which has certain advantages over the widely used Freundlich isotherm, is useful in understanding and forecasting the adsorption of water contaminants. Similar to the Freundlich isotherm, it makes the assumption that the surface is heterogeneous and that the adsorption potential decreases linearly with increasing surface coverage. In contrast to the Freundlich model, this suggests a more uniform distribution of adsorption sites. Additionally, it makes the assumption that multilayer adsorption occurs and that interactions between molecules deposited result in a drop in adsorption energy as the surface fills up.24 A low interaction between the adsorbate and adsorbent molecules at the adsorbent surface is indicated by values <8 kJ mol−1 of the term (RT/bT), also referred to as B, which provides information about the heat of adsorption.25 The value of the constant bT determines the type of sorption process; a bT value of <80![[thin space (1/6-em)]](https://www.rsc.org/images/entities/char_2009.gif) 000 indicates physical adsorption. In the present work, the obtained B value was found to be 0.02 J mol−1 and the obtained bT value was 123.9 kJ mol−1. Accordingly, an exothermic adsorption process, in which heat is emitted during adsorption, is indicated by the obtained positive bT value. This implies that there is a positive and energetically stable interaction between the adsorbent and DIC molecules. Furthermore, an adsorption intensity that is relatively strong is indicated by this bT value. This suggests that DIC molecules have a strong affinity for the proposed MMIP adsorbent, and thus DIC can be successfully extracted from the solution using the suggested MMIP material. Temkin isotherm demonstrated an r2 value of 0.9898. Based on the above-mentioned values of r2, it can be concluded that Temkin isotherm is the best model that fits the experimental adsorption data; therefore, this model suggests that the prepared MMIP particles remove DIC molecules from water via a physical adsorption (a.k.a. a physisorption) process.
000 indicates physical adsorption. In the present work, the obtained B value was found to be 0.02 J mol−1 and the obtained bT value was 123.9 kJ mol−1. Accordingly, an exothermic adsorption process, in which heat is emitted during adsorption, is indicated by the obtained positive bT value. This implies that there is a positive and energetically stable interaction between the adsorbent and DIC molecules. Furthermore, an adsorption intensity that is relatively strong is indicated by this bT value. This suggests that DIC molecules have a strong affinity for the proposed MMIP adsorbent, and thus DIC can be successfully extracted from the solution using the suggested MMIP material. Temkin isotherm demonstrated an r2 value of 0.9898. Based on the above-mentioned values of r2, it can be concluded that Temkin isotherm is the best model that fits the experimental adsorption data; therefore, this model suggests that the prepared MMIP particles remove DIC molecules from water via a physical adsorption (a.k.a. a physisorption) process.
Scatchard plot
In molecular biology and biochemistry, a Scatchard plot (like this in Fig. 6F) is a graphical technique used to examine the equilibrium binding of a ligand to a receptor.26,27 It provides important insights into the number of binding sites (Bmax) and the affinity (Kd) of the receptor for the ligand. It also aids in the visualization and quantification of the interaction between these two molecules. The calculated values of Kd for MMIP and MNIP were found to be 0.03 and 0.06, respectively. Negative slopes of Scatchard plots indicate positive binding affinity between DIC and the studied adsorbents.28,29 However, the calculated Bmax values (218.96 and 83.63 for MMIP and MNIP, respectively) indicate a larger number of binding sites in the case of the MMIP compared to MNIP. This may be attributed to the large number of cavities left after the removal of the DIC template molecules from the surface of the MMIP adsorbent.Adsorption kinetics and the effect of time
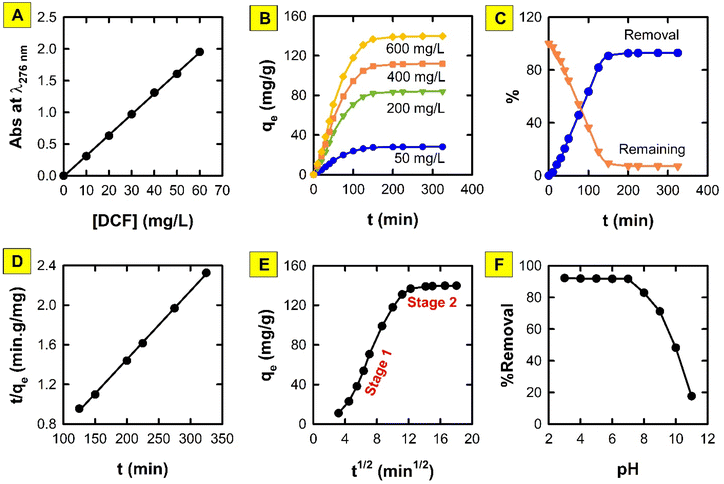
To assess the kinetics of the adsorption process of DIC onto the proposed MMIP, the influence of incubation time was studied using four DIC concentrations ranging from 50 to 600 mg L−1. The removal of DIC reached 92.8% after 200 min. The maximum adsorption capacity (qmax) of the MMIP was found to be 139.7 mg g−1 at 600 mg L−1 of DIC and after 200 min incubation period. In addition, the PFO, PSO, and IPD kinetic models were applied to the experimental data.A straightforward method for characterizing second-order (bimolecular) chemical processes in which one reactant is significantly more abundant than the other is the PFO kinetic model.30 This indicates that the surplus reactant's concentration stays essentially constant during the reaction. In light of the other reactant, the reaction thus exhibits first-order behaviour. However, this kinetic model has some limitations including: (i) it is only valid when the assumption of one reactant being in large excess is met; (ii) it does not provide information about the true second-order nature of the reaction; and (iii) at high concentrations of the limiting reactant, it might not adequately depict the adsorption process.
Unlike its first-order counterpart, the PSO kinetic model (Fig. 7D) describes reactions that are inherently second-order yet have certain drawbacks when used directly.31 This model takes into consideration the involvement of both reactants in the rate-limiting step, while it also allows for the possibility that one of the reactants may be present in a substantially higher concentration than the other. Least-square discrimination indicates that the PSO model usually matches experimentally measured adsorption data better than the PFO model. Nonetheless, the experimental value of qe is typically extremely near to, if not higher than, the value determined from the PSO kinetic model. Interestingly the calculated qe value from the PSO model is 144.83 mg g−1, which is very close to the experimental value (139.7 mg g−1) mentioned above. Moreover, the calculated adsorption rate constant (k2) is 6.71 × 10⁻⁴ g mg−1 min−1. Therefore, the rate-limiting stage is DIC chemisorption, and the removal of DIC molecules from bulk solution is caused by the physicochemical interactions between DIC and the MMIP surface, according to the fitting of experimental data to the PSO kinetic model.
The diffusion-controlled adsorption of molecules onto a porous adsorbent material is described by the IPD model.32 It is assumed that the adsorption rate is not restricted by surface adsorption or external mass transfer, but rather by the diffusion of the adsorbate (molecules being adsorbed) into the adsorbent's pores. It assumes that there is no interaction between the adsorbed molecules. Fig. 7E demonstrates a two-stage adsorption process. The rapid adsorption/film diffusion resulting from the diffusion of DIC molecules through the liquid film that surrounds the MMIP particles' surface is represented by stage 1. On the other hand, stage 2 forms a plateau corresponding to an equilibrium stage. The values of the rate constant (kid) of stages 1 and 2 are 16.04 and 0.30 mg g−1 min−1, respectively; thus, implying that the rate of adsorption is quicker in the case of stage 1. In the IPD model, the intercept (I) stands for two key concepts: (i) thickness of the boundary layer, and (ii) initial adsorption that may occur before the diffusion-controlled stage becomes dominant. This might involve chemisorption at easily accessible locations within the pores or physical adsorption on the surface. A low I value indicates a thin boundary layer and minimal initial adsorption. Diffusion is likely the rate-limiting step throughput the process. However, a large intercept value suggests a thicker boundary layer or significant initial adsorption and diffusion might not be the only factor affecting the overall rate, and other limitations could be present. The obtained I values of stages 1 and 2 are −44.9 and 134.7, respectively.
Effect of solution pH
Research on how pH affects the adsorption of water pollutants is essential to comprehending the underlying mechanisms, streamlining the treatment procedures, and guaranteeing long-lasting and efficient water purification initiatives. Both the pollutant and the adsorbent have surface charges that are influenced by pH. The adsorption process is eventually impacted by this interaction, which establishes their mutual attraction or repulsion. Depending on the pH, pollutants and adsorbents can gain or lose protons (H+), which changes their chemical makeup and interactions with one another. In addition, the degree to which different ions in water compete with contaminants for adsorption sites is determined by their respective charges and affinities for the adsorbent at various pH levels. Furthermore, the pH of naturally occurring water bodies can vary greatly based on biological activity, pollution, and geology. Analysing the pH effect aids in forecasting potential adsorption effects in various aquatic environments.It is clear from Fig. 7F that the %removal of DIC using the proposed MMIP adsorbent is maximum over the pH range 3–7. However, it demonstrates a sharp decline in pH levels >7. DIC has a pKa value of 4, meaning that 50% of its molecules are ionized (i.e. deprotonated) at pH 4.0.33 On the other hand, the partially protonated emeraldine base is produced as the proportion of protonated nitrogen atoms in the PANI chains gradually drops at pH 5.5–7.0. As for pH > 7, this results in a sudden increase in the quantity of deprotonated nitrogen atoms in the emeraldine base and the observed decrease in DIC removal. These data imply that PANI is in the form of neutral emeraldine base chains in neutral meida of pH 7, while DIC is deprotonated and has a single negative charge per molecule. From an electrostatic perspective, this is, in fact, the optimal situation for DIC adsorption onto PANI since it minimizes the electrical forces of repulsion between DIC molecules and PANI chains. Hamadeen et al. reported similar results when using Moringa oleifera seed waste to remediate chlorpyrifos-contaminated water.34 Because emeraldine salt is an ideal pH-sensitive substance that was used to fabricate solid-state pH sensors, the progressive decline in the removal of DIC at pH <7 suggests that PANI is the key participant.
Adsorption thermodynamics
The mechanism of DIC adsorption onto the proposed MMIP material can be further assessed by calculating the adsorption equilibrium constant (Ka) at different test solution temperatures, and then calculating the thermodynamic parameters such as ΔH, ΔS, and ΔG. The obtained values of ΔG (Table 1) imply that DIC molecules tend to stay in the stationary phase and the adsorption process is spontaneous. ΔG values ranging from 0 to −20 kJ mol−1 often indicate a physisorption process, while chemisorption is indicated by ΔG values from −80 to −400 kJ mol−1. As depicted in Table 1, the obtained values of ΔG range from −7.78 to −8.15 kJ mol−1, and thus the adsorption process occurs by a physisorption mechanism. This indicates that the MMIP surface active sites are the main player in the adsorption process, coinciding with the calculated IF. Moreover, the type of interaction taking place on the surface of the proposed adsorbent material can be expected from the calculated values of ΔH, ΔS and TΔS. Hydrophobic interactions (such as van der Waals interactions, electrostatic interactions, hydrogen bonding, …etc.) are entropy driven processes. Entropy-driven processes are characterized by ΔH > 0, ΔS > 0, and ΔH < TΔS. However, enthalpy-driven processes are often characterized by ΔH < 0, ΔS < 0, and |ΔH| > |TΔS|. Adsorption processes governed by electrostatic interactions are often characterized by a positive favourable entropy and a minor enthalpy (i.e. ΔH ∼0 or ΔH > 0 and ΔS > 0). Accordingly, it is clear from the results that the adsorption of DIC onto the MMIP is an enthalpy-driven process. Therefore, the adsorption may occur via hydrogen bonding and/or van der Waals interactions. It is worth mentioning that elevating the test solution temperature results in more negative ΔG values, and thus the adsorption of more DIC molecules is favoured. This thermal behaviour was noticed because, in contrast to covalent interactions, which typically exhibit higher thermal stability, the rate-determining step—the physico-chemical interaction, as shown by the PSO model—is extremely sensitive to increases in solution temperature.| Temperature (K) | ΔG (kJ mol−1) | ΔH (kJ mol−1) | ΔS (kJ mol−1 K−1) |
|---|---|---|---|
| 303 | −7.78 | −3.974 | −0.013 |
| 313 | −7.90 | ||
| 323 | −8.03 | ||
| 333 | −8.15 |
Effect of adsorbent dose
The used mass of the proposed MMIP was found to have a significant influence on the removal of DIC from water (Fig. 8). The %removal increased from 71.43 to 98.64% upon increasing the amount of MMIP from 100 to 650 mg. This may be attributed to the addition of new active sites that facilitate the adsorption process.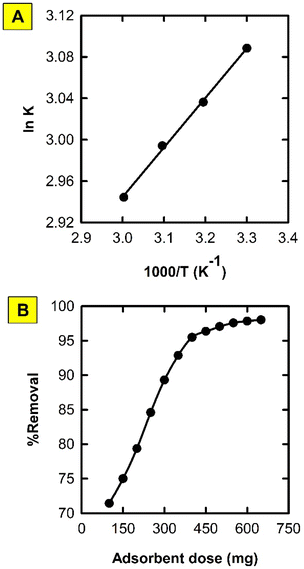 | ||
| Fig. 8 Effect of aqueous solution temperature (A) and adsorbent dose (B) on the adsorption of DIC onto the synthesized MMIP. | ||
Conclusions
The present study reported a new adsorbent magnetic nanomaterial based on molecularly imprinted polyaniline to remove diclofenac from industrial wastewater. The suggested adsorbent was fully characterized using physico-chemical characterization techniques. Additionally, the adsorption process of diclofenac onto the suggested material was fully investigated with regard to the adsorption kinetics, thermodynamics and the influence of adsorption conditions. The adsorbent demonstrated a high affinity to diclofenac molecules and can be applied for treating water effluents of pharmaceutical factories because it provides easy and time-saving separation. In addition, the incorporation of the molecularly imprinted polymer in the adsorbent material enhanced its selectivity towards diclofenac, thus it can be used for solid phase extraction and sample preparation in analytical purposes. However, although the solvothermal protocol followed to synthesize the superparamagnetic iron oxide nanoparticles results in a small nanoparticle size, it cannot be used for mass production, and alternative more practical synthesis protocols should be tried (e.g. co-precipitation).Author contributions
Heba Ali Dakhly: methodology, investigation, writing – original draft; Salwa A. H. Albohy: methodology, investigation, writing – original draft; Aida A. Salman: supervision, writing – review and editing; Ahmed S. Abo Dena: conceptualization, methodology, investigation, data interpretation, supervision; writing – review and editing, project administration.Conflicts of interest
There are no conflicts to declare.Acknowledgements
The corresponding author would like to thank the Science, Technology, Innovation Funding Authority (STDF), Egypt [Chinese-Egyptian Research Fund (CERF)-Project ID 46600] for financial support.Notes and references
- M. Cerro-Lopez, L. I. Castro-Pastrana, J. Campos-Delgado, E. Rubio-Rosas, E. Bustos and C. A. Martínez-Huitle, Environ. Res., 2023, 231, 116094 CrossRef CAS PubMed.
- N. Crespí Sánchez, G. Turnes Palomino and C. Palomino Cabello, Microporous Mesoporous Mater., 2023, 348, 112398 CrossRef.
- J.-B. Feng, Y. Li, Y. Zhang, Y. Xu and X.-W. Cheng, Chem. Eng. J., 2022, 429, 132499 CrossRef CAS.
- N. Prasetya and K. Li, Sep. Purif. Technol., 2022, 301, 122024 CrossRef CAS.
- Z. A. ALOthman, A. Y. Badjah, O. M. L. Alharbi and I. Ali, Int. J. Biol. Macromol., 2020, 159, 870–876 CrossRef CAS PubMed.
- A. Sharma, H. P. Kohli and M. Chakraborty, Mater. Today: Proc., 2023, 1–5 Search PubMed.
- N. Che Su, A. A. Basirun, N. S. Hameed Sultan, D. Kanakaraju and C. D. Wilfred, Sustainability, 2023, 15(7), 5650 CrossRef CAS.
- M. Şahin, Y. Arslan and F. Tomul, Res. Chem. Intermed., 2022, 48, 5209–5226 CrossRef.
- M. Cheng, R. Li, X. Du, Z. Zhang and H. Zhang, Environ. Technol., 2023, 1–7 Search PubMed.
- L. Tie, Y. Ke, Y. Gong, W. Zhang and Z. Deng, Int. J. Biol. Macromol., 2022, 213, 1029–1036 CrossRef CAS PubMed.
- H. Saad, F. A. N. El-Dien, N. E. A. El-Gamel and A. S. Abo Dena, RSC Adv., 2023, 14, 1316–1329 RSC.
- H. Saad, F. A. Nour El-Dien, N. E. A. El-Gamel and A. S. Abo Dena, RSC Adv., 2021, 11, 39768–39780 RSC.
- A. S. Shair, A. S. A. Dena and I. M. El-Sherbiny, Spectrochim. Acta, Part A, 2021, 249, 119301 CrossRef CAS PubMed.
- A. Prashar and Nihal, IOP Conf. Ser.: Mater. Sci. Eng., 2021, 1033, 12048 CAS.
- B. K. Sodipo, O. A. Noqta, A. A. Aziz, M. Katsikini, F. Pinakidou and E. C. Paloura, J. Alloys Compd., 2023, 938, 168558 CrossRef CAS.
- M. M. van de Loosdrecht, S. Draack, S. Waanders, J. G. L. Schlief, H. J. G. Krooshoop, T. Viereck, F. Ludwig and B. ten Haken, Rev. Sci. Instrum., 2019, 90, 024101 CrossRef CAS PubMed.
- T. K. Mahto, A. R. Chowdhuri and S. K. Sahu, J. Appl. Polym. Sci., 2014, 131(19), 40840 CrossRef.
- S. Kalam, S. A. Abu-Khamsin, M. S. Kamal and S. Patil, ACS Omega, 2021, 6, 32342–32348 CrossRef CAS PubMed.
- S. T. Lam, K. Dolan, W. Liu, R. Ballinger and C. Forsberg, J. Nucl. Mater., 2019, 519, 173–181 CrossRef CAS.
- N. Ayawei, A. N. Ebelegi and D. Wankasi, J. Chem., 2017, 2017, 3039817 Search PubMed.
- A. Proctor and J. F. Toro-Vazquez, in Bleaching and Purifying Fats and Oils, ed. G. R. List, AOCS Press, 2nd edn, 2009, pp. 209–219 Search PubMed.
- S. Kalam, S. A. Abu-Khamsin, M. S. Kamal and S. Patil, ACS Omega, 2021, 6, 32342–32348 CrossRef CAS PubMed.
- H. M. Agha, A. S. Abdulhameed, A. H. Jawad, N. J. Sidik, S. Aazmi, Z. A. ALOthman, L. D. Wilson and S. Algburi, Int. J. Biol. Macromol., 2023, 253, 127112 CrossRef CAS PubMed.
- A. A. Inyinbor, F. A. Adekola and G. A. Olatunji, Water Resour. Ind., 2016, 15, 14–27 CrossRef.
- M. S. Othman, S. A. Sheikh Hussin, A. Rambli and Z. Zahid, J. Phys.: Conf. Ser., 2019, 1366, 012033 CrossRef CAS.
- J. Feher, in Quantitative Human Physiology, ed. J. Feher, Academic Press, Boston, 2nd edn, 2017, pp. 853–869 Search PubMed.
- A. A. A. Ismail, in Advances in Clinical Chemistry, ed. G. S. Makowski, Elsevier, 2014, vol. 66, pp. 241–294 Search PubMed.
- A. K. Bordbar, A. A. Saboury and A. A. Moosavi-Movahedi, Biochem. Educ., 1996, 24, 172–175 CrossRef CAS.
- L. S. Clegg and W. E. Lindup, J. Pharm. Pharmacol., 1984, 36, 776–779 CrossRef CAS PubMed.
- E. D. Revellame, D. L. Fortela, W. Sharp, R. Hernandez and M. E. Zappi, Cleaner Eng. Technol., 2020, 1, 100032 CrossRef.
- D. Robati, J. Nanostruct. Chem., 2013, 3, 55 CrossRef.
- J. Wang and X. Guo, Chemosphere, 2022, 309, 136732 CrossRef CAS PubMed.
- C. Lara-Pérez, E. Leyva, B. Zermeño, I. Osorio, C. Montalvo and E. Moctezuma, Environ. Earth Sci., 2020, 79, 277 CrossRef.
- H. M. Hamadeen, E. A. Elkhatib, M. E. I. Badawy and S. A. M. Abdelgaleil, J. Environ. Chem. Eng., 2021, 9, 105376 CrossRef CAS.
| This journal is © The Royal Society of Chemistry 2024 |

