DOI:
10.1039/D4RA02451F
(Paper)
RSC Adv., 2024,
14, 16293-16299
Microwave-assisted synthesis of ZnO structures for effective degradation of methylene blue dye under solar light illumination†
Received
31st March 2024
, Accepted 11th May 2024
First published on 20th May 2024
Abstract
The presence of dyes in wastewater poses a high risk to both human health and the environment due to their potential toxicity and ecological impacts. Zinc(II) oxide is a low-cost, non-toxic material that can serve as a sustainable and effective solution to the global water pollution crisis. In this study, we propose a facile one-step synthesis of various ZnO structures by microwave irradiation. The primary goal of this study was to explore the morphology-dependent photocatalytic activity of various ZnO structures, as well as the impact of interfering anions on the Methylene Blue (MB) photodegradation under solar light illumination. Photocatalytic activity studies show that the sample denoted as 0.56 M-ZnO with a sheet-like structure has remarkable catalytic activity under solar light illumination, reaching ∼96.6% degradation of 30 mL MB solution (3 × 10⁻⁵ M) within 40 minutes. The BET specific surface area and band gap of the optimal 0.56 M-ZnO sample were observed to be 12.42 m2 g−1 and 2.89 eV, respectively. It was shown that the presence of anions like Cl−, NO3−, and HCO3− can reduce the catalytic activity of 0.56 M-ZnO structure to some extent, although more than 70% MB degradation can still be obtained under neutral pH conditions. The superior catalytic efficacy observed in the 0.56 M-ZnO photocatalyst can be attributed to its improved crystallinity, large surface area, and enhanced production of hydroxyl radicals. The low-cost synthesis, combined with high photocatalytic activity collectively underscores the efficiency and practical usability of produced ZnO photocatalysts for dye degradation.
1. Introduction
Synthetic dyes are widely utilized in industries such as printing, dyeing, textiles, cosmetics, and leather yet their disposal contributes significantly to environmental water pollution.1 This has resulted in a gradual deterioration of water quality and, given rise to significant environmental concerns.2 Generally, the dyes are characterized by complex aromatic molecular configurations, which poses a challenge for water treatment processes.2,3 Their stable structures make them resistant to biodegradation which increases their presence in the aquatic environment.2,3 Previous research indicates that prolonged exposure to even minimal amounts of contaminated water poses health risks.2 Moreover, the presence of dyes can result in vibrant hues that impact the transparency and the solubility of gases in water, consequently harming aquatic organisms by diminishing sunlight penetration and impeding photosynthesis, ultimately leading to oxygen depletion.2 Hence, it is imperative to devise proficient methods for eliminating dye waste to preserve ecological equilibrium and protect human well-being.
Researchers are exploring more efficient and sustainable water treatment methods due to increasing energy costs and concerns about secondary pollutants.3 Various technologies, such as membrane filtration,4 adsorption,5 flocculation and coagulation,6 and electrochemical treatment,7 have been employed to manage dye wastewater effectively. While traditional methods for removing dyes and organic compounds encounter challenges such as secondary pollution and increased energy consumption, photocatalytic technology offers a promising solution with benefits like minimal secondary pollution, simplicity, and high efficiency.8–10 Transition metals have been widely employed as photocatalysts by numerous researchers, exhibiting robust degradation capabilities against organic pollutants. Metal oxide semiconductors such as ZnO,9 TiO2,11 α-Fe2O3,12 and SnO2![[thin space (1/6-em)]](https://www.rsc.org/images/entities/char_2009.gif) 13 have been widely employed for their ability to degrade organic contaminants under visible light illumination. In this process, light excites the photocatalyst, causing electron and hole pairs to form. The generation of hydroxyl radicals (˙OH) is carried out by the reaction of the holes with water or hydroxyl anions, and the formation of superoxide radicals (O2˙−) is from electrons reacting with dissolved oxygen.9,10 These reactive species initiate a series of attacks on the targeted pollutant molecules, breaking them down step-by-step into smaller chemical compounds, eventually ending up with less harmful compounds.9,10
13 have been widely employed for their ability to degrade organic contaminants under visible light illumination. In this process, light excites the photocatalyst, causing electron and hole pairs to form. The generation of hydroxyl radicals (˙OH) is carried out by the reaction of the holes with water or hydroxyl anions, and the formation of superoxide radicals (O2˙−) is from electrons reacting with dissolved oxygen.9,10 These reactive species initiate a series of attacks on the targeted pollutant molecules, breaking them down step-by-step into smaller chemical compounds, eventually ending up with less harmful compounds.9,10
In recent times, metal and metal oxide nanoparticles have garnered increased interest for their utilization across various technological domains.14 Zinc oxide, among the plethora of metal oxide structures, has emerged as a focal point due to its distinctive physical and chemical properties.15 It has high photosensitivity and conductivity, making it appealing for applications in transparent electronics, piezoelectric devices, catalytic reactions, and notably, biomedical fields.15,16 Zinc oxide stands out as a distinctive n-type semiconductor; although, the quick recombination rate of photogenerated electron–hole pairs, as well as its wide bandgap of 3.3 eV17, hinder its extensive application as a photocatalyst. To date, extensive research has been conducted on various methodologies for the synthesis of various ZnO structures, including microwave-solvothermal,18 hydrothermal,19 precipitation,20 biogenic,21 sol–gel,22 and electrodeposition23 methods. Although many of these techniques have not been extensively employed on a large scale, the microwave-assisted synthesis of ZnO may gain widespread popularity due to its simplicity and cost-effectiveness.17,24 In general, microwave-assisted reduction methods provide homogeneous volumetric heating and significantly accelerate reaction rates compared to other physical and chemical techniques.17,24
The objective of this work is to employ microwave-assisted one-step approach to create various ZnO structures by changing the molar concentration of Zn precursor. To the best of our knowledge, there are no studies exploring the different ZnO morphologies caused by precursor concentration using microwave-assisted preparation. Subsequently, a range of characterizations including scanning electron microscopy (SEM), transmission electron microscopy (TEM), X-ray diffraction (XRD) and optical spectroscopy were conducted to examine the microstructure, morphology, and optical properties of the synthesized materials. The photocatalytic performances of the resulting ZnO structures were assessed by their ability to degrade MB dye under simulated solar light irradiation.
2. Materials and methods
2.1 Materials
High purity reagents including zinc acetate dihydrate, sodium hydroxide, methylene blue, hydrogen peroxide solution (34.5–36.5%), Na2CO3, NaNO3, KCl, and NaHCO3 were purchased from Merck and used as received.
2.2 Photocatalyst preparation
In a typical synthesis, aqueous solution of zinc acetate dihydrate (10 mL) with certain molarity was mixed with an equal volume of 0.9 M NaOH solution. The mixture was subsequently exposed to irradiation in a microwave reactor (CEM Corporation, USA) for 20 minutes at a constant temperature of 80 °C with a maximum permissible power of 100 W. During the synthesis process, 0.035 M, 0.07 M, 0.14 M, 0.28 M, and 0.56 M solutions of zinc acetate dihydrate were employed, and samples derived from these solutions were denoted as 0.035-ZnO, 0.07-ZnO, 0.14-ZnO, 0.28-ZnO, and 0.56-ZnO, correlating to their respective Zn precursor molar concentrations. Higher molar concentrations were not studied here due to solubility limit restrictions. The formed milky-white suspensions were centrifuged at 5000 rpm for 2 minutes, washed several times, and then dried at 60 °C for 24 h.
2.3 Characterization
The surface morphology of the ZnO stuctures was analyzed using an Auriga Crossbeam 540 SEM (Carl Zeiss, Germany) and detailed structural characterization was performed using a TEM (JEM2010F, JEOL Ltd, Japan). Energy-dispersive X-ray spectroscopy (EDX) analysis has been conducted using SEM (JEOL JSM-IT200, JEOL Ltd, Japan). The crystallographic structure and phase purity of the ZnO stuctures were determined using a SmartLab X-ray Diffractometer (Rigaku Corp., Japan) with a Cu Kα radiation source. The surface area and pore size distribution were analyzed by Autosorb iQ nitrogen porosimeter (Quantachrome Instruments, USA). The absorbance of the ZnO stuctures was tested using an absolute quantum yield spectrometer (C9920-02, Hamamatsu Photonics, Japan) equipped with an integrating sphere.
2.4 Photocatalytic experiments
For photocatalytic activity assessment, 2 mg of the synthesized ZnO structures were dispersed in 30 mL of a MB solution (3 × 10⁻⁵ M). The suspension was stirred in the dark for 60 minutes to reach adsorption–desorption equilibrium. Next, 5 μL of 35% H2O2 was introduced to the suspension and the mixture was immediately exposed to light from an LCS-100 solar simulator (100 W, AM 1.5G filter, Newport-Spectra Physics GmbH, Germany). The light output was adjusted to 1 sun intensity using a commercial silicon reference cell. After a certain period, the solution was immediately cleared from ZnO stuctures and the absorbance of the MB solution was quantitatively analyzed at 554 nm using a Genesys 50 UV-Vis spectrophotometer (Thermo Fisher Scientific Inc., USA). Each experiment was conducted 3 times to ensure reproducibility and mean values were plotted for graphical representation of the results.
3. Results and discussion
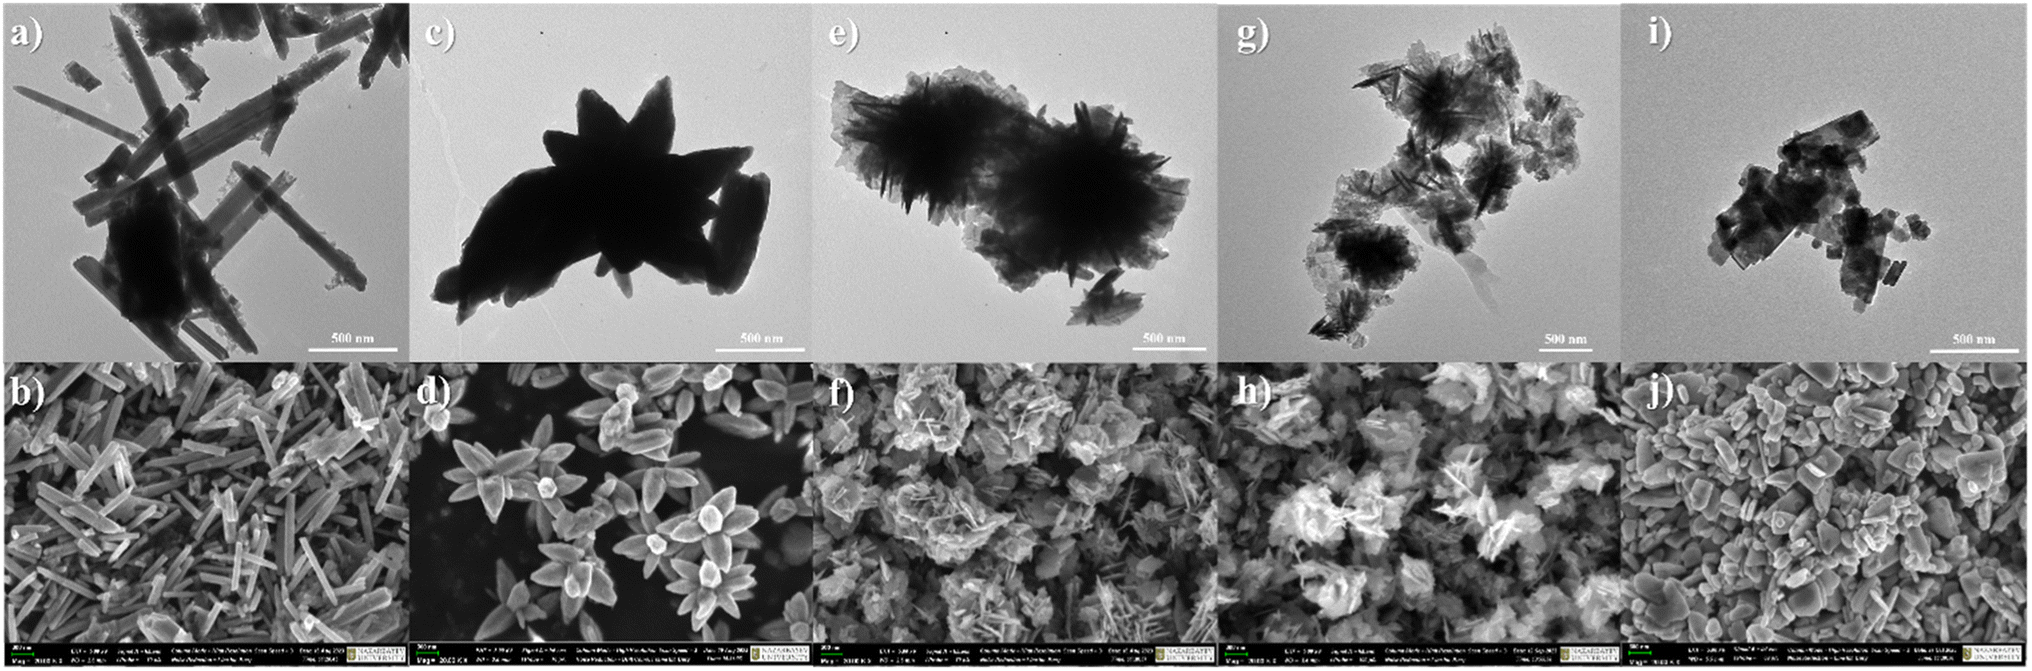
The morphological evolution of ZnO structures with different zinc precursor concentrations was studied systematically using SEM and TEM imaging techniques, as shown in Fig. 1. The findings show a transition from basic rod-like structures to sheet-like forms as the concentration of Zn precursor increases.
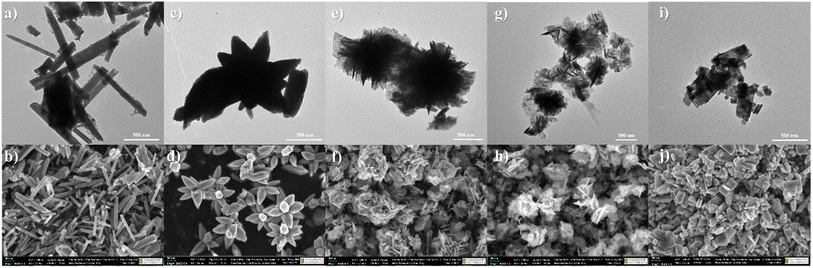 |
| | Fig. 1 TEM and SEM images of (a and b) 0.035-ZnO, (c and d) 0.07-ZnO, (e and f) 0.14-ZnO, (g and h) 0.28-ZnO and (i and j) 0.56-ZnO structures. | |
At the lowest precursor concentration (0.035 M), the ZnO structures predominantly take the form of elongated rods or needles. These structures crisscross at multiple angles, suggesting initial stages of nucleation and growth without significant steric hindrance or competition for space. The elongated shape indicates an anisotropic growth mechanism favored along certain crystallographic directions, likely influenced by the minimization of total surface energy during crystallization.25 As the zinc acetate concentration is doubled to 0.07 M, there is a marked morphological shift towards flower-like structures. This change suggests an increase in the number of nucleation sites and a subsequent alteration in growth kinetics. The outward projections forming the ‘petals’ of these ‘flowers’ may be a result of secondary nucleation events on the primary rods, as described by Guzmán-Carrillo et al.25 Further increase of zinc acetate concentration to 0.14 M and 0.28 M leads to even denser and more intricate petal-like structures. This complexity can be attributed to the greater availability of zinc ions, promoting the preferential attachment of growth units on specific crystal facets, as described in recent study.19 At the highest studied concentration of 0.56 M, a transition from rods and flowers to sheet-like structures was observed. This morphology indicates a dominance of lateral growth processes, possibly due to the saturation of the solution with zinc ions. Such an environment might lead to a diffusion-limited growth regime, where the formation of new nuclei is suppressed in favor of the expansion of existing structures, thus promoting the development of sheet-like formations.25,26 Another explanation for the change in morphology is the relative concentration of OH− as compared to Zn2+, as larger OH− concentration cause anisotropic growth in the (0001) direction, leading to rod morphology.15
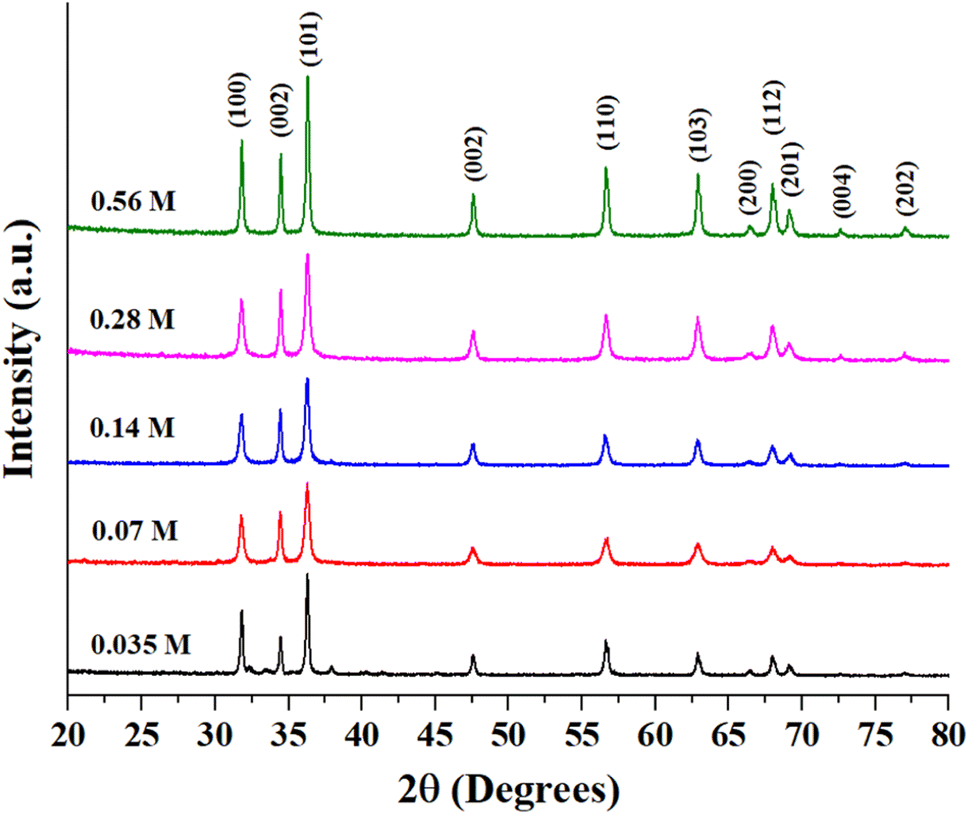
Fig. S1 (ESI)† shows the EDX analysis results of as-prepared ZnO samples. The Zn-to-O ratio is roughly equivalent to 1:1, with slight variances due to the semi-quantitative nature of EDX analysis. Fig. 2 presents the XRD patterns of as-synthesized ZnO structures. All of the observed diffraction peaks can be indexed to the hexagonal phase of zinc oxide, which corresponds to the wurtzite structure with the space group P63mc (JCPDS No. 00-036-1451). The absence of other peaks associated with impurities in the diffraction pattern indicates the formation of pure ZnO structures. Notably, the diffraction peaks corresponding to the 0.56 M ZnO structure are more sharp and intense than those at other concentrations. The mean crystallite size, the lattice strain, and dislocation density of the prepared ZnO structures have been calculated using XRD data and presented in Table 1. The bandgap of all ZnO structures was also estimated using the Tauc equation as shown in Fig. S2 (ESI)† and estimated bandgap values were also tabulated in Table 1. It is well-known that bandgap values and crystallite sizes are highly dependent on the precursor type, concentration and synthesis conditions.27 While the bandgap energy of prepared ZnO structures remains relatively constant, variations in Zn precursor concentration can still influence its photocatalytic behavior. Other factors such as crystallinity and surface area can further contribute to improving photocatalytic performance. Rod-shaped particles typically exhibit more uniform strain distribution and fewer surface defects, which might explain the relatively lower dislocation density and moderate strain in this sample. The flower-shaped morphology has a higher surface area and more irregularities, leading to a significant increase in dislocation density and strain. Smaller crystallite sizes can also increase lattice imperfections, contributing to higher strain and dislocation densities. 0.14-ZnO and 0.28-ZnO having densely packed structures, show intermediate values of dislocation density and strain. The packing might help in somewhat stabilizing the structure compared to loosely packed structures, but still higher than rods due to more complex surfaces. Sheets, being flat and extended, tend to have lower dislocation densities similar to rods but with slightly different strain characteristics due to their two-dimensional nature, which might allow for more uniform stress distribution across the plane.
Table 1 Average crystallite size, lattice strain, dislocation density, and bandgap values of prepared ZnO structures
| Sample |
Crystallite size, nm |
δ × 10 −3 (nm−2) |
ε × 10 −3 |
Bandgap, eV |
| 0.035 M-ZnO |
47.7 |
0.46 |
1.81 |
2.84 |
| 0.07 M-ZnO |
22.4 |
2.36 |
3.86 |
2.98 |
| 0.14 M-ZnO |
29.3 |
1.30 |
3.05 |
2.89 |
| 0.28 M-ZnO |
30.4 |
1.30 |
2.93 |
2.87 |
| 0.56 M-ZnO |
48.4 |
0.44 |
1.79 |
2.89 |
 |
| | Fig. 2 XRD patterns of as-prepared ZnO particles. | |
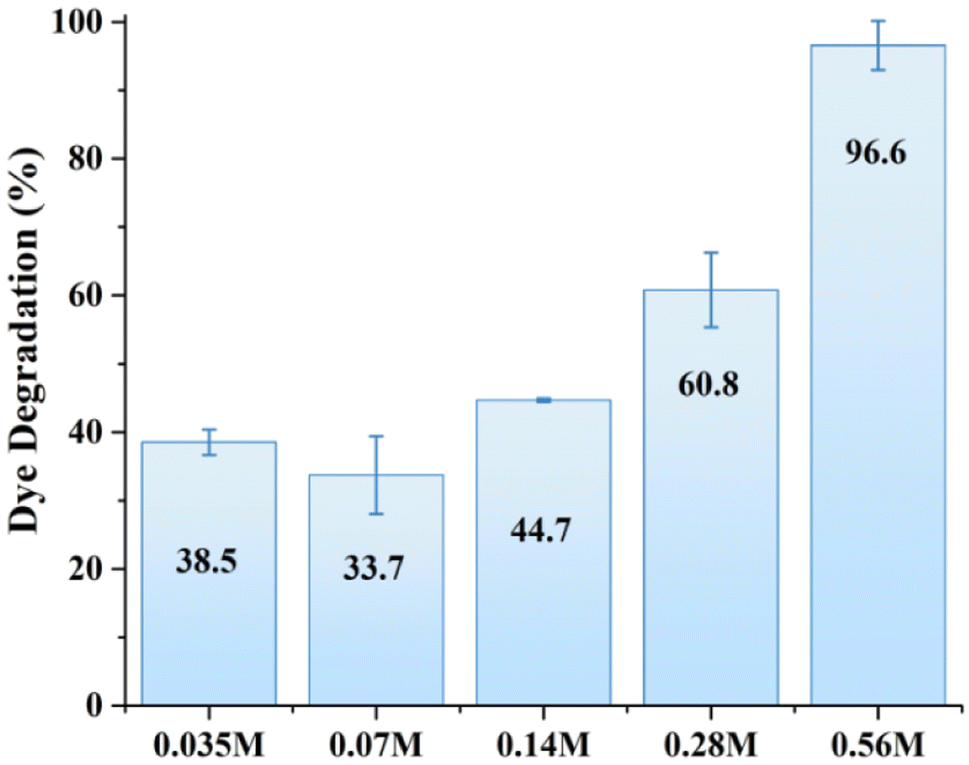
The photocatalytic activity of all samples was initially investigated under identical conditions (2 mg of photocatalyst, 30 mL of MB solution with a molar concentration of 3 × 10⁻⁵ M) under simulated solar light conditions for comparison purposes. The experiments were conducted under neutral pH conditions to ensure the stability of ZnO, which is known to degrade at lower or higher pH values. Fig. 3 shows the corresponding degradation of MB by various ZnO structures within 40 min of solar light illumination. The MB degradation showed a positive correlation with the molar concentration of zinc precursor, with a marked increase in efficiency at higher Zn precursor concentrations. Notably, the 0.56 M ZnO photocatalyst demonstrated exceptional degradation efficiency, reaching 96.6%. Photocatalytic activity exhibited by the higher molar concentration of zinc precursor can be attributed to the increased crystallite size of the catalyst, as demonstrated by XRD analysis. For photocatalytic applications, the size of the crystallites can impact the material's properties, including the surface area and the number of active sites available for the catalytic reaction.18 One can notice that MB degradation increased with the increase in crystallite size. For example, a similar trend have been reported earlier,28 where 500 nm ZnO particles with the surface area of 3.7 m2 g−1 demonstrated better phenol photodegradation as compared to 50 nm ZnO nanoparticles with a surface area of 12.4 m2 g−1. This can be attributed to the significant impact of the synthesis parameters on the surface morphology and internal structure of ZnO.29 Overall, while smaller crystallite sizes often correlate with higher surface area and better charge carrier dynamics, larger crystallites can still exhibit better photocatalytic activity due to factors such as surface defects, charge transfer mechanisms, and crystal facet effects. Consequently, 0.56 M-ZnO photocatalyst with high photocatalytic activity has been selected further for a detailed analysis.
 |
| | Fig. 3 MB dye photodegradation by various ZnO structures. | |
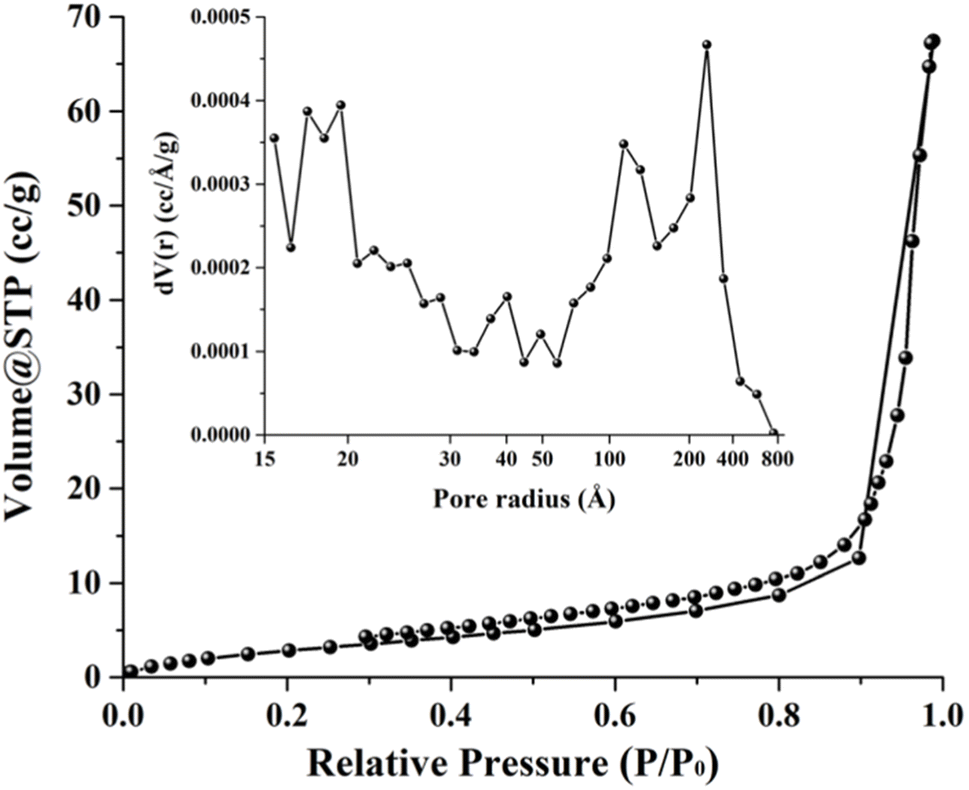
Fig. 4 depicts a nitrogen adsorption–desorption isotherm for 0.56 M-ZnO photocatalyst, indicating a type IV isotherm with H3 hysteresis loop and wedge-shaped pores. The surface area determined by the Brunauer–Emmett–Teller (BET) method was ∼12.42 m2 g−1. The Barrett–Joyner–Halenda (BJH) method was additionally employed to analyze the pore size distribution, as shown in the inset of Fig. 4. The findings from this study revealed a mesoporous structure with pore diameters in the range of ∼3–8 nm, accompanied by meso- and macropores with diameters ranging from ∼14 to 80 nm. Hence, the high photocatalytic activity of 0.56 M-ZnO photocatalyst can be attributed to high surface area and porosity of the photocatalyst, which facilitates the mass transport of the reactants and products in pores during the degradation process.30
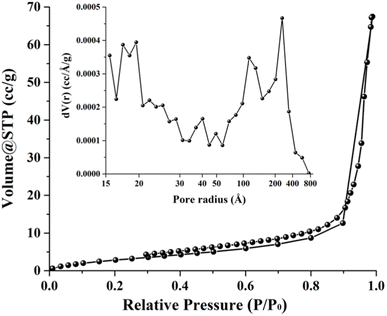 |
| | Fig. 4 Nitrogen adsorption–desorption isotherms and BJH pore size distribution (inset) of 0.56 M-ZnO photocatalyst. | |
Fig. 5A shows MB degradation under solar irradiation by comparing the performance of MB self-degradation, MB with H2O2, and MB with H2O2 and 0.56 M-ZnO–H2O2 photocatalyst. One can notice that MB alone exhibits a negligible self-degradation, with only 10% degradation after 40 minutes of exposure to solar light. The introduction of H2O2 results in a threefold increase of degradation, reaching ∼32%. On the other hand, the combination of 0.56 M-ZnO photocatalyst with H2O2 significantly amplifies the degradation rate, achieving a remarkable 96.6% MB degradation within the same time period. The kinetic analysis further substantiates the enhanced performance of the ZnO–H2O2 system. The photodegradation rates derived from the kinetic plots (Fig. 5b) yielded average rate constants of ∼0.0025 min−1 for MB self-degradation, ∼0.0097 min−1 for the H2O2-assisted process, and a markedly higher value of 0.1131 min−1 for the MB degradation in the presence of 0.56 M-ZnO. This corresponds to a 45-fold acceleration in the degradation rate as compared to bare MB self-degradation process. Fig. S3 (ESI)† shows the impact of various 0.56 M-ZnO concentrations on the photocatalytic degradation of MB. The results demonstrate that 92.8% degradation of MB is possible at a catalyst dosage of 33.3 mg L−1 after 40 minutes, emphasizing the efficiency and practicality of this material in photocatalytic dye degradation. Employing larger concentrations of 0.56 M-ZnO did not result in appreciable higher MB degrading efficiency. Furthermore, XRD analysis of 0.56 M-ZnO after MB degradation have been conducted and presented in Fig. S4 (ESI).† According to the XRD results, no changes in structure of ZnO were observed which confirms the structural stability of the catalyst.
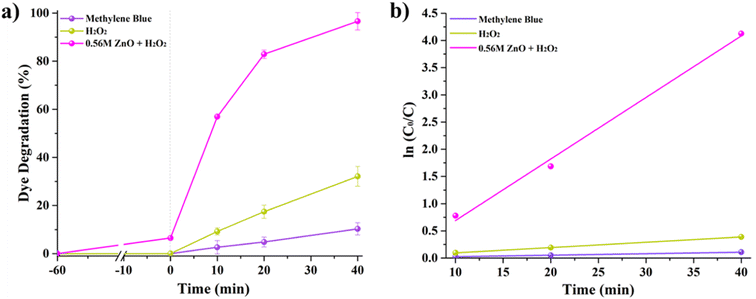 |
| | Fig. 5 MB dye photodegradation (a) and linear fitting (b) of ln(Co/C) as a function of time. | |
A photocatalytic activity of as-prepared 0.56 M-ZnO was found to be higher compared to other doped- or surface-modified ZnO structures reported to date.31,32 Comparison with other ZnO-based photocatalysts for MB degradation only was also performed, and the results are presented in Table 2. Data analysis clearly shows that the majority of the works employed substantially higher H2O2 concentrations and catalyst dosages. Moreover, the photocatalytic degradation experiments lasted from 45 to 180 minutes, which is longer than that reported in the current work. Hence, prepared 0.56 M-ZnO sample can be employed as efficient and low-cost photocatalyst for degradation of organic pollutants in water. It should be mentioned that we restricted our photocatalytic activity tests to neutral pH only due to the amphoteric nature of zinc oxide, which can react with both alkalis and acids to form salt and water. However, slightly acidic or basic effluent can be easily rectified to a neutral pH prior to photocatalyst introduction.
Table 2 Comparison of ZnO-based photocatalytic systems for MB degradation under solar light
| Catalyst |
Catalyst dosage (mg L−1) |
H2O2, (μL L−1) |
MB, (mg L−1) |
MB degradation, (%) |
Time, min |
k, min−1 |
Ref. |
| ZnO/montmorillonite |
200 |
Not specified |
10 |
97 |
150 |
— |
33 |
| Mn–ZnO |
100 |
Not specified |
30 |
95 |
180 |
0.0165 |
34 |
| Co–ZnO |
154 |
1538 |
10 |
99.6 |
45 |
0.082 |
35 |
| RGO-Ag/ZnO |
500 |
5000 |
10 |
99 |
90 |
— |
36 |
| ZnO multi-pods |
5 |
400 |
1.2 |
97 |
120 |
0.034 |
37 |
| ZnO sheets |
66.7 |
167 |
9.6 |
96.6 |
40 |
0.1131 |
This work |
A noticeable enhancement in photocatalytic activity of ZnO structures when used in conjunction with H2O2 could be ascribed to the advanced oxidation processes (AOPs), where H2O2 produces significant amount of hydroxyl radicals (˙OH). These radicals are known for their high reactivity and their ability to non-selectively oxidize and decompose complex organic structures, which makes them highly efficient for water treatment processes. The overall process of MB photodegradation in the presence of ZnO and H2O2 are represented by reactions (1)–(6) and schematically shown in Fig. 6.
| | |
hv + ZnO → ZnO* (hVB+ + eCB−)
| (1) |
| | |
O2˙− + H2O2 → OH− + ˙OH + O2
| (4) |
| | |
eCB− + H2O2 → OH− + ˙OH
| (5) |
| | |
˙OH + O2˙− + MB → Degradation products
| (6) |
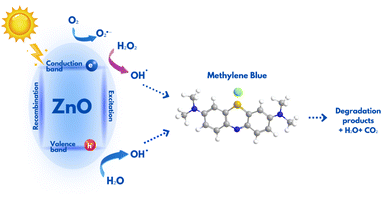 |
| | Fig. 6 Schematic representation of MB degradation in the presence of ZnO photocatalyst. | |
The presence of common CO32−, NO3−, Cl−and HCO3− anions had dual effects on the degradation of MB over ZnO structures. For example, chloride, nitrate, and bicarbonate ions resulted in a certain degree of MB degradation efficiency reduction as shown in Fig. 7. On the other hand, MB degradation was enhanced in the presence of carbonate anions. In general, carbonate ions can react with the photogenerated holes or with hydroxyl radicals to form carbonate radicals, which are less reactive, but possess selectivity towards some organic substances. In other words, these carbonate radicals can introduce a secondary pathway for the degradation of organic compounds, which could be more effective for certain compounds, thereby improving the overall degradation efficiency.38 It should be noted that these anions are taken close to natural conditions or in excess; therefore it is projected that the photocatalytic activity of the 0.56 M-ZnO structure will remain at more than 70% efficiency upon contact with wastewater containing these anions.
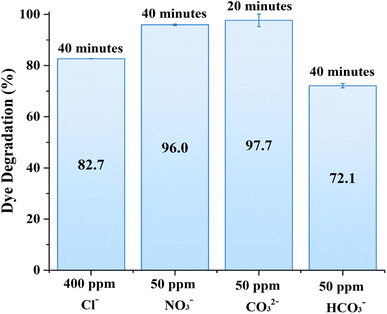 |
| | Fig. 7 Effects of various anions presence on MB photodegradation by 0.56 M-ZnO photocatalyst. | |
4. Conclusion
In this study, we explored the morphological evolution of ZnO from rod-like to sheet-like structures by changing the Zn precursor concentration. The photocatalytic activity of produced ZnO structures was assessed by MB dye degradation under simulated solar light illumination. We found that a sample with a sheet-like structure denoted as 0.56 M-ZnO photocatalyst, demonstrated the highest photocatalytic activity under solar light illumination. Combining H2O2 with 0.56 M-ZnO photocatalyst accelerates the MB degradation rate by 45-fold (0.1131 min−1) as compared to self-degradation of MB (0.0025 min−1), resulting in decolorization of concentrated MB solution just in 40 minutes. We additionally demonstrated that more than 70% of MB dye can still be degraded in water containing NO3−, Cl− and HCO3− anions, suggesting that the 0.56 M-ZnO photocatalyst is suitable for practical wastewater treatment at neutral pH conditions. The remarkable catalytic activity of 0.56 M-ZnO photocatalyst was attributed to its highly crystalline structure, a large surface area, and increased production of hydroxyl radicals from H2O2 under solar light irradiation. The proposed methodology for synthesizing ZnO photocatalysts shows promise for real-time applications in wastewater treatment, and further research and development are needed to address scalability, long-term stability, and potential challenges associated with real-world wastewater matrices and scale-up costs.
Conflicts of interest
The authors declare that they have no known competing financial interests or personal relationships that could have appeared to influence the work reported in this paper.
Acknowledgements
This research was funded by Nazarbayev University FDCRDG (Grant No. 20122022FD4111).
References
- S. Paul, R. Pegu, S. Das, K. H. Kim and S. S. Bhattacharya, Environ. Res., 2023, 216, 114693 CrossRef CAS PubMed.
- A. Tkaczyk, K. Mitrowska and A. Posyniak, Sci. Total Environ., 2020, 717, 137222 CrossRef CAS PubMed.
- V. Selvaraj, T. Swarna Karthika, C. Mansiya and M. Alagar, J. Mol. Struct., 2021, 1224, 129195 CrossRef CAS.
- R. Kalaivizhi, B. Danagody and A. Yokesh, Adv. Mater., 2022, 3, 8534–8543 RSC.
- H. M. El-Bery, M. Saleh, R. A. El-Gendy, M. R. Saleh and S. M. Thabet, Sci. Rep., 2022, 12, 5499 CrossRef CAS PubMed.
- S. Ihaddaden, D. Aberkane, A. Boukerroui and D. Robert, J. Water Process Eng., 2022, 49, 102952 CrossRef.
- A. Y. Goren, Y. K. Recepoǧlu, Ö. Edebali, C. Sahin, M. Genisoglu and H. E. Okten, ACS Omega, 2022, 7, 32640–32652 CrossRef CAS PubMed.
- N. Tyagi, G. Sharma, D. Kumar, P. Pratap Neelratan, D. Sharma, M. Khanuja, M. K. Singh, V. Singh, A. Kaushik and S. K. Sharma, Coord. Chem. Rev., 2023, 496, 215394 CrossRef CAS.
- S. Em, M. Yedigenov, L. Khamkhash, S. Atabaev, A. Molkenova, S. G. Poulopoulos and T. S. Atabaev, Nanomaterials, 2022, 12, 2882 CrossRef CAS PubMed.
- V. Misra, V. Singh, A. Singh, D. Kumar and S. K. Sharma, Appl. Surf. Sci. Adv., 2023, 18, 100491 CrossRef.
- H. Liu, Y. Liu, X. Wang, P. Qiao, W. Wang, M. Zhang, Y. Liu and H. Song, React. Chem. Eng., 2024, 9, 861–871 RSC.
- T. S. Atabaev, J. Adv. Ceram., 2015, 4, 61–64 CrossRef CAS.
- E. Skripkin, A. A. Podurets, D. Kolokolov, A. Burmistrova, N. Bobrysheva, M. Osmolowsky, M. A. Voznesenskiy and O. Osmolovskaya, ACS Appl. Nano Mater., 2024, 7, 6093–6108 CrossRef CAS.
- M. S. Chavali and M. P. Nikolova, SN Appl. Sci., 2019, 1, 607 CrossRef CAS.
- H. Lim, M. Yusuf, S. Song, S. Park and K. H. Park, RSC Adv., 2021, 11, 8709–8717 RSC.
- K. Preeti, A. Kumar, N. Jain, A. Kaushik, Y. K. Mishra and S. K. Sharma, Mater. Today Sustain., 2023, 24, 100515 CrossRef.
- S. Sadyk and T. S. Atabaev, Key Eng. Mater., 2018, 779, 97–101 Search PubMed.
- E. Kusiak-Nejman, J. Wojnarowicz, A. W. Morawski, U. Narkiewicz, K. Sobczak, S. Gierlotka and W. Lojkowski, Appl. Surf. Sci., 2021, 541, 148416 CrossRef CAS.
- S. Rajamanickam, S. M. Mohammad and Z. Hassan, Colloid Interface Sci. Commun., 2020, 38, 100312 CrossRef CAS.
- N. P. Rini, N. I. Istiqomah, Sunarta and E. Suharyadi, Case Stud. Chem. Environ. Eng., 2023, 7, 100301 CrossRef CAS.
- K. Gupta, B. Sharma, V. Garg, P. P. Neelratan, V. Kumar, D. Kumar and S. K. Sharma, Hybrid Adv., 2024, 5, 100160 CrossRef.
- R. Mahdavi and S. S. A. Talesh, Adv. Powder Technol., 2017, 28, 1418–1425 CrossRef CAS.
- H. Lu, S. Sha, T. Li, Q. Wen, S. Yang, J. Wu, K. Wang, Z. Sheng and J. Ma, Front. Chem., 2022, 10, 1061129 CrossRef CAS PubMed.
- J. Wojnarowicz, T. Chudoba and W. Lojkowski, Nanomaterials, 2020, 10, 1086 CrossRef CAS PubMed.
- H. R. Guzmán-Carrillo, E. M. Rivera-Muñoz, N. Cayetano-Castro, R. Herrera-Basurto, Z. Barquera-Bibiano, F. Mercader-Trejo and A. Manzano-Ramírez, Mater. Res. Bull., 2017, 90, 138–144 CrossRef.
- B. Clarke and K. Ghandi, Small, 2023, 19, 2302864 CrossRef CAS PubMed.
- N. Kamarulzaman, N. Kasim and R. M. F. Rusdi, Nanoscale Res. Lett., 2015, 10, 346 CrossRef PubMed.
- X. Xu, Z. Yi, D. Chen, X. Duan, Z. Zhou, X. Fan and M. Jiang, Rare Met., 2011, 30, 188–191 CrossRef CAS.
- R. Krishnan, S. N. Shibu, D. Poelman, A. K. Badyal, A. K. Kunti, H. C. Swart and S. G. Menon, Mater. Today Commun., 2022, 32, 103890 CrossRef CAS.
- X. He, Y. Yang, Y. Li, J. Chen, S. Yang, R. Liu and Z. Xu, Appl. Surf. Sci., 2022, 599, 153898 CrossRef CAS.
- S. Kumar, S. K. Sharma, R. D. Kaushik and L. P. Purohit, Mater. Today Chem., 2021, 20, 100464 CrossRef CAS.
- S. K. Sharma, R. Gupta, G. Sharma, K. Vemula, A. R. Koirala, N. K. Kaushik, E. H. Choi, D. Y. Kim, L. P. Purohit and B. P. Singh, Mater. Today Chem., 2021, 20, 100452 CrossRef CAS.
- I. Fatimah, S. Wang and D. Wulandari, Appl. Clay Sci., 2011, 53, 553–560 CrossRef CAS.
- A. Dhivya, R. Yadav and C. Stella Packiam, Mater. Today Proc., 2019, 48, 494–501 Search PubMed.
- O. A. Zelekew, S. G. Aragaw, F. K. Sabir, D. M. Andoshe, A. D. Duma, D. H. Kuo, X. Chen, T. D. Desissa, B. B. Tesfamariam, G. B. Feyisa, H. Abdullah, E. T. Bekele and F. G. Aga, Mater. Res. Express, 2021, 8, 025010 CrossRef CAS.
- N. Belachew, M. H. Kahsay, A. Tadesse and K. Basavaiah, J. Environ. Chem. Eng., 2020, 8, 104106 CrossRef CAS.
- A. Mohammadzadeh, M. Khoshghadam-Pireyousefan, B. Shokrianfard-Ravasjan, M. Azadbeh, H. Rashedi, M. Dibazar and A. Mostafaei, J. Alloys Compd., 2020, 845, 156333 CrossRef CAS.
- O. N. E. H. Kaabeche, R. Zouaghi, S. Boukhedoua, S. Bendjabeur and T. Sehili, Int. J. Chem. React. Eng., 2019, 17, 20180253 Search PubMed.
|
| This journal is © The Royal Society of Chemistry 2024 |
Click here to see how this site uses Cookies. View our privacy policy here. 
 Open Access Article
 This Open Access Article is licensed under a Creative Commons Attribution-Non Commercial 3.0 Unported Licence
 a,
Madi Sabyr‡b,
Yerkanat N. Kanafin
a,
Madi Sabyr‡b,
Yerkanat N. Kanafin