DOI:
10.1039/D4RA02300E
(Paper)
RSC Adv., 2024,
14, 15987-15993
Impact of self-assembled structure on ionic conductivity of an azobenzene-containing electrolyte†
Received
26th March 2024
, Accepted 12th May 2024
First published on 17th May 2024
Abstract
The type of self-assembled structure has a significant impact on the ionic conductivity of block copolymer or liquid crystalline (LC) ion conductors. In this study, we focus on the effect of self-assembled structures on the ionic conductivity of a non-block copolymer, LC ion conductor, which is a mixture of an azobenzene monomer (NbAzo), pentaerythritol tetre(3-mercapropionate) (PETMP), and a lithium salt, lithium bis(trifluoromethane)sulfonimide (LiTFSI). The self-assembled structures and ionic conductivities of ion conductors having different doping ratios of lithium salt to monomer were examined. With the increase in the doping ratio, the self-assembled structure transforms from lamellae (LAM) to double gyroid (GYR). The effect of self-assembled structure on ionic conductivity was analyzed; it was found that the conductivity of the GYR structure was about 3.6 times that of the LAM one, indicating that obtaining the GYR structure is more effective in improving ionic conductivity.
Introduction
Lithium batteries have been widely used and researched owing to their excellent performance. However, safety issues such as flammability still exist for lithium batteries usually using liquid organic electrolytes.1–3 Therefore, solid-state electrolytes (SSEs) are regarded as one of the most promising strategies to replace traditional organic electrolytes in achieving high safety and improved performance for lithium batteries.4 Among them, solid polymer electrolytes (SPEs) have attracted attention because of their easy synthesis, low mass density, low cost, excellent processability, and safety.5–8
In 1975, Wright et al. discovered that alkali metal salts dissolved in polyethylene oxide (PEO) exhibited ionic conductivity, leading to the study of ion-conducting polymers.9 PEO contains abundant ether oxygen groups that allow for the formation of complexes with lithium ions, enabling them to move along the amorphous polymer chain for ion conduction. In 2001, Gadjourova et al. reported that the ionic conductivity (σ) in a statically ordered environment was higher than that in a dynamic, disordered environment above the glass transition temperature (Tg).10 Block copolymer (BCP) ion conductors with different microphase-separated structures (lamellae (LAM), double gyroid (GYR), and cylinders (CYL)) offer a choice for forming ion conducting channels while maintaining mechanical integrity.11–15
Villaluenga et al. have correlated the ionic conductivity of ion conductors with different microphase-separated structures to the corresponding shape factors, where each microphase-separated structure has a corresponding ideal shape factor (fideal): for the sphere morphology, fideal is 0; for CYL, it is 1/3; for LAM, fideal is 2/3. And for GYR, fideal is 1, because all grain orientations are effective for ion transport in the GYR microstructure.16 However, the limited region of the GYR structure in the phase diagram makes it challenging to prepare GYR-phase ion conductors, resulting in few reports on this topic.11,17–19 Jo et al. altered the end groups in the PEO block of polystyrene-block-poly(ethylene oxide) (PS-b-PEO) to generate diverse microphase-separated structures.20 Specifically, when the end group was sulfonic acid with r = 0.06 (where r = [Li+]/[EO]), the polymer exhibited the GYR structure and displayed higher ionic conductivity than polymers with other end groups. Lee and colleagues developed co-continuous structures of an elastomer electrolyte embedded with plastic crystals (PCEE) using the polymer-induced phase separation (PIPS) technique within the cell.21 By employing succinonitrile (SN) as a plastic crystal complexed with lithium bis(trifluoromethane)sulfonimide (LiTFSI) and poly(ethylene glycol) diacrylate (PEGDA)/butyl acrylate (BA) as elastomers, a three-dimensionally (3D) interconnected ion-conductive material was formed. The PCEE exhibited both superior mechanical properties and high ionic conductivity (1.1 mS cm−1 at 20 °C) with a high Li-ion transference number (t+) of 0.75. In addition, the in situ-formed PCEE within the cells (so called “built-in PCEE”) effectively accommodated the substantial volume changes of Li during fast charge–discharge cycling owing to its mechanical elasticity. This elastomeric electrolyte system presented a promising strategy for achieving high-performance and stable solid-state lithium metal batteries (LMBs).
On the other hand, because ionic conductive liquid crystalline (LC) materials possess formidable ionic conductivity and robust rigidity, they are promising as advanced electrolytes in Li-ion batteries.22 In 2015, Kato et al. reported the use of an LC electrolyte in Li-ion batteries.23 They covalently connected the hydrophilic and LC parts to construct nanoscale ion pathways within LC ordered structures and obtained electrolytes with moderate ionic conductivities in the order of 10−6–10−5 S cm−1. Ober et al. prepared an LC thin film that consisted of an electronically conducting quarter-thiophene (4T) block terminated at both ends by ionically conducting oligoethylenoxide (PEO4) blocks.24 At a moderate LiTFSI content, the homogeneous 4T/PEO4 thin film demonstrated an electrical conductivity of up to 3.1 × 10⁻³ S cm−1 following vapor infiltration with the chemical dopant, 2,3,5,6-tetrafluoro-7,7,8,8-tetracyanoquinodimethane (F4TCNQ), while its ionically conductive capabilities were retained.
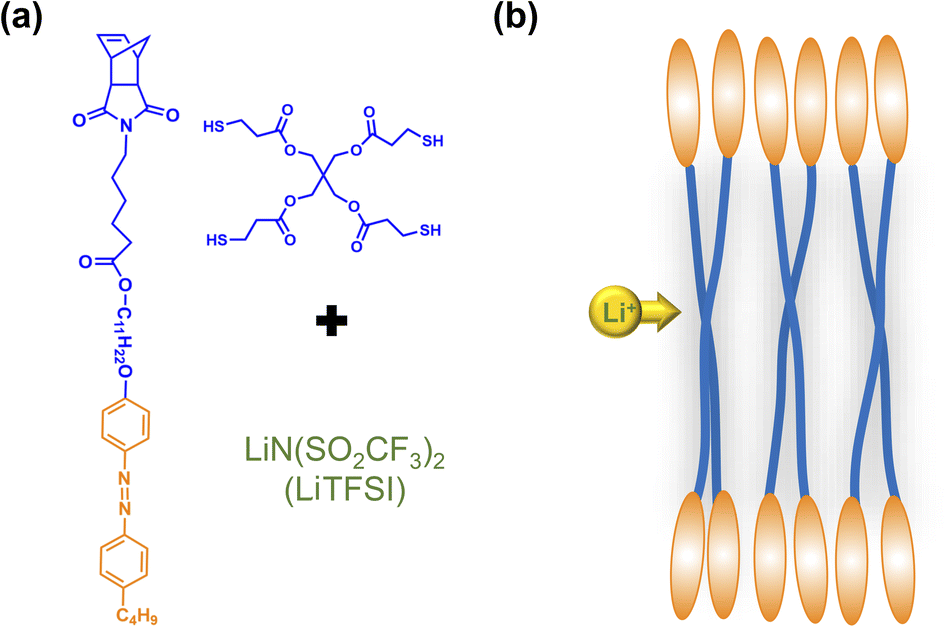
In this study, we synthesized an azobenzene-containing norbornene monomer NbAzo that was then mixed with pentaerythritol tetrakis(3-mercaptopropionate) (PETMP) in varying ratios subjected to click chemistry, and the resultant was subsequently doped with a lithium salt LiTFSI (Fig. 1). By adjusting the content of the lithium salt, we were able to obtain ionic conductors with different self-assembled structures including LAM and GYR. The ionic conductivities of the ion conductors were tested and the impact of the self-assembled structure on the ionic conductivity was assessed.
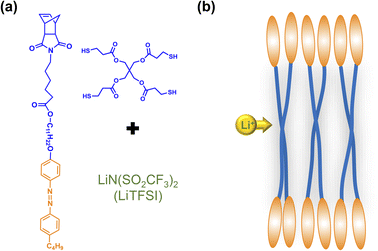 |
| | Fig. 1 Chemical structures of the monomer NbAzo, coupling agent PETMP, and the lithium salt (a) and the schematic diagram of the transport of Li+ in the electrolyte (b). | |
Experimental
Materials
Tetrahydrofuran (THF, HPLC grade) was purified using an M Braun SPS-800 solvent processing system to remove dissolved oxygen and water. LiTFSI was kept at 110 °C under vacuum for at least 24 h before use. All other reagents were used as received without any purification.
Synthesis
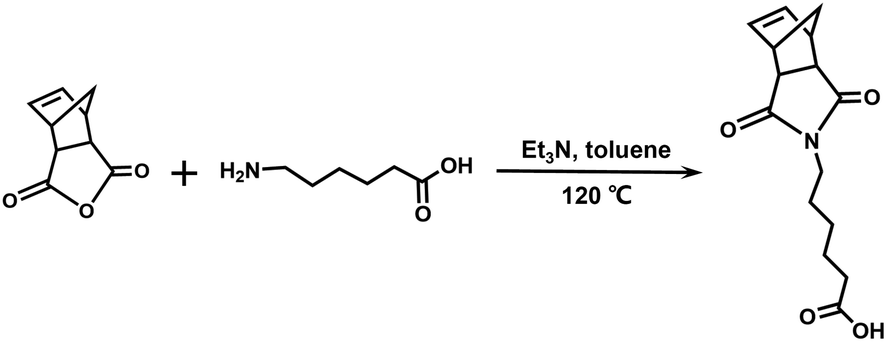
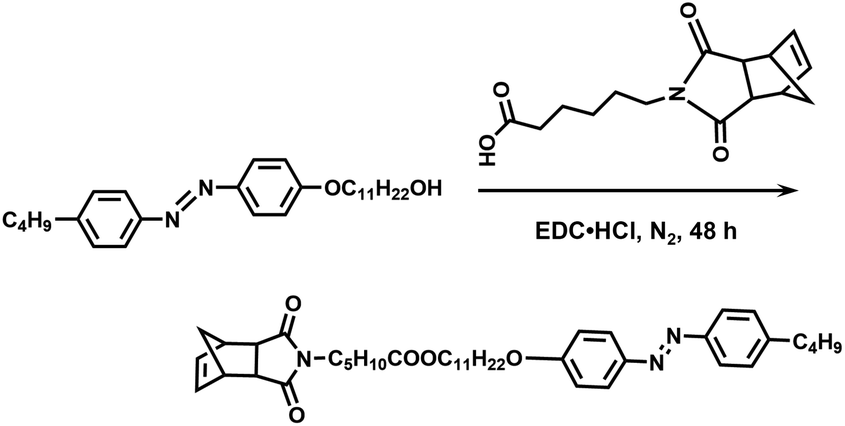
Synthesis of NbCOOH. The synthetic route is shown in Scheme 1. cis-5-Norbornene-exo-2,3-dicarboxylic anhydride (1.00 eq., 4.00 g, 24.4 mmol), 6-aminocaproic acid (1.00 eq., 3.20 g, 24.4 mmol), trimethylamine (0.100 eq., 0.340 mL, 2.44 mmol), and 60 mL of toluene were added into a 100 mL flask. After being refluxed at 120 °C for 12 h, the solution was condensed, and 50 mL of CH2Cl2 was added. The solution was washed with water and brine three times and dried with Na2SO4. The white solid was collected after the removal of the solvent.
 |
| | Scheme 1 Synthetic route of NbCOOH. | |
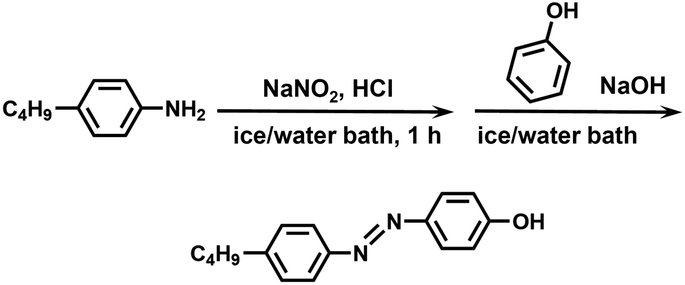
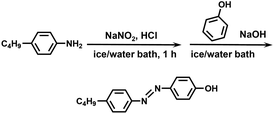
Synthesis of C4AzoOH. The synthetic route is shown in Scheme 2. 4-n-Butylaniline (3.14 g, 21.0 mmol), HCl (12 M, 5.30 mL, 63.0 mmol), and 50 mL of deionized water were added into a 250 mL flask with a stir bar, and then the solution was put in an ice/water bath. Sodium nitrite (1.76 g, 25.0 mmol) dissolved in 40 mL of deionized water was added dropwise to the abovementioned solution. And then the mixed solution reacted for another hour to form the solution A. Phenol (2.17 g, 23.0 mmol), sodium hydroxide (0.840 g, 21.0 mmol), sodium carbonate (2.25 g, 21.0 mmol), and 50 mL of deionized water were charged into a 250 mL flask with a stir bar, and then the mixture was cooled to below 5 °C to obtain the solution B. Then the solution A was slowly added into the solution B that was kept in an ice/water bath. After the addition, the ice/water bath was removed, and the mixed solution reacted at ambient temperature for 2 h. When the reaction was completed, the reaction solution was neutralized with dilute hydrochloric acid. The resulting precipitate was filtered, washed with deionized water, and dried to give a crude product. The crude product was recrystallized from petroleum ether to give a dark yellow solid. Yield: 90%. 1H NMR (400 MHz, CDCl3, CDCl3, δ, ppm, ppm): 7.87 (m, 2H), 7.81 (m, 2H), 7.30 (m, 2H), 6.94 (m, 2H), 2.68 (t, 2H), 1.64 (m, 2H), 1.38 (h, 2H), 0.94 (t, 3H).
 |
| | Scheme 2 Synthetic route of C4AzoOH. | |
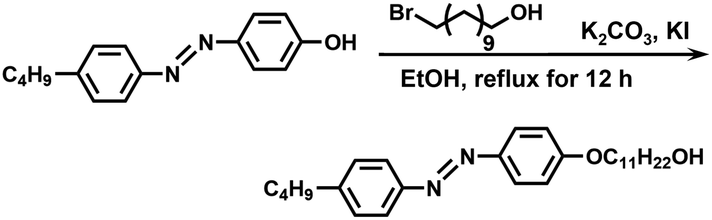
Synthesis of C4AzoC11OH. The synthetic route is shown in Scheme 3. C4AzoOH (5.08 g, 20.0 mmol), 11-bromo-1-undecyl alcohol (5.02 g, 20.0 mmol), potassium iodide (35.2 mg, 0.200 mmol), potassium carbonate (11.0 g, 80.0 mmol), and 150 mL of anhydrous ethanol were filled into a flask with a stir bar, and then the mixture was refluxed overnight. After filtration, the crude product was recrystallized from anhydrous ethanol to give bright yellow crystals. Yield: 80%. 1H NMR (400 MHz, CDCl3, δ, ppm): 7.89 (m, 2H), 7.80 (m, 2H), 7.30 (m, 2H), 6.99 (m, 2H), 4.03 (t, 2H), 3.64 (t, 2H), 2.68 (t, 2H), 1.80 (m, 2H), 1.25–1.69 (m, 21),0.94 (t, 3H).
 |
| | Scheme 3 Synthetic route of C4AzoC11OH. | |
Synthesis of NbAzo. The synthetic route is shown in Scheme 4. NbCOOH (1.20 eq., 1.97 g, 7.12 mmol), C4AzoC11OH (1.00 eq., 2.71 g, 5.93 mmol), and 80 mL of CH2Cl2 were added into a 150 mL flask. 1-Ethyl-3-(3-dimethylamino-propyl) carbodiimide hydrochloride (EDC HCl, 2.40 eq., 2.72 g, 14.2 mmol) and 4-(dimethylamino) pyridine (DMAP, 0.200 eq., 0.145 g, 1.18 mmol) were added into the solution slowly. After being stirred at ambient temperature for 36 h, the solution was condensed and washed with 1 M HCl aqueous solution. Then the resulting solution was washed with brine three times and dried with Na2SO4. The crude product was recrystallized from anhydrous ethanol to give bright yellow crystals. 1H NMR (400 MHz, CDCl3, δ, ppm): 7.90 (m, 2H), 7.81 (m, 2H), 7.30 (m, 2H), 7.00 (m, 2H), 6.28 (m, 2H), 4.04 (t, 4H), 3.46 (t, 2H), 3.26 (m, 2H), 2.68 (t, 4H), 2.29 (t, 2H), 1.82 (m, 4H), 1.25–1.69 (m, 24H), 0.94 (t, 3H). 1H NMR, 13C NMR, and MS spectra of NbAzo are shown in Fig. S1 of ESI.†
 |
| | Scheme 4 Synthetic route of NbAzo. | |
Preparation of ion conductor
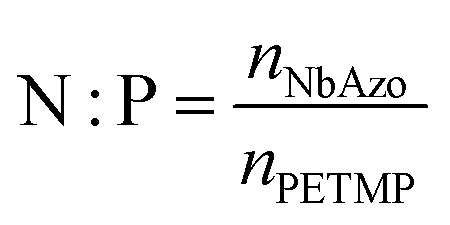
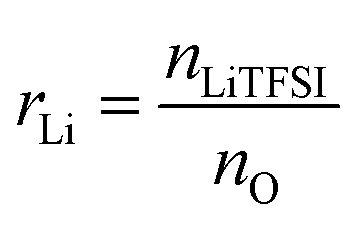
NbAzo, PETMP, LiTFSI, and ethyl phenyl(2,4,6-trimethylbenzoyl) phosphinate (TPO-L, photo initiator, 2 wt%) at a certain molar ratio were mixed thoroughly and subjected to photoreaction under UV light. The resulting ion conductor was annealed in a vacuum oven at 65 °C for 24 hours. N![[thin space (1/6-em)]](https://www.rsc.org/images/entities/char_2009.gif) :P is defined as the molar doping ratio of NbAzo to PETMP (eqn (1)), while rLi is defined as the molar doping ratio of lithium salt to oxygen atom (eqn (2)).
:P is defined as the molar doping ratio of NbAzo to PETMP (eqn (1)), while rLi is defined as the molar doping ratio of lithium salt to oxygen atom (eqn (2)).| |
 | (1) |
| |
 | (2) |
In the equations, nNbAzo, nPETMP, nLiTFSI, and nO represent the molar amounts of NbAzo, PETMP, LiTFSI, and oxygen atom.
FT-IR spectroscopy analysis
The samples were thoroughly mixed and ground with KBr and then pressed into thin sheets for testing in a consistent manner. FT-IR spectroscopy was performed using Fourier transform infrared spectrometer, nicolet is 50, and analyzed in the frequency of 4000 to 400 cm−1 with a scanning resolution of 4 cm−1.
Nanostructure/morphology characterization
The nanostructures or morphologies of the ion conductors were investigated with medium-angle X-ray scattering (MAXS) which was conducted using a Ganesha SAXS Lab instrument with CuKα radiation (λ = 1.5406 Å).
Ionic conductivity measurements
Disc-shaped samples were put into two stainless steel (SS) electrodes to form SS/electrolyte/SS coin cells. The ionic conductivity was examined using a CHI660E electrochemical workstation and electrochemical impedance spectroscopy over a frequency range between 1 MHz and 0.1 Hz with an amplitude of 50 mV.
Thermogravimetric analysis (TGA) measurements
TGA experiments were performed on a TA Q600 SDT instrument at a heating rate of 10 °C min−1 under nitrogen. The TGA result of one electrolyte sample is shown in Fig. S2.†
Differential scanning calorimetry (DSC) measurements
DSC was performed on a TA Q100 DSC instrument. The first-cooling curve at a rate of 10 °C min−1 and the second-heating curve at a rate of 10 °C min−1 under a nitrogen atmosphere were recorded. The DSC result of one electrolyte sample is shown in Fig. S3.†
Results and discussion
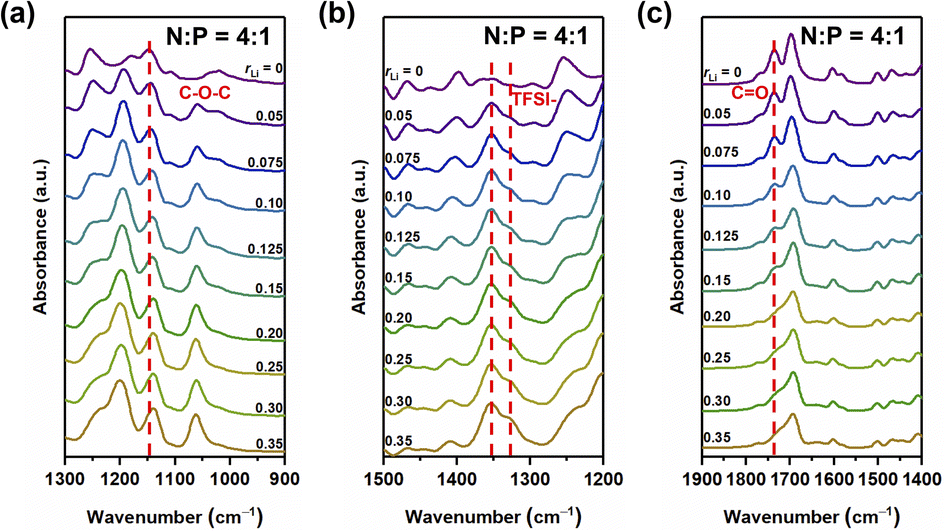
Lithium ions can form complexes with oxygen atoms in the system. We first studied the complexation between LiTFSI and oxygen atoms in different samples. FT-IR spectra showed no significant difference in infrared absorption peaks for samples with N:P ratios of 3:1, 4:1, and 5:1 (Fig. 2, S4 and S5†). Therefore, we chose the sample with N:P = 4:1 for discussion. Fig. 2 illustrates the FT-IR spectra that show the stretching of the carbonyl group, ν(C![[double bond, length as m-dash]](https://www.rsc.org/images/entities/char_e001.gif) O), the ether groups, ν(C–O–C), and the ester groups in the ion conductors.
O), the ether groups, ν(C–O–C), and the ester groups in the ion conductors.
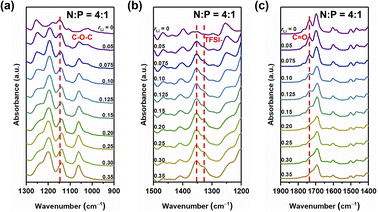 |
| | Fig. 2 FT-IR spectra of the sample with N:P = 4:1 having different contents of the lithium salt in the range of 1300 to 900 cm−1 (a), 1500 to 1200 cm−1 (b), and 1900 to 1400 cm−1 (c). | |
The asymmetric stretching mode of the ether group of NbAzo is shown in Fig. 2a, which is observed at ∼1146 cm−1. It moves to lower wavenumbers when rLi increases, owing to changes in the vibrational mode of the ether group (C–O–C) next to azobenzene induced by the coordination between NbAzo and LiTFSI.25 In Fig. 2b, two asymmetric stretching peaks appear at 1346 and 1326 cm−1 originating from the TFSI− anions of LiTFSI. Fig. 2c shows the region of the carbonyl group in different LiTFSI-containing mixtures with N:P = 4:1. The signal of the carbonyl group can be observed at 1723 cm−1 when the loading of LiTFSI is low. However, with the addition of LiTFSI, the CO peak becomes significantly weaker and broadened and then almost disappears when rLi > 0.20. This behavior can be attributed to the interactions between Li+ ions with the negative charges of oxygen atoms in the carbonyl groups. The disappearance of the peak at 2997 cm−1 in Fig. S6† signifies the completion of the thiol–ene click reaction.26 On the basis of the above results, we deduce that when rLi is below 0.10, the lithium salt first complexes with oxygen atoms from the ether groups next to azobenzene, and then it begins to complex with oxygen atoms from the ester groups when rLi increases.
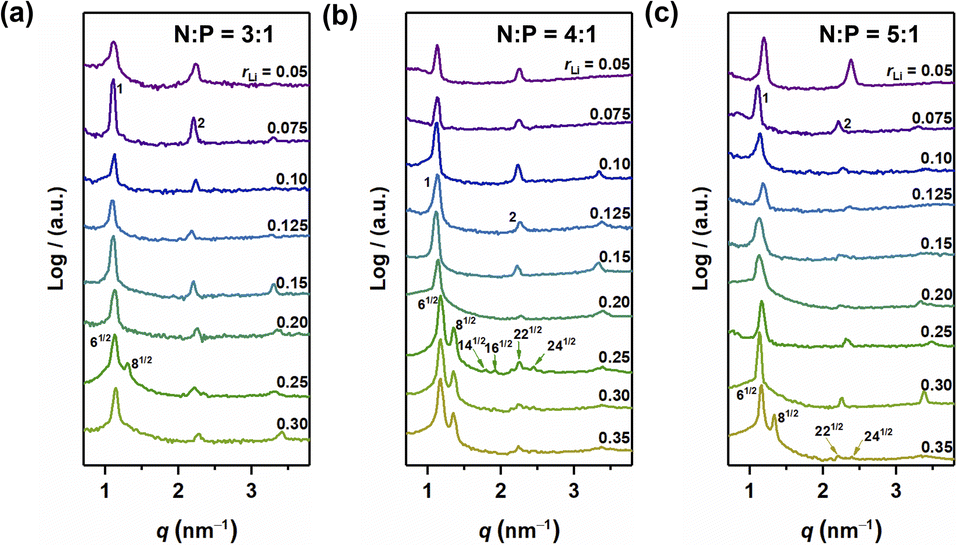
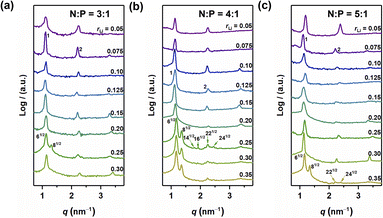
The self-assembled structures of various samples were characterized utilizing MAXS. As shown in Fig. 3, when rLi = 0.05, the peaks in the MAXS profiles of the samples with N:P = 3:1, 4:1, and 5:1 exhibit a scattering vector ratio of 1:2:3, indicating a LAM structure. When rLi increases, the layer structure is maintained for rLi < 0.25, with the periodic size first increasing and then decreasing.27 Interestingly, when rLi = 0.25, more diffraction peaks appear. For the sample with N:P = 3:1, the first two peaks have a scattering vector ratio of 61/2:81/2, suggesting a GYR structure (Fig. 3a). The structure changes back to LAM with rLi at 0.30. The above results indicate that the GYR phase exists in a relatively narrow region compared to the LAM structure, which is similar to the case in BCPs. For the sample with N:P = 4:1, the LAM-GYR transition also occurs with rLi at 0.25. In Fig. 3b, characteristic peaks with a scattering vector ratio of 61/2:81/2:141/2:161/2:221/2:241/2 appear in the MAXS profile of this sample (N:P = 4:1 and rLi = 0.25), indicating the formation of a GYR structure. The GYR phase continues to exist with further increase in rLi to 0.35. For the N:P = 5:1 series, the GYR structure appears when rLi = 0.35 (Fig. 3c).
 |
| | Fig. 3 MAXS profiles of N:P = 3:1 (a), N:P = 4:1 (b) and N:P = 5:1 (c). | |
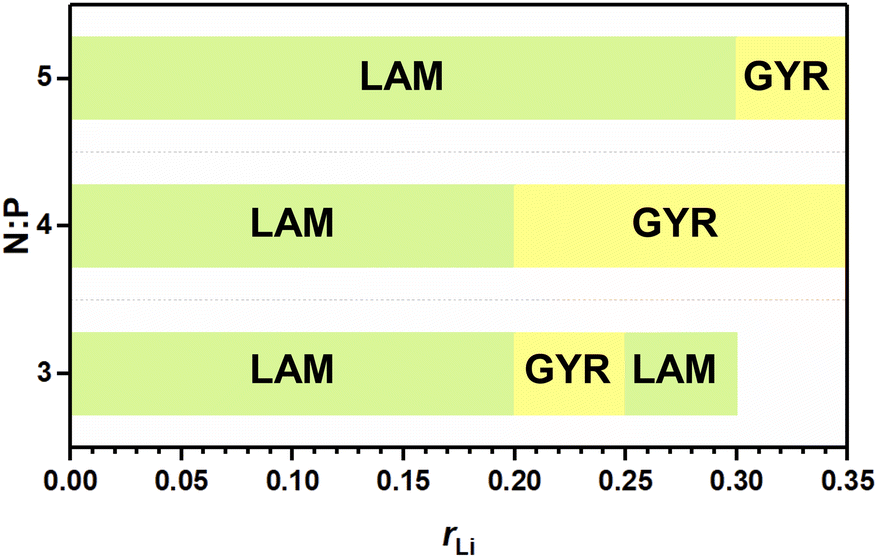
The abovementioned phase behaviors are illustrated in the apparent phase diagram (Fig. 4). As shown in Fig. 5, for a fixed N:P value, the lithium salt introduced will be mainly in Part I. Thus, the volume fraction of Part I will increase with increasing content of the lithium salt. Such an increase will cause a change in the volume ratio between Part I and Part II. When the change is large enough, a phase transformation will occur. Therefore, a LAM-GYR transition occurs when rLi increases, as for all three series of samples. With further increase in rLi and the volume fraction of Part I, a GYR-LAM transition may take place, as in the case of the sample series with N:P = 3:1. The GYR-LAM transition is not observed in the other two series of samples, possibly because their initial volume fractions of Part I before the introduction of the lithium salt are smaller and the increase in the volume fractions of Part I with increasing lithium salt content is not high enough to induce a phase transformation. There is an interesting phenomenon upon checking out the first-order diffraction peaks in the MAXS profiles of the samples with the same N:P value. For the samples with the LAM structures, it is apparent that the q value of the first-order diffraction peak first shifts to the left and then to the right with increasing rLi, indicating an increase and then a decrease in the layer spacing. The increase in layer spacing should be attributed to the increase in the size of Part I with the small amount of lithium salt added. With rLi further increasing, the coordination of Li+ with more oxygens may shrink the chain length along the layer thickness direction, resulting in a smaller layer spacing.
 |
| | Fig. 4 Apparent phase diagram of the ionic conductor. | |
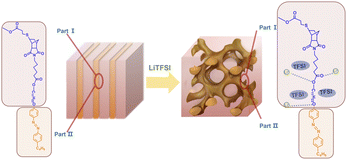 |
| | Fig. 5 Schematic illustration of the structural transition from LAM to GYR. | |
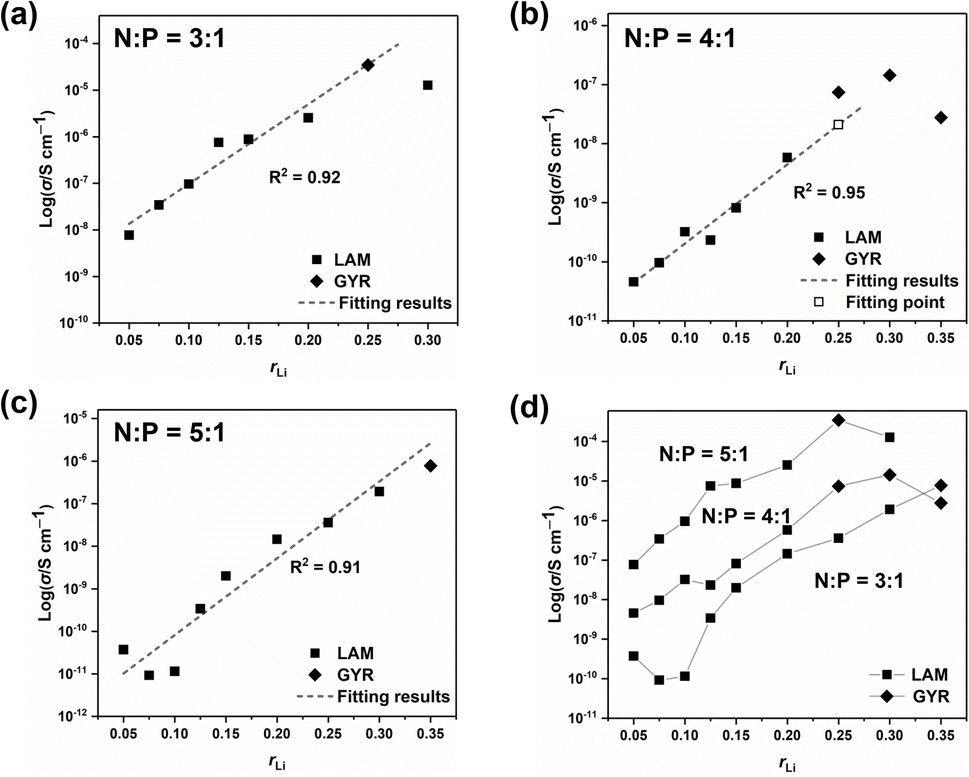
Ionic conductivities of different ion conductors were measured, and the results are listed in Table 1. And the EIS Nyquist curves of different electrolytes are shown in Fig. S7–S9†. Fig. 5 shows the σ values of different samples along with the structural information. With low rLi, σ increases almost linearly with increasing rLi. However, when rLi ≥ 0.25, increasing rLi no longer leads to a proportional increase in σ and even results in a decrease at high lithium salt contents, which is particularly evident for the sample with N:P = 4:1 and rLi = 0.35 when there is no structural change. The high salt concentration gives a high tendency of the ionic species to associate or aggregate with each other.28–30 Such a tendency will decrease the number of the conducting species and the ionic mobility, leading to a decrease in σ rather than an increase.31 For the sample with N:P = 3:1 and rLi = 0.25, it forms the GYR structure and has a higher σ compared with the one having a LAM structure at rLi = 0.30 (Fig. 6a), although it is difficult to reach the conclusion that the GYR-structured sample would always have a higher σ value because of the decrease in σ at high lithium salt content. For the series with N:P = 4:1, the samples have the GYR structures when rLi ≥ 0.25 (Fig. 6b). However, the σ value of the sample with rLi = 0.25, assuming it has a LAM structure, can be linearly predicted to be much lower. The σ value of the actual sample, which has a GYR structure, is approximately 3.6 times that of the abovementioned predicted value, confirming that the structure has an important effect on σ and the GYR structure is more favorable for higher σ. For the series with N:P = 5:1, although the structure changes from LAM to GYR when rLi increases to 0.35, the σ value is not necessarily higher than the corresponding value of the LAM structure predicted by the linear fitting. In this case, the detrimental effect of excessive lithium salt content outweighs the advantages of the LAM-GYR structural transition.
Table 1 Morphologies and σ values of different samples
| rLi |
N:P |
Morph. |
σ (S cm−1) |
N:P |
Morph. |
σ (S cm−1) |
N:P |
Morph. |
σ (S cm−1) |
| 0.05 |
3:1 |
LAM |
7.73 × 10⁻⁹ |
4:1 |
LAM |
4.58 × 10⁻¹⁰ |
5:1 |
LAM |
3.72 × 10⁻¹¹ |
| 0.075 |
3:1 |
LAM |
3.42 × 10⁻⁸ |
4:1 |
LAM |
9.63 × 10⁻¹⁰ |
5:1 |
LAM |
9.21 × 10⁻¹² |
| 0.10 |
3:1 |
LAM |
9.62 × 10⁻⁸ |
4:1 |
LAM |
3.22 × 10⁻⁹ |
5:1 |
LAM |
1.15 × 10⁻¹¹ |
| 0.125 |
3:1 |
LAM |
7.53 × 10⁻⁷ |
4:1 |
LAM |
2.33 × 10⁻⁹ |
5:1 |
LAM |
3.40 × 10⁻¹⁰ |
| 0.15 |
3:1 |
LAM |
8.76 × 10⁻⁷ |
4:1 |
LAM |
8.18 × 10⁻⁹ |
5:1 |
LAM |
2.00 × 10⁻⁹ |
| 0,20 |
3:1 |
LAM |
2.55 × 10⁻⁶ |
4:1 |
LAM |
5.81 × 10⁻⁸ |
5:1 |
LAM |
1.45 × 10⁻⁸ |
| 0.25 |
3:1 |
GYR |
3.49 × 10⁻⁵ |
4:1 |
GYR |
7.43 × 10⁻⁷ |
5:1 |
LAM |
3.58 × 10⁻⁸ |
| 0.30 |
3:1 |
LAM |
1.27 × 10⁻⁵ |
4:1 |
GYR |
1.44 × 10⁻⁶ |
5:1 |
LAM |
1.93 × 10⁻⁷ |
| 0.35 |
|
|
|
4:1 |
GYR |
4.15 × 10⁻⁷ |
5:1 |
GYR |
7.77 × 10⁻⁷ |
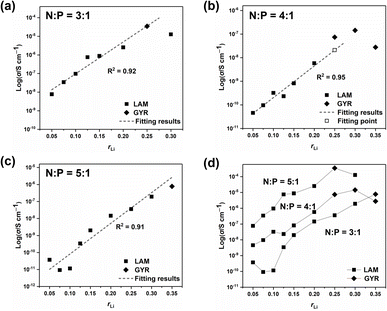 |
| | Fig. 6 Ionic conductivity values of samples with N:P = 3:1 (a), N:P = 4:1 (b), N:P = 5:1 (c), and all the samples (d) with respect to rLi. | |
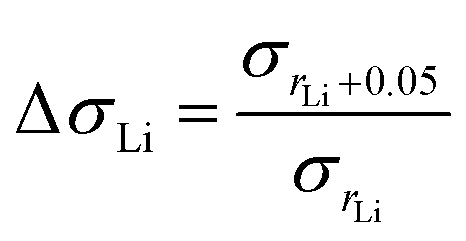
To investigate how the structure (LAM or GYR) influences the ionic conductivity, we studied the effect of the N:P ratio on ionic conductivity for various samples with the same rLi. Because the change in the N:P ratio induces variation in the ionic conductivity, we compare the proportional enhancement in ionic conductivity when rLi increases. ΔσLi is defined as the ratio of σrLi + 0.005 to σrLi (eqn (3)).
| |
 | (3) |
As illustrated in Table 2, it is apparent that when rLi increases from 0.20 to 0.25, the N:P ratio of either 3:1 or 4:1 triggers the LAM-GYR phase transition, ΔσLi values reach approximately 13. With the same increase in lithium salt concentration, the ΔσLi value for the sample with an N:P ratio of 5:1 is only 2.47. This means that with a similar increase in lithium salt concentration, the LAM-GYR phase transition produces an increase of 5.3 (13/2.47) times improvement in ionic conductivity compared to the case of remaining as the LAM phase. When rLi increases further to 0.30, the sample with the N:P ratio of 4:1 still maintains the GYR phase, while the sample with the N:P ratio of 3:1 goes through a GYR-LAM phase transition and has a roughly 5.2 (1.94/0.37) times decrease in ΔσLi. These results further demonstrate that the GYR structure is more favorable in terms of ion transport. Thus, it seems that in the system studied in this work the projected boosting of ionic conductivity owing to the LAM-GYR phase change could possibly be more than the theoretical differences for the ideal case in which the increasement is 1:(2/3) = 1.5. This is also observed for the sample with an N:P ratio of 5:1 when rLi continues to climb to 0.35, in which the ΔσLi value reaches 4.03 following the LAM-GYR transition. One of the reasons could be that the relatively large proportion of insulating parts in the samples, leading to fewer than enough ion conducting channels especially for those with the LAM structures. For the sample with an N:P ratio of 4:1, the intensive accumulation of lithium ions significantly reduces the ionic conductivity, leading to the ΔσLi value of only 0.19.
Table 2 Morphologies and ΔσLi values of different samples
| rLi |
N:P |
Morph. |
ΔσLi |
N:P |
Morph. |
ΔσLi |
N:P |
Morph. |
ΔσLi |
| No change in self-assembled structure. |
|
|
|
|
|
|
|
|
|
| 0.20 |
3:1 |
LAM-GYR |
13.70 |
4:1 |
LAM-GYR |
12.78 |
5:1 |
— |
2.47 |
| 0.25 |
3:1 |
GYR-LAM |
0.37 |
4:1 |
—a |
1.94 |
5:1 |
— |
5.38 |
| 0.30 |
|
|
|
4:1 |
— |
0.19 |
5:1 |
LAM-GYR |
4.03 |
Conclusions
In this work, we prepared ion conductors by mixing a monomer NbAzo with PETMP and LiTFSI in varying proportions. We found that the self-assembled structure of the ion conductor could be controlled by changing the contents of LiTFSI and PETMP. To analyze the effect of the structural change on the ionic conductivity, we linearly fitted the ionic conductivity of the LAM-structured sample and compared it with the measured ionic conductivity of the actual GYR-structured sample with an N:P ratio of 4:1. The σ value of the latter was about 3.6 times that of the former. In addition, we compared the ΔσLi values of different cases (LAM-GYR transition, GYR-LAM transition, and no phase change) with the same increase in rLi. We found that the ΔσLi for the case of LAM-GYR transition is about 5.3 times that for the case of no phase change. Our results showed that the increase in ionic conductivity because of the LAM-GYR phase change in real samples could possibly be more than that in the ideal case. Our work suggests that it is beneficial to obtain ion conductors with GYR structures.
Conflicts of interest
There are no conflicts of interest to declare.
Acknowledgements
This work was supported by the National Key R&D Program of China (Grant 2023YFB3812804) and the National Natural Science Foundation of China (Grant 51921002).
References
- F. Ye, X. Zhang, K. Liao, Q. Lu, X. Zou, R. Ran, W. Zhou, Y. Zhong and Z. Shao, J. Mater. Chem. A, 2020, 8, 9733–9742 RSC.
- J. Wang, S. Guo, Z. Li, W. Kou, J. Zhu, J. Dang, Y. Zhang and W. Wu, Chem. Eng. J., 2022, 450, 137994 CrossRef CAS.
- X. Zhu, K. Wang, Y. Xu, G. Zhang, S. Li, C. Li, X. Zhang, X. Sun, X. Ge and Y. Ma, Energy Storage Mater., 2021, 36, 291–308 CrossRef.
- X. Li, Y. Wang, K. Xi, W. Yu, J. Feng, G. Gao, H. Wu, Q. Jiang, A. Abdelkader, W. Hua, G. Zhong and S. Ding, Nano-Micro Lett., 2022, 14, 210 CrossRef CAS PubMed.
- X. Yang, J. Liu, N. Pei, Z. Chen, R. Li, L. Fu, P. Zhang and J. Zhao, Nano-Micro Lett., 2023, 15, 74 CrossRef CAS PubMed.
- P. Hu, J. Chai, Y. Duan, Z. Liu, G. Cui and L. Chen, J. Mater. Chem. A, 2016, 4, 17–183 Search PubMed.
- X. Huang, D. Xu, W. Chen, H. Yin, C. Zhang, Y. Luo and X. Yu, J. Electroanal. Chem., 2017, 804, 133–139 CrossRef CAS.
- P. Sivaraj, K. P. Abhilash, B. Nalini, P. Perumal and P. C. Selvin, J. Solid State Electrochem., 2021, 25, 905–917 CrossRef CAS.
- P. V. Wright, Br. Polym. J., 1975, 319–327 CrossRef CAS.
- Y. G. A. D. Zlatka Gadjourova, Nature, 2001, 6846 Search PubMed.
- L. Yan, C. Rank, S. Mecking and K. I. Winey, J. Am. Chem. Soc., 2020, 142, 857–866 CrossRef CAS PubMed.
- L. Luo, X. Lyu, Z. Tang, Z. Shen and X. Fan, Macromolecules, 2020, 53, 9619–9630 CrossRef CAS.
- P. Birke, F. Salam, S. Döring and W. Weppner, Solid State Ionics, 1999, 118, 149–157 CrossRef CAS.
- K. Tuo, C. Sun and S. Liu, Electrochem. Energy Rev., 2023, 6, 17 CrossRef CAS.
- Q. Z. S. S. Archer, Nat. Rev. Mater., 2020, 3, 229–252 Search PubMed.
- I. Villaluenga, X. C. Chen, D. Devaux, D. T. Hallinan and N. P. Balsara, Macromolecules, 2015, 48, 358–364 CrossRef CAS.
- D. Liu, F. Wu, Z. Shen and X. Fan, Chin. J. Polym. Sci., 2022, 40, 21–28 CrossRef CAS.
- Z. Wang and S. Cai, J. Mater. Chem. B, 2020, 8, 661–6623 Search PubMed.
- P. Chakraborty, S. Das and A. K. Nandi, Prog. Polym. Sci., 2019, 88, 189–219 CrossRef CAS.
- G. Jo, H. Ahn and M. J. Park, ACS Macro Lett., 2013, 2, 990–995 CrossRef CAS PubMed.
- M. J. Lee, J. Han, K. Lee, Y. J. Lee, B. G. Kim, K. Jung, B. J. Kim and S. W. Lee, Nature, 2022, 601, 217–222 CrossRef CAS PubMed.
- J. Uchida, B. Soberats, M. Gupta and T. Kato, Adv. Mater., 2022, 34, 2109063 CrossRef CAS PubMed.
- J. Sakuda, E. Hosono, M. Yoshio, T. Ichikawa, T. Matsumoto, H. Ohno, H. Zhou and T. Kato, Adv. Funct. Mater., 2015, 25, 1206–1212 CrossRef CAS.
- B. X. Dong, Z. Liu, M. Misra, J. Strzalka, J. Niklas, O. G. Poluektov, F. A. Escobedo, C. K. Ober, P. F. Nealey and S. N. Patel, ACS Nano, 2019, 13, 7665–7675 CrossRef CAS PubMed.
- N. N. M. Radzir, S. A. Hanifah, A. Ahmad, N. H. Hassan and F. Bella, J. Solid State Electrochem., 2015, 19, 3079–3085 CrossRef CAS.
- X. Gong, H. Yin, M. Zhang and X. Shi, J. Appl. Polym. Sci., 2020, 137, 3249 CrossRef.
- J. Shim, S. Xie, F. S. Bates and T. P. Lodge, Macromolecules, 2019, 52, 9416–9424 CrossRef CAS.
- J. R. Wickham, R. N. Mason and C. V. Rice, Solid State Nucl. Magn. Reson., 2007, 31, 184–192 CrossRef CAS PubMed.
- B. A. Paren, N. Nguyen, V. Ballance, D. T. Hallinan, J. G. Kennemur and K. I. Winey, Macromolecules, 2022, 55, 4692–4702 CrossRef CAS.
- Y. G. Andreev and P. G. Bruce, Electrochim. Acta, 2000, 45, 1417–1423 CrossRef CAS.
- M. S. Su Ait, A. Ahmad, H. Hamzah and M. Y. A. Rahman, Electrochim. Acta, 2011, 57, 123–131 CrossRef CAS.
|
| This journal is © The Royal Society of Chemistry 2024 |
Click here to see how this site uses Cookies. View our privacy policy here. 
 Open Access Article
 This Open Access Article is licensed under a Creative Commons Attribution-Non Commercial 3.0 Unported Licence
 a,
Zhifan Fang
a,
Zhifan Fang