 Open Access Article
Extraction of silica from sugarcane bagasse ash and its utilization in zeolite 4A synthesis for CO2 adsorption
Chalermpan Keawkumay ab,
Panot Krukkratokea,
Saran Youngjan
 c,
Nattawut Osakoo
 *ab,
Krittanun Deekamwong
 ab,
Pongtanawat Khemthong
 c,
Jakkapop Phanthasri
 c,
Sanchai Prayoonpokarach
 *a and
Jatuporn Wittayakun
 *a
*a
aSchool of Chemistry, Institute of Science, Suranaree University of Technology, Thailand. E-mail: nattawut.o@g.sut.ac.th; sanchaip@g.sut.ac.th; jatuporn@sut.ac.th
bInstitute of Research and Development, Suranaree University of Technology, Thailand
cNational Nanotechnology Center (NANOTEC), National Science and Technology Development Agency (NSTDA), Thailand
First published on 17th June 2024
Abstract
Sugarcane bagasse ash (SCBA) is a solid waste containing a high amount of silica (SiO2) and is suitable to utilize as a silica source for synthesizing zeolite NaA. SCBA is typically calcined at high temperatures before silica extraction. The method is not environmentally friendly because it consumes energy and produces CO2. This work demonstrates an alternative extraction method of SiO2 from SCBA by treating it with hydrochloric (HCl) and sodium hydroxide (NaOH) solution. The obtained mixture was separated by paper filter No. 1 (P) and a combination of paper filter and syringe filter (PS). The solution was neutralized by HCl solution, producing silica (SiO2-P and SiO2-PS) with a purity of 98 wt%. Both SiO2 samples and SCBA were utilized to synthesize zeolite NaA for CO2 adsorption. The CO2 adsorption capacities of NaA-P and NaA-PS were 4.30 and 4.10 mmol gadsorbent−1, in the same range as commercial NaA. The capacity is influenced by the total basicity of zeolite. The CO2 adsorption behavior of all samples correlates well with the Toth model. The CO2 adsorption kinetics agrees well with the pseudo-second-order kinetic model. Overall, this work shows the successful extraction of silica via using a direct NaOH solution, yielding high-purity silica sufficient for synthesizing zeolite NaA, a promising adsorbent of CO2.
1. Introduction
Fossil fuels continue to dominate as the primary source of global energy consumption, and this reliance is expected to persist for several more decades. The use of fossil fuels generates carbon dioxide (CO2),1 the main greenhouse gas. The atmospheric CO2 concentration has been reported to reach a crucial threshold of 425 ppm.2 Consequently, several countries have taken action to reduce CO2 emissions through various approaches, including carbon capture and storage (CCS).3 Carbon capture is generally employed in large-scale resources releasing a high concentration of CO2, such as flue gas in coal plants and industries.4 Given the rising levels of CO2, it remains imperative to persistently advance methods to reduce CO2 emissions.Techniques for removing CO2 include adsorption, cryogenic distillation, microalgae bio-fixation, and membrane separation.2 The most common method is adsorption on solids, which is simple and cost-effective, with the possibility of regenerating the adsorbent.5 Zeolites are among the effective adsorbents due to their large surface area, high thermal stability, and defined pore structure.6,7 Those properties could allow efficient CO2 adsorption at high temperatures, beneficial for flue gas utilization in coal plants and industries. Besides, the pore structure of zeolite could serve as shape-selective adsorption of CO2.
Zeolites have an aluminosilicate framework comprising tetrahedral TO4 units (T = Si or Al) joined by shared oxygen atoms.8 The silicon-to-aluminum ratio (Si/Al) strongly influences the zeolite structure and adsorption capacities.9 There are reports that zeolites with low Si/Al ratios, such as NaX and NaA have high CO2 adsorption capacity due to their high basicity.7,9,10 It was reported that NaA and NaX synthesized from rice husk silica have CO2 adsorption capacity of 97.7 and 107.8 mg-CO2 per g-zeolite, respectively.10 Despite the lower CO2 adsorption capacity, NaA is a promising adsorbent due to its high CO2 adsorption capacity, simple synthesis method with low energy consumption from a short crystallization time.10,11 Siriwardane et al.7 suggested that the presence of more cations (Na+) of zeolite promotes the basicity of the material, resulting in the greater adsorption capacity of CO2. The capacity could be improved by increasing the sodium content in the synthesis gel. Overall, it is worth focusing on the improvement of CO2 adsorption on NaA zeolite by synthesizing with a higher molar ratio of Na content in the synthesis gel.
Some downsides in the zeolite synthesis are the energy cost and non-environmentally friendly silica sources, such as silicon alkoxides, silicic acid, and fumed silica.12,13 Thus, the utilization of silica from biomass waste for zeolite synthesis is considered a cheaper route due to the value-added waste and its alternative application.14 There are several biomass wastes with high silica content such as rice husk ask,8 cogon grass weed,15 and sugarcane bagasse ash (SCBA) that have been used in the zeolite synthesis.16 Accordingly, Thailand is one of the top world sugar producers, generating a large amount of sugarcane bagasse.17,18 The sugarcane bagasse is further utilized as a fuel in cogeneration to generate steam and electricity. Consequently, the SCBA remains the final waste with low commercial value in the sugar production chain.18 SCBA waste consists of ∼13 wt% silica content;19 it has potential as a silica source for the synthesis of NaA zeolite.
To obtain zeolite with high purity, the silica source in the synthesis gel should have high purity.20 Subsequently, SCBA waste must be treated to improve the silica purity before use in the synthesis gel of zeolite. The residual carbon in SCBA could be removed by calcination in air at high temperatures, i.e., from 600 °C to 1000 °C for several hours followed by a treatment in an acid solution to remove metal impurities.21,22 The calcination at high temperatures is energy-consuming and produces CO2 to the environment. Thus, the process could be considered non-environmentally friendly.
Herein, we demonstrate a selectively extracted silica from SCBA by direct treatment with NaOH solution in the form of sodium silicate solution (Na2SiO3), followed by precipitation of SiO2 in mild HCl solution.23 The product is directly employed as a silica source for the synthesis of zeolite NaA. Moreover, the residual carbon particles are separated from the Na2SiO3 solution by filtration with filter paper (P) followed by a syringe filter (PS). The remaining residual carbon particles might be useful in other applications such as fertilizer and/or adsorbent of pollutants without any loss of benefits.18
The goals of this study are to synthesize the NaA zeolites using silica from SCBA by treatment with NaOH solution and to investigate their CO2 adsorption capacity, compared with commercial NaA zeolite. Moreover, the physicochemical properties, thermal stability, morphology, basicity, adsorption model, and kinetics of NaA zeolites using silica from SCBA, are discussed and compared to that of commercial-NaA zeolite.
2. Results and discussion
Fig. 1a–c demonstrates the color of as-received SCBA, SiO2-P, and SiO2-PS. As-received SCBA is dark powder due to unburned carbons, similar to the appearance reported in the literature.19 The SiO2-P and SiO2-PS samples are gray and white powders, respectively, implying the normal color of silica. The color difference in those samples implies their distinct purities.23 The yields of silica powder calculated according to eqn (6) for SiO2-P and SiO2-PS were 20.4 wt% and 19.6 wt%, respectively. This result suggests that the two-step filtrations might eliminate impurities from NaSiO3 solution resulting in the whiter power for SiO2-PS.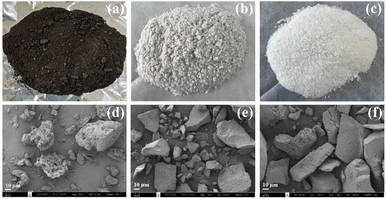 | ||
| Fig. 1 Photographs of powder and SEM images of as-received SCBA (a and d), SiO2-P (b and e), and SiO2-PS (c and f). | ||
Fig. 1d–f reveals the morphologies of as-received SCBA, SiO2-P, and SiO2-PS from SEM. The as-received SCBA has morphology of irregular shapes with a rough surface of particles containing various sizes of fibers.19 After the extraction process, SiO2-P, and SiO2-PS gave the aggregation of dense particles and smooth surfaces. These results are consistent with the morphology of commercial SiO2 reported in the literature.24
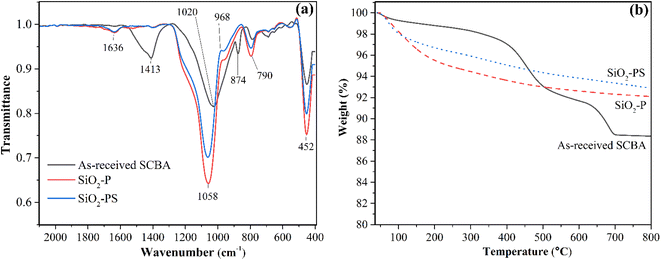
Fig. 2a demonstrates the functional groups of raw-SCBA, SiO2-P, and SiO2-PS, and the band assignment is shown in Table 1. The as-received SCBA exhibits mainly the vibration spectra of Si–O–Si, and carbonate species,25 suggesting that silicon oxide and metal carbonate are the main components. In contrast, SiO2-P and SiO2-PS only show the peaks corresponding to Si–O–Si, indicating that HCl solution removes metal impurities and NaOH selectively extract silicon oxide from the as-received SCBA.23 The additional bands at 968 cm−1 and 1636 cm−1 were attributed to the vibrations of Si–OH and water adsorbed on the surface SiO2.
| Wavenumber (cm−1) | Assignment | Reference |
|---|---|---|
| As-received SCBA | ||
| 452 | Bending vibration of Si–O–Si | 25 |
| 788 | Symmetric vibration of Si–O–Si | |
| 874 | Out-of-plane angular deformation of group CO32− vibration | |
| 1020 | Asymmetric stretching of Si–O–Si | |
| 1413 | Asymmetric vibration of carbonate species | |
![[thin space (1/6-em)]](https://www.rsc.org/images/entities/char_2009.gif) |
||
| SiO2-P | ||
| 452 | Bending vibration of Si–O–Si | 25 and 31 |
| 790 | Symmetric vibration of Si–O–Si | |
| 968 | Vibration of Si–OH | |
| 1058 | Asymmetric stretching of Si–O–Si | |
| 1636 | Vibration of water adsorbed on the surface | |
![[thin space (1/6-em)]](https://www.rsc.org/images/entities/char_2009.gif) |
||
| SiO2-PS | ||
| 452 | Bending vibration of Si–O–Si | 25 and 31 |
| 790 | Symmetric vibration of Si–O–Si | |
| 967 | Vibration of Si–OH | |
| 1060 | Asymmetric stretching of Si–O–Si | |
| 1636 | Vibration of water adsorbed on the surface | |
Fig. 2b displays thermograms showing the thermal decomposition of as-received SCBA, SiO2-P, and SiO2-PS from room temperature to 800 °C under air zero. The thermal decomposition of as-received SCBA occurs in three ranges: 50–200 °C, 350–500 °C, and 640–700 °C. Those weight losses were attributed to the removal of adsorbed water, decomposition of organic compounds,26,27 and decomposition of CaCO3, respectively.28 The result is in good agreement with the report from Castaldelli et al.26 that Ca species is one of the second major components remaining in raw SCBA from the sugar industry in Brazil. The thermograms of SiO2-P, and SiO2-PS gave only two main regions in the temperature ranges of 80–150 °C, and 150–400 °C contributing to the water desorption and unburned carbon. One should notice that more weight loss in the range of 150–400 °C was pronounced in SiO2-P implying some trace amount of organic matter remaining in the sample.
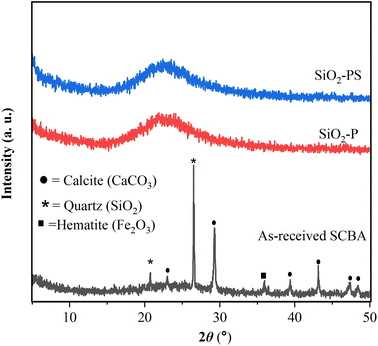
Fig. 3 exhibits the phases of as-received SCBA, SiO2-P, and SiO2-PS determined by XRD. The raw SCBA provided the crucial peaks of quartz (SiO2), calcite (CaCO3), and hematite (Fe2O3), respectively. The quartz gave essential peaks at 20.8° and, 26.5°.29 Besides, the calcite displayed character peaks at 23.1°, 29.3°, 39.5°, 43.2°, 47.3°, and 48.4°, respectively30 and hematite exhibited the crucial peak at 36.1°.16 The result is not much surprising because these phases have been reported as the major components of SCBA.16 Moreover, the presence of the calcite phase alines well with the results from FTIR and TGA. In terms of SiO2-P, and SiO2-PS, only a broad peak at 22° attributed to the characteristic peak of amorphous silica was observed. The result implies that both samples contain a high purity of amorphous silica (SiO2). This assumption correlates well with the result from elemental compositions from XRF as demonstrated in Table 2. Moreover, the obtained silica in the amorphous phase could be beneficial for zeolite synthesis because it can be dissolved easily in NaOH solution to produce sodium silicate (Na2SiO3).15
| Sample | Component (wt%) | |||||
|---|---|---|---|---|---|---|
| SiO2 | Al2O3 | CaO | Fe2O3 | MnO2 | TiO2 | |
| a n.d.: not detected. | ||||||
| As-received SCBA | 77.2 | 6.9 | 12.3 | 2.7 | 0.5 | 0.4 |
| SiO2-P | 98.1 | 1.9 | n.d. | n.d. | n.d. | n.d. |
| SiO2-PS | 97.9 | 2.1 | n.d. | n.d. | n.d. | n.d. |
Fig. 4a demonstrates FTIR spectra of NaA-SCBA, NaA-P, NaA-PS, and commercial-NaA. All samples exhibit five crucial peaks of the zeolite NaA framework. The peaks at 462 cm−1 and 545 cm−1 were attributed to the internal tetrahedral vibration of O–T–O bending when T is Si or Al and, the external vibration of double four-rings. Besides, the peaks at 662 cm−1 and 972 cm−1 corresponded to the internal vibration of Si–O–T symmetric stretching and asymmetric O–H scissors-like vibration of adsorbed water.32 Moreover, NaA-SCBA, NaA-P, and NaA-PS samples had similar FTIR patterns to commercial-NaA. This result suggests that the zeolite synthesized using silica from SCBA has essentially zeolite NaA type.
 | ||
| Fig. 4 FTIR spectra (a), TGA curves (b), and XRD patterns (c) of NaA-SCBA, NaA-P, NaA-PS, and commercial-NaA. | ||
The thermographs of NaA-SCBA, NaA-P, NaA-PS, and commercial-NaA are shown in Fig. 4b. The thermal behavior of physisorbed water on zeolite implies the character of each zeolite type.33 NaA-SCBA shows weight loss in four main regions: 100–200 °C, 200–400 °C, 400–500 °C and 600–700 °C, attributing to the desorption of physisorbed water, water in the zeolite structure, volatile organic compounds, and the decomposition of CaCO3, respectively.26,27,34 The character weight losses of organic compounds and CaCO3 were observed probably due to the direct use of silica from as-received SCBA containing high impurities. Other three zeolites including NaA-P, NaA-PS, and commercial-NaA exhibited similar weight loss in two ranges: 100–200 °C and 200–400 °C attributed to the desorption of physisorbed water and water in the zeolite structure, respectively.34 The percentage weight losses were 21.3%, 18.8%, and 18.9% for NaA-P, NaA-PS, and commercial-NaA, respectively. The thermal behavior of physically adsorbed water, similar to commercial-NaA could imply that the synthesis of NaA zeolite is successful by using SiO2-P and SiO2-PS. The more weight loss from NaA-P was probably due to the remaining carbon matter from the silica source (see Fig. 2b).
Fig. 4c demonstrates XRD patterns of NaA-SCBA, NaA-P, NaA-PS, and commercial-NaA. It is noticeable that the NaA-SCBA gave mixed characteristic peaks of zeolite NaA (5A) according to JCPDS #39-0222, and quartz.16 Meanwhile, NaA-P, NaA-PS, and commercial-NaA gave essentially characteristic peaks of pure zeolite NaA (4A).10 The substitution of sodium ions from the initial gel with calcium ions from the raw SCBA results in the generation of pore diameter of 5 Å (zeolite 5A) instead of 4.1 Å (zeolite 4A). This evidence confirms the success in the synthesis of pure zeolite NaA (4A) from silica extracted from SCBA by both SiO2-P and SiO2-PS approaches.
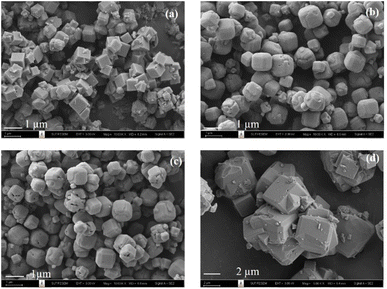
Fig. 5a–d displays the morphologies of NaA-SCBA, NaA-P, NaA-PS, and commercial-NaA. The NaA-SCBA (Fig. 5a) provided mainly cubic morphology with a sharp edge, a characteristic shape of zeolite 5A,35 and mixed with small particles. The presence of small particles is probably due to the remaining quartz phase suggested by the XRD result. Moreover, the dominant cubic morphology with average particle sizes around 800 nm was mainly observed. The NaA-P and NaA-PS (Fig. 5b and c) showed similar morphologies of a cubic shape and curvy edge crystals with an average particle size of around 0.9 mm. The morphology was identical to zeolite 4A in the literature.36 The difference is that the commercial-NaA has a larger particle, i.e., around 4 μm. The observation correlates well with the morphology of commercial-NaA (4A) reported in the literature.34
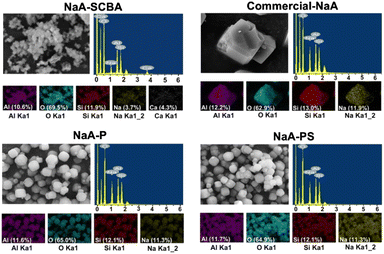
Fig. 6 demonstrates SEM-EDS mapping of NaA-SCBA, NaA-P, NaA-PS, and commercial-NaA. The NaA-SCBA revealed the dispersion of Al, Si, O, Na, and Ca throughout the particles of zeolite. The presence of Ca in the zeolite structure could be caused by the ion exchange with Na+ resulting in the formation of zeolite 5A, consistent with the result from XRD.34 The hypothesis also correlates well with the small amount of Na (3.7%) observed in the zeolite, in contrast to the other three zeolites which contain a higher amount of Na (11%). Besides, NaA-P, NaA-PS, and commercial-NaA exhibited the suitable elements including Al, Si, O, and Na with the Si/Al ratio of about 1 of zeolite NaA.37
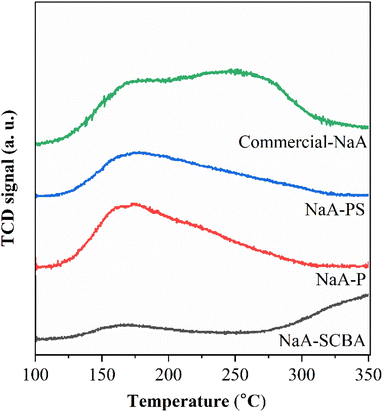
Fig. 7 manifests CO2-TPD profiles of NaA-SCBA, NaA-P, NaA-PS, and commercial-NaA, and the amount of basicity in each sample is summarized in Table 3. CO2-TPD was employed to evaluate the strength of the basic sites available in zeolites for CO2 adsorption.38 It was observed that all samples had different desorption peaks and intensities implying the presence of their distinct basic strengths and basicities. The amount of basicity was in the order of commercial-NaA > NaA-P > NaA-PS > NaA-SCBA. The difference in basicity could be the consequence of the distinct values of Si/Al and Na/Si ratio in each sample. As known, the framework of zeolite is a building of tetrahedral TO4 units (T = Si or Al) bonded together by sharing oxygen atoms. The zeolite framework will present the net negative charge that requires Na in the positive form (Na+) as a charge balancing.37 Either a net negative charge or positive Na (Na+) could be an active site for CO2 adsorption.10 Thus, zeolite consisting of low Si/Al and high Na/Si ratios could be beneficial for CO2 adsorption. As a result, the Si/Al and Na/Si ratios of zeolites were correlated well with the amount of basicity as demonstrated in Table 3. Moreover, Gouveia et al.4 have suggested that the total amount of basic sites in the adsorbent has a stronger influence on CO2 adsorption than that of basic strength. The presence of the [AlO4]5− tetrahedron in zeolite (NaA) results in a negative charge, which is balanced by the positively charged Na+ cation. This cation could serve as the adsorption center for CO2 in zeolites. Therefore, the concentration of Na+ cation could play a crucial role in governing the adsorption process, consistent with the increase of Na/Si ratio in Table 3. This assumption agrees well with the report in the literature10,39 that the positively charged Na+ cations in zeolite NaX and NaA are the main adsorption sites for CO2. Thus, the improvement of the Na/Si ratio in zeolites to enhance adsorption capacity could be done in several ways, for example, by changing the gel composition and optimizing the crystallization conditions.36
| Sample | Basicitya (mmolCO2 gadsorbent−1) | Si/Al (atomic ratio)b | Na/Si (atomic ratio)b |
|---|---|---|---|
| a Calculated from the desorption peak in the temperature range from 100 °C to 350 °C.b Obtained from ED-XRF result. | |||
| NaA-SCBA | 0.029 | 2.64 | 0.11 |
| NaA-P | 0.094 | 1.30 | 0.47 |
| NaA-PS | 0.064 | 1.32 | 0.42 |
| Commercial-NaA | 0.117 | 1.30 | 0.63 |
Fig. 8 exhibits CO2 adsorption isotherms of NaA-SCBA, NaA-P, NaA-PS, and commercial-NaA performed at 25 °C and the pressure range of 0.0–1.0 bar. It was noticed that the adsorption behavior in all samples showed type I isotherm according to the IUPAC classification suggesting a physical adsorption character in all samples.10 The sorption isotherm has a sharp curve at the low pressure because of the abundant adsorption sites followed by the gradient decreased and became constant at high pressure. Then, the adsorption behavior was almost unchanged at the pressure close to 1 bar.
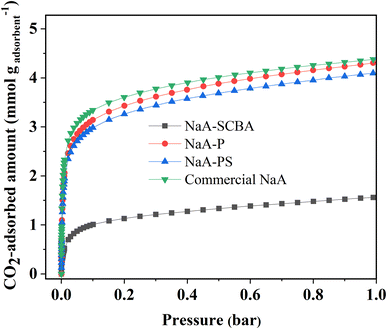 | ||
| Fig. 8 CO2 adsorption isotherms of NaA-SCBA, NaA-P, NaA-PS, and commercial-NaA performed at 25 °C and the pressure range of 0.0–1.0 bar. | ||
The fundamental interactions between zeolites and CO2 molecules are mostly electrostatic force. The zeolite adsorbs CO2 molecules due to the strong quadrupolar interactions between adsorbate molecules and the persistent electric field created by the charge-balancing cation of zeolites. The type of the cations (Na+) and their location in the zeolite pore reflect the material's permanent electric field. Therefore, CO2 uptake is dramatically increased at the beginning due to the available cation in the zeolite framework. At high relative pressure, there is no availability of unoccupied cations, thus the adsorption curve became almost constant.7,40
Furthermore, the adsorption capacity of CO2 was in the following: commercial-NaA ∼ NaA-P > NaA-PS > NaA-SCBA. This order is in good agreement with the amount of total basicity obtained from CO2-TPD. Moreover, this evidence is consistent with the report by Gouveia et al.4 that the basicity has a strong influence on CO2 adsorption in zeolitic materials. One should rationalize that zeolite purity is one of the important factors enhancing CO2 adsorption.41 This assumption correlates well with the report by Madhu et al.10 that zeolite NaA with a higher purity synthesized from kaolinite provides a greater CO2 adsorption capacity. Besides, the CO2 adsorption capacity of NaA-P had almost similar to that of commercial NaA (4.30 vs. 4.38 mmol g−1 in Table 5) indicating a promising strategy process and adsorbent due to the use of silica from SCBA waste.
Moreover, an equilibrium isotherm is crucial information delineated through adsorption isotherm data, delineating specific parameters that elucidate the surface characteristics and affinity of the adsorbent for the intended adsorbate. There are three models employed in this work to predict the adsorption isotherm including Langmuir, Freundlich, and Toth models.
The Langmuir adsorption model assumes a monolayer adsorption on a surface with a finite number of identical sites. It proposes that adsorption occurs through the formation of a saturated monolayer, and once all sites are occupied, no further adsorption can take place as demonstrated in equation (eqn (1)).
 | (1) |
The Freundlich adsorption model is an empirical equation used to describe non-ideal adsorption on heterogeneous surfaces. It assumes that the surface contains a range of sites with different energies of adsorption as shown in eqn (2).
 | (2) |
The Toth model was derived from the Langmuir model, monolayer adsorption isotherm with two parameters of the affinity of adsorbate molecule to the adsorption areas (KL) and the concentration of adsorbed molecules (qm), to rectify the deviation discrepancies between experimental data and the calculated value at equilibrium. In the case of the Toth equation, three variables were considered with the additional n symbol as shown in eqn (3).
 | (3) |
Fig. 9 reveals the behavior of the CO2 adsorption isotherm, examined by applying the principles of the Langmuir, Freundlich, and Toth models. The correlation coefficient (R2) values of all samples obtained from each model are shown in Table 4. It was observed that the behavior of the CO2 adsorption in all samples correlated well with the Toth isotherm with R2 of over 0.998, rather than Langmuir and Freundlich. A higher R2 value could indicate better applicability and reliability of a given model. These results also agree well with several reports in the literature43–45 that the CO2 adsorption behavior of zeolitic materials such as 13NaX and ZSM-5 follows the Toth model.
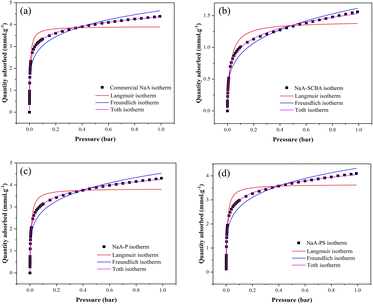 | ||
| Fig. 9 CO2 adsorption isotherms of commercial-NaA (a), NaA-SCBA (b), NaA-P (c), and NaA-PS (d) fitted with Langmuir, Freundlich, and Toth models. | ||
| Samples | Correlation coefficients (R2) | n value from the Toth model | ||
|---|---|---|---|---|
| Langmuir isotherm | Freundlich isotherm | Toth isotherm | ||
| Commercial-NaA | 0.94969 | 0.94030 | 0.99882 | 0.89205 |
| NaA-SCBA | 0.96252 | 0.97310 | 0.99855 | 0.82932 |
| NaA-P | 0.95420 | 0.95021 | 0.99952 | 0.87752 |
| NaA-PS | 0.95380 | 0.94983 | 0.99960 | 0.87762 |
This behavior could be defined as an interaction between the adsorbed substances, which results in a slight growth after the plateau.46 The isotherms of these NaA samples are properly fitted by the Toth model, and it is marked that larger Al atom quantities lead to more heterogeneity, which could enhance the ability of CO2 adsorption.47 The highest n value and the Na/Si ratio, which could be assumed as the amount of Al, were obtained in the commercial NaA with 0.89205 and 0.63, respectively, while the lowest numbers were 0.82932 and 0.11 that were received from NaA-SCBA. Wang and coworkers47 also reported with a heterogeneous interpretation that 3.30 mmol g−1 of CO2/H2O adsorption was obtained when silicalite-1 was utilized as an adsorbent, followed by significantly increasing up to 3.99 mmol g−1 when Al was incorporated into the synthetic preparation of ZSM-5. Except for the Na content, the tendency of CO2 uptake in this work is also in line with the n values from the Toth model.
Besides, even if NaA-SCBA had a poor Na/Si ratio, the heterogeneity character remained high, probably as a result of interferences that raised the n value. Note that the Toth adsorption isotherm was frequently seen once activated carbon was employed as a material to remove CO2.42,46,48 Zeolite 13X initially provided a Sips CO2/N2 isotherm,34 then turned to the Toth model when 5% carbon black was included.43
Table 5 displays the comparison of the CO2 adsorption capacity of the present work to the relevant works including zeolitic, carbon, and N-droped carbon-based materials in the literature. It was noticeable that the NaA-P provided the best CO2 adsorption capacity than other adsorbents reported in the literature despite they were tested in almost similar conditions. In terms of the zeolitic material category, the pretreatment step also plays an important role in CO2 adsorption.41,49 Majchrzak-Kuceba and Nowak49 have revealed that the pretreatment temperature of zeolite NaA strongly affects the CO2 adsorption capacity. Likewise, the CO2 adsorption capacity enhances with the increase in pretreatment temperature from 100 °C to 500 °C. This finding indicates that the activation temperature of the zeolite is a critical factor for the CO2 sorption process, as higher activation temperatures lead to dehydration and the creation of additional adsorption sites.
| Sample | Condition pretreatment | CO2 adsorption capacity | Reference | |
|---|---|---|---|---|
| (mg g−1) | (mmol g−1) | |||
| a CO2 adsorption was measured at 25 °C and 1 bar in all samples, except zeolite 13X which was tested at 35 °C and 1 bar. | ||||
| Zeolite NaA-SCBA | 300 °C, 3 h under vacuum | 68.64 | 1.56 | This work |
| Zeolite NaA-P | 300 °C, 3 h under vacuum | 189.2 | 4.30 | This work |
| Zeolite NaA-PS | 300 °C, 3 h under vacuum | 180.4 | 4.10 | This work |
| Commercial-NaA | 300 °C, 3 h under vacuum | 192.7 | 4.38 | This work |
| Zeolite Y | No treatment | 96.0 | 2.18 | 4 |
| Zeolite 13Xa | 100 °C, 1 h | 154.0 | 3.50 | 57 |
| Hydrophobic-coated zeolite 13X (HZ) | ND | 149.6 | 3.40 | 58 |
| Zolite NaX from rich husk silica | 300 °C, 3 h | 107.8 | 2.45 | 10 |
| Zeolite NaA from rice husk silica | 300 °C, 3 h | 97.7 | 2.20 | 10 |
| Zeolite LTA | 300 °C, 3 h | 135.1 | 3.07 | 51 and 59 |
| Zeolite 4A | 200 °C, 12 h under vacuum | 149.2 | 3.39 | 60 |
| Zeolite 5A | 150 °C, 12 h under vacuum | 161.9 | 3.68 | 61 |
| N-rGO-ZnO | 150 °C, 3 h | 156.2 | 3.55 | 62 |
| Nitrogen-doped hierarchically constructed interconnected porous carbon nanofibers derived from polyaniline (PANI) | 200 °C, 2 h under vacuum | 176.4 | 4.01 | 63 |
| Activated carbon | 105 °C, 10 min | 72.3 | 1.64 | 64 |
| HAC-0.5 (activated carbon) | 300 °C, 3 h under vacuum | 174.7 | 3.97 | 65 |
| Chitosan-derived porous carbon (activated carbon) | 150 °C, 2 h under vacuum | 169.8 | 3.86 | 66 |
| N-Doped polypyrrole-based porous carbons | 200 °C and 1 bar | 171.6 | 3.9 | 67 |
| Rich nitrogen-doped ordered mesoporous carbon | 200 °C, 8 h under vacuum | 140.8 | 3.2 | 68 |
Compared to the result in the present work (Table 5), the CO2 adsorption capacity of NaA-P is the largest of other adsorbents could be caused by both the higher pretreatment temperature, 300 °C for 3 h under vacuum. When compared with other adsorbents such as some carbon and/or N-droped carbon-based materials reported in the literature (Table 5), NaA-P also had the highest adsorption capacity of CO2. The consequence might be caused by the greater basic density of NaA-P providing the impressed CO2 adsorption capacity. This result indicates the advantage of the NaA-P using silica from SCBA waste with the simplicity in the synthesis. This remark agrees well with the report in the literature1,50 that zeolite NaX 13 and NaA (4A) give greater adsorption capacity of CO2 than activated carbon (AC). Moreover, zeolite NaA has more selective to CO2 adsorption than zeolite NaY and NaX.51 This high selectivity of zeolite A is beneficial because CO2 needs to be separated from flue gas containing nitrogen, water, and oxygen.
Overall, this finding confirms that the NaA-P synthesized from SCBA silica is a promising adsorbent for CO2 adsorption because it provides high adsorption capacity and simplicity in the synthesis with mild conditions. Besides, the utilization of silica source material derived from SCBA is considered a cost-effective and eco-friendly approach for production, with the notable benefit for large-scale production.
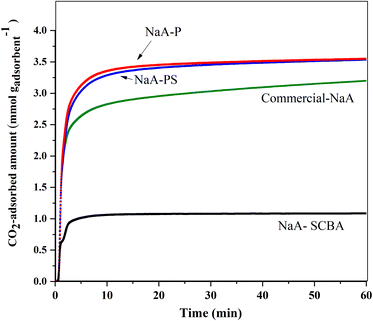
Fig. 10 demonstrates CO2 adsorption kinetics of the zeolite samples as a function of time measured at 25 °C and determined by the gravimetric method. The CO2 adsorption in all samples was initially rapid before reaching equilibrium. Similar behaviors were reported on zeolite NaX and 5A in the literature.52 The adsorption capacity of NaA-P and NaA-PS were nearly the same and higher than commercial NaA and NaA-SCBA.
Moreover, the adsorption kinetics of CO2 was investigated and analyzed according to the pseudo-first and pseudo-second order models reported in the literature on various zeolites.52,53 The pseudo-first-order model (eqn (4)) assumes that the concentration of one reactant is much higher than the concentration of the other reactants52
ln(qe − qt) = ln![[thin space (1/6-em)]](https://www.rsc.org/images/entities/char_2009.gif) qe − k1t qe − k1t
| (4) |
The pseudo-second-order model (eqn (5)) assumes that the availability of active sites on the adsorbent surface is always proportional to the adsorption capacity.52
 | (5) |
The kinetics parameters, correlation coefficient (R2) and adsorption capacity of all samples are summarized in Table 6. All samples correlated well with the pseudo-second-order kinetics model. The results are consistent with the adsorption kinetic model of CO2 on various zeolites including 13X, 5A, and 4A.52,53
| Adsorbent | Pseudo-first order | Pseudo-second order | ||||
|---|---|---|---|---|---|---|
| qe(cal) (mmol g−1) | K1 (min−1) | R2 | qe(cal) (mmol g−1) | K2 (min−1) | R2 | |
| Commercial NaA | 3.41 | 0.0663 | 0.8693 | 3.50 | 0.0035 | 0.9984 |
| NaA P | 3.83 | 0.0769 | 0.9101 | 3.92 | 0.0049 | 0.9990 |
| NaA-PS | 3.76 | 0.0793 | 0.8985 | 3.85 | 0.0055 | 0.9983 |
| NaA-SCBA | 1.31 | 0.0849 | 0.8536 | 1.32 | 0.0453 | 0.9998 |
One should note that the capacity of dynamic CO2 adsorption in commercial NaA is lower than those in NaA-P and NaA-PS, the opposite trend from the result of static adsorption isotherm measured by Autosorb IQ3 in Fig. 8. This phenomenon could be the consequence of the larger particle size in commercial NaA as shown in Fig. 5. It is reported in the literature54,55 that the smaller particle size in nano-sized CHA zeolite improved the CO2 adsorption capacity when compared with the micron-sized zeolite due to the minimized diffusion resistance of CO2.
3. Experimental
3.1 Chemicals and materials
Sugarcane bagasse ash was obtained from Mitr Phol Sugar industry, Chiyaphum Province, Thailand. Chemicals used for silica extraction and zeolite synthesis were hydrochloric acid (37%, ANaPURE®), sodium hydroxide (97% wt, Carlo Erba), sodium aluminate (50–56% Al2O3, 40–45% Na2O, Sigma-Aldrich). Commercial NaA zeolite was purchased from Sigma-Aldrich (CAS number: 1318-02-1). Chemicals employed for CO2 adsorption and CO2 temperature-programmed desorption (CO2-TPD) were CO2 gas with a purity of 99.99% and CO2 gas with 10% in He, respectively.3.2 Silica extraction from sugarcane bagasse ash waste
Silica extract extraction from sugarcane bagasse ash waste was done following the method adapted from the literature.23 Firstly, raw SCBA (20.00 g) was ground and sieved with particle sizes of 100 μm and subsequently treated in HCl solution (1.0 M) with the SCBA and HCl solution ratio of 1![[thin space (1/6-em)]](https://www.rsc.org/images/entities/char_2009.gif) :
:![[thin space (1/6-em)]](https://www.rsc.org/images/entities/char_2009.gif) 6 W/V at 30 °C for 2 h to remove some metal impurities. Then, the acid-treated SCBA was separated by centrifugation and dried at 100 °C overnight. Afterward, the silica extraction of acid-treated SCBA was done by NaOH solution treatment (1.0 M) with the ratio of acid-treated and NaOH solution = 1
6 W/V at 30 °C for 2 h to remove some metal impurities. Then, the acid-treated SCBA was separated by centrifugation and dried at 100 °C overnight. Afterward, the silica extraction of acid-treated SCBA was done by NaOH solution treatment (1.0 M) with the ratio of acid-treated and NaOH solution = 1![[thin space (1/6-em)]](https://www.rsc.org/images/entities/char_2009.gif) :
:![[thin space (1/6-em)]](https://www.rsc.org/images/entities/char_2009.gif) 8 W/V at 90 °C for 2 h. Then, the sodium silicate (Na2SiO3) solution was separated by the paper filter for particles smaller than 11 μm (no. 1) followed by a syringe filter for that than 0.45 μm. Finally, SiO2 powder was obtained by precipitation of hydrated Na2SiO3 in a mild HCl solution (1.0 M), separated using centrifugation, and dried at 100 °C overnight. The obtained silica powders from paper filter no. 1 were named SiO2-P and that from paper filter no. 1 followed by syringe filter was named SiO2-PS. The yield of obtained SiO2 powder was calculated according to eqn (6).
8 W/V at 90 °C for 2 h. Then, the sodium silicate (Na2SiO3) solution was separated by the paper filter for particles smaller than 11 μm (no. 1) followed by a syringe filter for that than 0.45 μm. Finally, SiO2 powder was obtained by precipitation of hydrated Na2SiO3 in a mild HCl solution (1.0 M), separated using centrifugation, and dried at 100 °C overnight. The obtained silica powders from paper filter no. 1 were named SiO2-P and that from paper filter no. 1 followed by syringe filter was named SiO2-PS. The yield of obtained SiO2 powder was calculated according to eqn (6).
 | (6) |
3.3 Synthesis of zeolite 4A using silica extracted from sugarcane bagasse ash waste
Zeolite 4A samples were synthesized directly from silica of as-received SBCA, SiO2-P, and SiO2-PS with an overall molar gel ratio of 6Na2O![[thin space (1/6-em)]](https://www.rsc.org/images/entities/char_2009.gif) :
:![[thin space (1/6-em)]](https://www.rsc.org/images/entities/char_2009.gif) Al2O3
Al2O3![[thin space (1/6-em)]](https://www.rsc.org/images/entities/char_2009.gif) :
:![[thin space (1/6-em)]](https://www.rsc.org/images/entities/char_2009.gif) SiO2
SiO2![[thin space (1/6-em)]](https://www.rsc.org/images/entities/char_2009.gif) :
:![[thin space (1/6-em)]](https://www.rsc.org/images/entities/char_2009.gif) 150H2O modified from the literature.56 NaOH (3.07 g) was dissolved in distilled water (22.52 g), and the NaOH solution was divided equally. The first part of the NaOH solution was mixed with sodium aluminate (1.59 g). Another part was added to the PP bottle and extracted silica from SBCA (2.00 g).
150H2O modified from the literature.56 NaOH (3.07 g) was dissolved in distilled water (22.52 g), and the NaOH solution was divided equally. The first part of the NaOH solution was mixed with sodium aluminate (1.59 g). Another part was added to the PP bottle and extracted silica from SBCA (2.00 g).
The first part was added to the PP bottle, followed by adding 5.00 g of SBCA or 2.00 g of extracted silica from SBCA (SiO2-P and SiO2-PS). The mixture was heated at 90 °C for 3 h and agitated magnetically. The second part was mixed with sodium aluminate (1.59 g) and stirred until clear. After that, the sodium aluminate mixture was immediately added to the sodium silicate mixture. The mixture was crystallized under hydrothermal conditions in an oven at 80 °C for 2.5 h. After cooling down, the mixture was separated using a centrifuge (4000 rpm for 10 minutes), washed with DI water several times until the washing water was neutral, and dried in an oven at 100 °C overnight. The obtained solid products were denoted as NaA-SCBA, NaA-P, and NaA-PS.
3.4 Characterization of silica from sugarcane bagasse ash waste
Morphology of zeolite particles was studied by scanning electron microscopy (SEM, Carl Zeiss, Auriga® series, Germany) with an accelerating voltage of 30 kV. The samples were coated with gold by sputtering. Also, elemental compositions were examined using a JEOL JSM 7800F field-emission scanning electron microscopy (FE-SEM) and scanning electron microscopy (SEM) with energy-dispersive X-ray spectroscopy (EDS). The phases of the zeolite samples were determined by X-ray diffraction (XRD, Bruker D8 ADVANCE, Germany) with Cu Kα radiation. Elemental compositions of samples were determined by X-ray fluorescence spectroscopy (ED-XRF, Horiba 5200).Fourier-transform infrared spectroscopy (FT-IR) using a Bruker Tensor 27 in Attenuated Total Reflectance (ATR) was used to detect the functional groups of SCBA and NaA zeolites. Moreover, their thermal decompositions were studied by using thermogravimetric analysis (TGA, Mettler TGA/DSC1). Each sample (10 mg) was heated from room temperature to 800 °C at a rate of 10 °C min−1 under an air zero with a flow rate of 50 mL min−1.
CO2 temperature-programmed desorption (CO2-TPD) on a BELSORP-mini−1 was used to assess the basicity of each adsorbent. Each sample (0.050 g) was packed in a quartz U-tube reactor before being processed at 500 °C for 1 h under a He flow rate of 50 mL min−1 and cooled to 70 °C under He flows. The system was then filled with CO2 (10%) diluted in He at a total flow rate of 50 mL min−1 for 30 min to allow for adsorption. Then, the temperature was raised to 100 °C and the system was purged for 1 h to eliminate the physisorbed CO2. Finally, the temperature was raised from 100 to 350 °C at a rate of 10 °C min−1. The amount of CO2 absorbed in mmol of CO2 was measured online by a TCD detector compared with the peak area of the known amount of CO2 from the calibration curve of the injection loop. The basicity in mmolCO2 gadsorbent−1) was calculated following the eqn (7).
 | (7) |
3.5 CO2 adsorption isotherms of zeolite NaA synthesized from SCBA waste
The CO2 adsorption was tested following the method in the literature.10 Briefly, each sample was degassed under vacuum at 300 °C for 3 h to remove physisorbed water, and then the adsorption process was achieved at 25 °C and the pressure range of 0.0–1.0 bar by using a Quantachrome Autosorb IQ3 analyzer. After that, the CO2-adsorbed amount was plotted against pressure to compare the adsorption isotherm. The CO2 adsorption capacity (mmol) of each adsorbent was calculated at the saturated point of 1 bar and 25 °C by changing the adsorbed volume of CO2 to mmol, respectively. The CO2 adsorption capacity (mmol gadsorbent−1) was calculated according to the eqn (8).
 | (8) |
3.6 CO2 adsorption kinetics of zeolite NaA synthesized from SCBA waste
The CO2 adsorption kinetics was measured by Gravimetric measurement adapted from the literature.69 Before the adsorption measurement, each sample (20 mg) was degassed at 300 °C for 1 h at the flow rate of 30 mL min−1 in N2. The adsorption process was performed at temperatures of 25 °C with a pressure of 1 bar. The flow rate of pure CO2 (99.99%) during the adsorption process was maintained at 30 mL min−1 for 1 h to ensure that the adsorption process reached equilibrium. Changes in mass were recorded by using thermogravimetric analysis (TGA) on Mettler Toledo TGA/DSC 3+. The CO2 adsorption capacity (mmol gadsorbent−1) was calculated following eqn (9).
 | (9) |
4. Conclusions
The development of an alternative silica extraction from sugarcane bagasse ash (SCBA) waste and utilization in NaA zeolite synthesis was accomplished by etching in NaOH solution to produce Na2SiO3. Then, the Na2SiO3 solution was separated either by paper filter No. 1 only or paper fitter No. 1 and a syringe filter (0.45 μm). SiO2 powder was obtained by the precipitation of those filtrates in HCl solution (1.0 M). The SiO2 purities obtained from the paper filter (SiO2-P, 98.1 wt%) and paper filter followed by syringe filter (SiO2-PS, 97.9 wt%) were significantly improved when compared with that from the as-received SCBA (77.2 wt%). Pure zeolite NaA (4A) was successfully synthesized from both SiO2-P and SiO2-PS. Meanwhile, mixed phases between zeolite NaA (5A) and quartz were obtained from the synthesis using SiO2-raw SCBA. From adsorption studies, the CO2 uptake was in the following order: commercial-NaA ∼ NaA-P > NaA-PS > NaA-SCBA, with respect to the amount of total basicity suggested by CO2-TPD. The CO2 adsorption behavior of all samples fits well with the Toth model. The CO2 adsorption kinetics correlates with the pseudo-second-order model. Moreover, the CO2 adsorption capacity of zeolite NaA-P in the present work was the largest of the reported values in the relevant literature. The research confirmed that the method to extract silica from SCBA was practical, affordable, and environmentally benign, and might be beneficial for large-scale manufacturing processes in the future.Author contributions
Chalermpan Keawkumay: conceptualization, methodology, investigation, formal analysis, data curation, writing-original draft preparation, and writing-review and editing. Panot Krukkratoke: methodology, formal analysis, investigation, data curation, writing-original draft preparation, and writing-review and editing. Saran Youngjan; formal analysis and investigation. Nattawut Osakoo: visualization, validation, methodology, investigation, formal analysis, data curation, writing-original draft preparation, and writing-review and editing. Krittanun Deekamwong: methodology and writing-review and editing. Pongtanawat Khemthong: formal analysis and investigation. Jakkapop Phanthasri: formal analysis and investigation. Sanchai Prayoonpokarach: conceptualization, supervision, validation, and writing-review and editing. Jatuporn Wittayakun: conceptualization, supervision, validation, and writing-review and editing. All authors have read and agreed to the published version of the manuscript.Conflicts of interest
There are no conflicts to declare.Acknowledgements
This work was supported by (i) Suranaree University of Technology (SUT), (ii) Thailand Science Research and Innovation (TSRI), and (iii) National Science, Research, and Innovation Fund (NSRF) (NRIIS No. 160349). Full-Time Doctoral Researcher Grant for Chalermpan Keawkumay, Nattawut Osakoo, and Krittanun Deekamwong was supported by (i) SUT, (ii) TSRI, and (iii) NSRF (90464/project code 90464), Thailand. The Kitti Bundit scholarship from SUT was available to Panot Krukkratoke for his research. This research has also received funding support from (i) Suranaree University of Technology (SUT) and (ii) the NSRF via the Program Management Unit for Human Resources & Institutional Development, Research and Innovation (PMU-B) (grant number B13F660067).References
- L. Hauchhum and P. Mahanta, Int. J. Energy Environ. Eng., 2014, 5, 349 CrossRef CAS.
- R. Ben-Mansour, et al., Appl. Energy, 2016, 161, 225 CrossRef CAS.
- S. Y. Lee and S.-J. Park, J. Ind. Eng. Chem., 2015, 23, 1 CrossRef CAS.
- L. G. T. Gouveia, et al., J. Environ. Chem. Eng., 2020, 8(4), 103823 CrossRef CAS.
- M. T. Ho, et al., Ind. Eng. Chem. Res., 2008, 47(14), 4883 CrossRef CAS.
- S. Lillia, et al., Int. J. Greenhouse Gas Control, 2018, 74, 155 CrossRef CAS.
- R. V Siriwardane, et al., Energy Fuels, 2005, 19(3), 1153 CrossRef.
- J. Wittayakun, et al., Korean J. Chem. Eng., 2008, 25, 861 CrossRef CAS.
- H. Prats, et al., J. CO2 Util., 2017, 19, 100 CrossRef CAS.
- J. Madhu, et al., RSC Adv., 2022, 12, 23221 RSC.
- A. M. Yusof, et al., J. Porous Mater., 2010, 17, 39 CrossRef CAS.
- H. Jia, et al., ACS Omega, 2021, 6(5), 3961 CrossRef CAS PubMed.
- P. Sharma, et al., J. Taiwan Inst. Chem. Eng., 2015, 50, 259 CrossRef CAS.
- Y. Li, et al., Energy Sources, Part A, 2021, 43(14), 1745 CrossRef CAS.
- K. Bunmai, et al., J. Taiwan Inst. Chem. Eng., 2018, 83, 152 CrossRef CAS.
- M. A. S. Schettino and J. N. F. Holanda, Procedia Mater. Sci., 2015, 8, 190 CrossRef CAS.
- H. Patel, RSC Adv., 2020, 10, 31611–31621 RSC.
- Q. Xu, et al., Mater, 2018, 12(1), 39 CrossRef PubMed.
- P. V. Andreão, et al., Waste Biomass Valorization, 2020, 11, 4393 Search PubMed.
- K. E. Hamilton, et al., Zeolites, 1993, 13(8), 645 CrossRef CAS.
- S. Norsuraya, et al., Procedia Eng., 2016, 148, 839 CrossRef CAS.
- N. S. Seroka, et al., Appl. Sci., 2022, 12(5), 2310 CrossRef CAS.
- P. Chindaprasirt and U. Rattanasak, Sci. Rep., 2020, 10, 9890 CrossRef CAS PubMed.
- F. Farirai, et al., Part. Sci. Technol., 2021, 39(2), 252 CrossRef CAS.
- L. Vasquez-Zacarias, et al., Glob. Chall., 2018, 2(7), 1700119 CrossRef PubMed.
- V. N. Castaldelli, et al., Mater, 2013, 6(8), 3108 CrossRef CAS PubMed.
- N. S. Seroka, et al., Nanomater., 2022, 12(13), 2184 CrossRef CAS PubMed.
- R. Babou-Kammoe, et al., Can. J. Chem. Eng., 2012, 90(1), 26 CrossRef CAS.
- J. I. M. Chisholm, Ann. Occup. Hyg., 2005, 49(4), 351 CAS.
- X. Luo, et al., RSC Adv., 2020, 10, 7976 RSC.
- N. Osakoo, et al., Mater. Chem. Phys., 2017, 193, 470 CrossRef CAS.
- B. L. Mojet, et al., Chem. Soc. Rev., 2010, 39(12), 4643 RSC.
- K. Bunmai, et al., Mater. Lett., 2020, 272, 127845 CrossRef CAS.
- E. Khoramzadeh, et al., J. Chem. Eng. Data, 2019, 64(12), 5648 CrossRef CAS.
- T. Kalaycı, et al., Phys. Sci. Int. J, 2013, 8(1), 1 CrossRef.
- S. Al-Jubouri, et al., Desalin. Water Treat., 2019, 165, 290 CrossRef CAS.
- S. Salehi and M. Anbia, J. Phys. Chem. Solids, 2017, 110, 116 CrossRef CAS.
- G. N. Muriithi, et al., J. CO2 Util., 2020, 36, 220 CrossRef CAS.
- Z. Qiang, et al., Energy Fuels, 2019, 33, 6641 CrossRef CAS.
- D. Bonenfant, et al., Sci. Technol. Adv. Mater., 2008, 9(1), 013007 CrossRef PubMed.
- N. Czuma, et al., Sci. Rep., 2020, 10, 1825 CrossRef CAS PubMed.
- D. P. Vargas, et al., Int. J. Mol. Sci., 2012, 13(7), 8388 CrossRef CAS PubMed.
- E. Khoramzadeh, et al., Sep. Purif. Technol., 2022, 280, 119917 CrossRef CAS.
- P. J. E. Harlick and F. H. Tezel, Sep. Sci. Technol., 2005, 40(13), 2569 CrossRef CAS.
- J. Young, et al., Energy Environ. Sci., 2021, 14, 5377 RSC.
- L. Bokanyi, Conference: XXVI Int. J. Miner. Process., 2012 Search PubMed.
- Y. Wang, et al., RSC Adv., 2020, 10, 24642 RSC.
- J. SREŃSCEK-NAZZAL, et al., Acta Phys. Pol., A, 2016, 129(3), 394 CrossRef.
- I. Majchrzak-Kucęba and W. Nowak, Thermochim. Acta, 2005, 437(1–2), 67 CrossRef.
- J. McEwen, et al., Chem. Phys., 2013, 412, 72 CrossRef CAS.
- E. D. Akten, et al., Energy Fuels, 2003, 17(4), 977 CrossRef CAS.
- V. K. Singh and E. A. Kumar, Energy Procedia, 2016, 90, 316 CrossRef CAS.
- V. Ramos, et al., Cerâmica, 2021, 67, 434 CrossRef CAS.
- E. B. Clatworthy, et al., J. Chem. Eng., 2023, 471, 144557 CrossRef CAS.
- G. Confalonieri, et al., Microporous Mesoporous Mater., 2020, 306, 110394 CrossRef CAS.
- P. Khaosomboon, et al., Int. J. Eng. Res. Technol., 2018, 7(38), 1376 CAS.
- M. Minelli, et al., Chem. Eng. J., 2018, 341, 505 CrossRef CAS.
- M. Kim, et al., J. Cleaner Prod., 2022, 337, 130597 CrossRef CAS.
- C. Chen and W. S. Ahn, Appl. Surf. Sci., 2014, 311, 107 CrossRef CAS.
- D. Panda, et al., Ind. Eng. Chem. Res., 2019, 58(13), 5301 CrossRef CAS.
- F. Gao, et al., J. Mater. Chem. A, 2015, 3, 8091 RSC.
- W. Li, et al., Appl. Surf. Sci., 2016, 360(Part A)), 143 CrossRef CAS.
- Y. Li, et al., J. Environ. Chem. Eng., 2022, 10(6), 108847 CrossRef CAS.
- N. Di Fidio, et al., J. Cleaner Prod., 2023, 428, 139359 CrossRef CAS.
- Y. Li, et al., J. Environ. Chem. Eng., 2021, 9(5), 106149 CrossRef CAS.
- X. Fan, et al., Carbon, 2013, 61, 423 CrossRef CAS.
- M. Sevilla, et al., Adv. Funct. Mater., 2011, 21(14), 2781 CrossRef CAS.
- J. Wei, et al., Adv. Funct. Mater., 2013, 23(18), 2322 CrossRef CAS.
- T. Gunawan, et al., RSC Adv., 2018, 8, 41594 RSC.
| This journal is © The Royal Society of Chemistry 2024 |

