DOI:
10.1039/D4RA02110J
(Paper)
RSC Adv., 2024,
14, 16765-16777
Effective isolation of succinic acid from aqueous media with the use of anion exchange resins†
Received
19th March 2024
, Accepted 30th April 2024
First published on 24th May 2024
Abstract
The primary objective of this study was to examine the isolation of succinic acid (SA) from aqueous-based solutions through the utilization of adsorption and ion exchange methods. Four kinds of anion exchange resins were employed, two of which were strong basic (Lewatit M-500 and Lewatit M-600), and the other two were weak basic (Lewatit MP-64 and Lewatit MP-62). The impacts of various variables on the efficiency of the process were examined. The aqueous pH strongly influenced the separation yield. Weak basic exchangers achieved the maximum yield at pH 2.1. However, the highest performance with Lewatit M-600 and Lewatit M-500 was obtained at pH 5 and 6, respectively. The SA separation with the tested resins reached equilibrium in about an hour. The recovery data revealed consistency with the Langmuir isotherm and pseudo-second-order kinetics. Efficiency improved with resin dosage and reduced with SA concentration. It was found that weak basic anion exchange resins were more efficient than strong basic exchangers for the recovery process. Among the resins tested, Lewatit MP-62 demonstrated the highest sorption capacity of 321 mg g−1 and 97.5% yield. The performance of the system decreased with temperature for all alternatives tested; however, its impact was not notable. The isolation process had an exergonic, exothermic, and favorable character based on the thermodynamic constants. Acid-loaded resins were successfully regenerated using trimethylamine and HCl for weak and strong anion exchange resins, respectively.
1 Introduction
The demand for carboxylic acids (succinic, lactic, levulinic, acetic, formic, itaconic, propionic acids, etc.) increases day by day due to their use as raw materials to meet daily needs such as drugs, food, perfumes, toys, etc.1 Succinic acid (SA, C4H6O4) is a four-carbon acid that is also known as butanedioic acid, amber acid, and 1,2-ethanedicarboxylic acid.2 It is an important platform chemical, and its global production was approximately 38 kton in 2013–2014. Over the next two years, production surged to 50 kton, positioning SA as one of the fastest-growing bio-chemicals on the market. In 2025, the global demand and market for SA are estimated to reach approximately 95 kton and 1.8 billion USD, respectively.3,4 As well as being extensively employed in the chemical, food, and pharmaceutical industries,5 it can be the precursor to many commercially significant chemicals, including 1,4-butanediol, tetrahydrofuran, fumaric acid, and several biodegradable polymers.6 It is traditionally produced with different chemical methods such as paraffin oxidation, catalytic hydrogenation, and electro-reduction of maleic acid or maleic anhydride.7 Nevertheless, the strict focus on environmental issues and the exhaustion and escalation in the cost of fossil fuels have prompted the search for alternative and sustainable production routes.8 Succinic acid, similar to other organic acids, can be manufactured by the industrial process of fermenting carbohydrates obtained from lignocellulosic biomass.9 In general, more than 50% of the total cost of SA production is used for the separation process.10
Some recovery methods of carboxylic acid, such as precipitation, distillation, reactive extraction, electrodialysis, adsorption, and ion exchange, have been examined.11,12 Ion exchange and adsorption have become viable approaches due to their high performance, cost-effectiveness, simplicity, and environmentally favorable characteristics.13 Although these techniques have been evaluated for the recovery of several carboxylic acids,14–19 the number of reports on the isolation of SA is limited and more reports are required. Davison et al. tested twenty-five commercial resins for SA isolation from aqueous-based media and showed that XUS 40285 had a good and stable performance at acidic and neutral pH conditions. The capacities were in the range of 20–110 mg g−1 and regeneration trials included the use of hot water, acidic, and basic agents.20 SBA-15 modified with amine groups were evaluated for the adsorption of several carboxylic acids, including SA and pyruvic acid. Higher sorption capacities for pyruvic acid enabled its selective separation from binary acid solutions containing SA.21 In a different study, several adsorbents synthesized by National Engineering Research Center for Biotechnology (NERCB, Beijing, China) were tested for SA recovery. The highest adsorption and regeneration performance was obtained with NERCB 09, a polystyrene type weak alkaline anion exchange resin. The selectivity of the resin towards SA in the presence of other acids and amino acids was noted, and the process was adversely affected by temperature increases.22 Another resin, NERCB-04, was used in a packed bed system for SA removal from fermentation medium. The results confirmed that SA concentration has a high impact on the removal efficiency and indicated that the resin can be used as a buffer for in situ product removal and pH neutralization of the media.23 Hydrotalcite granules prepared using bentonite as a binding agent were employed for succinate anion removal at pH 6.5, and >95% efficiency was obtained.24 Seven styrene–divinylbenzene macroporous resins were evaluated for SA isolation under batch conditions. NKA-9 was selected as the optimum resin with a capacity higher than 150 mg g−1 and the authors proposed that pore size is a more important factor than the surface area.25 Recently, Omwene et al. studied the chromatographic separation of SA from a fermentation medium containing various types of carboxylic acid and sugars. The authors tested three different types of resins, investigated the effects of process variables, and found Amberlite IRA958 Cl to be the most compatible alternative.26
Although the isolation of organic acids from aqueous solutions using several types of anion exchangers is well-documented, the number of resins tested for SA recovery remains limited. Moreover, effective and reusable anion exchange resins are still needed for commercial production. The objective of this study was to investigate the use of strong (Lewatit M-500 and Lewatit M-600) and weak (Lewatit MP-62 and Lewatit MP-64) anion exchange resins, which have not been tested before, for the recovery of SA from aqueous-based solutions. The impacts of several factors on process yield were considered, including pH, equilibrium time, temperature, initial SA concentration, resin dosage, and regenerability of the resin. The parameters were assessed to select the most appropriate resin for utilization. In addition, the data were also examined by using thermodynamic constants, four isotherms, and four kinetic models to understand the mechanism of the process. The experimental data were statistically analyzed by One-Way Analysis of Variance (ANOVA).
2 Experimental
2.1 Materials
Four different anion exchange resins, Lewatit M-500, Lewatit M-600, Lewatit MP-64, and Lewatit MP-62, supplied by Sigma-Aldrich, were used in the trials. Their properties are given in Table S1.† The resins are similar in matrix structure but differ in functional groups. Lewatit M-500 and Lewatit M-600 have quaternary amines as functional groups; Lewatit MP-62 has tertiary amines; and Lewatit MP-64 has a mixture of tertiary and quaternary amines. Succinic acid (C4H6O4, Mw = 118.09 g mol−1, ≥99%) was purchased from Alfa Aesar, sodium hydroxide (NaOH) and hydrochloric acid (HCl) from Merck, and trimethylamine (TMA, ≥99%) from Sigma-Aldrich. In experimental studies, ultra-high-purity (UHP) water obtained from Millipore Direct-Q 3V was employed in the preparation of all aqueous solutions. The chemicals utilized in the trials were not subjected to any pre-treatment and were all analytical grade.
2.2 Effect of aqueous pH
The effect of pH on the separation of SA was tested in the range of pH 1–7 and pH 1–10 for weak and strong anion exchange resins, respectively.22,25 The pH of the 0.3 M SA solution was measured to be 2.1, and pH adjustment was carried out using aqueous HCl and NaOH. The trials were conducted in 50 mL conical glass flasks that contained a mixture of 1 g of resin and 10 mL of the aqueous SA solution. After an hour, the residual SA concentration in the aqueous solution was measured.
2.3 Kinetic
Kinetic studies provide information on the time necessary for the system to attain equilibrium. For this purpose, the experiment was started simultaneously for several test samples and ended at different time periods. These systems were prepared by adding 1 g of resin and 10 mL of SA solution (0.3 M) to 50 mL flasks. Experimental kinetic studies were carried out at 298 K and a shaking speed of 150 rpm for 3 h.
2.4 Equilibrium
The study also examined the impacts of the initial concentration of SA and anion exchanger resin dosage on the effectiveness of the separation process. Aqueous SA solutions were prepared with varying concentrations ranging from 0.1 to 0.5 M, and the dosage of resin varied between 0.5 and 1.5 g/10 mL. Experimental runs were conducted by contacting the phases at 298 K and 150 rpm for 1 h.
2.5 Thermodynamics and impact of temperature
The temperature effect on the separation process was observed by analyzing the data obtained at three temperatures: 298 K, 318 K, and 338 K. The thermodynamic constants were calculated according to the data. The dosage of resin was kept constant at 1 g/10 mL, and the total SA concentration in the system or aqueous medium was changed between 0.1 and 0.5 M.
2.6 Regeneration of resins
1.5 g of the resin was utilized for the recovery of SA from the loaded anion exchange resin. They were produced from the trials where the initial SA concentration was 0.2 M. The resin was separated from the SA solution by centrifugation at 6000 rpm for 2 min. The SA-loaded resin was washed carefully with UHP water to remove any un-adsorbed SA. Then the resin was stirred using a magnetic stirrer with 10 mL of 0.5 M trimethylamine solution for weak anion exchange resins and 0.1 M HCl solution for strong anion exchange resins for 1 h.
2.7 Assay method and statistics
The concentration of SA in the aqueous phase was determined using an HPLC. The detection of SA during the analysis was carried out using a UV detector. An Agilent Technologies-1220 Infinity LC instrument equipped with a UV detector and a C18 column (ACE) were employed. A solution of 0.05 M mono potassium phosphate (KH2PO4) + 1% acetonitrile at pH 2.8 was used as the mobile phase, and the analysis was conducted at a flow rate of 1.25 mL min−1 and a column temperature of 30 °C. The SA concentration in the aqueous sample was determined using the UV detector set at 210 nm.27 The uncertainties of the experimental data were determined by utilizing equation (eqn (1)), which was within ± 0.02. Eqn (2)–(4) were used to determine the resin capacity (qe), recovery efficiency (E), and desorption efficiency (ED) by taking the averages of the concentration values.| |
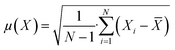 | (1) |
| |
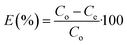 | (2) |
| |
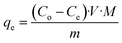 | (3) |
| |
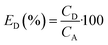 | (4) |
The means of the groups were compared using the one-way analysis of variance (ANOVA) approach. The purpose of this was to assess whether there was a statistically significant difference among the various groups. The Tukey test was employed for conducting pairwise comparisons. The predetermined significance level for hypothesis testing was fixed at 0.05.
3 Results and discussion
3.1 Effect of aqueous pH
The pH may influence the ionization of the solute in the aqueous phase as well as the charge density on the resin surface; consequently, it can affect the behavior of both the resin and the target product.28,29 The recovery mechanism is dependent upon the resin type employed and the type of acid present in the solution. SA is a dicarboxylic acid, and its ionization equations in aqueous solutions are given in eqn (5) and (6).| | |
H2SA + H2O ↔ HSA− + H3O+ (pKa1 = 4.21)
| (5) |
| | |
HSA− + H2O ↔ SA2− + H3O+ (pKa2 = 5.64)
| (6) |
Earlier reports have shown that weak basic anion exchangers performed better in acidic media at pH < pKa1.30 Gluszcz et al. proposed that the adsorption of an organic acid onto weakly basic anion exchange resins occurs due to the acid-base neutralization reaction. Accordingly, a two-step mechanism is proposed, including the protonation of the resin functional group and electrostatic forces between the partially charged ions and surface (eqn (7) and (8)).31
| | |
R-NHδ+ + HSAδ− ↔ R-NH2SA
| (8) |
Fig. 1 exhibits that the initial pH of the aqueous solution significantly influenced the recovery performance of all anion exchange resins tested (p-value < 0.05). When weakly basic anion exchange resins (Lewatit MP-62 and Lewatit MP-64) were used, the highest yields were reached at pH 2.1, which was the original pH of the aqueous-based SA solution. The trend was due to the high concentration of undissociated SA molecules in the aqueous medium. Moreover, the involvement of hydrophobic interactions in the process has also been documented.22,32,33 Although the undissociated acid concentration was higher at pH 1, the efficiency was lower, most probably due to the interactions between HCl molecules and tertiary amines on the surface.12 The adsorption yield decreased with increasing initial pH, and when it exceeded the pKa2 value, the resin's capacity to adsorb SA diminished even more and eventually reached 1–5% at a pH of 7, as illustrated in Fig. 1. The trend could be attributed to the deprotonation of carboxylic groups of SA.13
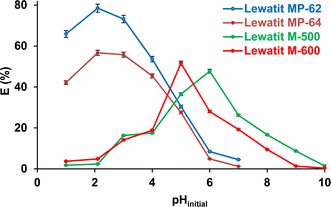 |
| | Fig. 1 The effect of pHinitial on SA recovery with anion exchange resins used (initial SA concentration: 0.3 M, resin dose: 1 g/10 mL, temperature: 298 K). Error bars represent standard deviation of uncertainty. | |
The separation effectiveness of strong anion exchange resins is contingent upon the amount of dissociated acid species, namely HSA− and SA2−. Therefore, the process can preferentially or effectively occur at pH > pKa1.34 It can be observed that the Lewatit M-600 resin has a higher separation efficiency when the initial pH is between the ionization constants (pKa1< pH < pKa2), i.e., when mostly only one carboxyl group of the SA molecule is deprotonated. However, Lewatit M-500 has a higher separation efficiency around pKa2, where the two carboxyl groups of the majority of the SA molecules are deprotonated. The chloride anion (Cl−) bound to the functional group (quaternary ammonium) in the resin interacts with the H3O+ to produce HCl.29 Furthermore, the Fig. 1 shows that these strongly basic anion exchangers can also recover SA at pH 2–4, where dissociated acid concentration is lower in the medium, and hydrophobic interactions have been proposed to be one of the most important factors for the tendency.31–33 The experimental results are in agreement with earlier literature, which revealed that the separation of a dicarboxylic acid, i.e., SA, exhibits a strong dependence on pH, and the maximum performance is obtained at a pH close to the pKa2 value.20,23
3.2 Contact time and kinetic models
The separation of SA by using anion exchange resins depends on the contact time (Fig. 2). The equilibrium time was almost identical for the four resins tested and was about one hour. Three different periods are clearly visible in this curve: the first step represents a very rapid adsorption of SA molecules on the available sites; the second shows a gradual rise towards saturation; and the third stage marks the equilibrium reached due to the occupation of all active sites; comparable tendencies have been documented in previous literature.27,35,36
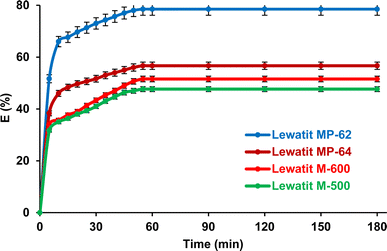 |
| | Fig. 2 Impact of the contact time on the isolation of SA using anion exchange resins from aqueous medium (initial SA concentration: 0.3 M, resin dose: 1 g/10 mL, temperature: 298 K, pH = 2.1 for Lewatit MP-62 and Lewatit MP-64, pH = 6 for Lewatit M-500 & pH = 5 for Lewatit M-600). Error bars represent standard deviation of uncertainty. | |
In order to evaluate the kinetic data in Fig. 2, four models, namely, pseudo-first-order, pseudo-second-order, Elovich, and intraparticle diffusion, were applied. The non-linear and linear equations are listed in Table S2.†37–40 The kinetic parameters calculated for the separation of SA by these anion exchange resins are given in Table 1. For all resins, the determination coefficients for pseudo-first-order kinetic model were less than 0.94. In addition, the qe values calculated based on this model notably differed from the experimental values, showing that pseudo-first-order interaction cannot explain the sorption of SA onto these resins. The results also show that the Elovich model, which is usually used to describe chemisorption on a heterogeneous surface, is not entirely reliable to elucidate the kinetic data (Fig. S1†).
Table 1 Parameters and determination coefficients obtained with the kinetic models for the isolation of SA using studied resins
| Kinetic models |
Parameters |
Lewatit MP-62 |
Lewatit MP-64 |
Lewatit M-500 |
Lewatit M-600 |
| Experimental |
qmax,exp (mg g−1) |
278.1 |
200.8 |
168.9 |
182.7 |
| Elovich model |
α (mg g−1 min−1) |
1.111 |
1.177 |
1.128 |
1.105 |
| β (mg g−1) |
36.039 |
24.851 |
23.811 |
26.150 |
| R2 |
0.9434 |
0.9772 |
0.9389 |
0.8979 |
| Pseudo-first order model |
qe (mg g−1) |
132.3 |
86.7 |
102.4 |
119.76 |
| k1 (min−1) |
0.073 |
0.061 |
0.064 |
0.057 |
| R2 |
0.9195 |
0.9335 |
0.8905 |
0.8605 |
| Pseudo-second order model |
qe (mg g−1) |
294.1 |
208.3 |
181.8 |
200.0 |
| k2 (L mg−1 min−1) |
0.00101 |
0.00137 |
0.00095 |
0.00073 |
| R2 |
0.9991 |
0.9984 |
0.9919 |
0.9872 |
| Intraparticle diffusion model |
kid (mg g−1 min−1) |
15.26 |
10.88 |
11.25 |
12.81 |
| I (mg g−1) |
172.1 |
123.14 |
88.0 |
85.7 |
| R2 |
0.8744 |
0.9329 |
0.9904 |
0.9786 |
It can be seen from Table 1 and Fig. 3a that the determination coefficients for pseudo-second-order kinetics were ≥0.99, indicating that the kinetic data follow this model for all anion exchange resins tested.34,35,41 Additionally, the calculated qe values agreed well with the experimental values. This also signifies that chemical or physiochemical interactions take place during the sorption of SA on these anion exchange resins. The intra-particle diffusion model also gives an estimation for the rate-controlling stage of the adsorption process. As previously mentioned in several reports, adsorption occurs in three stages: (1) diffusion of acid molecules from the aqueous bulk solution to the resin surface, which depends on the number of effective collisions or speed of mixing; (2) intra-particle or internal diffusion, transportation of the solute molecules into the pores; and (3) adsorption of the target product on the active sites of the solid adsorbent or resin.42 If the intra-particle model is the only rate-controlling step of the adsorption process, the straight line of qe versus t0.5 is expected to pass through the origin. However, the straight line does not intersect the origin, signifying that there are also other mechanisms that control the rate of the process (Fig. 3b).13
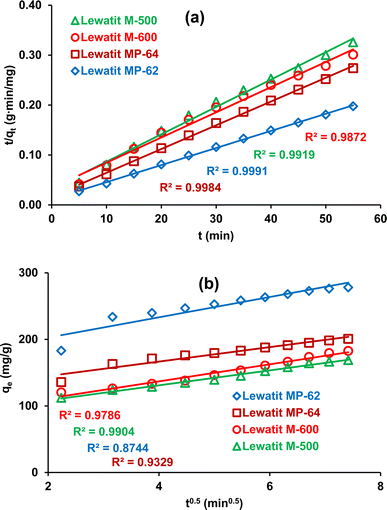 |
| | Fig. 3 The plots of the kinetic analysis for the isolation of SA using anion exchange resins (a) pseudo-second-order kinetic model (b) intra-particle-diffusion model. | |
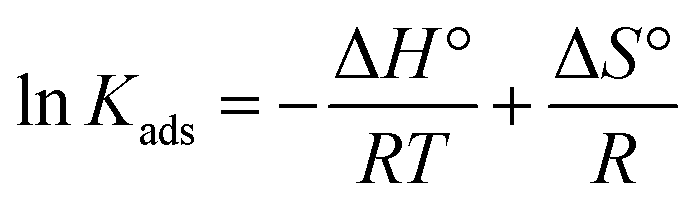
3.3 Effect of temperature and thermodynamic parameters
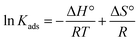
The effect of temperature was investigated. The experiments were carried out at 298, 318, and 338 K. The initial SA concentration varied from 0.1 to 0.5 M, while the resin dose was kept constant at 0.5 gresin/10 mL. It can be observed that the separation efficiency insignificantly decreased (p-value > 0.05) with raising the temperature from 298 to 338 K for all resins (Fig. 4). This phenomenon can be attributed to the damage to the active binding sites on the resin surface at higher temperatures. These findings are consistent with previous reports.43–46 The tendency also refers to the exothermic nature of the carboxylic acid recovery process using anion exchange resins. The thermodynamic parameters, including the change in standard free energy (ΔG°), enthalpy (ΔH°), and entropy (ΔS°), were calculated from the eqn (9)–(11).| |
ΔG° = −RT![[thin space (1/6-em)]](https://www.rsc.org/images/entities/char_2009.gif) lnKads lnKads
| (9) |
| |
 | (11) |
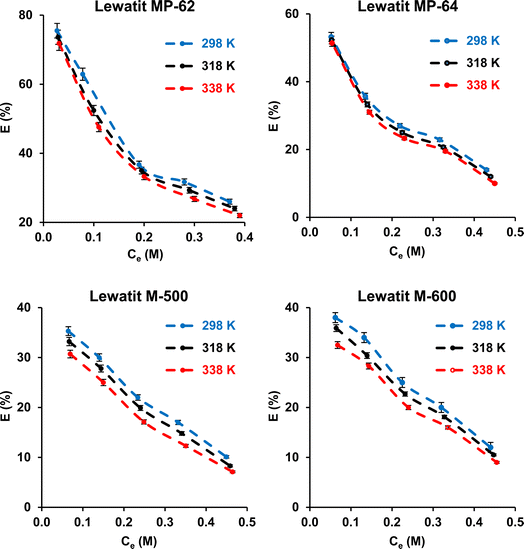 |
| | Fig. 4 Effect of temperature on the separation of SA using anion exchange resins (initial SA concentration: 0.1–0.5 M, resin dose: 0.5 g/10 mL, temperature: 298–338 K, pH = 2.1 for Lewatit MP-62 and Lewatit MP-64; pH = 6 for Lewatit M-500 & pH = 5 for Lewatit M-600). Error bars represent standard deviation of uncertainty. | |
The thermodynamic parameters for the separation of SA with anion exchange resins are illustrated in Table 2. The negative enthalpy values (ΔH°) for all resins tested confirm the exothermic nature of the separation process. The positive ΔS° values with Lewatit MP-62 and Lewatit M-500 resins show the increase in randomness at the solid–solution interface of SA. On the other hand, the negative ΔS° values for Lewatit MP-64 and Lewatit M-600 resins indicate that the interface between the resin and SA becomes more orderly during the SA recovery. The negative values of Gibbs free energy change (ΔG°) indicate that the separation process is feasible and spontaneous. In our study, ΔG° values in the range of −20 to 0 kJ mol−1 confirmed that the process follows a physical or physicochemical mechanism. Similar findings have been found for recovering carboxylic acids using various resins and adsorbents.47,48 These results and trends are in line with those findings.
Table 2 The thermodynamic parameters for the separation of SA using studied resins
| Resin |
T (K) |
ΔG° (kJ mol−1) |
ΔH° (kJ mol−1) |
ΔS° (J mol−1 K−1) |
R2 |
| Lewatit MP-62 |
298 |
−10.30 |
−4.14 |
20.23 |
0.9979 |
| 318 |
−10.27 |
| 338 |
−11.15 |
| Lewatit MP-64 |
298 |
−15.55 |
−63.08 |
−160.78 |
0.9421 |
| 318 |
−11.08 |
| 338 |
−9.22 |
| Lewatit M-500 |
298 |
−4.82 |
−1.78 |
9.70 |
0.8651 |
| 318 |
−4.87 |
| 338 |
−5.24 |
| Lewatit M-600 |
298 |
−5.37 |
−7.86 |
−8.48 |
0.9657 |
| 318 |
−5.07 |
| 338 |
−5.05 |
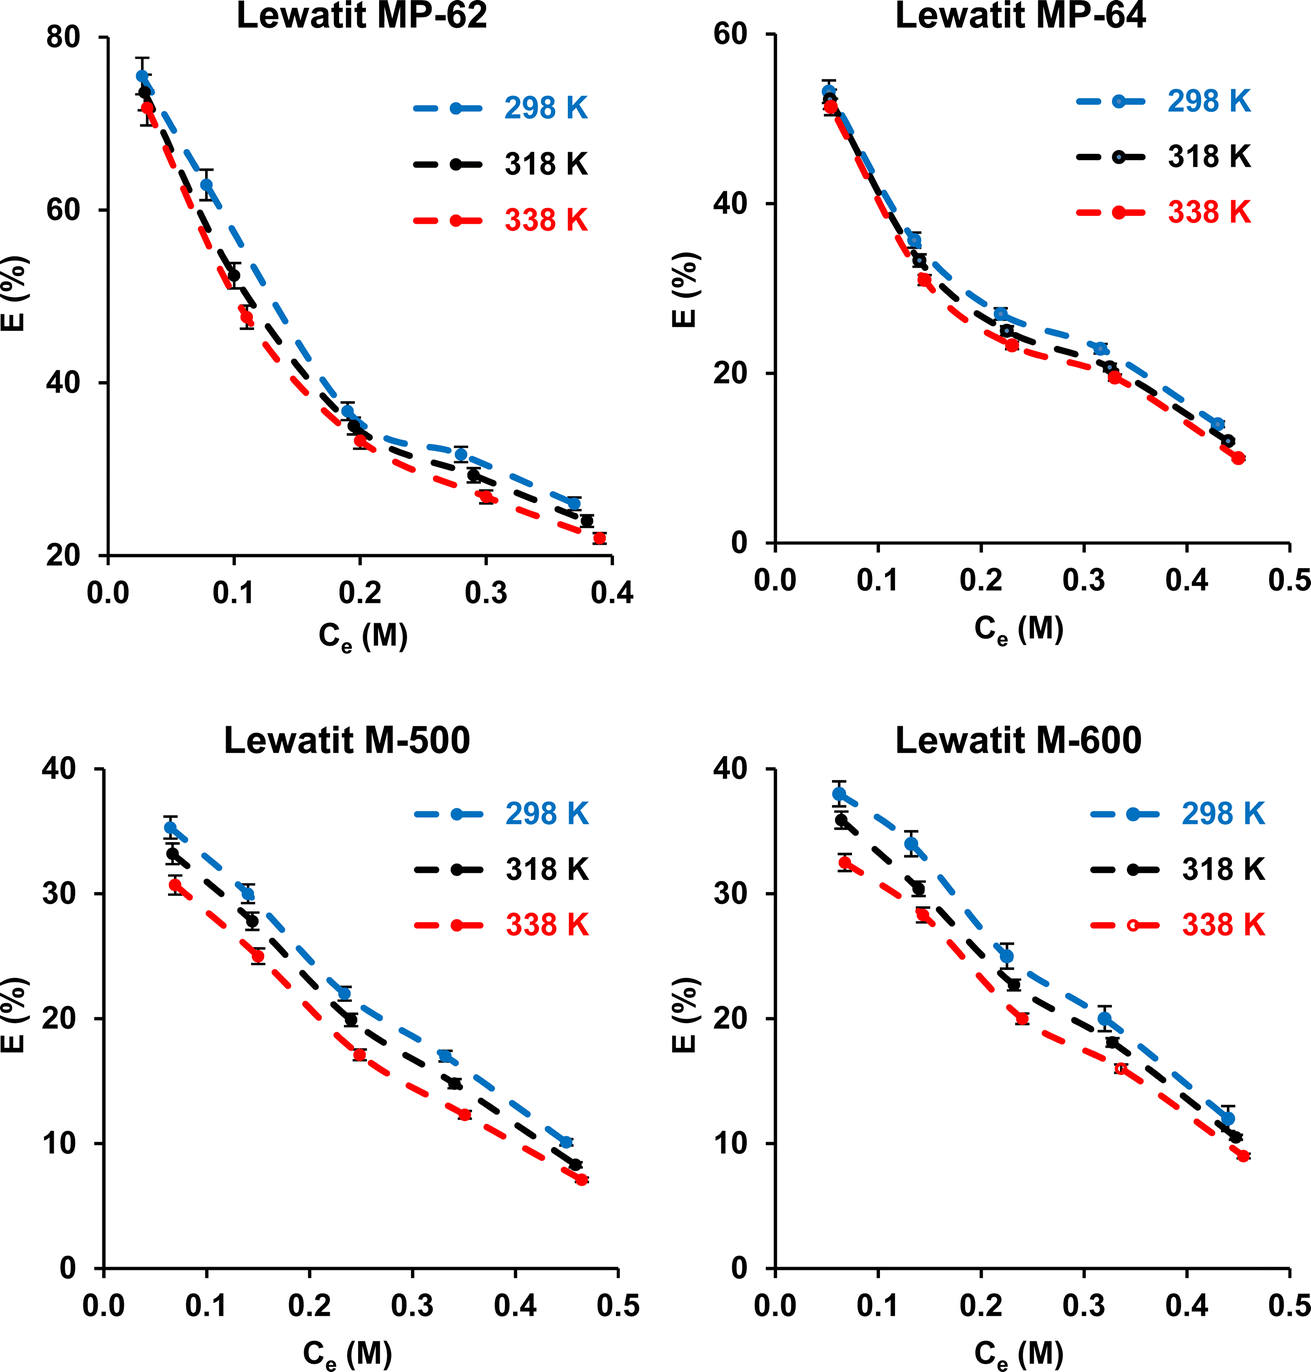
3.4 Effect of initial SA concentration and anion exchanger dose
The effects of SA concentration and anion exchanger dosage on the recovery yield and sorption capacity were probed. The trials were performed at 298 K, and initial pH values were not adjusted for weak basic anion exchange resins but were adjusted to pH values where the maximum recovery yields were attained for strong basic anion exchange resins. The initial concentration of SA varied between 0.1 and 0.5 M, while the resin dose ranged from 0.5 to 1.5 g/10 mL. Fig. 5 shows that the recovery efficiencies remarkably decreased with increasing initial acid concentration and increased with resin dosage (p-value < 0.05). The accessible sites on the resin surface are abundant for SA molecules in the system at lower acid concentrations and higher resin doses. As the SA concentration increases, the sites are rapidly occupied by SA molecules, resulting in a decrease in the separation efficiency.49–51 The trend was clearly noticed for both weak and strong basic anion exchangers. As a result, maximum separation efficiency values were obtained at 0.1 M SA concentration and 1.5 g/10 mL dose level, as they were 97.5%, 85.5%, 64.3%, and 60% for Lewatit MP-62, Lewatit MP-64, Lewatit M-600, and Lewatit M-500, respectively. Confirming the literature reports, the yields obtained with weak basic anion exchange resins (Lewatit MP-62 and Lewatit MP-64) were higher than those reached with strong basic anion exchangers (Lewatit M-500 and Lewatit M-600).30,31,43,44 In particular, Lewatit MP-62 with tertiary amines as functional groups exhibited superior separation efficiency compared to all tested resins at all SA concentrations and doses. This was followed by Lewatit MP-64, which contains both tertiary amine and quaternary ammonium groups on its surface. At the natural pH of the solution, around 2.1, the majority of acids in the aqueous medium are in undissociated state and cannot be adsorbed by anion-binded quaternary ammonium groups. This can be the reason for lower yields with Lewatit MP-64 compared to Lewatit MP-62. Moreover, the maximum sorption capacities were obtained at the highest SA concentration level studied, and their values were 321.2, 205.5, 200.8, and 181.1 mg g−1 for these anion exchanger resins (Fig. 6). This graph also illustrates that the isotherm curves are compatible with the Type I isotherm (Langmuir isotherm) for all resins employed.13,27 This suggests that the resin surfaces are monolayer-coated with SA molecules during the recovery process.
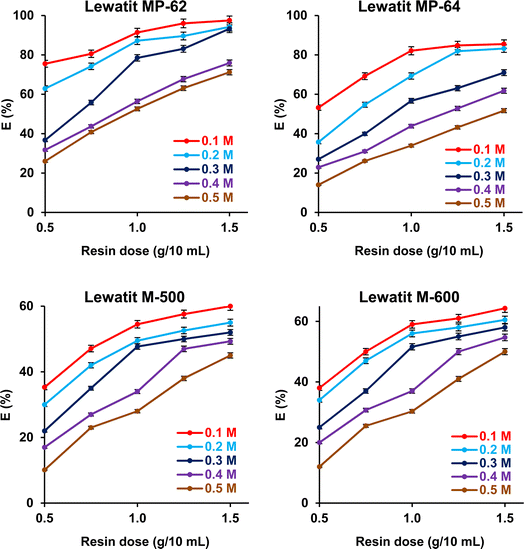 |
| | Fig. 5 The dependence of separation efficiency on the resin dose and initial SA concentration (initial SA conc.: 0.1–0.5 M, resin dose: 0.5–1.5 g mL−1, temp.: 298 K, pH = 2.1 for Lewatit MP-62 and Lewatit MP-64; pH = 6 for Lewatit M-500 & pH = 5 for Lewatit M-600). Error bars represent standard deviation of uncertainty. | |
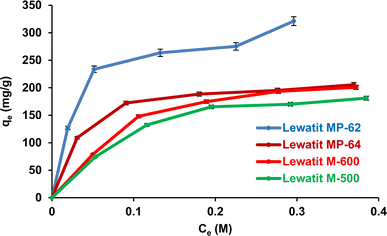 |
| | Fig. 6 Isotherm curves for the separation of SA using anion exchange resins (initial SA concentration: 0.1–0.5 M, resin dose: 0.5 g/10 mL, temperature: 298 K, pH = 2.1 for Lewatit MP-62 & Lewatit MP-64; pH = 6 for Lewatit M-500 and pH = 5 for Lewatit M-600). Error bars represent standard deviation of uncertainty. | |
3.5 Statistical analysis
The significance of the process variables on the SA recovery efficiency was assessed using the one-way ANOVA method.52 The statistical results, such as degrees of freedom (DF), sum of squares (SS), mean square (MS), F statistic, and p-value, are presented in Table 3. The ANOVA test revealed that the p-values for pH, resin dose, and initial SA concentration were all less than 0.05. Hence, these three parameters have significant influences on the recovery efficiency (p-value < 0.05, Table 3). Nevertheless, the influence of temperature was determined to be insignificant for all resins examined. Tukey's HSD was employed by setting a significance level of 0.05 to assess whether there is a difference between the means of all potential pairs since the null hypothesis was rejected (p-value < 0.05).53,54 Based on the results, there were statistically significant differences (p < 0.05) observed in the efficiency values across all tested pH, SA concentration, and resin dose values.
Table 3 The significance and statistical results of each parameter on the process performance for the recovery of SA using tested resins according to one-way ANOVA analysis
| Resin |
Parameter |
DF |
SS |
MS |
F statistic |
p-value |
| Lewatit MP-62 |
pH |
6 |
11508 |
471 |
12 |
0.0042 |
| Initial SA concentration |
23 |
70002 |
228 |
258 |
6 × 10⁻²¹ |
| Resin dose |
23 |
68808 |
228 |
253 |
9 × 10⁻²¹ |
| Temperature |
14 |
5193 |
392 |
0.2 |
0.6255 |
| Lewatit MP-64 |
pH |
6 |
6199 |
265 |
11 |
0.0055 |
| Initial SA concentration |
23 |
46463 |
230 |
154 |
1 × 10⁻¹⁶ |
| Resin dose |
23 |
45540 |
230 |
150 |
2 × 10−61 |
| Temperature |
14 |
2821 |
215 |
0.1 |
0.7101 |
| Lewatit M-500 |
pH |
9 |
2966 |
125 |
6 |
0.0274 |
| Initial SA concentration |
23 |
24494 |
93 |
216 |
2 × 10⁻¹⁹ |
| Resin dose |
23 |
23802 |
93 |
209 |
4 × 10⁻¹⁹ |
| Temperature |
14 |
1210 |
89 |
0.5 |
0.4708 |
| Lewatit M-600 |
pH |
9 |
2752 |
127 |
4 |
0.0412 |
| Initial SA concentration |
23 |
29171 |
105 |
229 |
7 × 10⁻²⁰ |
| Resin dose |
23 |
28411 |
105 |
222 |
1 × 10⁻¹⁹ |
| Temperature |
14 |
1250 |
92 |
0.6 |
0.4581 |
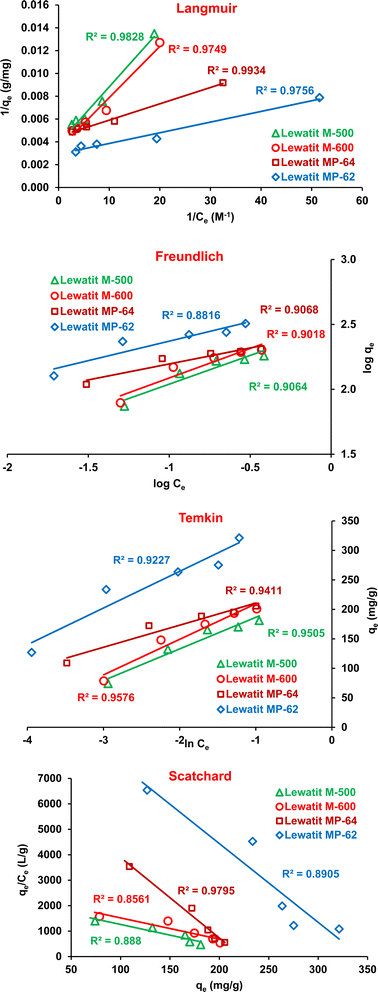
3.6 Isotherm models
Adsorption isotherms are useful to understand the affinity of the resin surface for target acid and to determine the mechanism of the process. The isotherm curves show the dependence of the amount of acid adsorbed per unit mass of resin (qe, mg g−1) on the equilibrium acid concentration (Ce, M). The most commonly used isotherms in liquid–solid systems are the Langmuir, Freundlich, Temkin, and Scatchard models.55–58 The linear equations of these models are given in Table S3.† Fig. 7 and S2† show that the Langmuir isotherm had higher determination coefficients (0.9934 > R2 > 0.9749, Fig. 7) than the Freundlich (0.9068 > R2 > 0.8816), Temkin (0.9576 > R2 > 0.9227) and Scatchard (0.9795 > R2 > 0.8561) isotherms for all resins. The Langmuir isotherm indicates that there is a single layer of SA coating on the resin surface, which also suggests that the resin surface has a uniform structure with a consistent number of energetically equal adsorption sites.59 The favorability of the adsorption process was evaluated using the dimensionless separation factor (RL) of the Langmuir isotherm. The RL values between zero and one suggest a favorable adsorption process. Otherwise, the process is considered unfavorable (RL > 1), linear (RL = 1), or irreversible (RL = 0).60,61 Table 4 signifies that the RL values are in the range of 0 and 1, suggesting favorable SA adsorption onto the tested anion exchangers. The Freundlich isotherm model describes the exponential distribution of active sites on surfaces that are not uniform or heterogeneous.62 Based on the n value, adsorption was found to be favorable (n > 1, Table 4), consistent with the results achieved with the Langmuir isotherm model. Moreover, the R2 values obtained with the Temkin model were relatively high, indicating that the adsorption heat may decrease linearly with the coating of the resin surface with SA molecules. Therefore, all isotherm models used in this study showed relative compatibility with the experimental data. This indicated that more than one mechanism is valid for the adsorption of SA on these anion exchange resins.34,63 Moreover, the Scatchard model also provides information about the resin surface and binding sites. If a linear fit is obtained from the Scatchard model, it is concluded that the resin surface has a uniform active zone (homogenous surface). Otherwise, i.e., when a non-linear relationship is observed, it indicates that the resin surface has more than one type of binding site (heterogeneous surface).64 The relatively high R2 values for the linearity reached with the Scatchard model and the agreement of qmax values may indicate that the equilibrium data fits with the Langmuir isotherm model or homogenous adsorption process.
 |
| | Fig. 7 The plots of the isotherm models for the isolation of SA onto anion exchange resins (initial SA concentration: 0.1–0.5 M, resin dose: 0.75 g/10 mL, temperature: 298 K, pH = 2.1 for Lewatit MP-62 & Lewatit MP-64; pH = 6 for Lewatit M-500 and pH = 5 for Lewatit M-600). | |
Table 4 The parameters and R2 values of the Langmuir, Freundlich, Temkin and Scatchard isotherm models for the separation of SA using studied resins at 298 K
| Resin type |
Langmuir |
Freundlich |
| qmax (mg g−1) |
KL (L mg−1) |
RL |
R2 |
n |
Kf (L mg−1) |
R2 |
| Lewatit MP-62 |
344.8 |
32.2 |
0.058–0.237 |
0.9756 |
3.33 |
469.1 |
0.8816 |
| Lewatit MP-64 |
222.2 |
45.0 |
0.086–0.275 |
0.9934 |
4.06 |
276.4 |
0.9068 |
| Lewatit M-500 |
256.4 |
7.8 |
0.317–0.599 |
0.9828 |
2.26 |
303.6 |
0.9064 |
| Lewatit M-600 |
294.1 |
8.5 |
0.164–0.270 |
0.9749 |
2.20 |
348.3 |
0.9018 |
| Resin type |
Temkin |
Scatchard |
| B (J mol−1) |
KT (L mg−1) |
R2 |
qmax (mg g−1) |
KS (L mg−1) |
R2 |
| Lewatit MP-62 |
62.2 |
518.8 |
0.9227 |
343.5 |
30.93 |
0.8905 |
| Lewatit MP-64 |
37.5 |
752.4 |
0.9411 |
223.0 |
31.67 |
0.9795 |
| Lewatit M-500 |
53.6 |
88.2 |
0.9505 |
250.3 |
8.40 |
0.8880 |
| Lewatit M-600 |
60.3 |
87.8 |
0.9576 |
282.1 |
8.35 |
0.8561 |
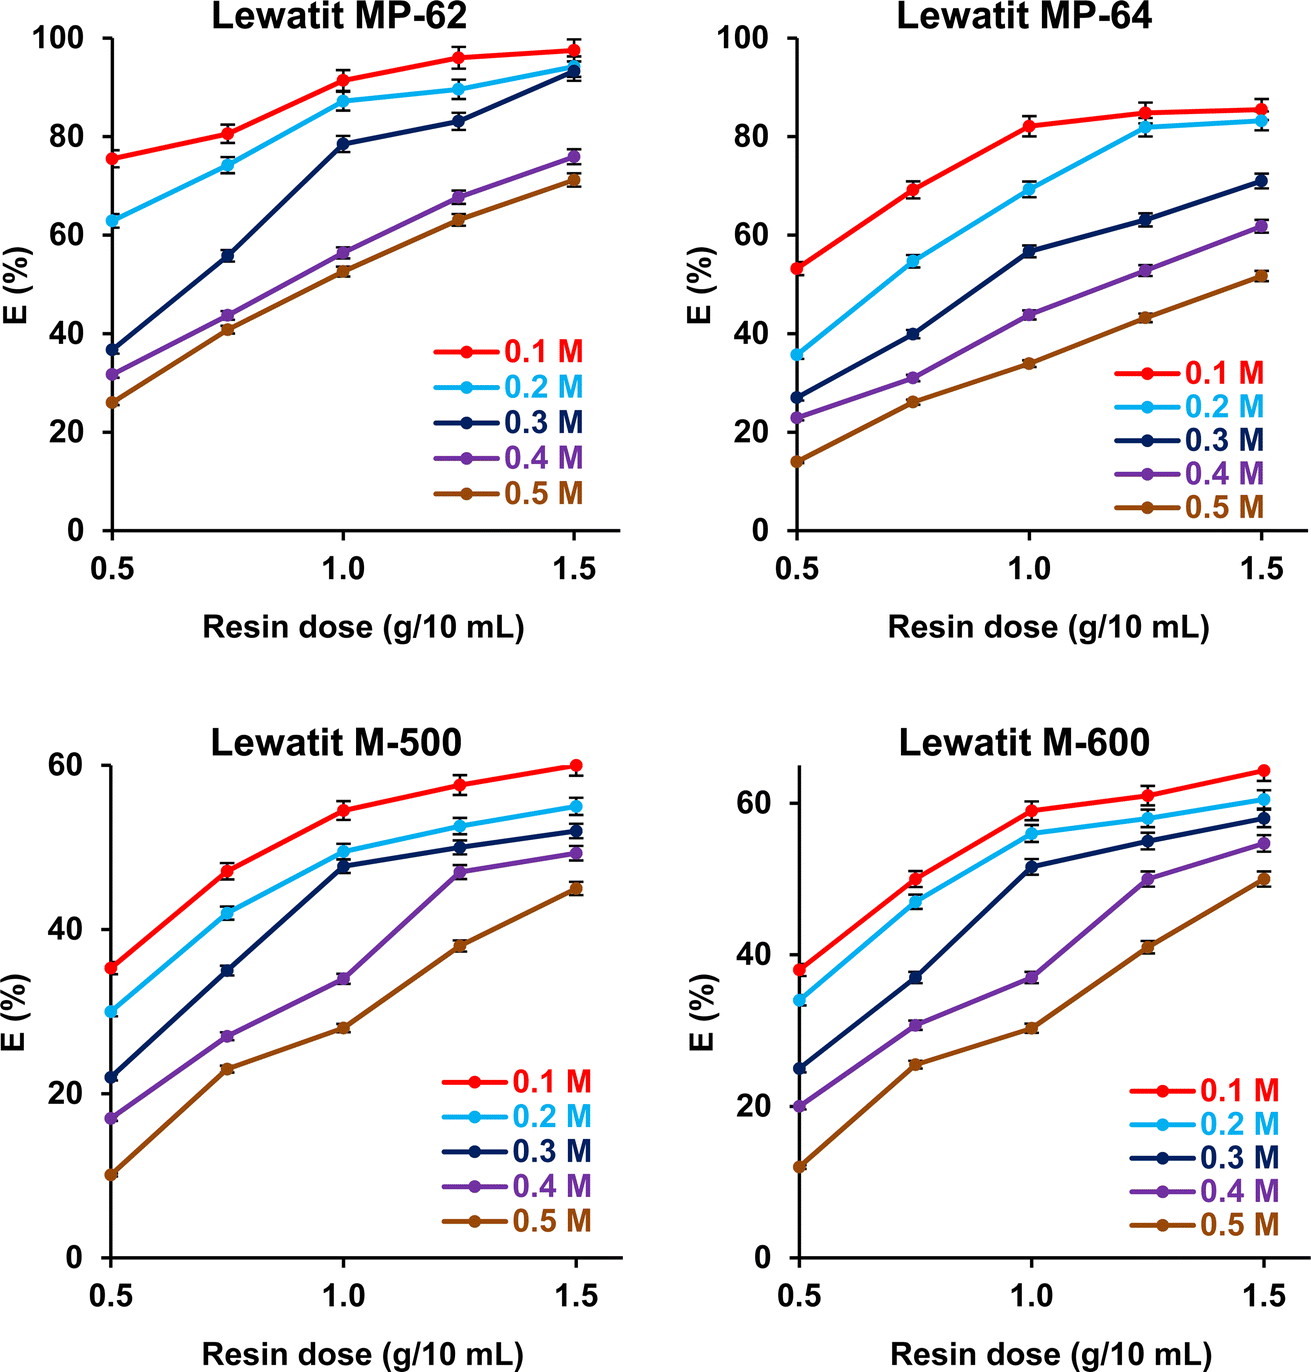
3.7 Regeneration and reusability
The regeneration of SA from anion exchange resins was studied. 0.5 M TMA and 0.1 M HCl (pH 1) solutions were used during the elution of SA from the loaded resin (1.5 gresin/0.2 M resin) for weak and strong anion exchange resins, respectively. The data show that the desorption yields with 0.5 M TMA were ∼97% for weak anion exchange resins, and those with 0.1 M HCl were ∼96% for strong anion exchange resins (Fig. 8).
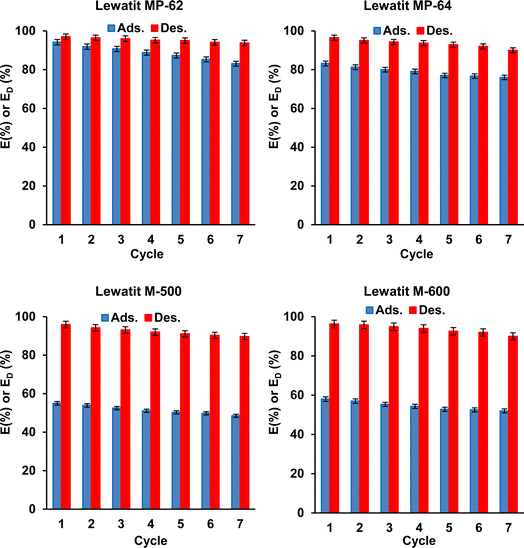 |
| | Fig. 8 Regeneration and reusability of studied resins for the separation of SA from aqueous solutions (ads.: initial SA conc.: 0.2 M, temp.: 298 K, resin dose: 1.5 g/10 mL, pH = 2.1 for Lewatit MP-62 & Lewatit MP-64; pH = 6 for Lewatit M-500 and pH = 5 for Lewatit M-600; des.: temp.: 298 K, eluent: TMA for Lewatit MP-62 & Lewatit MP-64 and HCl (0.1 M) for Lewatit M-500 & Lewatit M-600). Error bars represent standard deviation of uncertainty. | |
Fig. 8 illustrates the results of the reuse tests. According to this, the recovery yields of the resins gradually but slightly decreased with each reuse, and the trend was observed for all resins tested. Over seven adsorption–desorption cycles, the yields decreased from 94.2% to ∼83% for Lewatit MP-62, from ∼83% to 76% for Lewatit MP-64, from 58% to 52% for Lewatit M-600, and from 55.0% to 48.5% for Lewatit M-500. The decrease may be attributed to the resin loss during the adsorption process and/or the destructive effect of the stripping agent. However, the decrease in yield was not significant. In addition, the desorption efficiencies obtained using fresh TMA or HCl solutions also insignificantly varied during these tests. The data clearly show that the resins tested in this study can be used in sequential adsorption–desorption cycles. In other words, the results and trends indicate that these anion exchangers have the potential to provide a cost-effective application for SA recovery from aqueous solutions due to their reusability.
3.8 Comparison
The key features of an ideal resin or adsorbent are high capacity, specificity or selectivity, and regenerability. As previously mentioned, the literature contains studies that have examined various types of resins for carboxylic acid recovery. However, there are few systematic studies on the application of these resins for SA isolation. Most of the reports employed or evaluated weak basic anion exchange resins. There are only a few studies testing strongly basic anion exchangers. According to earlier reports, the yields with the strong basic anion exchangers were usually lower than those obtained with the tested weak basic anion exchangers.20,30,31,43,44 The mechanism of acid separation with these two types of resins is different. In addition, matrix type may also play a significant role in the process.41 The characteristics of SA adsorption onto weak basic anion exchangers encompass various types of mechanisms, including acid-base interaction, van der Waals forces, hydrogen bonding, hydrophobic attraction, or a combination thereof.65 Therefore, the process takes place at low pH levels (pH < pKa1) when a weak basic anion exchanger is employed. On the other hand, when a strong basic anion exchange resin is used, the anion of the acid molecule is exchanged with the anion bound to the resin, and the process is more efficient when the dissociated acid concentration is higher in the aqueous medium.
Table 5 compares the uptake or adsorption capacities obtained for SA recovery in this study with each other and with the values reported in the previous reports. If available, maximum sorption capacities were used. Tung and King found that strongly basic anion exchange resins performed better than weakly basic ones at pH 6, most likely due to the higher concentration of dissociated acids in the medium.66 Davison et al. evaluated twenty-five resins and identified the most suitable alternatives based on various process variables. Although the capacities obtained with the resins ranged from 20 to 110 mg g−1, those achieved with the most compatible alternatives were observed to be around 60 mg g−1 at an initial SA concentration of 1–5 g L−1. Increasing the concentration may influence the maximum capacity reached with these anion exchangers. Among the resins tested, XUS 40285 was shown to be the best alternative due to its selectivity towards SA on glucose, regenerability, and its good and stable isotherm capacity at both neutral and acidic pH values. The researchers have added that using hot water is not enough to completely regenerate the resin and suggested employing acid or base for this purpose.20 SBA-15 is a mesoporous material that can be functionalized with various types of chemical groups and used for the separation of chemicals from aqueous-based media.67 Primary, secondary, and tertiary amino silane functionalized SBA-15 were tested for the recovery of several carboxylic acids through hydrogen bonding between acid and amine molecules. The authors stated that the adsorption of these molecules was considerably influenced by the pH of the solution. Competitive adsorption of acids with these adsorbents was studied. Secondary- and tertiary amine-SBA-15 exhibited selectivity for fumaric acid, while primary amine-SBA-15 preferably removed pyruvic acid from SA, indicating that selective separation of these acids from multi-acid solutions is possible using amine functionalized SBA-15 adsorbents. The highest adsorption capacities for pyruvic acid (139 mg g−1) and SA (∼65 mg g−1) were obtained with primary- and tertiary amine-SBA-15, respectively.21 Eleven alkaline anion exchange resins were screened for SA removal in pH 7, 5.0 g L−1 initial SA concentration at 25 °C. The acrylic and polystyrene type resins provided higher capacities and regenerability compared to the styrene and epoxy based adsorbents. In batch systems, the capacities obtained with the resins ranged from 19 to 116 mg g−1; the highest uptake capacity was obtained with NERCB-09 (a polystyrene type weak alkaline resin) and adsorption with this adsorbent was negatively influenced by aqueous pH. Another benefit is its high selectivity for SA over both glucose and amino acids in acidic or neutral media. The regenerability of the sorbents were higher than 90% with 0.5 M NaOH.22 From the same resin set, NERCB-04, an epoxy-based anion exchange resin, was tested for in situ product removal from fermentation broth. In addition, the pH of the production medium was kept around pH 7.0 by neutralizing the system.23 Seven styrene–divinylbenzene macroporous resins were tested for the recovery of SA and the results were correlated with the polarity of the resins by Sheng et al. The resins were classified according to their characteristics as non-polar, weak-polar, polar and strong-polar. It was shown that polar resins (NKA-9 and HPD-500) were the most appropriate resins for the purpose. Although HPD-500 has a higher surface area, the yields were higher with NKA-9, indicating that pore size is one of the main parameters affecting the uptake capacity; and the highest capacity with this resin was 155.9 mg g−1. Moreover, the optimum pH of the exothermic physisorption process was detected as 2.0.25 Schöwe et al. stated that the typical problem of using classical ion exchange resin is the lack of selectivity and biofouling. Therefore, they proposed the use of layered double hydroxides or hydrotalcites as an alternative to anion exchange resins for SA recovery. Hydrotalcites were granulated because they cannot be used in packed bed columns due to their small size and low specific density. Comparable recoveries were obtained with hydrotalcite granules (47.2 mg g−1) at pH 6.5 in the column system. The authors added that the uptake capacity over 12 consecutive adsorption–desorption runs was above 95% of the initial adsorption capacity.24 As previously stated, most studies tested the weak basic anion exchange resins. However, in a recent study, Omwene studied the chromatographic separation of SA from a fermentation medium at pH 6.5 containing different types of sugars and carboxylic acids, each with a concentration of <15 g L−1, using two strong basic resins (Amberlite IRA958 Cl and Amberlite HPR 900 OH) and a weak basic anon exchange resin (Amberlyst A21). The researchers achieved similar yields with the resins tested; however, they demonstrated that the uptake performance of macroporous resins was slightly higher than that of the polyacrylic resins due to the hydrophobic nature of the former. Their data showed that the separation yields with Amberlyst A21, Amberlite HPR 900 OH, and Amberlite IRA958 Cl were 76.1%, 69.3%, and 81.2%, respectively.26
Table 5 Comparison of the maximum adsorption capacities obtained at optimum parameters for SA recovery using various types of resins and adsorbents. (WBA: weak basic anion exchanger, SBA: strong basic anion exchanger)
| Resin/adsorbent |
Type of resin/adsorbent |
Capacity (max. if available (mg g−1)) |
Optimum pH |
Temperature (K) |
Concentration (M) |
Reference |
| WBA: weak basic anion & SBA: strong basic anion. |
| Lewatit MP-62 |
WBAa |
321.2 |
2.1 |
298 |
0.1–0.5 |
This study |
| Lewatit MP-64 |
205.5 |
| Lewatit M-600 |
SBAa |
200.8 |
5 |
| Lewatit M-500 |
181.1 |
6 |
| XUS 40285 |
WBA |
61 |
2 |
298 |
0.042 |
20 |
| MWA-1 |
60 |
| XUS 40091 |
40 |
| IRA-93 |
70 |
| IRA-35 |
110 |
| XAD-4 |
40 |
| MWA-1 |
20 |
| MSA-1 |
SBA |
40 |
6 |
| XUS 40323 |
40 |
| XUS 40283 |
60 |
| Silicalite powder |
Hydrophobic molecular sieve |
70 |
2 and 6 |
| Silicalite pellet |
50 |
| Primary amine-functionalized SBA-15 |
Hydrophobic molecular sieve |
60.2 |
3 |
298 |
1.319–1.902 |
21 |
| Secondary amine-functionalized SBA-15 |
48.4 |
3 |
0.671–3.687 |
| Tertiary amine-functionalized SBA-15 |
64.9 |
3 |
0.647–2.486 |
| NERCB 09 |
WBA |
110 |
2.6 |
298 |
0.423 |
22 |
| Hydrotalcite granules |
Hydrophobic molecular sieve |
47.2 |
6.5 |
298 |
0.085–0.339 |
24 |
| NKA-9 |
WBA |
155.9 |
2 |
283 |
0.085–0.423 |
25 |
Based on these studies and results, poly-styrene-based macroporous resins with various functional groups were selected to be tested in SA isolation. While it was aimed to reach higher capacities with weakly basic anion exchange resins, the use of strongly basic resins, which have not yet been thoroughly studied in the literature, was investigated. The trends observed for the resins tested were mostly similar to those reported in previous studies. As previously stated, the yields with Lewatit MP-64 and Lewatit MP-62 were higher than those with Lewatit M-500 and Lewatit M-600, which confirms the superiority of weak basic anion exchangers and is in line with the prior reports. According to Table 5, the capacities achieved with these four resins were higher than the majority of values reached for batch systems in the literature. Moreover, the yields were not significantly affected by reuse for all resins tested. In particular, the capacity obtained with Lewatit MP 62, a weakly basic exchanger with tertiary amine functional groups, is significantly higher than almost all resins studied in the literature. The capacities with the strong anion exchange resins tested were also relatively high. Lewatit M-500 is a Type I strong anion exchanger while Lewatit M-600 is a Type II. They differ in the alkyl moieties in the quaternary ammonium functional groups. As it is shown by several manufacturers, while Type I is more stable and can be used at higher temperatures, Type II is has a marginally lower basicity and provide slightly higher capacity. In line with this, the maximum capacity reached with Lewatit M-600 was almost 10% higher than that with Lewatit M-500.
4 Conclusions
Succinic acid has great potential in industry, and its bio-based production is of interest, which requires its effective and inexpensive recovery. Four anion exchange resins were successfully tested for the uptake of succinic acid (SA) from aqueous media. The maximum recovery yields were obtained at the original or unadjusted pH (2.1) of the SA solution with weak basic anion exchanger resins, Lewatit MP-62 and Lewatit MP-64. However, the highest performance of Lewatit M-500 and Lewatit M-600 were observed at pH 6 and 5, respectively. The data were in agreement with the pseudo-second-order kinetics and Langmuir isotherm models, indicating the roles of chemical or physicochemical forces in the recovery process. Equilibrium data showed that the separation process reached equilibrium within an hour for all resins studied. Moreover, the separation process was negatively affected by increasing temperature, indicating the exothermic nature of the process. The negative values of ΔH° for all tested resins also supported this. The recovery yields decreased with the increase in initial SA concentration and increased with the increase in resin dose. Consistent with earlier reports, among the tested resins, weak basic anion exchanger resins were more efficient than strong basic anion exchangers. The maximum capacity (321.2 mg g−1) and efficiency (97.5%) were obtained with Lewatit MP-62, a weak basic anion exchanger with tertiary amine functional groups. The desorption yield was ∼97% with 0.5 M TMA for weak anion exchange resins whilst ∼96% with 0.1 M HCl for strong anion exchange resins. The resins tested in this study exhibited maximal capacities that surpassed the majority of the values reported in the literature. Reusability tests showed that both adsorption and desorption efficiencies decreased insignificantly within seven sorption-desorption cycles.
Abbreviations
| B | Temkin equilibrium binding constant, J mol−1 |
| Co | Initial concentration of acid, mmol mL−1 |
| CA | Concentration of acid sorbed onto resin, M |
| CD | Concentration of acid sorbed from resin, M |
| Ce | Equilibrium concentration of acid, mmol mL−1 |
| DF | Degrees of freedom |
| E | Separation efficiency, % |
| ED | Desorption efficiency, % |
| f | Fisher–Snedecor distribution (statistic test) |
| HSA− | Dissociated succinic acid |
| H2SA | Succinic acid |
| I | Boundary layer diffusion effects (external film resistance), mg g−1 |
| SA2− | Dissociated succinic acid |
| k | Constant related to the adsorption energy, mol2 kJ−2 |
| k1 | Pseudo first order rate constant, min−1 |
| k2 | Pseudo second order rate constant, L mg−1 min−1 |
| Ka | Acid dissociation constant, m3 kmol−1 |
| kid | Intraparticle diffusion rate constant, mg g−1 min−0.5 |
| KF | Freundlich adsorption constant, L mg−1 |
| KL | Langmuir equilibrium constant, L mg−1 |
| KS | Scatchard adsorption constant, L mg−1 |
| KT | Temkin constant related to the adsorption heat, L mg−1 |
| m | Mass of resin, g |
| M | Molecular weight of succinic acid, mg mmol−1 |
| MS | Mean square |
| N | Number of observations |
| n | Freundlich adsorption intensity |
| p | Probability value (statistic test) |
| qe | Amount of acid sorbed per gram resin at equilibrium, mg g−1 |
| qmax | Maximum amount of acid sorbed per gram resin, mg g−1 |
| qt | Amount of acid sorbed per gram resin at time t, mg g−1 |
| R | Gas constant, 8.314 J mol−1 K−1 |
| RL | Dimensionless separation factor |
| R2 | Determination coefficient |
| SBA | Strong basic anion |
| SS | Sum of squares |
| t | Time, minute |
| T | Temperature, K |
| V | Volume of the aqueous solution, mL |
| WBA | Weak basic anion |
| Xi | The experimental observation |
![[X with combining macron]](https://www.rsc.org/images/entities/i_char_0058_0304.gif) | Mean of four observations |
| α | Elovich initial adsorption rate, mg g−1 min−1 |
| β | Elovich desorption constant, g mg−1 |
| ε | Adsorption potential, J2 mol−2 |
| μ | Experimental uncertainty |
| ΔG° | Change in Gibbs free energy, kJ mol−1 |
| ΔH° | Change in enthalpy, kJ mol−1 |
| ΔS° | Change in entropy, J mol−1 K−1 |
Conflicts of interest
There are no conflicts to declare.
Acknowledgements
This research received no specific grant from any funding agency. The authors wish to acknowledge Konya Technical University for the facilities used in this study.
References
- H. Zeidan and M. E. Marti, J. Water Proc. Eng., 2023, 56, 104299 CrossRef.
- J. P. Tan, J. M. Jahim, S. Harun and T. Y. Wu, J. Phys. Sci., 2017, 28, 53–72 CAS.
- N. M. Kosamia, A. Sanchez and S. K. Rakshit, Biomass Convers. Biorefin., 2024, 14, 8729–8743 CrossRef.
- N. P. Nghiem, S. Kleff and S. Schwegmann, Fermentation, 2017, 3, 26 CrossRef.
- B. Rukowicz, ACS Sustain. Chem. Eng., 2023, 11, 11459–11469 CrossRef CAS.
- L. Handojo, A. K. Wardani, D. Regina, C. Bella, M. T. A. P. Kresnowati and I. G. Wenten, RSC Adv., 2019, 9, 7854–7869 RSC.
- K. K. Cheng, X. B. Zhao, J. Zeng and J. A. Zhang, Biofuels, Bioprod. Biorefin., 2012, 6, 302–318 CrossRef CAS.
- R. Kumar, B. Basak and B. H. Jeon, J. Cleaner Prod., 2020, 277, 123954 CrossRef CAS.
- A. A. I. Luthfi, J. Jahim, S. Harun, J. P. Tan and A. W. Mohammed, RSC Adv., 2017, 7, 49480–49489 RSC.
- S. Zhou, M. Zhang, L. Zhu, X. Zhao, J. Chen, W. Chen and C. Chang, Biotechnol. Biofuels, 2023, 16, 1–17 CrossRef CAS PubMed.
- M. E. Marti, H. Zeidan and H. Uslu, Fluid Phase Equilib., 2016, 417, 197–202 CrossRef CAS.
- M. E. Marti and H. Zeidan, Sep. Purif. Technol., 2023, 312, 123309 CrossRef.
- H. Zeidan and M. E. Marti, J. Chem. Eng. Data, 2019, 64, 2718–2727 CrossRef CAS.
- V. M. Bhandari, T. Yonemoto and V. Juvekar, Chem. Eng. Sci., 2000, 55, 6197–6208 CrossRef CAS.
- N. Kanazawa, K. Urano, N. Kokado and Y. Urushigawa, J. Colloid Interface Sci., 2001, 238, 196–202 CrossRef CAS PubMed.
- T. Eregowda, E. R. Rene, J. Rintala and P. N. Lens, Sep. Sci. Technol., 2020, 55, 1449–1461 CrossRef CAS.
- N. A. S. Din, S. J. Lim, M. Y. Maskat, S. A. Mutalib and N. A. M. Zaini, Bioresour. Bioprocess., 2021, 8, 1–23 CrossRef PubMed.
- Ö. Demir, A. Gök and Ş. İ. Kırbaşlar, Biomass Convers. Biorefin., 2022, 1–17 Search PubMed.
- V. Elhami, M. A. Hempenius, G. J. Vancso, E. J. Krooshoop, L. Alic, X. Qian, M. Jebur, R. Wickramasinghe and B. Schuur, Sep. Purif. Technol., 2023, 323, 124273 CrossRef CAS.
- B. H. Davison, N. P. Nghiem and G. L. Richardson, Appl. Biochem. Biotechnol., 2004, 12, 653 CrossRef PubMed.
- Y. S. Jun, Y. S. Huh, H. S. Park, A. Thomas, S. J. Jeon, E. Z. Lee, H. J. Won, W. H. Hong, S. Y. Lee and Y. K. Hong, J. Phys. Chem. C, 2007, 111, 13076 CrossRef CAS.
- Q. Li, J. Xing, W. Li, Q. Liu and Z. Su, Ind. Eng. Chem. Res., 2009, 48, 3595–3599 CrossRef CAS.
- Q. Li, W. L. Li, D. Wang, B. B. Liu, H. Tang, M. H. Yang and Z. G. Su, Appl. Biochem. Biotechnol., 2010, 160, 438–445 CrossRef CAS PubMed.
- N. Schöwe, K. Bretz, T. Hennig, S. Schlüter and G. Deerberg, Ind. Eng. Chem. Res., 2015, 54, 1123–1130 CrossRef.
- Z. Sheng, B. Tingting, C. Xuanying, W. Xiangxiang and L. Mengdi, J. Chem. Eng. Data, 2016, 61, 856–864 CrossRef CAS.
- P. I. Omwene, Z. B. Öcal, M. Yağcıoğlu, A. Karagündüz and B. Keskinler, Bioprocess Biosyst. Eng., 2022, 45, 2007–2017 CrossRef CAS PubMed.
- H. Zeidan, D. Özdemir, N. Köse, E. Pehlivan, G. Ahmetli and M. E. Marti, Desalin. Water Treat., 2020, 202, 283–294 CrossRef CAS.
- F. Xiao and J. J. Pignatello, Langmuir, 2014, 30, 1994–2001 CrossRef CAS PubMed.
- K. Zhang and S. T. Yang, Sep. Sci. Technol., 2015, 50, 56–63 CrossRef CAS.
- H. De Wever and D. Dennewald, J. Chem. Technol. Biotechnol., 2018, 93, 385–391 CrossRef CAS.
- P. Gluszcz, T. Jamroz, B. Sencio and S. Ledakowicz, Bioprocess Biosyst. Eng., 2004, 26, 185–190 CrossRef CAS PubMed.
- D. R. Nielsen, G. S. Amarasiriwardena and K. L. Prather, Bioresour. Technol., 2010, 101, 2762–2769 CrossRef CAS PubMed.
- A. Yousuf, F. Bonk, J. R. Bastidas-Oyanedel and J. E. Schmidt, Bioresour. Technol., 2016, 217, 137–140 CrossRef CAS PubMed.
- A. I. Magalhães Jr, J. C. de Carvalho, E. N. M. Ramírez, J. D. C. Medina and C. R. Soccol, J. Chem. Eng. Data, 2016, 61, 430–437 CrossRef.
- Ş. Bayazit and I. Inci, J. Mol. Liq., 2014, 199, 559–564 CrossRef.
- G. M. Ratnamala, U. B. Deshannavar, S. Munyal, K. Tashildar, S. Patil and A. Shinde, Arabian J. Sci. Eng., 2016, 41, 333–344 CrossRef CAS.
- S. Lagergren, K. Sven. Vetenskapsakad. Handl., 1898, 24, 1–39 Search PubMed.
- Y. S. Ho and G. McKay, Process Biochem., 1999, 34, 451–465 CrossRef CAS.
- S. Y. Elovich and O. G. Larinov, Izv. Akad. Nauk Sssr Otdelenie Khim. Nauk, 1962, 2, 209–216 Search PubMed.
- W. J. Weber and J. C. Morris, Advances in Water Pollution Research, Proceeding of 1st International Conference on Water Pollution Research, Pregamon Press, Oxford, 1962, vol. 2, pp. 231–266 Search PubMed.
- C. E. Can, H. Zeidan and M. E. Marti, Ind. Eng. Chem. Res., 2024, 63, 5833–5844 CrossRef CAS.
- Ö. Demir, A. Gök and Ş. İ. Kırbaşlar, Biomass Convers. Biorefin., 2022, 1–17 Search PubMed.
- V. G. Gaikar and D. Maiti, React. Funct. Polym., 1996, 31, 155–164 CrossRef CAS.
- I. Ilalan, I. Inci and N. Baylan, Biomass Convers. Biorefin., 2022, 12, 4147–4157 CrossRef CAS.
- M. I. González, S. Álvarez, F. A. Riera and R. Álvarez, Ind. Eng. Chem. Res., 2006, 45, 3243–3247 CrossRef.
- H. Uslu and M. E. Marti, J. Chem. Eng. Data, 2017, 62, 2132–2135 CrossRef CAS.
- B. J. Liu and Q. L. Ren, J. Colloid Interface Sci., 2006, 294, 281–287 CrossRef CAS PubMed.
- X. Lin, L. Xiong, C. Huang, X. Yang, H. Guo and X. Chen, Desalin. Water Treat., 2016, 57, 366–381 CAS.
- R. K. Sheshdeh, M. R. K. Nikou, K. Badii, N. Y. Limaee and G. Golkarnarenji, J. Taiwan Inst. Chem. Eng., 2014, 45, 1792–1802 CrossRef CAS.
- M. E. Mahmoud, G. M. Nabil, N. M. El-Mallah, H. I. Bassiouny, S. Kumar and T. M. Abdel-Fattah, J. Ind. Eng. Chem., 2016, 37, 156–167 CrossRef CAS.
- S. Bentahar, A. Dbik, M. El Khomri, N. El Messaoudi and A. Lacherai, J. Environ. Chem. Eng., 2017, 5, 5921–5932 CrossRef CAS.
- N. Marchitan, C. Cojocaru, A. Mereuta, G. Duca, I. Cretescu and M. Gonta, Sep. Purif. Technol., 2010, 75, 273–285 CrossRef CAS.
- B. Isik, S. Avci, F. Cakar and O. Cankurtaran, Environ. Sci. Pollut. Res., 2023, 30, 1333–1356 CrossRef CAS PubMed.
- S. Raj, H. Singh and J. Bhattacharya, Sci. Total Environ., 2023, 857, 159464 CrossRef CAS PubMed.
- I. Langmuir, J. Am. Chem. Soc., 1916, 38, 2221–2295 CrossRef CAS.
- H. M. F. Freundlich, Z. Phys. Chem., 1906, 57, 385–490 CAS.
- M. Temkin and V. Pyzhev, Acta Physicochim. U. R. S. S., 1940, 12, 327–356 CAS.
- T. S. Anirudhan and P. S. Suchithra, Indian J. Chem. Technol., 2010, 17, 247–259 CAS.
- A. P. Rawat, V. Kumar and D. P. Singh, Sep. Sci. Technol., 2020, 55, 907–921 CrossRef CAS.
- A. Kara, E. Demirbel, N. Tekin, B. Osman and N. Beşirli, J. Hazard. Mater., 2015, 286, 612–623 CrossRef CAS PubMed.
- P. Murugan, R. ST and B. VM, Sep. Sci. Technol., 2020, 55, 471–486 CrossRef CAS.
- J. Ooi, L. Y. Lee, B. Y. Z. Hiew, S. Thangalazhy-Gopakumar, S. S. Lim and S. Gan, Bioresour. Technol., 2017, 245, 656–664 CrossRef CAS PubMed.
- O. Ozcan, İ. İnci and Y. S. Aşci, J. Chem. Eng. Data, 2013, 58, 583–587 CrossRef CAS.
- T. A. Oyehan, F. A. Olabemiwo, B. S. Tawabini and T. A. Saleh, J. Cleaner Prod., 2020, 263, 121280 CrossRef CAS.
- S. Kulprathipanja and A. R. Oroskar, US Pat., 5068418, 1991.
- L. A. Tung and C. J. King, Ind. Eng. Chem. Res., 1994, 33, 3217–3223 CrossRef CAS.
- H. Zeidan, M. Can and M. E. Marti, Res. Chem. Intermed., 2023, 49, 221–240 CrossRef CAS.
|
| This journal is © The Royal Society of Chemistry 2024 |
Click here to see how this site uses Cookies. View our privacy policy here. 
 Open Access Article
 This Open Access Article is licensed under a Creative Commons Attribution-Non Commercial 3.0 Unported Licence
 ab,
Hani Zeidan
ab,
Hani Zeidan