DOI:
10.1039/D4RA01888E
(Paper)
RSC Adv., 2024,
14, 16459-16465
Study of the response behavior of a CdS–SnO2 thick film for high selectivity towards propanol gas
Received
12th March 2024
, Accepted 30th April 2024
First published on 21st May 2024
Abstract
Gas monitoring devices are in demand for a rapidly growing range of applications. Metal oxide-based gas sensors have been extensively used for the detection of toxic pollutant gases, combustible gases, and hydrocarbon vapors. The sensitivity for a low concentration and observed response and the recovery times of the reported gas sensors are not satisfactory, and it needs further detailed studies. In the present work, undoped SnO2 and cadmium sulfide (CdS)-doped SnO2 thick films were fabricated using the screen-printing method to study their sensing behavior towards tested organic vapors such as acetone, propanol, and ethanol. The sensing properties of fabricated sensors were investigated for the test gases, i.e. acetone, propanol, and ethanol, at an elevated temperature of 473 K. It was observed that the 2 wt% CdS-doped SnO2 sensor showed a maximum response (78%) and was highly selective (44.6%) to propanol over acetone and ethanol. The results showed that the diminution of the SnO2 crystallite size with the CdS content leads to an improvement in the response of the SnO2 sensor for the tested gases. The microstructural properties are also correlated to the sensing behavior. The measurement showed that the CdS–SnO2 thick film sensor is highly sensitive. At the same time, it is more selective to propanol than the other test gases, ethanol and acetone.
1. Introduction
In recent years, semiconducting oxide thin/thick films have become more attractive due to their properties such as microstructural and optical properties, high stability, and the excellent sensing devices.1–4 Semiconducting oxides are classified as n-type and p-type. Currently, p-type semiconducting materials are required for excellent application of the sensor. In particular, SnO2 is usually regarded as an oxygen-deficient n-type semiconducting material.5 It has many applications such as transparent conductivity, the electrode of the solar cell, gas sensitivity for gas sensor devices, photochemical and photoconductivity devices in LEDs, and gas discharge display.6–11 In the sensor technology, the 3S rule is applied, i.e., S = sensitivity, S = selectivity, S = stability. There are various dopants used in the SnO2 thick/thin film sensor (such as Pd, Ni, Cd, PbO, Fe) to enhance its selectivity and sensitivity and improve its response.12–15 SnO2 is used in sensors of combustible gases including carbon monoxide detectors. In these sensors, the sensor area is heated to a constant temperature (a few hundred °C), and in the presence of a combustible gas, the electrical resistivity drops.16 Doping with various compounds has been investigated (e.g., with CuO).17 Doping with cobalt and manganese gives a material that can be used in high voltage, for example; in addition, tin(IV) oxide can be doped with the oxides of iron or manganese.18 J. K. Srivastava et al.19 reported on the microstructural proprieties of the PbO-doped SnO2 sensor for the detection of methanol, propanol, and acetone. They observed that at 3wt% PbO–SnO2 gives the maximum response for propanol at 350 °C. They also described the optimization of the firing temperature of the doped SnO2 sensor for methanol and acetone detection.12 F. H. Saboor et al.13 presented the NO2 gas sensing for Pd-loaded SnO2 thick film gas sensors under UV light irradiation at room temperature. Xi-Tao Yin et al.15 studied the selectivity and sensitivity of a Pd-loaded Fe-doped SnO2 sensor for CO detection in the presence of H2, and showed that 10 mol% Fe, 0.2 mol% Pd gives the maximum sensitivity and selectivity to CO against H2. M. Choudry et al.20 reported the effect of temperature on a Pd-doped SnO2 thick film gas sensor and observed that the firing temperature at 800 °C gives a more selective sensor for the detection of LPG, H2, and CH4, and the reported selectivity of LPG with a maximum sensitivity of up to 87%. In a previous paper, Yadava et al.21 reported on the sensing properties of the CdS-doped SnO2 thick film gas sensor for the detection of methanol, and showed that the 2wt% CdS-doped SnO2 sensor is a suitable detector for methanol. In the present study, we report the microstructural properties and sensing response of the CdS-doped SnO2 thick film. The reduction in crystallite size with the addition of the lower CdS content leads to an improvement in the response of the SnO2 sensor for the target gases, propanol, methanol, and acetone. The microstructural properties are correlated with the sensing behavior of the undoped and doped SnO2 sensors. It is observed that the 2 wt% CdS doped SnO2 sensor showed a maximum response (78%) and was highly selective (44.6%) to propanol over acetone and ethanol.
2. Experimental
2.1. Synthesis and fabrication of the sensor
In the laboratory, we take tin oxide (SnO2) powder and glass binder (10 wt% of SnO2), and mix them properly using a ball mill (Zirconia Ball Mill, Retsch) for 3–4 hours.21 Fine grains are then mixed with an organic binder (diethyl glycol mono butyl) and organic solvent (α-terpinol) in a ball mill for 1–2 h, which results in an undoped SnO2 paste. For doped pastes of SnO2, weighed SnO2 powder with glass binder (10 wt% of SnO2) and CdS powder (1 wt%, 2 wt%), all of these components are mixed in a ball mill, and the same organic binder and solvent are used to obtain the sensing paste. The prepared paste is screen-printed on an alumina substrate (25 mm × 25 mm) with a finger electrode pattern on the front side and a resistor heater pattern on the backside, as shown in Fig. 1.
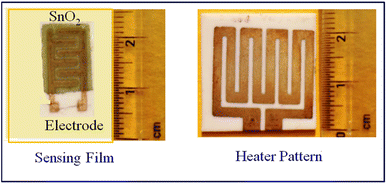 |
| | Fig. 1 Finger electrode and heater pattern of the sensor. | |
2.2. Characterization and sensing setup
XRD analysis was performed on the structural and lattice parameters of the S1, S2, and S3 films. The D8-Advanced apparatus, connected with a source of Cu Kα1 radiation with a wavelength of 0.15406 nm, produced the XRD pattern. For the measurement of the response of the fabricated sensors, S1, S2, and S3, a test chamber has been made in which provisions are made for the electrical connection and inlet/outlet for test gases. The connectivity for the voltage supply and resistance measurement is available through insulated gaskets on the base of the chamber. The resistance of the fabricated sensors in the air and gas environments is measured with the help of a Dual DC power supply (LD-3202) and Digital Multimeter (Aplab 107N). The response of the fabricated sensors is measured in ambient air with varying concentrations of acetone, propanol, and ethanol gases (0–5000 ppm) separately at 473 K.
3. Result and discussion
3.1. XRD
The experimental XRD pattern of samples S1, S2, and S3 is shown in Fig. 2. The XRD pattern of the fabricated samples has been performed in a wide range of diffraction angles from 0° to 90°. The comparative study of the XRD pattern for the sensors S1, S2, and S3 was performed in diffraction angles from 20° to 55° only. At an angle of 2θ, the peaks of the diffraction pattern correspond to the planes (110), (101), (200), (210), (002), (122), and (301), respectively. The polycrystalline structure of the deposited film is confirmed by these peaks and the correlating planes. If we increase the concentration of CdS in the sensors S2 and S3, modification in the XRD pattern is obtained. As we can see from the magnified figure at the plane (200) in Fig. 2(b), the peaks shift toward a higher value of 2θ. As the concentration of CdS increases in the sample, the peak intensities decrease and the peaks are broadening. The crystalline size can be calculated by the well-known formula given by the Debye Scherer relationship.22,23| |
 | (1) |
In this case, k = 0.94, where λ is the X-ray source's wavelength, β is the full width at half maximum (FWHM), and θ is the diffraction angle. The crystallite sizes of samples S1, S2, and S3 are found at 25.1 nm, 16.1 nm, and 13.9 nm, respectively. This shows that the crystallite size of the SnO2 films decreases with increasing CdS concentration.
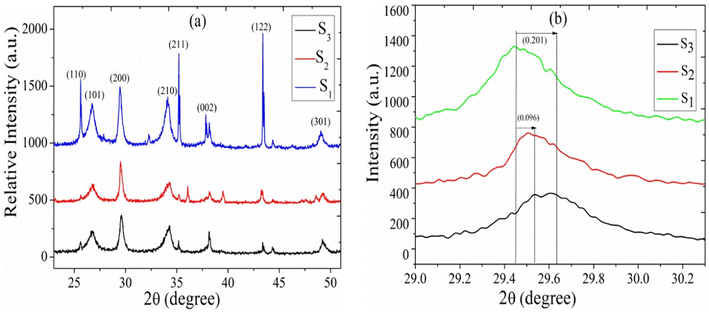 |
| | Fig. 2 (a) XRD patterns of sensors S1, S2, and S3 (b) zoomed image of plane 200. | |
To calculate microstrain, we can use the formula given below:24
| |
 | (2) |
The calculated microstrain increases with the increase of the CdS concentration. The crystallite size, rms roughness, and microstrain versus the CdS concentration are shown in Fig. 3(a and b), and the calculated value of the microstrain is 0.47 nm, 0.57 nm, and 0.61 nm for S1, S2, and S3. Also, we observed that the crystallite size and roughness decrease with an increase in the CdS contents (Fig. 3(a)).
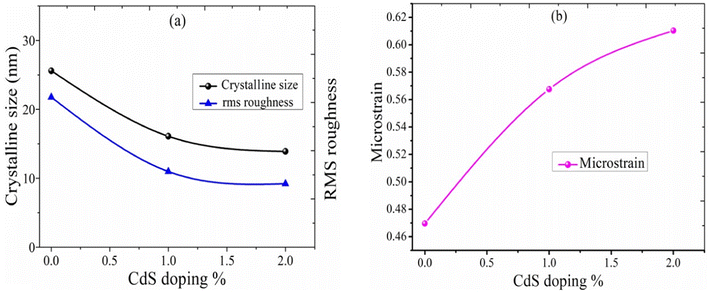 |
| | Fig. 3 (a) Variation of the CdS content vs. crystallite size, rms roughness. (b) Variation of the CdS content vs. microstrain. | |
3.2. Gas sensing response
The sensitivity is defined as the slopes of response vs. the gas concentration in ppm. Sensitivity is calculated by the following formula:25,26| |
 | (3) |
where Ra is the resistance in clean air and Rg is the resistance in the presence of vapors. The response of the fabricated sensors, S1, S2, and S3, are measured with varying concentrations (0–5000 ppm) of the target gases, acetone, ethanol, and propanol, at a fixed operating temperature of 200 °C. The response with the concentration of acetone for sensors S1, S2, and S3 is shown in Fig. 4(a). The response increases with increasing concentration of the acetone vapors. The sensitivity is 36%, 31%, and 25% for the S3, S2, and S1 sensors, respectively. It is evident from Fig. 4(b) that the maximum response for propanol was achieved with the S3 sensor (78%); it is (1.14) times that of S2 and (2.79) times that of S1. The response curve of ethanol is shown in Fig. 4(c). The sensitivity of the fabricated sensor has been reported in Table 1. Fig. 4(d) represents the comparison curve of the S3 sensor for acetone, ethanol, and propanol. It is observed that sensor S3 is more sensitive to propanol gas than acetone and ethanol. The sensitivity of propanol for sensor S3 is 1.34 times that for ethanol and 2.16 times that for acetone. Therefore, propanol has a maximum response compared to the other test gasses. The standard deviation of the response of sensors S1, S2, and S3 for acetone is 5.1, 9.7, and 11.2, respectively. The standard deviation of the response of sensors S1, S2, and S3 for propanol gas is 8.33, 16.97, and 18.87, respectively. The standard deviation of the response of sensors S1, S2, and S3 for ethanol gas is 14.85, 14.01, and 14.46, respectively.
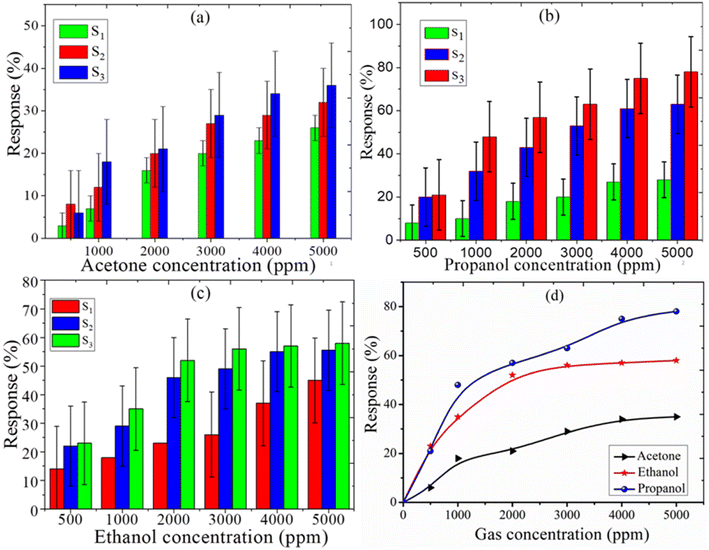 |
| | Fig. 4 Sensing response with standard deviation error bars for (a) acetone, (b) propanol, and (c) ethanol gas for sensors S1, S2, and S3. (d) Comparative response with the standard deviation error bars of sensor S3. | |
Table 1 Sensing response and selectivity and transient time of the S3 sensor for propanol, ethanol, and acetone
| Test gas |
Response (%) |
Selectivity (%) |
Transient time for the S3 sensor |
| S1 |
S2 |
S3 |
Response time (s) |
Recovery time (s) |
| Ethanol |
45 |
56 |
58 |
33.91 |
40 |
70 |
| Propanol |
28 |
65 |
78 |
45.63 |
19 |
67 |
| Acetone |
26 |
32 |
36 |
20.46 |
45 |
82 |
3.3. Selectivity
Selectivity is one of the most important parameters of the sensing properties of the gas sensor. The selectivity of the sensor was calculated using the following formula:27,28| |
 | (4) |
where Si is the response of gas for which the relative is to be estimated. The responses were found to be ∼45.63%, ∼33.91%, and ∼20.46% for propanol, ethanol, and acetone, respectively, which is displayed in the histogram (Fig. 5). It is evident from Fig. 4 that propanol is more selective over ethanol and acetone. The standard deviation of the selectivity of S3 for the gases (acetone, ethanol, and propanol) is 12.59 with a median of 33.91. Recently, N. Barroso et al. studied the guest-induced breathing mediated selective alcohol recovery from water by MIL-88A(Fe).29 They explained how the flexible nature of the crystal structure of MIL-88A(Fe) impacted its adsorptive performance for the recovery of alcohol from water. They found that the results acquired in this work can open new avenues toward the rational design and potential utilization of flexible MOF-based systems, offering enhanced selectivity and sorption performance toward the challenging liquid–liquid separation.
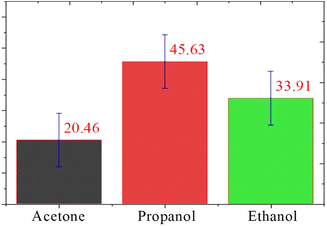 |
| | Fig. 5 Selectivity of ethanol, acetone, and propanol gas with standard deviation error bars for sensor S3. | |
3.4. Transient time
Fig. 4 shows the sensing response vs. time of sensors S3 and S1 for test gases at 473 K. At time 10 min, 5000 ppm acetone was injected in the test chamber to get the maximum response, and then the chamber was opened to recover the initial state of the sensor. The time corresponds to the time required for the gas response to reach 90% of the final equilibrium value after a test gas is injected, and the recovery time is the time recorded for the gas response to decrease by 90% its maximum value when the gas sensor is exposed in ambient air.30,31 Fig. 6(b) shows that in the S3 samples, the fast response and recovery times decrease from 31 s to 19 s and 89 s to 67 s for propanol (5000 ppm at 200 °C), respectively. The transient response and recovery curve to the acetone and ethanol sensors S1 and S3 is plotted in Fig. 6(a and c), and its value is listed in Table 1.
 |
| | Fig. 6 Transient time for (a) acetone, (b) propanol, and (c) ethanol gas for sensors S1 and S3. | |
3.5. Sensing mechanism
The sensing mechanism of the fabricated sensors (S1, S2, S3) can be realized as the resistance of materials varies with oxygen molecules absorbed at the surface and with the amount of reducing gas species. When metal oxide comes in contact with air, the oxygen molecules from the ambient environment are absorbed onto the surface of the metal oxide at the grain boundaries, which trap electrons and build a barrier around each grain.32 The adsorbed oxygen molecules were subsequently converted to ions after capturing an electron from the conduction band. The adsorbed oxygen exists on the surface in the form of O−, O2−, and O2− species, depending on the temperature.33 The chemical absorption process can be explained by the following reaction (eqn (5)–(8)):
If the operating temperature T < 150 °C:
| | |
O2(ads.) + e− ↔ O2(ads.)−
| (6) |
If the operating temperature is 150 °C < T < 400 °C:
| | |
O2(ads.) + e− ↔ 2O(ads.)−
| (7) |
If the operating temperature T > 400 °C:
| | |
O2(ads.) + e− ↔ O(ads.)2−
| (8) |
When sensor S3 contacts with the reducing gas, the reducing gas propanol (C3H7OH) reacts with the oxygen species to produce carbon dioxide and water, and the resulting electron will return to the conduction band of the semiconductor. The possible surface reactions take place (Fig. 7):
| | |
C3H7OH + 9O− → 3CO2 + 4H2O + 9e−
| (9) |
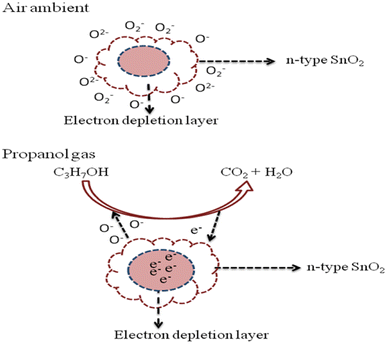 |
| | Fig. 7 Reaction process of propanol gas in the SnO2 thick film. | |
Among the adsorbed oxygen species (O2−, O2−, and O−) on the surface, the majorly atomic species (O− single ionized oxygen) is more reactive, particularly at higher temperatures (150 °C < T < 400 °C). When the CdS–SnO2 sensor is exposed to the target gases, propanol, ethanol, and acetone, at an elevated temperature of 200 °C, the gas will be adsorbed on the surface of the sensor. These gases will react with the chemically adsorbed oxygen anions, particularly O−. The electrons are released back to the material of cadmium sulfide, resulting in a decrease in the depletion layer thickness on the surface of the sensor, and also a decrease in the surface band bending. Therefore, the change in the electrical resistance of the sensor is observed with exposure to target gases. Among the target gases, the S3 sensor showed a larger response and at the same time high selectivity, which may be due to its different molecular structures. Also, it is obvious from eqn (9) that the carrier's concentration increased, which caused the sensor resistance to be reduced. Therefore, this process will increase the carrier concentration on the surface of tin oxide, resulting in a decrease in resistance.34 For a definite understanding regarding the high selectivity, future work is to be done using an array of sensors and exposure to a mixture of target gases.
We compare our findings to other related work, and a comparison table of the sensing response, operating temperature, and response time for alcoholic and acetone gas is listed in Table 2.
Table 2 A comparison table of the sensing response, operating temperature, and response time for alcoholic and acetone gas
| Sample |
Test gas |
Operating temperature (°C) |
Sensitivity (%) |
Response time (s) |
References |
| CdS–TiO2 |
Propanol |
— |
63 |
62 |
25 |
| CdS–TiO2 |
Acetone |
— |
71 |
55 |
27 |
| Sb2O3–SnO2 |
Ethanol |
250 |
73.5 |
— |
32 |
| Pd–SnO2 |
Ethanol |
200 |
71 |
41 |
33 |
| TiO2 |
Propanol |
— |
26 |
— |
34 |
| LaFeO3-based oxide |
Propanol |
100 |
258.4 |
— |
35 |
| NiO |
Propanol |
75 |
60 |
— |
36 |
| SnO2 |
Propanol |
150 |
71 |
— |
37 |
| Pd–SnO2 |
Propanol |
300 |
92 |
— |
38 |
| ZnO/TiO2 |
Propanol |
— |
23 |
10 |
39 |
| SnO2 nanorods |
Isopropanol |
325 |
11.2 |
6 |
40 |
| SnO2–Pd–Pt–In2O3 |
Methanol |
160 |
320.7 |
32 |
41 |
| Ce-doped SnO2 |
Acetone |
270 |
50.5 |
— |
42 |
| Cactus-like WO3–SnO2 |
Acetone |
360 |
26 |
— |
43 |
| CdS–SnO2 |
Propanol |
200 |
78 |
19 |
Present work |
4. Conclusion
Three types of sensors, namely S1 (undoped SnO2), S2 (1 wt% CdS–SnO2), and S3 (2 wt% CdS–SnO2), are fabricated. It is found from the XRD pattern that the crystallite size and roughness decrease with dopant CdS (0–2%) and it lies within the anemometric range. The diminution of the SnO2 crystallite size leads to an improvement in the sensitivity of the fabricated sensors for test gases. Microstructural properties are correlated with the sensitivity of the materials and dopants. The sensing behavior of the sensors S1, S2, and S3 operated at 200 °C for the different target gases (propanol, acetone, and ethanol) under ambient air is reported. The resistance of the sensor decreases with the increasing concentration of gases (0–5000 ppm). It is observed that the 2 wt% CdS-doped SnO2 sensor showed the greatest response (78%), and is highly selective (44.6%) to propanol over acetone and ethanol with a fast response and recovery time. Thus, we conclude that the CdS doped-SnO2 thick film sensor is highly sensitive. Furthermore, it is more selective to propanol gas than the other target gases.
Conflicts of interest
The authors declared that they have no competing interests or personal relationships that could have appeared to influence the work reported in this paper.
Acknowledgements
The authors are thankful to the HoD Department of Physics, D. D. U. Gorakhpur University Gorakhpur, for providing experimental facilities.
References
- F. A. Akgul, C. G. Ali, O. Er and A. H. Farah, J. Alloys Compd., 2013, 579, 50–56 CrossRef CAS.
- A. D. Bhagwat, S. S. Sawant and B. G. Ankarmwar, J. Nano-Electron. Phys., 2015, 7, 04037–04041 Search PubMed.
- S. D. Singh, M. Nand, A. Das and R. S. Ajimsh, J. Appl. Phys., 2016, 119, 165302–165311 CrossRef.
- V. Devi, M. Kumar and D. K. Shukla, Superlattices Microstruct., 2015, 83, 431–438 CrossRef CAS.
- A. Earnshaw, Chemistry of the Elements, Pergamon Press, Oxford, 1984, pp. 447–448, ISBN 0-08-022057-6 Search PubMed.
- J. K. Srivastava, P. Panday and V. N. Mishra, Sens. Transducers, 2010, 118, 122–130 CAS.
- Z. He and I. Zhou, Mod. Res. Catal., 2013, 2, 13–18 CrossRef CAS.
- W. Zeng, T. Liu, Z. Wang, S. Tsukimoto, M. Saito and Y. Ikuhara, Sensors, 2009, 9, 9029–9038 CrossRef CAS PubMed.
- J. N. Panchal, S. G. Patel and V. S. Vaishnav, Sens. Transducers, 2015, 190, 35–39 CAS.
- A. Kay and M. Gratzel, Chem. Mater., 2002, 14(7), 2930–2953 CrossRef CAS.
- N. Badera, B. Godbole, S. B. Srivastava and P. N. Vishwakarma, Sol. Energy Mater., 2008, 92, 1646–1651 CrossRef CAS.
- J. K. Srivastava, P. Panday and V. N. Mishra, Sens. Transducers, 2009, 107, 92–98 CAS.
- F. H. Saboor, T. Ueda, K. Kamada and T. Hyodo, Sens. Actuators, B, 2016, 223, 429–439 CrossRef CAS.
- M. Choudhary and V. N. Mishra, J. Mater. Sci.: Mater. Electron., 2014, 25, 1331–1340 CrossRef CAS.
- Xi-T. Yin and X.-M. Guo, Sens. Actuators, B, 2014, 200, 213–218 CrossRef CAS.
- W. C-Ming, W. Jin-Feng and S. Wen-Bin, J. Am. Ceram. Soc., 2006, 89(8), 2502–2508 CrossRef.
- A. Dibb, M. Cilense, P. R. Bueno, Y. Maniette, J. A. Varela and E. Longo, Mater. Res., 2006, 9(3), 339–343 CrossRef CAS.
- A. Punnoose, J. Hays, A. Thurber, M. H. Engelhard, R. K. Kukkadapu, C. Wang, V. Shutthanandan and S. Thevuthasan, Phys. Rev. B: Condens. Matter Mater. Phys., 2005, 72(8), 054402 CrossRef.
- J. K. Srivastava, P. Panday, V. N. Mishra and R. Dwivedi, J. Nat. Gas Chem., 2011, 20, 179–183 CrossRef CAS.
- M. Choudhary, V. N. Mishra and R. Dwivedi, Adv. Sci., Eng. Med., 2013, 5, 1–5 CrossRef.
- L. Yadava, R. Verma and R. Dwivedi, Sens. Actuators, B, 2010, 144, 37–42 CrossRef CAS.
- A. K. Vishwakarma and L. Yadava, Vacuum, 2018, 155, 214 CrossRef CAS.
- A. K. Sharma, A. K. Vishwakarma and L. Yadava, Mater. Lett.: X, 2023, 17, 100180 CAS.
- A. K. Vishwakarma, S. S. Majid and L. Yadava, Vacuum, 2019, 165, 239 CrossRef.
- A. K. Vishwakarma, A. K. Sharma, A. K. Mishra and L. Yadava, Mater. Lett.: X, 2023, 17, 100184 CAS.
- A. K. Vishwakarma, A. K. Sharma and L. Yadava L, J. Phys.: Conf. Ser., 2021, 1921, 012118 CrossRef CAS.
- A. K. Vishwakarma, A. K. Sharma A, N. K. Yadav and L. Yadava, Vacuum, 2021, 191, 110363 CrossRef CAS.
- S. Shao, S. Wang, F. Jiang, H. Wu, T. Wu, Y. Lei, J. Fei and R. Koehn, R. Soc. Chem. Adv., 2016, 6, 57722–57726 CAS.
- N. Barroso, S. Dutta, O. Castillo, J. Andreo, G. Beobide, A. Luque, S. Perez-Ýañez and S. Wuttke, J. Mater. Chem. A, 2023, 11, 21300 RSC.
- A. K. Vishwakarma, A. K. Mishra, C. K. Dixit and L. Yadava, Nanomater. Energy, 2024, 13, 1–7 CrossRef.
- A. K. Vishwakarma, A. K. Sharma, A. K. Mishra and L. Yadava, Mater. Today: Proc., 2022, 69, A18–A21 CAS.
- P. Yadav, S. K. Yadav, A. K. Vishwakarma, D. S. Saini and L. Yadava, Appl. Phys. A, 2024, 130, 119 CrossRef CAS.
- A. K. Vishwakarma and L. Yadava, Environ. Sci. Pollut. Res., 2021, 28, 3920 CrossRef CAS PubMed.
- A. K. Vishwakarma and L. Yadava, IOP Conf. Ser.: Mater. Sci. Eng., 2018, 404, 012020 Search PubMed.
- X. F. Wang, N. Liu, H. Wu, Z. Wan, Y. Meng, Z. Tan and X. Z. Song, J. Alloys Compd., 2023, 954, 1700217 Search PubMed.
- T. P. Mookoena, K. T. Hillie, H. C. Swart, N. Leshabane, J. Tshilongo and D. E. Motaung, Mater. Chem. Phys., 2020, 253, 123316 CrossRef.
- M. Moayedi, H. R. Ansari and Z. Kordrostami, ECS J. Solid State Sci. Technol., 2023, 12, 057011 CrossRef.
- R. K. Srivastava, P. Lal, R. Dwivedi and S. K. Srivastava, Sens. Actuators, B, 1994, 21, 213–218 CrossRef CAS.
- I. Gaidan, D. Brabozon and I. U. Ahad, Sensors, 2009, 17(9), 1995 CrossRef PubMed.
- D. Hu, B. Q. Han, R. Han, S. J. Deng, Y. Wang, Q. Li and Y. D. Wang, New J. Chem., 2014, 38, 2443–2450 RSC.
- Y. X. Li, D. D Deng, X. X. Xing, N. Chen, L. Xu, X. C. Xiao and Y. D. Wang, Sens. Actuators, B, 2016, 237, 133–141 CrossRef CAS.
- X. Lian, Y. Li, X. Tong, Y. Zou, X. Liu and D. An, Appl. Surf. Sci., 2017, 407, 447–455 CrossRef CAS.
- L. Zhu, W. Zeng and Y. Li, Mater. Lett., 2018, 231, 5–7 CrossRef CAS.
|
| This journal is © The Royal Society of Chemistry 2024 |
Click here to see how this site uses Cookies. View our privacy policy here.  Open Access Article
 *,
Ajaya Kumar Sharma and
Lallan Yadava*


