
 Open Access Article
 This Open Access Article is licensed under a Creative Commons Attribution-Non Commercial 3.0 Unported Licence
Influence of aluminium doping on high purity quartz glass properties
Bartłomiej Adam Gaweł *a,
Jochen Busamb,
Astrid Marthinsenc,
Gabriela Kazimiera Wardenb,
Benny Hallama and
Marisa Di Sabatinob
*a,
Jochen Busamb,
Astrid Marthinsenc,
Gabriela Kazimiera Wardenb,
Benny Hallama and
Marisa Di Sabatinob
aThe Quartz Corp, Hellandsveien 14, 8270 Drag, Norway. E-mail: bartlomiej.gawel@thequartzcorp.com
bDepartment of Materials Science and Engineering, Norwegian University of Science and Technology (NTNU), S. Saelandsvei 12, 7491 Trondheim, Norway
cSINTEF Industry, Forskningsveien 1, 0373 Oslo, Norway
First published on 25th April 2024
Abstract
High purity natural quartz is used as raw material for the manufacture of quartz glass crucibles for solar-grade silicon ingots production. One key challenge for cost-effective ingot pulling is to maximise the ability of the crucible to withstand the process conditions (i.e., silicon load and temperature about 1500 °C) without deformation. In order to improve this glass property, aluminium was coated into the raw quartz materials. Our results showed that an addition of up to 1000 wt ppm Al substantially reduces deformation of glass and improves viscosity at high temperatures. This is likely due to the reduction of stability of OH groups in the quartz glass as well as a trapping effect of aluminium on oxygen vacancies. This hypothesis is also supported by atomistic models. In the presence of Al, formation energies of silanol groups (Si–O–H) were much higher than without. Furthermore, the presence of Al in the structure significantly reduces mobility of the oxygen vacancies. It was also found that formation of oxygen vacancies hinders cristobalite crystallisation, on the other hand, Al atoms themselves induce local weakening of the Si–O bond which accelerates the kinetics of the reconstructive phase transition from glassy state to crystalline phase. This was also confirmed experimentally in our study.
Introduction
Quartz is one of the most abundant minerals in the earth's crust. Nevertheless, it is rare to find high purity sources of this mineral. Zoned pegmatite bodies are considered to have the lowest level of metal lattice contaminants1 and it is often a source of raw ore for production of high purity quartz (HPQ) which is used in the photovoltaic and semiconductors industry. Besides high purity of ore, pegmatite bodies consist of other minerals, like feldspar and mica, which need to be removed during several steps of processing like flotation, sorting, magnetic separation, and leaching.2 Processed HPQ products with lattice metal impurities content of about 20 wt ppm3 are used for quartz fused crucibles, which are then used for pulling monocrystalline silicon ingots for photovoltaic application. Such a glass purity is needed to assure the best long term mechanical stability of the crucible glass, as well as good quality in terms of electrical properties of silicon ingots. The costs of silicon ingot production are reduced by ‘hot charging’ i.e. refilling of the crucible several times with hot/molten silicon which places even longer working time requirements on crucibles in the hot zone. For instance, 24′′ diameter crucibles are often kept for 100 h at 1500 °C, while 32′′ diameter crucibles may have a working life of more than 350 h.4Hydroxyl groups (OH) and water inclusions are another type of impurities in quartz structure. These groups are often present at interfaces, in defects and in inclusions.5–9 The presence of water inclusions is important since it can lead to reduction of mechanical properties of fused crucibles by lowering the glass viscosity. The structure of the glass is weakened by hydrolysis of Si–O bonds.10,11

Often this “water weakening” is responsible for deformation of crucibles (sagging) under the conditions required for the pulling of silicon ingots.
The relationship between OH content and viscosity in fused quartz and synthetic fused silica at 1200 °C was measured by12 Kikuchi et al. They found that the viscosity (η) decreased with increasing OH content according to the empirical eqn (1) where a = 12.30 and b = 0.0457 for the fused silica:
| log(μ) = a{1 − b[log(COH)]2}1/4 | (1) |
Another challenge is that the presence of water or OH groups in glass at high temperatures trigger formation of gasses. These can contribute to the formation of bubbles, which often reduce the quality of the silicon product due to the formation of defects in silicon, as well as reducing the production yield.13,14
High purity of the glass significantly increases viscosity and, thus, mechanical properties. However, it was also discovered that the viscosity of the quartz glass could be increased by the introduction of aluminium14 even at low concentrations. Furthermore, other researchers pointed out that in ceramics and glass the ratio between Al and alkaline metal cations also strongly correlates with viscosity,15,16 which was the highest when the ratio between Al and Na was close to one. The authors suggested that the negative effect of alkaline metal and hydrogen cations (breaking Si–O bonds) is compensated by the presence of Al, i.e., the positive charge of Na and H is compensated by negative charge of an AlO4 cluster. In addition Al reduces viscous flow by increasing α – relaxation time.16 This is attributed to higher flow activation energy when Al is present. This results in a slower reorientation of these domains, and thus an increased viscosity.
Furthermore, it was shown that aluminium ions trigger devitrification or crystallization of glass at high temperatures. When heated, the crystal lattice breaks down into a melt and takes on the random configuration of a liquid. However, when the glass is kept at temperatures below melting point, the molecules crystallize back into the same three-dimensional network in which they were arranged before melting. It is shown in literature that this process is relatively slow, however with the presence of a modifier, like Al2O3, ZrO2 or K2O it could be significantly faster.17 On the other hand, presence of oxygen vacancies may hinder devitrification.18
Besides experimental work, several modelling research studies have been performed. For instance, Liu at al.19 showed that small amounts of interstitial Al in the quartz network increased the bond strength of the Si–O bonds, which would imply a strengthening of the overall quartz network and thereby a positive effect on the viscosity. However, it is not well established whether Al resides as an interstitial or substitutional impurity in the quartz network.
In this work, glass samples prepared with different aluminium additions from 20 wt ppm up to 1000 wt ppm were investigated using various methods such as softening point measurements and viscometry. Furthermore, an atomistic model was developed to predict the local interactions of aluminium within the quartz glass.
Experimental
Materials
Aluminium doped high purity quartz (HPQ) samples used in this work were prepared at Glatt (Weimar, Germany) in cooperation with The Quartz Corp (Drag, Norway) by coating with an aluminium precursor. Quartz sand used during the coating has been produced at the TQC plant from ore originating from the Spruce Pine deposit, North Carolina, USA. In order to obtain the required quality product (with purity about 99.998%), a series of controlled processing steps like crushing, flotation, acid leaching, and thermal treatment were implemented. Particle Size Distribution (PSD) of the product were: D90 about 400 μm, D50 about 230 μm and D10 120 μm based on laser diffraction.The original quartz samples were doped with 5 different levels of aluminium: 20 ppm, 50 ppm, 100 ppm, 500 ppm and 1000 ppm. The doped quartz has similar PSD as the original pure quartz product. The trace element content determined by inductively coupled plasma mass spectrometry (ICP-MS, Agilent 8900 QQQ) after dissolution in HF are shown in Table 1.
| Sample name | Na | K | Li | Al | Ca | Fe | Ti | Co | Cr | Cu | Ni | Mn | B | Mg |
|---|---|---|---|---|---|---|---|---|---|---|---|---|---|---|
| Al1000 | 1.3 | 0.3 | 0.4 | 1032 | 1.5 | 5.51 | 1.9 | 0.01 | 1.55 | 0.07 | 0.55 | 0.15 | 0.09 | 0.19 |
| Al500 | 1.8 | 0.9 | 0.4 | 574 | 2.9 | 7.81 | 1.9 | 0.01 | 2.33 | 0.09 | 0.84 | 0.20 | 0.11 | 0.17 |
| Al100 | 0.9 | 0.3 | 0.4 | 154 | 0.6 | 7.06 | 2.26 | 0.01 | 2.11 | 0.07 | 0.75 | 0.17 | 0.12 | 0.09 |
| Al50 | 1.1 | 0.7 | 0.4 | 104 | 1.2 | 6.5 | 1.9 | 0.01 | 1.56 | 0.06 | 0.55 | 0.16 | 0.13 | 0.18 |
| Al20 | 1.1 | 0.6 | 0.4 | 50 | 1.8 | 5.28 | 1.9 | 0.01 | 1.41 | 0.05 | 0.5 | 0.13 | 0.23 | 0.22 |
| Reference | 0.7 | 0.5 | 0.4 | 12 | 0.6 | 0.22 | 1.3 | <0.01 | <0.01 | 0.02 | <0.01 | 0.01 | <0.10 | 0.01 |
Glass samples were fused under vacuum as well as at near atmospheric pressure. For vacuum fusion, a Nabertherm SVHT 09/20-W furnace at Krakow Institute of Technology in Poland was used. The samples were fused in molybdenum crucibles at 1900 °C for 1 h. The same doped quartz was fused under inert gas in the Motzfeldt furnace at The Quartz Corp production facility at Drag, Norway. Molybdenum crucibles were filled up with approximately 10 g of quartz sand. The hydrogen and helium (1![[thin space (1/6-em)]](https://www.rsc.org/images/entities/char_2009.gif) :10) mixture at 660 mbar pressure was used during the fusion. The fusion process took about 35 minutes in total, including the heating and the cooling. The fusion temperature was around 2000 °C.
:10) mixture at 660 mbar pressure was used during the fusion. The fusion process took about 35 minutes in total, including the heating and the cooling. The fusion temperature was around 2000 °C.
Methods
In the current work, the 5 × 5 × 5 mm cubic glass quartz sample was placed on the graphite substrate (10 mm diameter and 3 mm hight) and heated under Ar 0.1 nL min−1 atmosphere to 900 °C in about 3 min, then heated with a constant rate of 50 °C min−1 to 1500 °C, and 5.5 °C min−1 further to 1750 °C, and held until it is melted. Images were recorded and analysed afterwards to determine the:
• Softening point
• Deformation rate
The softening point was defined as the temperature when the corners of the analysed cubic glass started to round, while the deformation rate was correlated to an edge curvature after 30 min of heat treatment at about 1750 °C (See Fig. 1).
 | ||
| Fig. 1 Measurement of the deformation rate by determination of edges curvature. | ||
The setup for viscosity measurements has been described elsewhere.21 It consists of an open-air furnace with an alumina support upon which the sample is placed and heating elements along two of the chamber's walls. The change in the position of the indentation rod is measured and provides a quantification of the penetration depth at 1500 °C. From room temperature to 1500 °C the heating rate was 400 °C h−1 and at 1500 °C it is held for 3 hours. The cool-down rate was about 300 °C h−1 until it reached 40 °C.
Viscosity was calculated using eqn (2):22
 | (2) |
Results and discussion
Samples preparation
The quartz sand samples were prepared by coating pure quartz sand (NC4A type, The Quartz Corp, Norway) raw material. During the formulation, sand particles were in contact with steel parts of the equipment which caused contamination of the samples. As shown in Table 1, the iron and chromium levels of the coated samples were about 5–7 ppm and 1–2 ppm respectively. These values are too high to meet specifications for using this material for crucibles, since this will cause contamination of the silicon during the Czochralski process. Nevertheless, this contamination should not affect mechanical properties of glass and it is sufficient for tests purposes.Samples morphology after coating
The size and shape of the grains did not change substantially after coating. The aluminium precursor covered all grains as shown in SEM EDS map (Fig. 2). The coating did not affect particle size distribution which was the same for modified and quartz.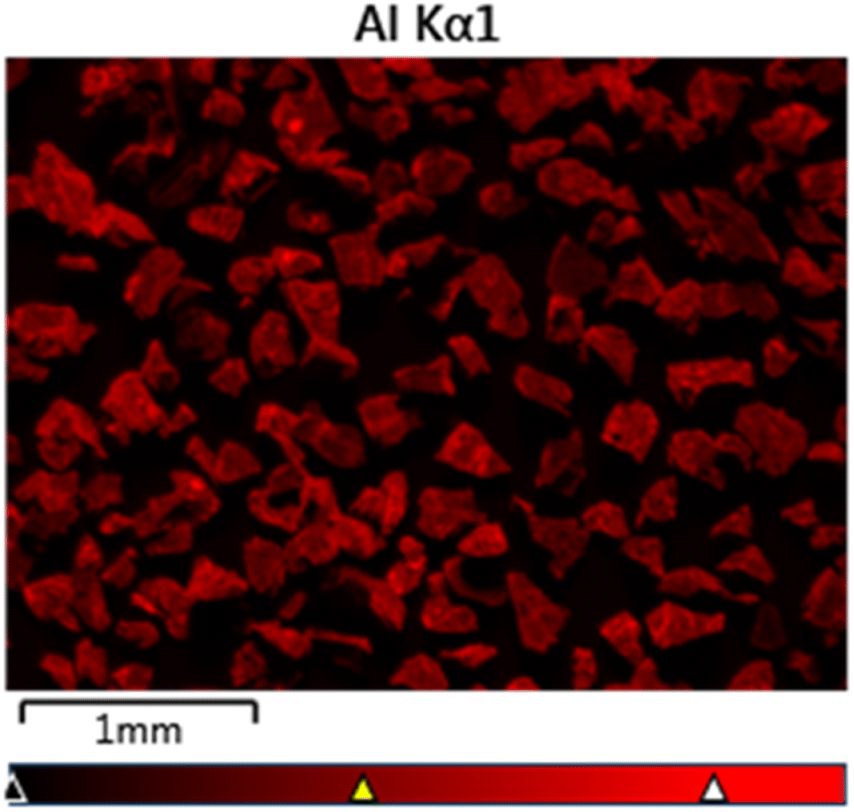 | ||
| Fig. 2 SEM EDS image of sample Al1000. | ||
Every grain was covered with a layer of alumina precursor, as shown in Fig. 3. In the SEM image the upper part is the resin used to mount the sample, and lower part is quartz grain, and in the middle, there is the coated layer. One can see in the EDS image that aluminium precursor is homogenously distributed in the layer.
 | ||
| Fig. 3 SEM (left) and EDS (right) micrographs of sample Al1000 mounted in epoxy (the scale bar in both images is 1 μm). | ||
Influence of Al concentration on glass properties
 | ||
| Fig. 4 FTIR spectra (A) and calculated OH content (B) in Al modified fused samples. Short dashed line on (A) and black dot on (B) represents sample Al 20 fused in vacuum. | ||
The samples fused in vacuum showed negligible content of OH groups, while samples melted in helium/hydrogen mixture exhibited much higher concentration. Moreover, a clear trend between OH content and Al level, Fig. 4B, was observed. In this case hydroxyl concentration decreases with aluminium content. This behaviour could be explained by the lowering of the stability of OH groups when Al is present in the fused glass. Atomistic modelling which supports this hypothesis is shown in Section Role of OH groups on the Al doped quartz viscosity. The discrepancy between the samples fused in helium/hydrogen mixture and vacuum is likely related to much higher stability of OH groups in the presence of hydrogen due to hindering of the condensation reaction between Si–OH and Si–H groups in which hydrogen is formed.
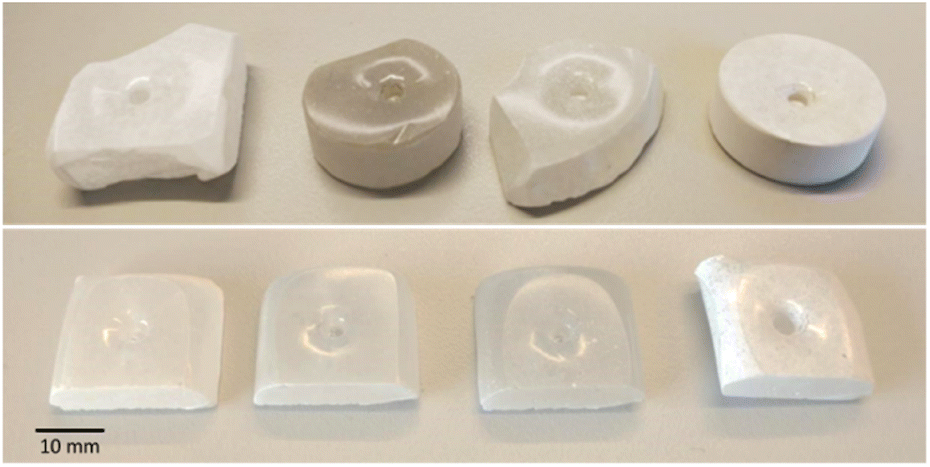 | ||
| Fig. 5 Images of samples melted at vacuum (top) and at normal pressure (bottom) after viscosity tests. From left: ref, Al20, Al100, Al500. | ||
The corresponding viscosity results are shown in Fig. 6. It has been shown that all aluminium doped samples showed increased viscosity. Moreover, samples melted under vacuum showed higher values compared to samples melted under an H2/He atmosphere. This behaviour is likely related to a lower concentration of OH groups in the glass when Al is present. Nevertheless, samples melted under vacuum have very low hydroxyl group content, and therefore the viscosity of all this series of samples should demonstrate higher viscosity than all samples fused under the H2/He atmosphere if OH was the only influencing factor. However, this is not the case. Another explanation could be that the higher viscosity of Al doped samples is caused in part by the trapping effect of oxygen defects. According to Doremus,26 viscosity of silica is related strongly to mobility of the defects – therefore any trapping effect of Al will substantially reduce that property and thus likely viscosity. It should be also noted that viscosity is quite similar for all doped samples, this means that even slight Al addition results in substantial structural changes which lead to higher viscosity. An atomistic modelling results related to oxygen vacancies trapping phenomena is discussed in Section Role of oxygen vacancies on the Al doped quartz viscosity.
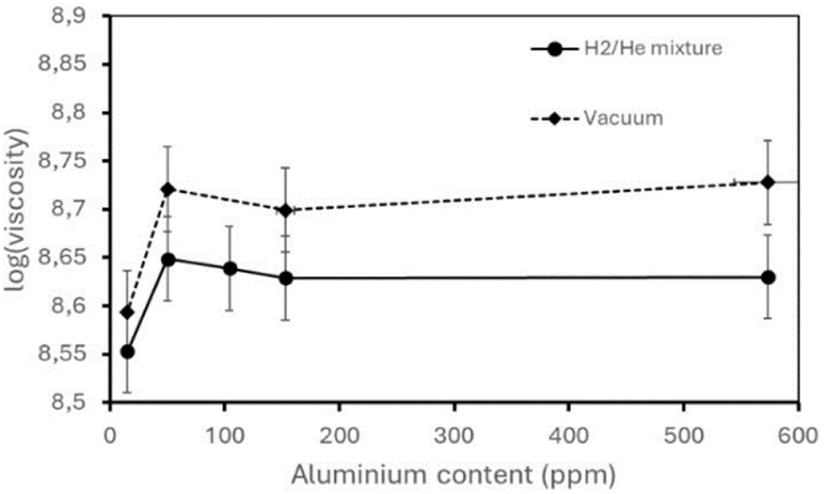 | ||
| Fig. 6 Viscosity results of samples melted under vacuum and normal conditions with different Al content. | ||
After the viscosity tests formation of cristobalite was observed on the exposed surfaces of the samples. The layer was thickest in the sample with 500 ppm of Al doping, and thinnest for 20 ppm and 50 ppm Al doping.
One explanation of this behaviour could be related to the formation of oxygen vacancies in the glass. The presence of such vacancies has been shown to hinder cristobalite formation.18 Moreover, since aluminium also causes a local weakening of the Si–O bond, this could accelerate the kinetics of the reconstructive phase transition from glassy state to crystalline phase in the case when the concentration of Al is larger than 100 ppm.
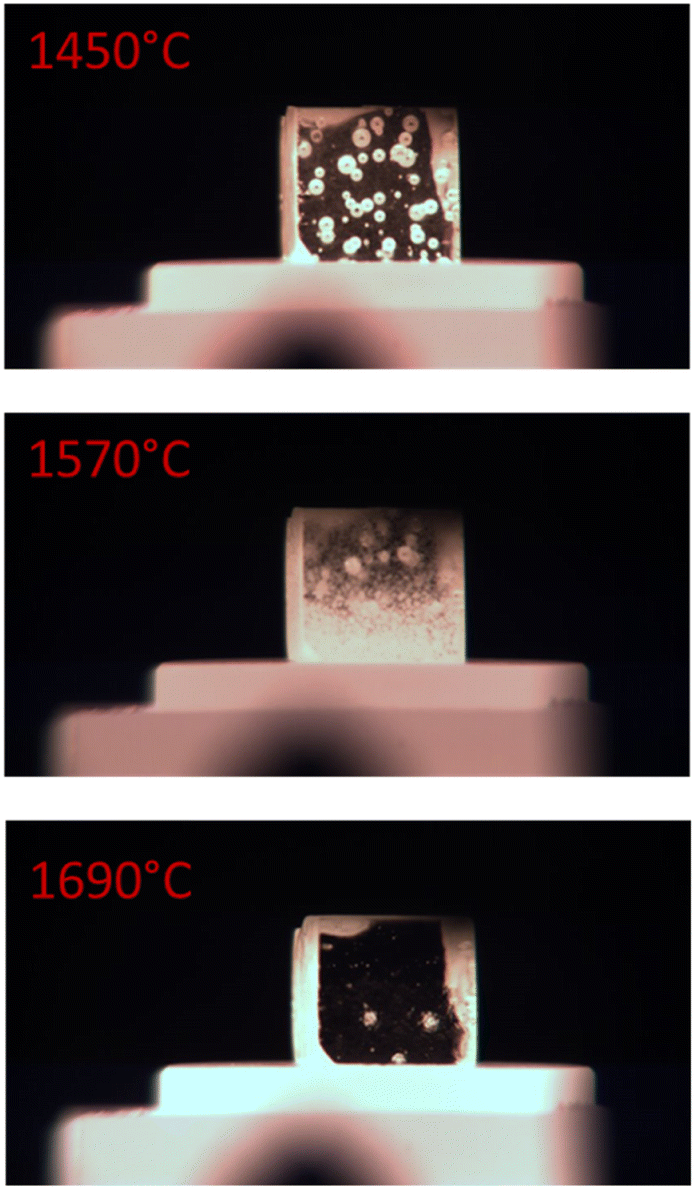 | ||
| Fig. 7 Screen shots from the softening experiments at 1450 °C (top), at 1570 °C (middle) and at 1690 °C. | ||
When heating started, the sample was stable without any changes until about 1450 °C when bubbles inside the glass started to shrink (Fig. 7 top), and then at above 1500 °C cristobalite started to form (Fig. 7 middle). When the temperature reached about 1690 °C, samples started to soften and all the cristobalite layer was melted (Fig. 7 bottom).
The edge deformation (radius) of the samples due to treatment at 1744 °C for 30 min are presented in Fig. 8. The radius correlates clearly with Al concentration as well as OH level in glass. Samples with higher OH and/or lower Al content showed smaller radius which means that they deformed more substantially.
 | ||
| Fig. 8 The deformation radius and OH group content vs. aluminium concentration. | ||
Deformation above the melting temperature of glass could not be straightforwardly correlated with viscosity at 1500 °C, however, similar correlation with the OH group content in the glass was observed. These results are in line with previous studies9,27,28 and viscosity tests described in Section Role of Al on fused quartz viscosity.
Modelling
The effect of Al on the hydrolysis of water to form OH groups was then studied. Fig. 9 shows the energy difference of the hydrolysis reaction in the presence of Al compared to in pure SiO2 quartz. Three different sites are considered for the hydrolysis reaction relative to the Al atom. In the presence of Al, the hydrolysis enthalpy is found to increase, implying that Al impurities suppress the hydrolysis reaction. The increased hydrolysis enthalpy in the presence of Al is found to be a consequence of the effective negative charge associated with the Al substitution. Since the Al defect is effectively negatively charged [AlO4]′, it forms attractive electrostatic bonds with the hydrogen in the water, reflected in an increased polarization of the hydrogen. Thus Al, serves as a trapping site for the water. This could explain the experimental observation that increased Al concentration results in a decrease in the measured OH concentration.
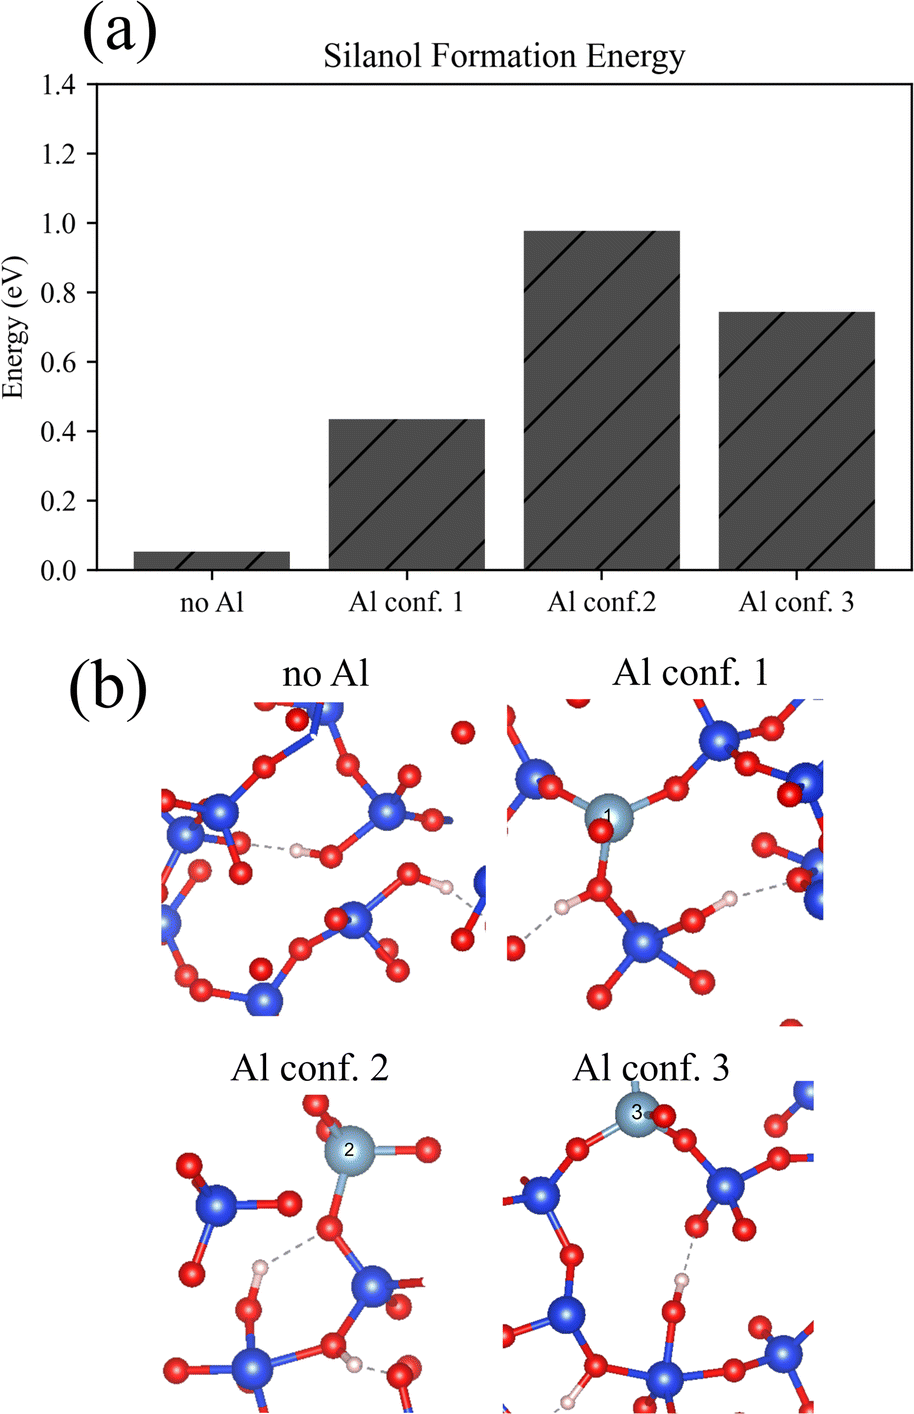 | ||
| Fig. 9 Si–OH groups formation energy (a) of silica models (b) with and without aluminium. | ||
Based on viscosity results shown in Section Role of Al on fused quartz viscosity, it seems that the OH level is not the only factor that influences viscosity of doped glass.
At 1500 °C cristobalite is the thermodynamically stable phase so there will be the thermodynamic driving force for transition from glassy state to cristobalite. On an atomistic level, this phase transition is reconstructive, which means that to transform from the glassy state to cristobalite, Si–O bonds must be broken and then re-formed in order for the crystallization to happen. Therefore, in this case the kinetic energy barrier is related to breaking of Si–O bond.
The DFT simulations show that the presence of Al in the quartz structure induces a local volume expansion with slight elongation of the Si–O bonds. This is true regardless of whether Al is in interstitial or substitutional position, although simulations show that substitutional position is more favourable. This is because Al is slightly larger than Si. The consequence of this is a local weakening of the Si–O bonds. This weakening could again speed up the kinetics of the reconstructive phase transition from glassy state to cristobalite.
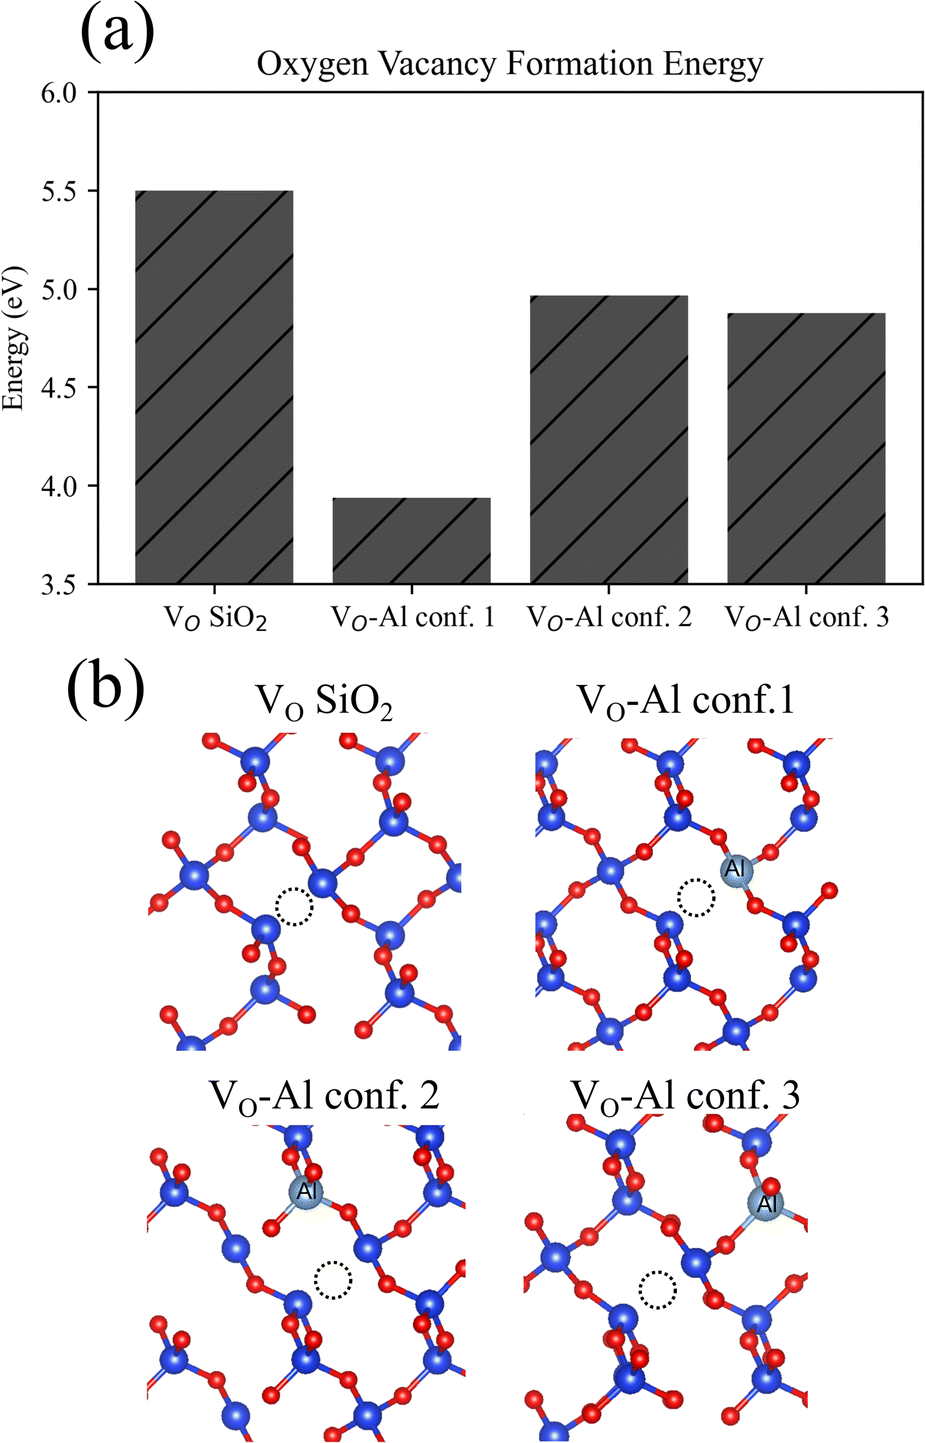 | ||
| Fig. 10 Formation energies (a) of oxygen vacancies in silica models (b) with and without aluminium. | ||
These findings are in line with experimental data from literature14 where the authors showed correlation between the oxygen vacancies as well as Al concentration and viscosity in amorphous silica glass. They also match the observations made in this work (see Fig. 5), since a low addition of Al hinders cristobalite formation, which we observe in samples containing 20 ppm and 100 ppm of Al. However, samples with 500 ppm have significantly thicker cristobalite layer than other samples with lower Al content. In this case the mechanism described in Section Influence of Al concentration on glass properties is dominant.
Conclusions
In order to improve glass stability at silicon ingot pulling conditions (i.e., silicon load and temperature about 1500 °C), an aluminium precursor was coated into quartz raw materials. Our results showed that an addition of up to 500 ppm Al substantially increases viscosity of glass formed from the doped quartz powder at high temperatures. The maximum viscosity was reached at as low as 20 ppm of Al addition. This is likely due to the reduction in stability of OH groups in the quartz glass, as well as formation of trapped oxygen vacancies, which was confirmed by atomistic modelling. Formation of oxygen vacancies also hinders cristobalite crystallisation. On the other hand, Al atoms themselves induce local weakening of the Si–O bond which accelerates the kinetics of the reconstructive phase transition from glassy state to crystalline phase. These two opposing phenomena are observed in our results: Al content below 500 ppm hinders crystallisation while higher concentrations (e.g. 500 ppm) resulted in a thick cristobalite layer being formed.Our findings are an important step forward for the development of new high strength crucibles for silicon solar cells applications.
Author contributions
B. A. G. writing – original draft, conceptualization, methodology, visualization; J. B. resources, data curation, investigation; G. K. W resources, data curation, writing – review & editing, investigation; A. M. formal analysis, visualization, writing – review & editing; B. H. conceptualization, writing – review & editing, supervision, funding acquisition; M. D. S: conceptualization, writing – review & editing, supervision.Conflicts of interest
There are no conflicts to declare.Acknowledgements
This work was performed as part of the HighVis Quartz project (No. 321547) supported by the Research Council of Norway. We acknowledge Oscar Nijs and Arthika Sivananthan for fusion of the glass samples, and Sarina Bao from SINTEF wetting lab in Trondheim, NORWAY for carrying out the softening tests. Team from Glatt (Weimar, Germany) is acknowledged for samples preparation. Computational resources were provided by Sigma2, through the project nn9204k.Notes and references
- W. A. Deer FRS, R. A. Howie and J. Zussman, An Introduction to the Rock-Forming Minerals, Mineralogical Society of Great Britain and Ireland, 2013 Search PubMed
.
- K. Aasly, Properties and Behavior of Quartz for the Silicon Process, 2008 Search PubMed
- A. Buttress, J. Rodriguez, A. Ure, R. Ferrari, C. Dodds and S. Kingman, Miner. Eng., 2019, 131, 407–419 CrossRef CAS
- S. Franssila, in Introduction to Microfabrication, 2010, pp. 35–46 Search PubMed
- R. D. Aines, S. H. Kirby and G. R. Rossman, Phys. Chem. Miner., 1984, 11, 204–212 CrossRef CAS
- T. Biró, I. J. Kovács, E. Király, G. Falus, D. Karátson, Z. Bendo, T. Fancsik and J. K. Sándorné, Eur. J. Mineral., 2016, 28, 313–327 CrossRef
- J. Fukuda, T. Yokoyama and Y. Kirino, Mineral. Mag., 2009, 73, 825–835 CrossRef CAS
- B. A. Gaweł, A. Ulvensøen, K. Łukaszuk, A. M. F. Muggerud and A. Erbe, Miner. Eng., 2021, 174, 107238 CrossRef
- B. A. Gaweł, A. Ulvensøen, K. Łukaszuk, B. Arstad, A. M. F. Muggerud and A. Erbe, RSC Adv., 2020, 10, 29018–29030 RSC
- M. Baron, R. Stalder, J. Konzett and C. Hauzenberger, Phys. Chem. Miner., 2015, 42, 53–62 CrossRef CAS
- H. Stünitz, A. Thust, R. Heilbronner, H. Behrens, R. Kilian, A. Tarantola and J. D. Fitz Gerald, J. Geophys. Res.: Solid Earth, 2017, 122, 866–894 CrossRef
- Y. Kikuchi, H. Sudo and N. Kuzuu, J. Ceram. Soc. Jpn., 1997, 105, 645–649 CrossRef CAS
- M. Di Sabatino, F. W. Thorsen, A. Lanterne, Y. Hu, J. A. Bones and E. Øvrelid, in Energy Technology 2017, ed. L. Zhang, J. W. Drelich, N. R. Neelameggham, D. P. Guillen, N. Haque, J. Zhu, Z. Sun, T. Wang, J. A. Howarter, F. Tesfaye, S. Ikhmayies, E. Olivetti and M. W. Kennedy, Springer International Publishing, Cham, 2017, pp. 387–394 Search PubMed
- K. Yamahara, K. Shima, A. Utsunomiya and Y. Tsurita, J. Non-Cryst. Solids, 2004, 349, 341–346 CrossRef CAS
- V. K. Leko and O. V. Mazurin, Glass Phys. Chem., 2003, 29, 16–27 CrossRef CAS
- K. Saito, N. Ogawa, A. J. Ikushima, Y. Tsurita and K. Yamahara, J. Non-Cryst. Solids, 2000, 270, 60–65 CrossRef CAS
- I. Zaplatynsky, The Effect of Al2O3, CaO, Cr2O3 and MgO on Devitrification of Silica, 1988 Search PubMed
- X. Li, X. Yin, L. Zhang and S. He, J. Non-Cryst. Solids, 2008, 354, 3254–3259 CrossRef CAS
- J. Liu, Y. Wang and L. An, Sci. Rep., 2016, 6, 35556 CrossRef CAS PubMed
- M. Wojdyr, J. Appl. Crystallogr., 2010, 43, 1126–1128 CrossRef CAS
- G. K. Warden, M. Juel, B. A. Gaweł and M. Di Sabatino, Open Ceram., 2023, 13, 100321 CrossRef CAS
- M. Sakai and S. Shimizu, J. Non-Cryst. Solids, 2001, 282, 236–247 CrossRef CAS
- G. Kresse and J. Furthmüller, Comput. Mater. Sci., 1996, 6, 15–50 CrossRef CAS
- G. Kresse and J. Furthmüller, Phys. Rev. B: Condens. Matter Mater. Phys., 1996, 54, 11169–11186 CrossRef CAS PubMed
- G. Kresse and J. Hafner, Phys. Rev. B: Condens. Matter Mater. Phys., 1993, 47, 558–561 CrossRef CAS PubMed
- R. H. Doremus, J. Appl. Phys., 2002, 92, 7619–7629 CrossRef CAS
- J. C. Mauro, C. R. Kurkjian, P. K. Gupta and W. Kob, J. Am. Ceram. Soc., 2021, 105, 61–66 CrossRef
- V. G. Plotnichenko, V. O. Sokolov and E. M. Dianov, J. Non-Cryst. Solids, 2000, 261, 186–194 CrossRef CAS
| This journal is © The Royal Society of Chemistry 2024 |