DOI:
10.1039/D4RA01581A
(Paper)
RSC Adv., 2024,
14, 12561-12573
Investigating Fe-doped Ba0.67Ni0.33Mn1−xFexO3 (x = 0, 0.2) ceramics: insights into electrical and dielectric behaviors
Received
29th February 2024
, Accepted 9th April 2024
First published on 18th April 2024
Abstract
This study investigates the characteristics of the Ba0.67Ni0.33Mn1−xFexO3 perovskite compound, focusing on its structural and electrical aspects under varying Fe doping levels at the Mn-site (x = 0, 0.2). X-ray diffraction patterns confirm the material's consistent structure, with Fe3+ ions substituting Mn3+ ions while maintaining their identical ionic radius. Nano-crystallinity studies reveal single-phase crystallization in the orthorhombic structure with space group Imma. Samples are prepared through conventional solid-state sintering. The Williamson–Hall method calculates crystallite sizes, averaging 37 nm for x = 0 and 33 nm for x = 0.2. Electrical properties are examined using complex impedance spectroscopy at different temperatures and frequencies. Techniques such as energy dispersive X-ray spectroscopy (EDX) and scanning electron microscopy (SEM) assess chemical composition. Activation energy values increase from 0.138 eV for x = 0 to 0.171 eV for x = 0.2, leading to reduced dc conductivity across the investigated temperature range. Dielectric permittivity enhances proportionally with increasing Fe doping. Variations in impedance profiles reveal a relaxation phenomenon. A circuit model, Rg + (Rgb//CPEgb), elucidates impedance data. This study illuminates the interplay between Fe doping, activation energy, and electrical conductivity in Ba0.67Ni0.33Mn1−xFexO3 perovskite, offering insights applicable to electronic and energy-related devices. Perovskite-based nanomaterials have diverse environmental applications, including solar cells, light-emitting devices, transistors, sensors, and energy storage.
1. Introduction
Utilizing energy storage to catalyze photo-driven processes in response to the energy crisis and environmental challenges is crucial for achieving a sustainable society. Perovskite oxides, among oxide-based materials, emerge as promising catalysts for photocatalysis in energy and environmental applications due to their cost effectiveness, abundance in nature, and superior performance. There is a pressing need to comprehensively evaluate the progress achieved in these technologies, identify sustainable options, and recognize existing constraints and opportunities for commercialization. Perovskite-type manganites, among perovskite-based materials, have garnered significant attention due to their remarkable chemical and physical attributes,1 which include stability across varying temperatures, heightened capacitance in capacitors, and various phenomena such as magneto-caloric effects and transitions from ferromagnetic to paramagnetic states.
These materials follow a general formula ABO3, where A-site constituents include elements such as La, Sr, Ba, K, Ca, and Na, while B-cations comprise Ti, Mn, Co, Cr, Fe, and Ni.2 Perovskite systems defined by the general formula Ln1−xAxMnO3 have gained prominence for their versatile applications, notably in solid oxide fuel cells.3 Additionally, perovskite compounds have been extensively explored for their applicability in various electrical devices, including sensors sensitive to magnetic fields, reading heads for hard disks, and components designed for microwave applications.4–9
To fulfill the diverse demands of these applications, materials with robust thermal stability and exceptional electrical conductivity are required. Researchers are actively investigating novel perovskite materials possessing exceptional electrical properties by adjusting preparation methods, doping agents, and doping levels.10
Perovskite oxides exhibit diverse crystal structures, including cubic configurations (e.g., LaBa0.5Ag0.5FeMnO6![[thin space (1/6-em)]](https://www.rsc.org/images/entities/char_2009.gif) 11) and rhombohedral arrangements (e.g., LaPbFeTiO612 and BiBaFeZnO613). Complex impedance spectroscopy (IS) technique is an essential tool to explore the electrical characteristics of perovskite materials, offering advantages such as identifying relaxation frequencies and differentiating between effects arising from grains, grain boundaries, and grain–electrode interactions.
11) and rhombohedral arrangements (e.g., LaPbFeTiO612 and BiBaFeZnO613). Complex impedance spectroscopy (IS) technique is an essential tool to explore the electrical characteristics of perovskite materials, offering advantages such as identifying relaxation frequencies and differentiating between effects arising from grains, grain boundaries, and grain–electrode interactions.
A thorough literature review highlights substantial interest in utilizing the IS method to explore the electrical and dielectric properties of Ln1−xAxMnO3 materials. However, this study focuses on analyzing the electrical properties of Fe-substituted Ba0.67Ni0.33MnO3 perovskite using the IS approach.14–16 The research investigates the complex impedance formulation and relaxation behavior of the perovskite samples Ba0.67Ni0.33Mn1−xFexO3 (with x values of 0 and 0.2) within a specific temperature and frequency range.
The synthesized samples incorporate tetravalent (Mn) and divalent (Ni) ions, with Fe doping inducing a partial conversion from (Mn+4) to (Mn+3) and from (Ni+2) to (Ni+3) within the compound. This class of material exhibits dielectric and electrical properties at room temperature, showing semiconductor characteristics and dielectric relaxation and conduction phenomena. A comprehensive analysis has been conducted to elucidate its structural, morphological, dielectric, and electrical characteristics for applications in energy storage and electronic devices. Consequently, these compounds hold significance for prospective technological applications in the future.
2. Materials and methods
2.1. Synthesis of nanoparticles
The central aim of this investigation was to delve into the electrical traits of Ba0.67Ni0.33Mn1−xFexO3 perovskite samples, with variations in x values of 0 and 0.2. The synthesis of these materials involved the application of the solid-state reaction technique, a widely recognized method for perovskite synthesis. The process commenced with precise measurements of BaCO3 (barium carbonate, 99%), NiO (nickel oxide, 99%), MnO2 (manganese dioxide, 99%), and Fe2O3 (ferric oxide, 99%) in stoichiometric proportions, serving as precursor compounds. To ensure the purity and to eradicate any moisture content, the precursors underwent an initial preheating phase at 600 °C for a duration of 12 h. Subsequent to this step, the preheated mixture underwent decarbonation through heating in an air environment at 800 °C for 24 h (Fig. 1). This critical phase was instrumental in removing carbonates and stabilizing the chemical composition. Achieving a uniform blend necessitated meticulous grinding of the decarbonated precursors. The resultant powdered material underwent further heating at 1000 °C for 24 h, followed by an additional grinding to enhance uniformity. For subsequent electrical characterizations, the powdered materials were compacted into pellets measuring 12 mm in diameter and 1.5 mm in thickness. These pellets then underwent sintering at 1200 °C for 24 h to facilitate grain growth and densification.
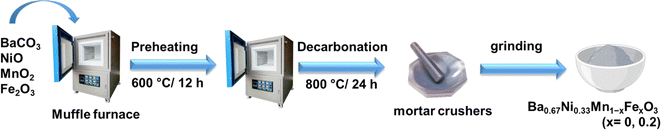 |
| | Fig. 1 Illustrative schematic of the preparation of the Ba0.67Ni0.33Mn1−xFexO3 nanopowders. | |
2.2. Measurement systems
The X-ray powder diffraction (XRD) analysis was executed using a Huber G670 Guinier diffractometer (Aveiro, PT, Portugal) equipped with an image plate detector, operating in transmission mode. CuK1 radiation with a curved Ge (111) monochromator (λ = 1.5406 Å) (Aveiro, PT, Portugal) was employed for the analysis, encompassing a broad range of Bragg's angles (20° ≤ 2θ ≤ 80°). To authenticate the chemical composition of the synthesized materials, energy dispersive (EDX) analysis was carried out utilizing a JEOL 5510 scanning electron microscope (SEM) paired with an INCAx-sight 6587 system from Oxford Instruments.
For electrical and dielectric assessments, an Agilent 4294A precision impedance analyzer (Aveiro, PT, Portugal) was employed, functioning within temperature ranges spanning 200–340 K and frequency ranges from 1 kHz to 10 MHz, respectively. To ensure optimal heat transfer and to prevent moisture influence, the samples were placed within a helium environment during the measurement process. Furthermore, for the application of electrodes, the compounds were shaped into disk-like forms, with conductive silver paste applied to the opposing surfaces to enhance electrical contact.
3. Results and discussions
3.1. Analysis of structure and morphology
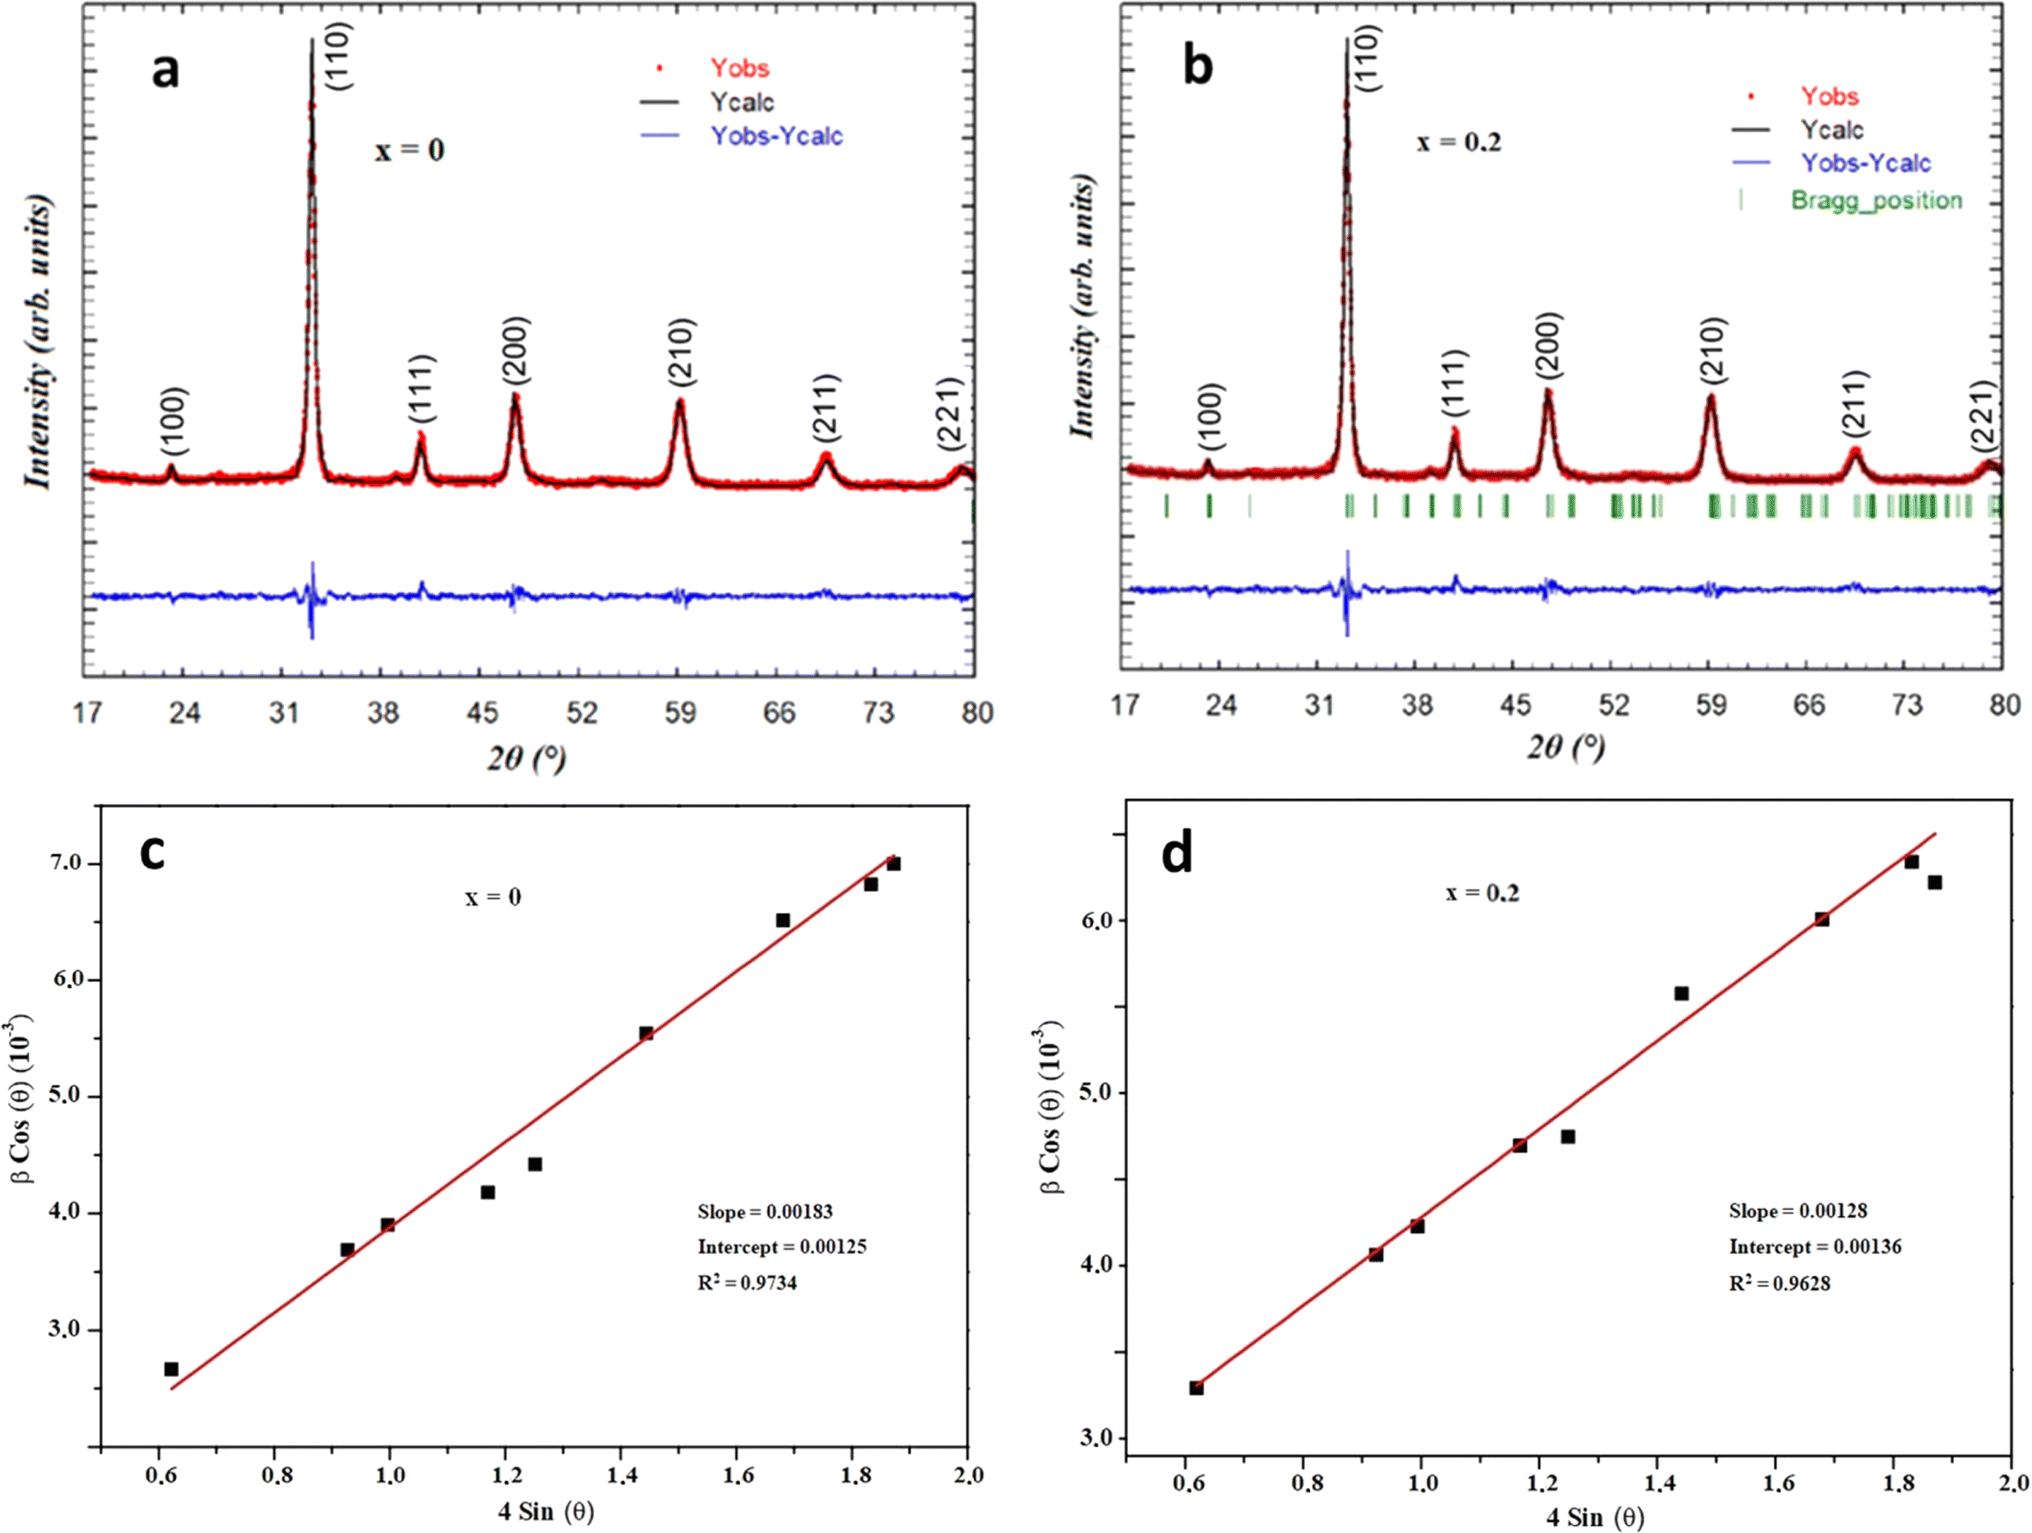
3.1.1. X-ray diffraction and structural analysis. Fig. 2a and b displays the X-ray diffraction patterns of the Ba0.67Ni0.33Mn1−xFexO3 compounds at room temperature, with x values of 0 and 0.2, respectively. The distinct and robust lines evident in all samples signify the successful crystallization of the materials. The XRD investigation reveals that all specimens have adopted an orthorhombic structure with the Imma space group. An intriguing observation emerges as the introduction of iron doping leads to a single-phase composition, devoid of any indications of secondary phases according to conventional interpretations of the XRD spectra. For an in-depth exploration of the structural attributes, the researchers harnessed the FULLPROF software17–19 in conjunction with the Rietveld method20,21 for structure optimization. Comprehensive outcomes of the Rietveld refinement are documented in Table 1. This refinement effort examined the influence of increasing Fe concentration on structural parameters encompassing cell dimensions, volume, average bond length, and average bond angle. Employing the Scherrer formula, as presented in,22 the average crystallite sizes for our samples were calculated from the XRD peaks using the formula:| |
 | (1) |
Here, λ denotes the X-ray wavelength, θ represents the most intense peak diffraction angle, and β is the full width at half-maximum (FWHM). Because the XRD refinement values are expected to fall between 37 and 33 nm, the introduction of Fe doping does not introduce any discernible size effect. Previous research had indicated that Fe3+ ions predominantly replace Mn3+ ions in the orthorhombic structure.23 The orthorhombic nature of the structure can also be theoretically confirmed through the calculation of the tolerance factor, as introduced by Goldschmidt:24,25| |
 | (2) |
In this expression, rA represents the radius of Ba (r (Ba)), rB denotes the radius of Ni, Mn, and Fe (r (Ni, Mn, Fe)), and rO signifies the ionic radii associated with cations at sites A, B, and oxygen, respectively. The progression of crystal structures based on the tolerance factor value is elucidated as follows: 0.75 < t < 0.96 leads to orthorhombic distortion, 0.96 < t < 0.99 results in rhombohedral distortion, and 0.99 < t < 1.06 leads to a cubic structure. As per Shannon's data, the ionic radii are defined as follows: r (Ba2+) = 1.38 Å, r (Ni2+) = 0.49 Å, r (Fe2+) = 0.49 Å, r (Fe3+) = 0.585 Å, r (Mn3+) = 0.53 Å, r (Mn4+) = 0.58 Å, and r (O2−) = 1.4 Å.26,27 For this particular material, the tolerance factor (t) is below 1, specifically t = 0.953, confirming the orthorhombic structure of the sample.
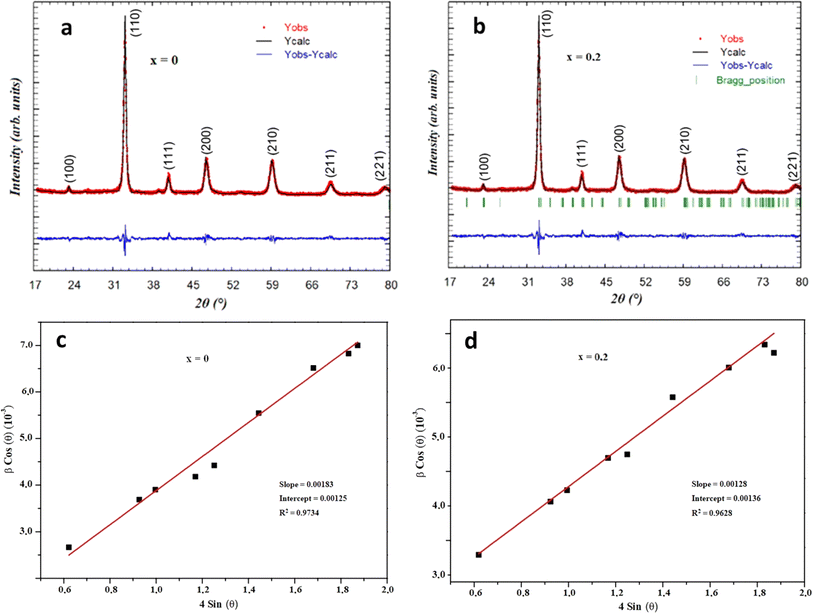 |
| | Fig. 2 XRD patterns of Ba0.67Ni0.33Mn1−xFexO3 obtained through Rietveld refinement for (a) x = 0.0 and (b) x = 0.2. Evolution of βcosθ vs. 4sinθ for Ba0.67Ni0.33Mn1−xFexO3 compound with (c) x = 0.0 and (d) x = 0.2. | |
Table 1 Structural parameters obtained from XRD Rietveld refinement for Ba0.67Ni0.33Mn1−xFexO3
| Sample |
X = 0.0 |
X = 0.2 |
| Crystal phase |
Imma |
Imma |
| Crystallographic system |
Orthorhombic |
Orthorhombic |
| a (Å) |
5.4914 |
5.4921 |
| b (Å) |
7.7591 |
7.7609 |
| c (Å) |
5.5195 |
5.5203 |
| V (Å3) |
236.17 |
236.29 |
| χ2 |
1.17 |
1.69 |
| Rf |
1.46 |
1.32 |
| RB |
1.27 |
1.49 |
| d [Fe–O1] (Å) |
— |
1.927 |
| d [Mn–O1] (Å) |
1.935 |
1.941 |
| d [Fe–O2] (Å) |
— |
1.948 |
| d [Mn–O2] (Å) |
1.931 |
1.929 |
| Fe–O1–Mn (°) |
— |
159.30 |
| Mn–O1–Mn (°) |
163.52 |
162.87 |
| Fe–O2–Mn (°) |
— |
174.97 |
| DXRD (nm) |
37 |
33 |
3.1.2. Crystallite size determination using Williamson–Hall method. Alternatively, the Williamson–Hall method was employed to calculate the crystallite size. This technique's strength lies in its capacity to isolate size and distortion effects.28 Only significant peaks from the XRD pattern were considered for this analysis. The relationship:| |
 | (3) |
Was employed to determine the DWH (dislocation-induced broadening) crystallite size and the microstructural parameters. It is crucial to highlight that the relation
| | |
β = [βmeasured2 − βinstrumental2]1/2
| (4) |
Can be utilized to estimate the instrumentally corrected broadening β associated with each diffraction peak. The XRD model's Bragg peaks comprise a blend of sample-dependent and instrument-dependent effects. These contributions can be separated using silicon as the reference material for calculating instrumental broadening. The evolution of cos θ as a function of 4 sin θ can be observed in Fig. 2c and d for the x = 0 and x = 0.2 samples, respectively. The point of intersection of the plot with the vertical axis (at sin θ = 0) aids in determining the DWH crystallite size, while the slope of the curve helps deduce the strain. The Williamson–Hall parameters obtained are documented in Table 1.
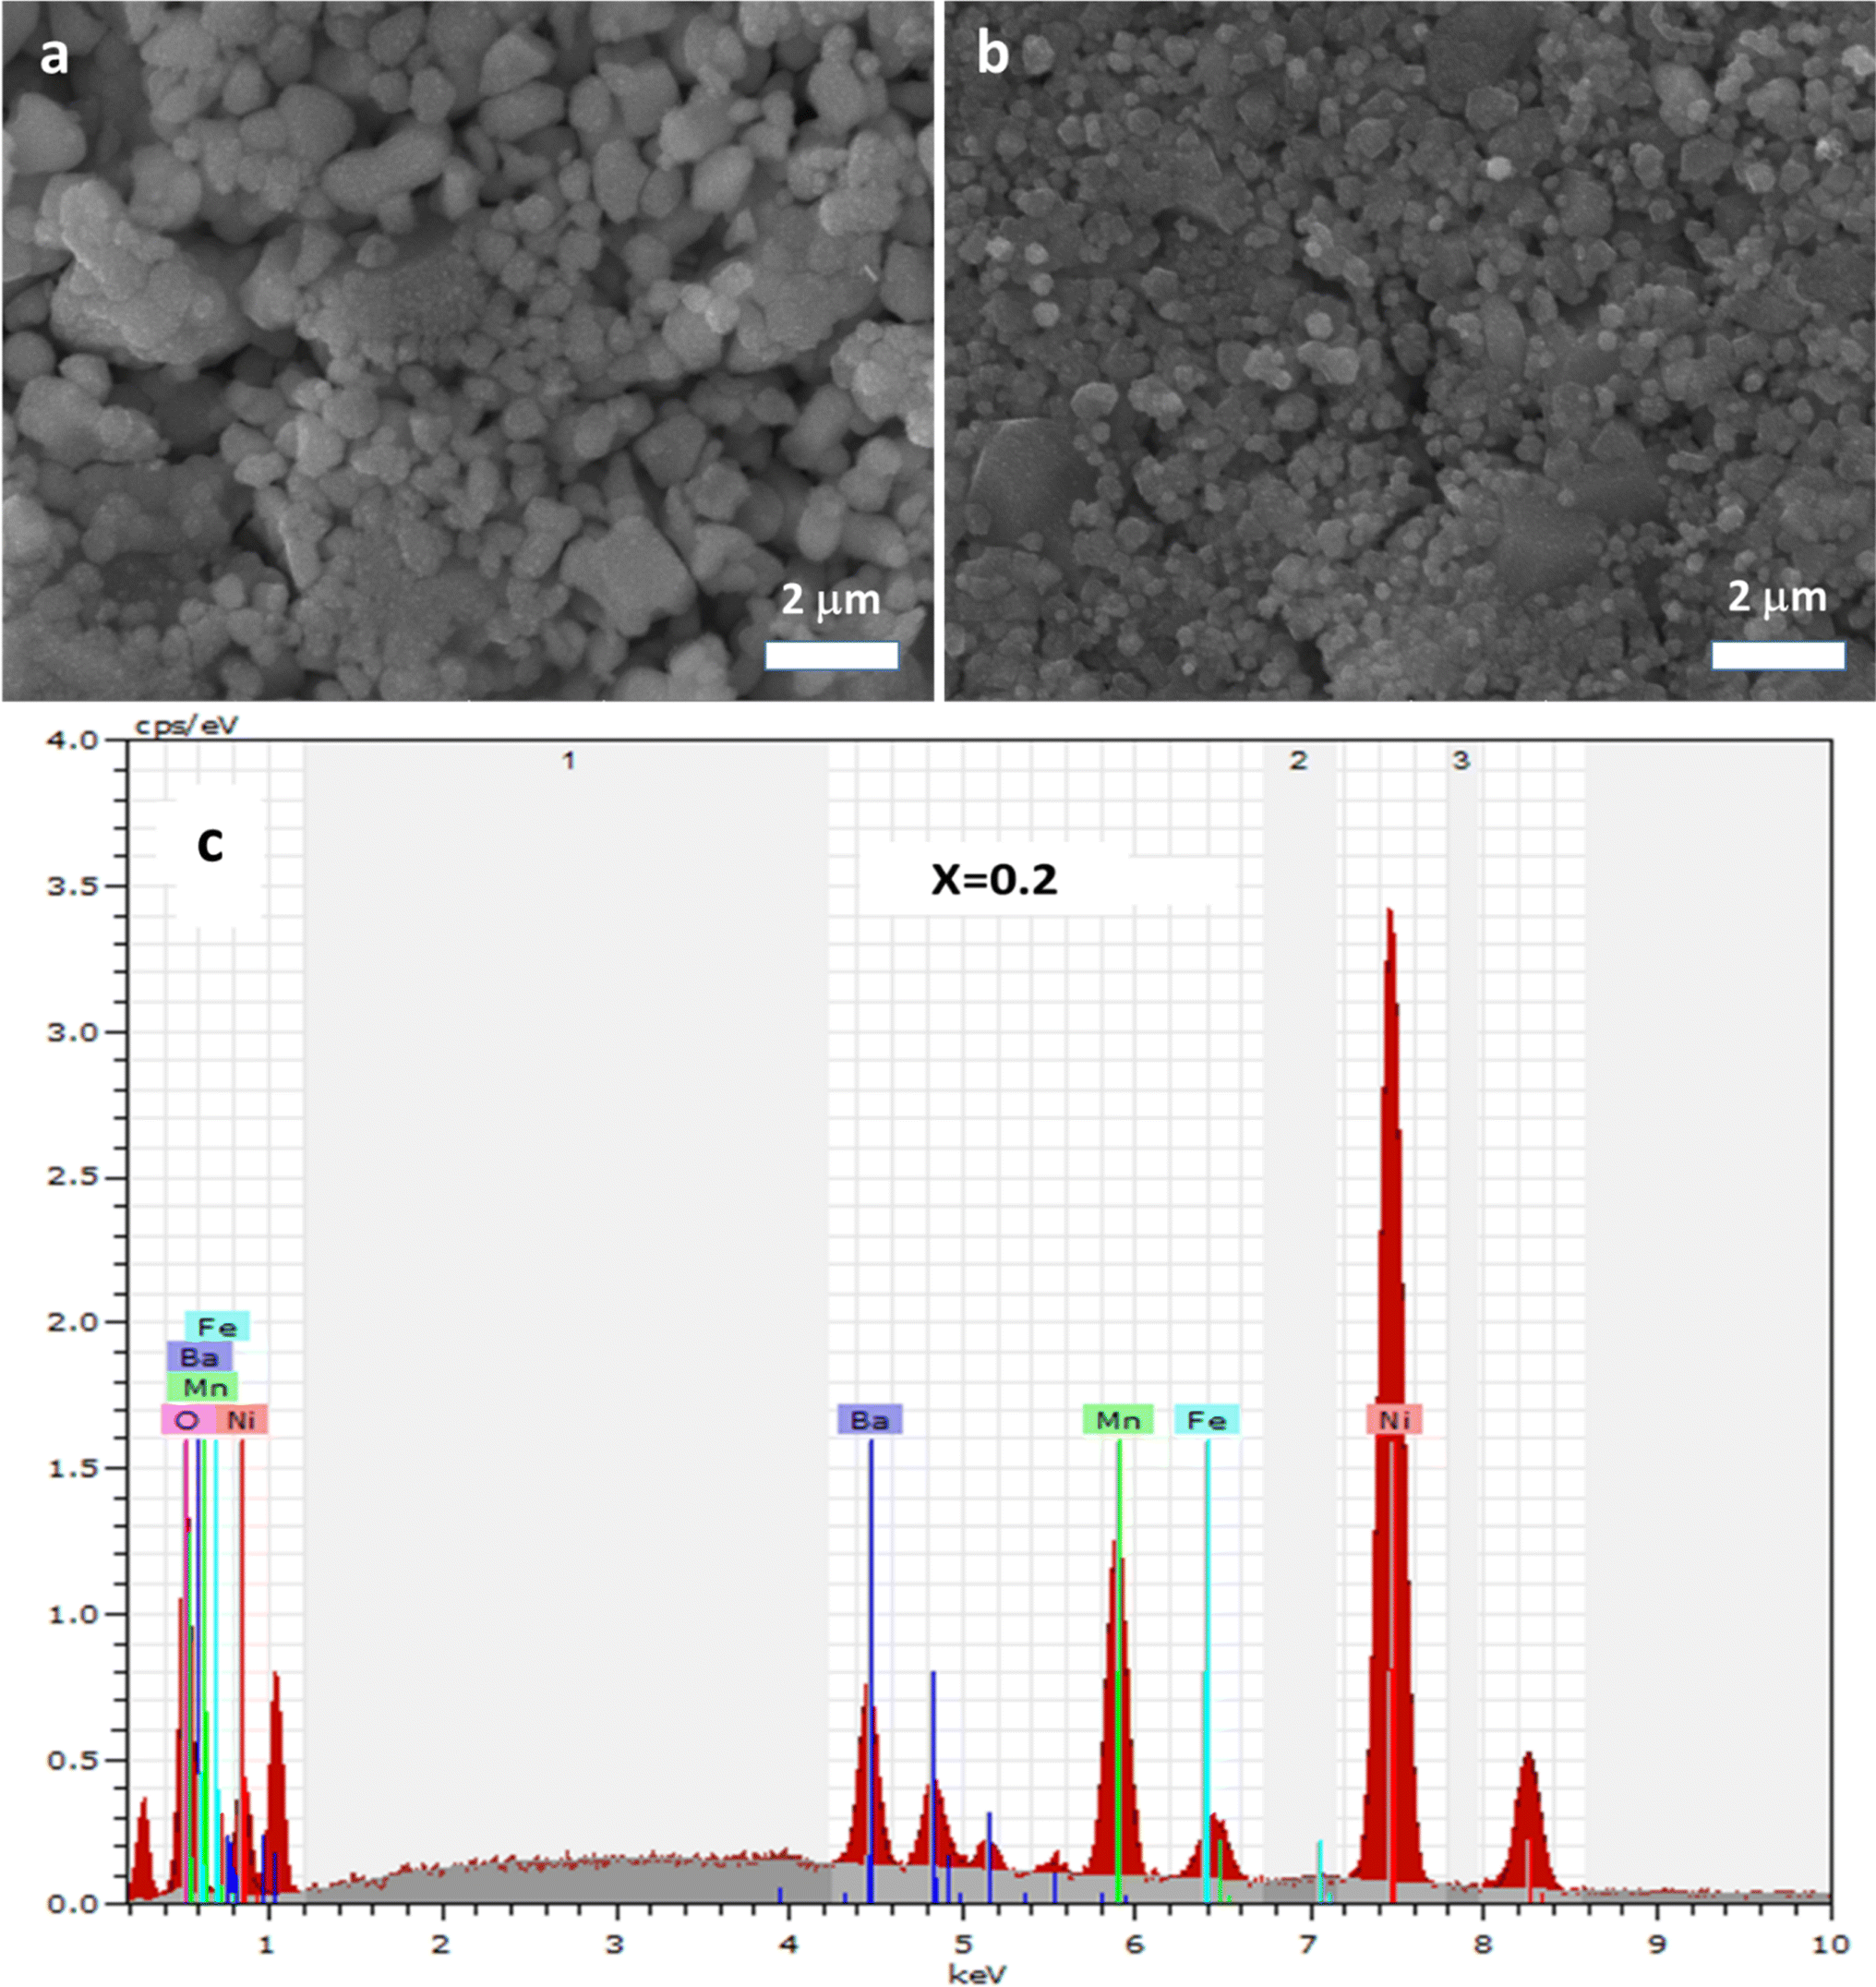
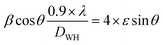
3.1.3. Scanning electron microscopy analysis. SEM images in Fig. 3a and b, captured in backscattered electron (BSE) mode, vividly portray the surface of the complex compounds corresponding to x = 0, and x = 0.2, respectively. These images offer insights into the morphology and chemical composition. The material's grain size is evident, revealing a consistently thick and uniform grain morphology. Noteworthy variations in grain dispersion and noticeable porosity are observable. For the case of x = 0, the average grain size is measured at 226 nm. Intriguingly, the crystallite size computed through the Williamson–Hall and Scherrer methods is significantly smaller than the grain size ascertained via SEM. This divergence can be attributed to each SEM-detected grain comprising multiple crystallites. It is pertinent to note that the Williamson–Hall model estimates a larger crystallite size compared to the result derived from the Scherrer formula, which disregards the broadening influence due to strain. A semi-quantitative energy dispersive spectroscopy (EDX) analysis was performed to evaluate homogeneity and to confirm the elemental composition of the examined substances (Fig. 3c). This analysis verifies the presence of all the chemical elements utilized in sample preparation (Ba, Ni, Mn, Fe, and O elements).
 |
| | Fig. 3 Scanning electron micrographs of Ba0.67Ni0.33Mn1−xFxO3 for (a) x = 0.0, and (b) x = 0.2, with a scale of 2 μm. (c) Energy dispersive X-ray (EDX) analysis spectra for Ba0.67Ni0.33Mn0.8Fe0.2O3 at room temperature. | |
3.2. Study of electrical conductivity
3.2.1. Analysis of Jonscher power law. The electrical conductivity investigation of Ba0.67Ni0.33Mn1−xFexO3 samples featuring distinct iron concentrations (x = 0 and 0.2) was accomplished through the utilization of the equation:| |
 | (5) |
Here, A symbolizes the cross-sectional area of the pellet, e signifies the pellet thickness, and G represents its electrical conductance. Fig. 4a and b portrays the frequency-dependent conductivity for the Ba0.67Ni0.33Mn1−xFexO3 with x = 0 and x = 0.2 samples within the temperature range of 200–340 K, respectively. The composite conductivity of the samples is expressible as the sum of direct current conductivity (σdc) and alternating current conductivity (σac), as postulated by the Jonscher power equation:29,30
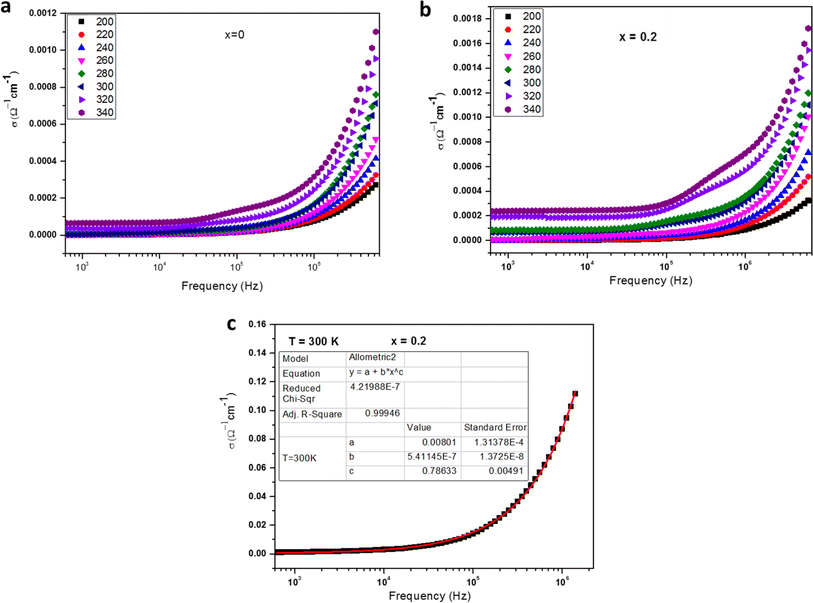 |
| | Fig. 4 Conductivity (σ) variation with frequency at different temperatures for Ba0.67Ni0.33Mn1−xFexO3 with (a) x = 0.0, and (b) x = 0.2. (c) Fitted conductivity curve example of Ba0.67Ni0.33Mn0.8Fe0.2O3 at 300 K. | |
The ac conductivity adheres to an empirical formula for frequency dependency, known as the ac power law:
In this context,
s stands for the frequency exponent, influenced by both frequency and temperature, while
A denotes a coefficient modulated by temperature.
An analysis of the Fig. 4a and b data reveals a compelling fit to eqn (6), with a close alignment between the fit and the experimental values. An example of a fitted curve for the sample x = 0.2 at 300 K is presented in Fig. 4c. Table 2 outlines the results derived from the fitting process, indicating that the obtained s values escalate as temperature rises, congruent with a thermally activated process. An intriguing pattern emerges from Table 2; as the Fe content increases, the exponent s declines. This phenomenon can be attributed to the reduction in the Mn3+/Mn4+ ratio upon elevating the Fe concentration, leading to a marked decrease in the impact of Mn3+–O–Mn4+ double-exchange (DE) interactions. In order to provide a deeper understanding, the material's electronic band structure should be taken into account, allowing for a comprehensive interpretation of the sample behavior.31–34 The spectra exhibit two distinct regions, with the second region (at higher frequencies) revealing conductivity dispersion and a plateau at lower frequencies, which represents the direct current contribution.
Table 2 Adjustment parameters extracted from conductivity–frequency experimental data for Ba0.67Ni0.33Mn1−xFexO3
| T(K) |
200 |
220 |
240 |
260 |
280 |
300 |
320 |
340 |
| X = 0.0 |
| σdc(10−2 Ω−1 m−1) |
1.74 |
2.0 |
2.26 |
2.50 |
2.74 |
2.98 |
3.26 |
3.66 |
| A (×10−7) |
4.564 |
5.021 |
5.367 |
4.302 |
3.242 |
2.987 |
2.701 |
2.541 |
| s |
0.622 |
0.630 |
0.641 |
0.701 |
0.753 |
0.766 |
0.786 |
0.823 |
| R2 |
0.999 |
0.999 |
0.999 |
0.999 |
0.999 |
0.999 |
0.999 |
0.999 |
|
| X = 0.2 |
| σdc(10−2 Ω−1 m−1) |
0.45 |
0.52 |
0.61 |
0.67 |
0.73 |
0.80 |
0.85 |
0.94 |
| A (×10−7) |
9.221 |
8.564 |
8.159 |
6.995 |
7.439 |
5.411 |
5.396 |
4.724 |
| s |
0.461 |
0.536 |
0.549 |
0.609 |
0.693 |
0.786 |
0.797 |
0.827 |
| R2 |
0.999 |
0.999 |
0.999 |
0.999 |
0.999 |
0.999 |
0.999 |
0.999 |
3.2.2. Analysis of DC conductivity. Fig. 5a graphically depicts the direct current conductivity of Ba0.67Ni0.33Mn1−xFexO3 samples (x = 0 and 0.2) across varying temperatures. Remarkably, these conductivity curves do not exhibit a metal–semiconductor transition at any temperature; instead, they consistently exhibit semiconductor behavior. Moreover, a discernible trend emerges as the (dc) conductivity decreases with the increase in Fe content, corroborating findings from related research.35,36 The participation of the Mn band in the electrical activity significantly influences this scenario, where electron jumps transpire between Mn3+ and Mn4+, causing a diminution in direct current conductivity.37 Upon the introduction of Fe as a substitution for Mn, the electron's transition from Mn3+ to Fe3+ is obstructed. This effect can be attributed to Fe3+ acting as a trapping center for electrons, impeding the transport process. The incorporation of Fe via Mn doping obstructs some of the customary pathways that facilitate electron transport. Consequently, the presence of Fe3+ tends to fix neighboring spins, reducing the available electrons for jumps and the count of open jump sites.38 This elucidates the observable reduction in conductivity with an upswing in Fe content. The behavior of conductivity conforms to the Arrhenius relationship, as portrayed in eqn (8):| |
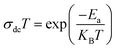 | (8) |
 |
| | Fig. 5 (a) Temperature-dependent direct current (dc) conductivity for Ba0.67Ni0.33Mn1−xFexO3 (x = 0.0 and 0.2) perovskite samples. (b) Arrhenius plots depicting Ln (σdc) vs. 1000/T for x = 0 and 0.2 compositions. (c) Variation of s component as a function of temperature of the x = 0 and 0.2 samples. | |
where KB stands for the Boltzmann constant, Ea signifies the activation energy, and σ0 represents a constant. Fig. 5b depicts the variation of σdc T as a function of 1000/T for our samples. The calculated activation energies (Ea) for x = 0 and 0.2 amount to 0.138 and 0.171, respectively. Evidently, the activation energy values surge with heightened Fe content, a trend congruent with earlier research involving the substitution of Mn with Fe.39 As Fe concentration rises, certain Mn–O–Mn bonds undergo substitution by Mn–O–Fe bonds, thereby altering the lattice and affecting carrier hopping. Consequently, the predominant mechanism of carrier hopping shifts from Mn–O–Mn pathways, resulting in a decreased number of accessible jump sites. Fig. 5c depicts the temperature-dependent variation of the ‘s’ component for the prepared samples. With increasing temperature, the ‘s’ component exhibits a gradual increase, indicating the relevance of NSPT (Non-Overlapping Small Polaron Tunneling) as a prominent conduction model. This model holds particular significance in investigating conduction phenomena within the limit of the alternating regime. The corresponding proof for this assertion lies in the observed trend in the data, where the ‘s’ component continues to rise beyond 340 K, providing empirical evidence for the relevance of NSPT throughout the investigated temperature range.
3.3. Dielectric properties
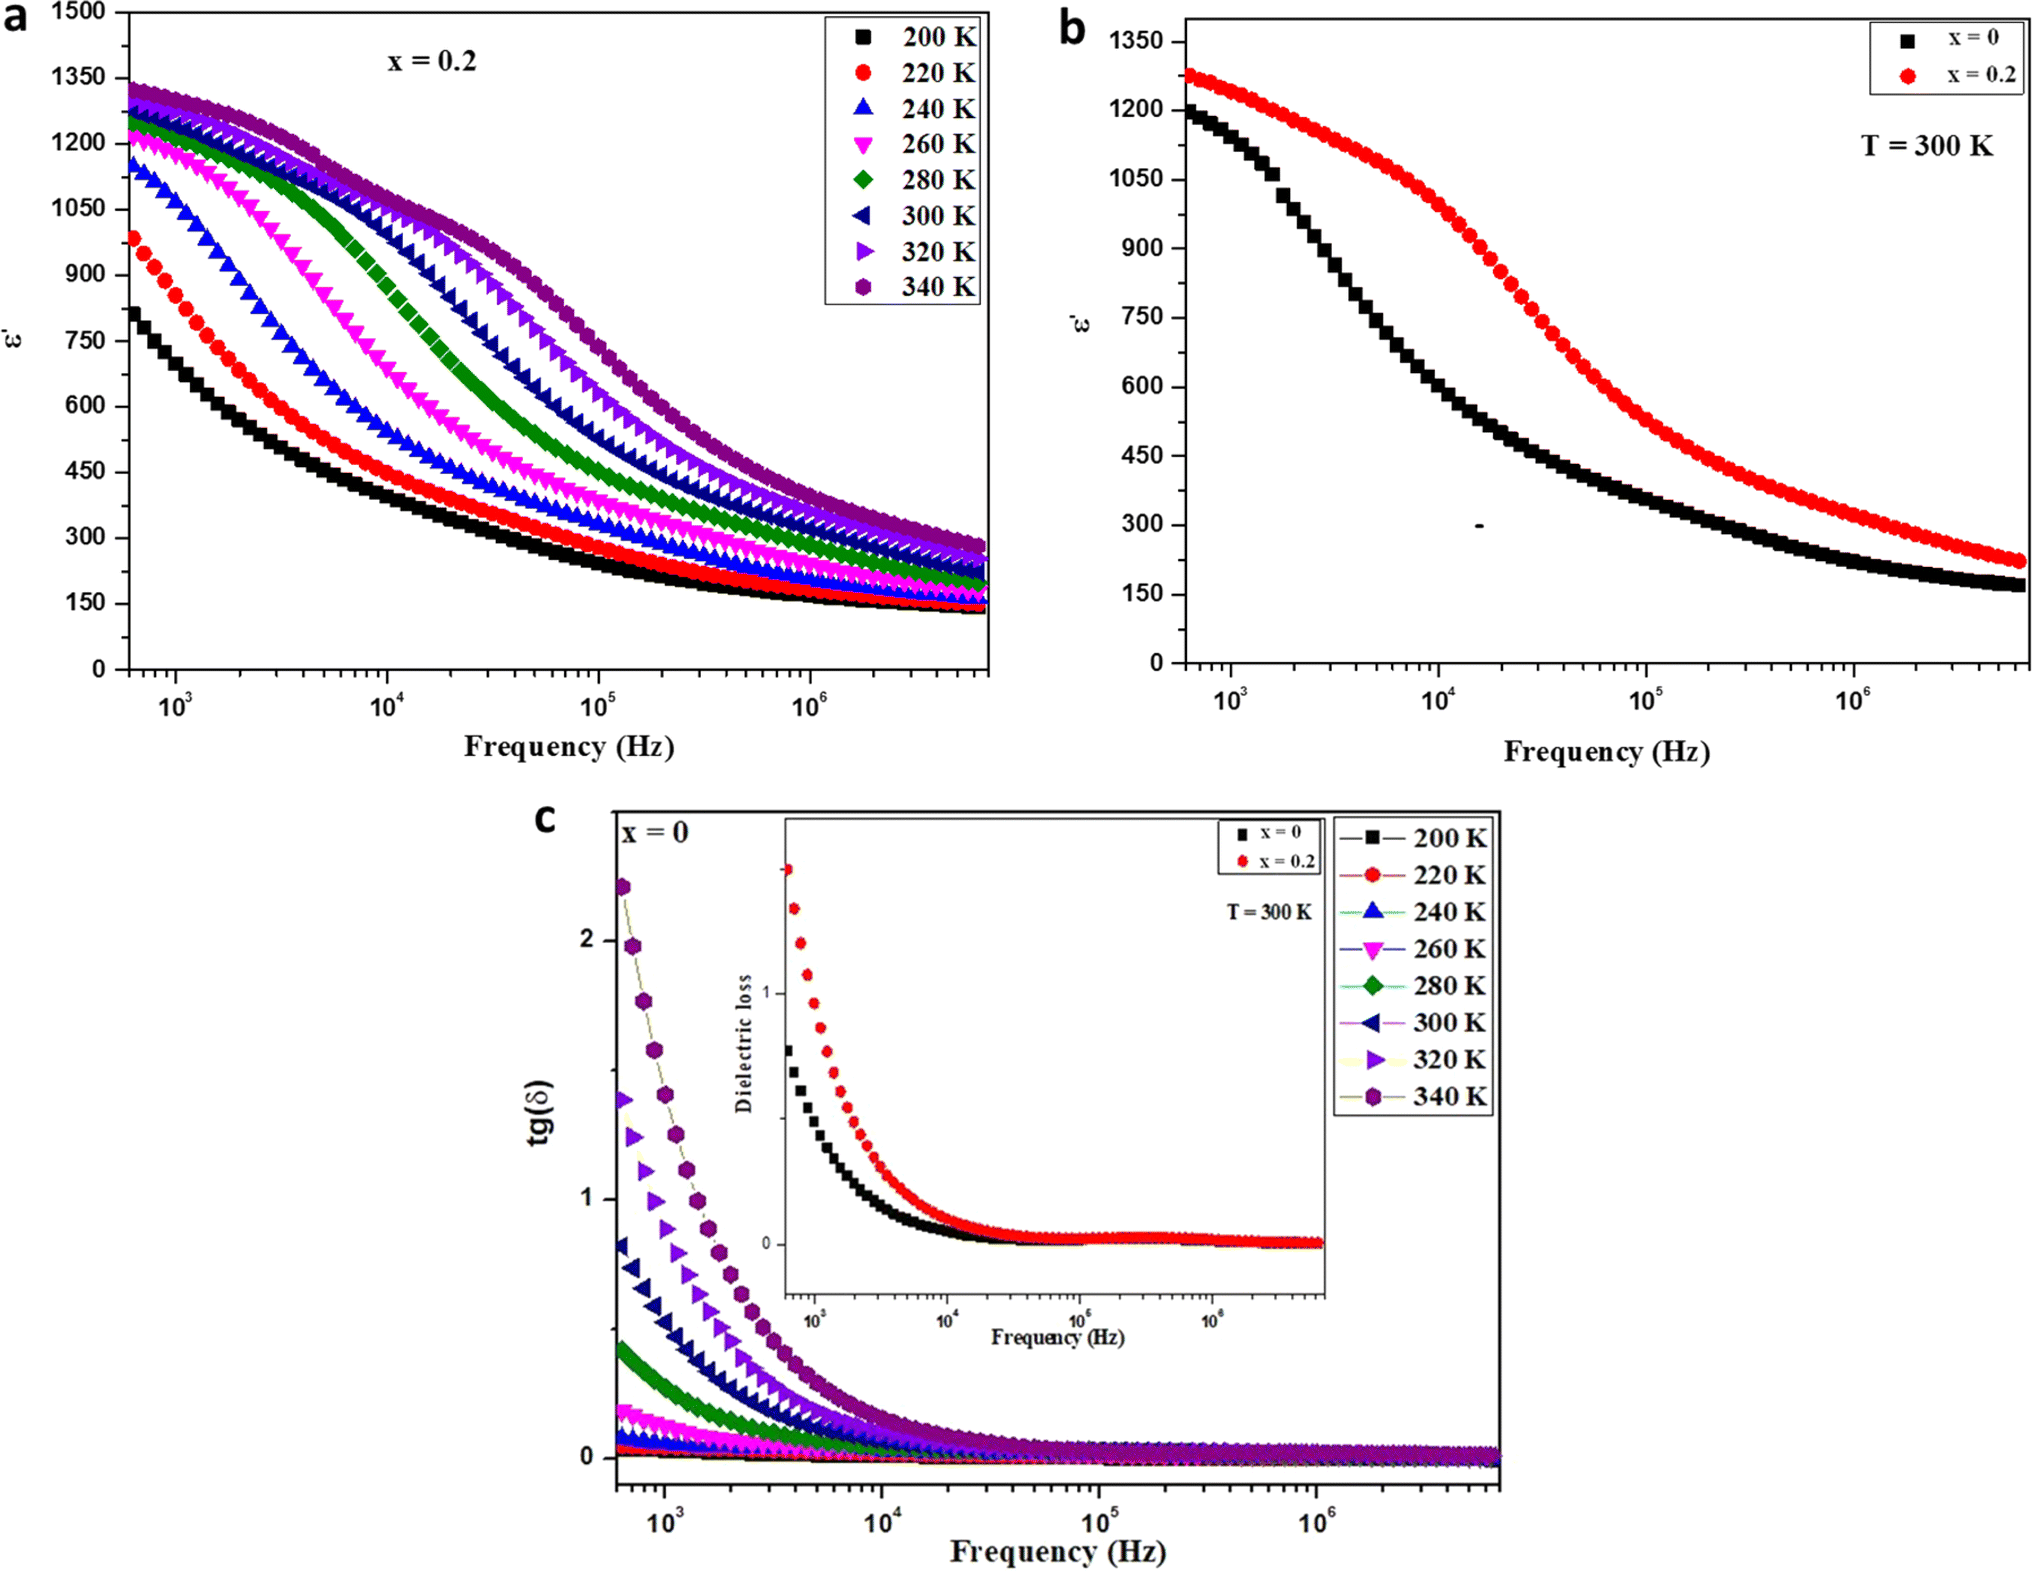
Fig. 6a depicts the fluctuation of the dielectric constant (ε′) in relation to frequency for the Ba0.67Ni0.33Mn0.8Fe0.2O3 sample. The dielectric constant, ε′, undergoes an augmentation with the escalation of temperature. Notably, its peak value is observed in the low-frequency range, followed by a decline as the frequency increases. This phenomenon is attributed to the challenge electric dipoles face in achieving uniform alignment with the applied electric field direction at higher frequencies. This difficulty is ascribed to the predominant influence of electronic polarization, which surpasses other forms of polarization within this frequency range. For a comparative analysis between the pure and Fe-doped samples, Fig. 6b presents the dielectric constant (ε′) as a function of frequency at 300 K. Remarkably, any increment in the degree of Fe doping results in a proportional increase in dielectric permittivity. This observation holds significant promise as the material exhibits high permittivity, rendering it an intriguing candidate for applications in electronics and energy storage.10
 |
| | Fig. 6 (a) Dielectric constant (ε′) as a function of frequency at different temperature for the sample x = 0.2. (b) ε′ as a function of frequency of the prepared samples at room temperature. (c) Frequency dependence of dielectric loss tan (δ) at various temperatures for Ba0.67Ni0.33Mn1−xFxO3 (x = 0.0 and 0.2) perovskite samples. | |
The estimation of the dielectric loss factor (tanδ) for our samples was accomplished using the equation:
| |
 | (9) |
In this context,
ε′ and
ε′′ represent the real and imaginary components of the dielectric permittivity, respectively, capturing both energy storage and loss within the material.
Fig. 6c illustrates the variation of tan(
δ) with frequency for Ba
0.67Ni
0.33Mn
1−xFe
xO
3 samples (
x = 0 and 0.2) at different temperatures. The fluctuations in dielectric loss can be ascribed to diverse forms of polarization, such as ionic, electronic, dipolar, and interfacial or space charge, emerging at distinct stages due to the changing frequency of the applied alternating field. Each of these polarization mechanisms involves short-range charge movement, collectively contributing to overall polarization before influencing the material's dielectric constant.
40 It is crucial to recognize that the significant dielectric loss values observed in the lower frequency range are not commonly associated with bulk effects. Instead, they can be traced back to the accumulation of free charges at interfaces within the sample bulk (interfacial Maxwell–Wagner polarization)
41 and between the sample and electrode interface (space-charge polarization).
42
These factors likely explain the notably high tan δ values observed exclusively at very low frequencies. The evident dielectric loss values in the system are directly linked to the presence of grains and interfaces (grain boundaries), aligning with the Maxwell–Wagner interfacial polarization theory.43 The material's dielectric constant increases proportionally to the polarizability of its molecular constituents. As electronic and atomic polarizations remain relatively stable at these frequencies, the dispersion observed in the lower frequency region of Fig. 5 is attributed to interfacial polarization. In our samples, local electron displacement responding to the applied field direction, resulting in polarization, is facilitated by electron exchange between Mn3+ and Mn4+ (Mn3+ < = > Mn4+).
3.4. Impedance spectroscopy
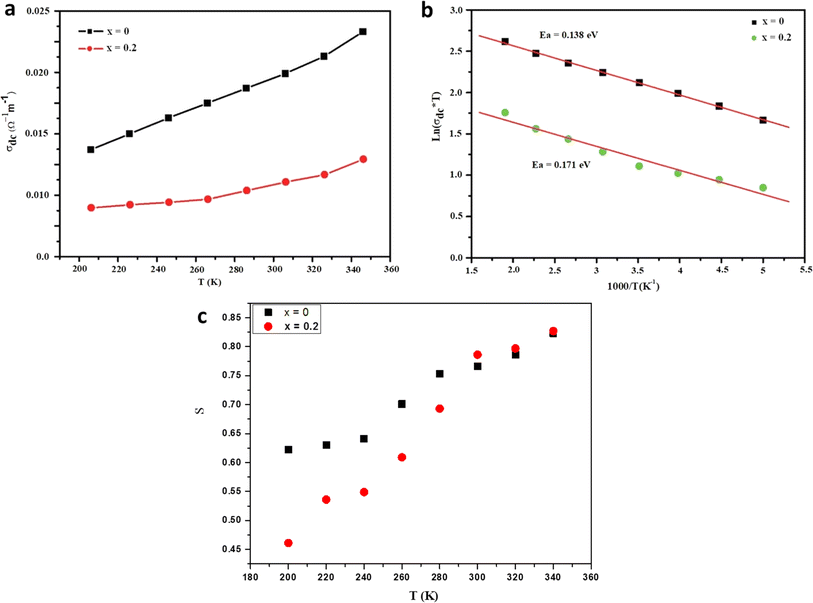
3.4.1. Real component of impedance. The real portion of impedance (Z′) variations for Ba0.67Ni0.33Mn1−xFexO3 samples (x = 0 and 0.2) at distinct temperatures is illustrated in Fig. 7. Evidently, the magnitude of Z′ declines as the frequency and temperature increase, signaling heightened conductivity at elevated temperatures and frequencies. At frequencies surpassing 104 Hz and across all temperatures, Z′ values converge. This convergence could be attributed to weakened barrier properties at higher temperatures, enabling the release of space charges. This phenomenon may enhance alternating current conductivity at elevated temperatures and frequencies. The observed Z′ behavior in our samples, both at lower and higher frequency ranges, closely aligns with prior observations.44 Furthermore, from Fig. 7, it can be noted that Z′ values escalate with rising Fe concentration, mirroring the interpretation derived from the previous section's electrical conductivity analysis.
 |
| | Fig. 7 Frequency dependence of the real part (Z′) of impedance at various temperatures for (a) x = 0.0 and (b) x = 0.2 samples. | |
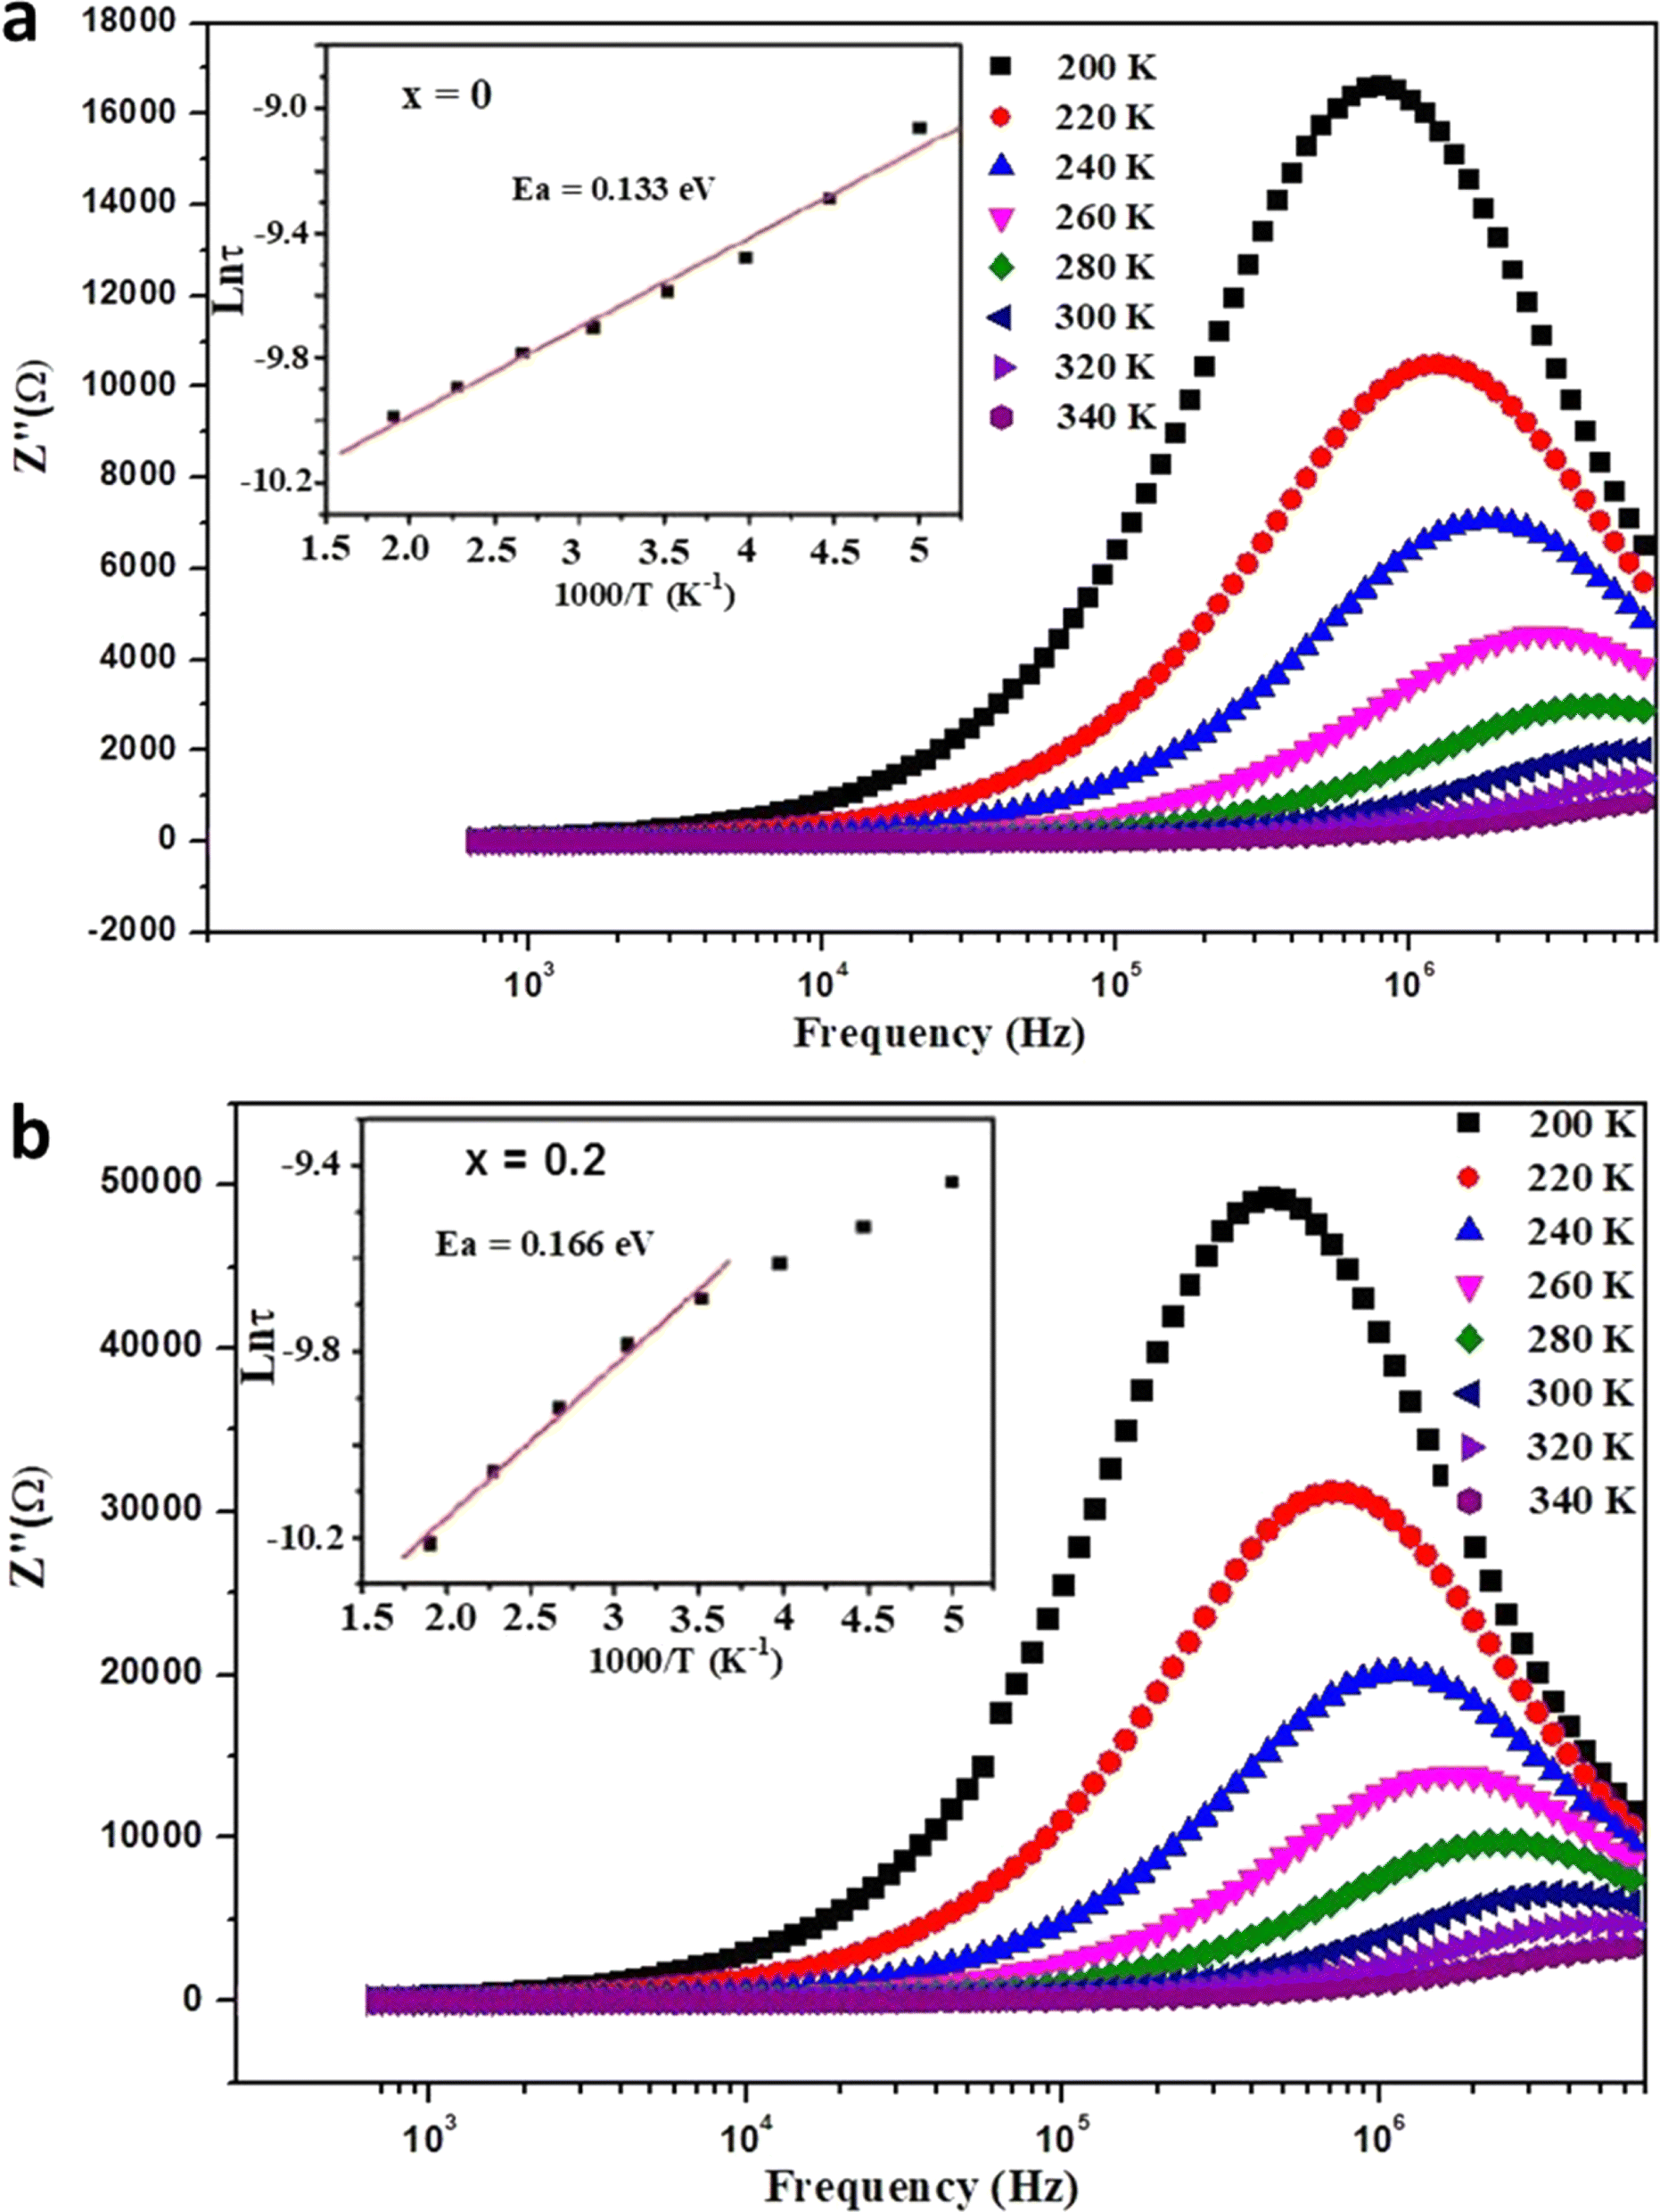
3.4.2. Imaginary component of impedance. In Fig. 8, the progression of the imaginary impedance component (Z′′) with frequency is depicted at various temperatures for samples of Ba0.67Ni0.33Mn1−xFexO3 (x = 0 and 0.2). The curves demonstrate the reaching of a maximum point (Zmax), with Z′′ values decreasing at elevated frequencies as the temperature rises. This pattern indicates the presence of relaxation phenomena in our materials.45 The relaxation process is influenced by species at low temperatures and defects and gaps at higher temperatures.46
 |
| | Fig. 8 Frequency dependence of the imaginary part (Z′′) of impedance at different temperatures for (a) x = 0.0 and (b) x = 0.2 samples, with the evolution of Ln (τ) with 1000/T shown in the inset. | |
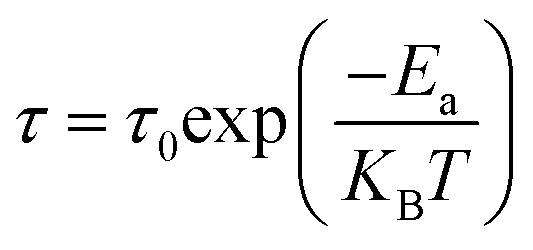
The relaxation time (τ) diminishes with higher temperatures, with its variation characterized by the equation:
The insets of Fig. 7 display the transformation of Ln (τ) with 1000/T for all samples, demonstrating an Arrhenius-like tendency for the relaxation time. The relaxation time adheres to the equation:
| |
 | (11) |
Within this equation,
τ0 is indicative of the pre-exponential factor,
Ea represents the activation energy,
KB is the Boltzmann constant, and
T denotes temperature. The calculated
Ea values for
x = 0 and 0.2 are 0.133 and 0.166 eV, respectively, based on the peak of the linear adjustment traces. The derived activation energy closely aligns with the analysis of continuous conductivity. The subtle difference between activation energies for conduction and relaxation might be attributed to the fact that relaxation involves localized carrier movement, while the conduction mechanism necessitates energy for carrier motion, causing disorder and linking polarons.
47 This suggests that a consistent type of charge carrier is accountable for both the conduction and relaxation processes.
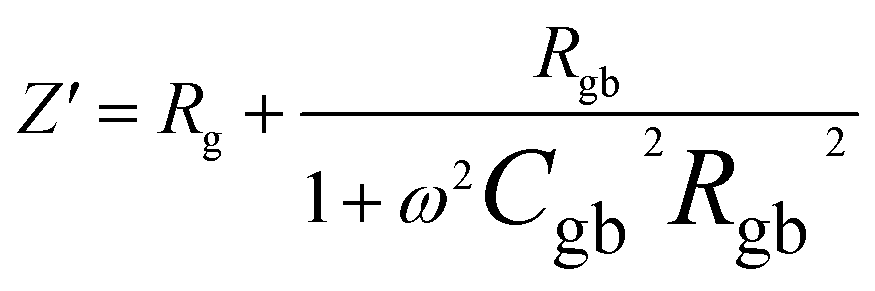
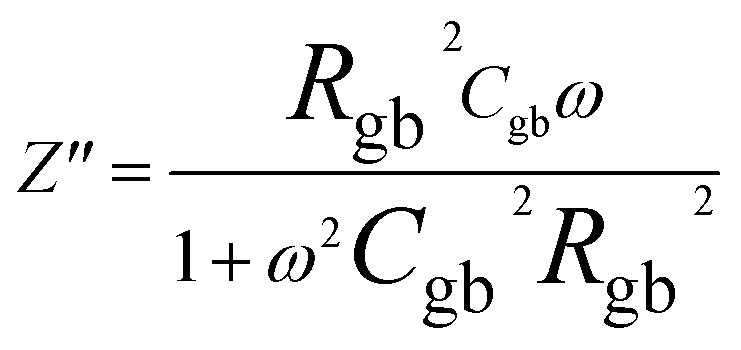
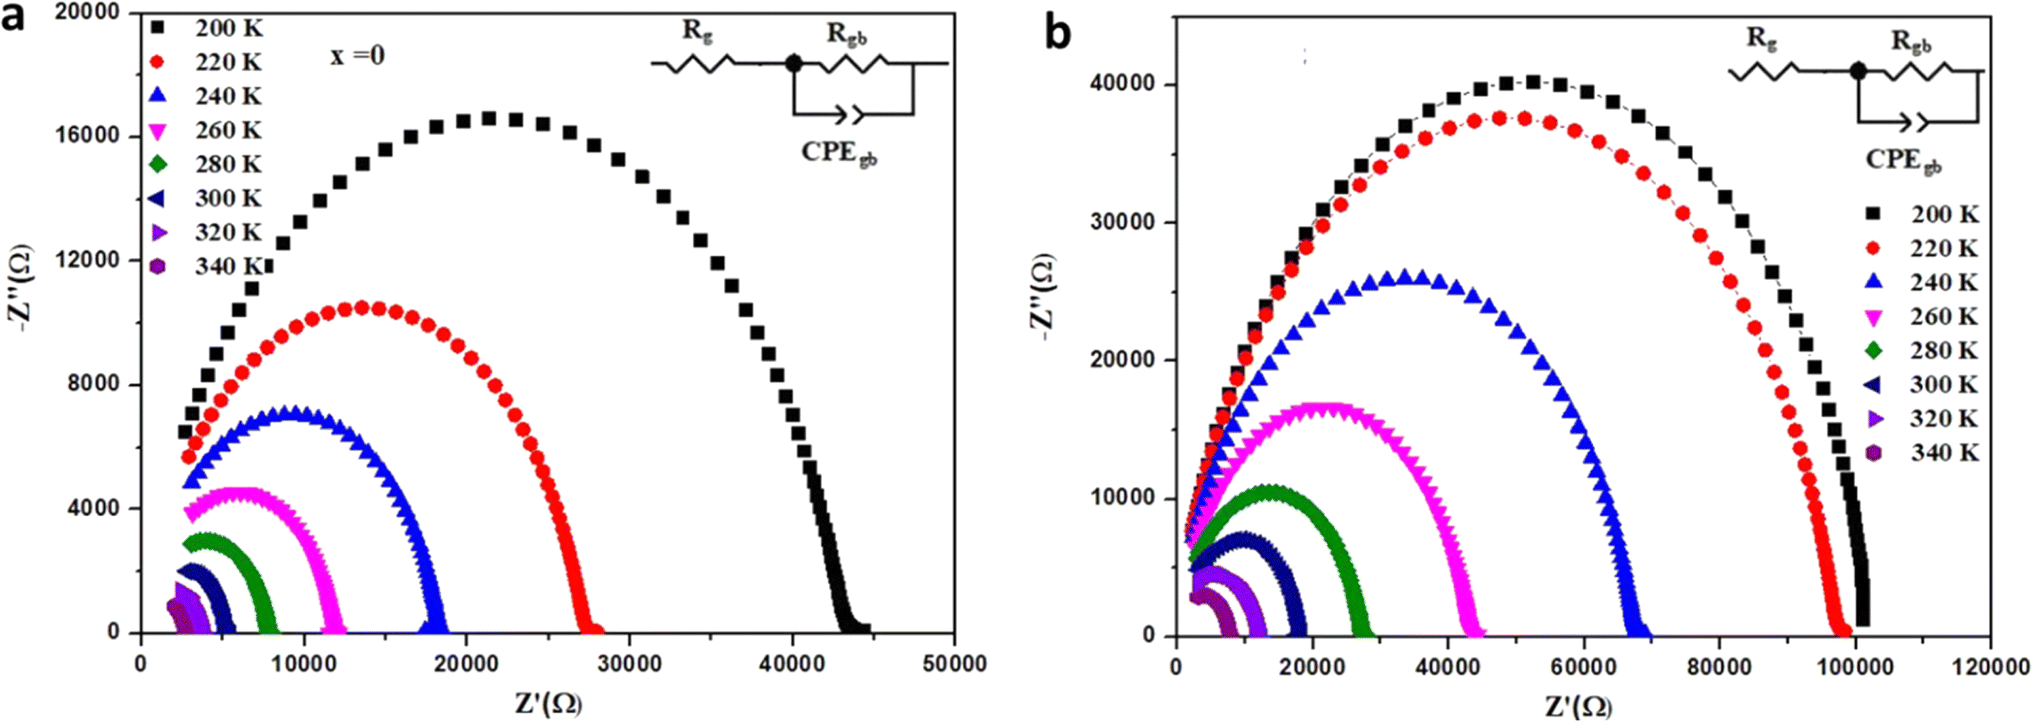
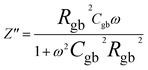
3.4.3. Nyquist diagram. Fig. 9 portrays the variation of Z′′ versus Z′ (Nyquist plots) at diverse temperatures for Ba0.67Ni0.33Mn1−xFexO3 samples (x = 0 and 0.2). The spectra exhibit complete circular arcs, with the maxima of these arcs diminishing as temperature increases. Furthermore, the half-circle's diameter diminishes with the temperature, signifying a noteworthy increase in continuous current conduction. The presence of a single demi-circle at all temperatures suggests adherence to a solitary relaxation mechanism.48 In the literature, we find the same results for the BaMn0.99Fe0.01O3 ceramics.49 For modeling our samples, an analogous circuit structure of the form (Rg + Rgb//CPEgb)44,46 is suitable, as portrayed in the inset of Fig. 9. Within this circuit arrangement, CPEgb denotes the grain-boundary capacitance, while Rg and Rgb mimic the grain and grain-boundary resistances, respectively. The overall resistance (RT = Rg + Rgb) dictates the right intersection of the semicircle at low frequencies when it intersects the real axis. Consequently, Rg can be deduced from the left intersection of the semicircle with the real axis. Conversely, at high frequencies, the impedance response is dominated by the grain, where Rg is significantly lower than Rgb, as evidenced in the impedance spectra presented in Fig. 9. According to the analogous circuit, the real (Z′) and imaginary (Z′′) components of impedance can be articulated as follows:50| |
 | (12) |
| |
 | (13) |
 |
| | Fig. 9 Nyquist plots of Ba0.67Ni0.33Mn1−xFexO3 samples at different temperatures with electrical equivalent circuit (inset) for (a) x = 0.0 and (b) x = 0.2. | |
The impedance data were meticulously fitted using Zview software across all temperatures, revealing a strong agreement between the fit and experimental values. Table 3 presents the fitted parameter values, indicating a decline in Rgb values as temperature rises, signifying a semiconductor characteristic across all samples. This behavior has been consistently observed in the literature for analogous materials.51 The reduction in the grain-boundary effect at higher temperatures potentially lowers the barrier to charge carrier movement, facilitating increased electrical conduction. A variety of materials, encompassing perovskite, ceramic conductors, and polymer composites containing ionically dispersed conductors in ceramics, have exhibited indications of grain-boundary conduction.52–54 Furthermore, the derived Rg and Rgb values rise with Fe concentration, indicative of diminished conductivity upon Fe substitution. Notably, for all compounds, the grain-boundary resistances (Rgb) surpass the grain resistances (Rg). This discrepancy is attributed to the disordered arrangement of atoms near grain boundaries, leading to a substantial increase in electron transport.
Table 3 Electrical characteristics of the equivalent circuit derived from complex temperature-dependent impedance spectra
| T(K) |
200 |
220 |
240 |
260 |
280 |
300 |
320 |
340 |
| X = 0.0 |
| Rg (Ω) |
210 |
190 |
185 |
178 |
169 |
163 |
158 |
150 |
| Rgb (Ω) |
8497 |
7242 |
6314 |
5685 |
5250 |
4790 |
4378 |
3855 |
| CPEgb (×10−8 F) |
1.98 |
1.52 |
1.14 |
1.17 |
1.86 |
1.53 |
1.23 |
0.87 |
|
| X = 0.2 |
| Rg (Ω) |
500 |
488 |
456 |
432 |
414 |
398 |
385 |
371 |
| Rgb (Ω) |
5224 |
4295 |
3802 |
3170 |
3286 |
3287 |
2836 |
2379 |
| CPEgb (×10−8 F) |
2.85 |
2.44 |
2.87 |
2.60 |
1.55 |
1.62 |
1.20 |
0.94 |
4. Conclusions
In conclusion, this study focused on investigating the characteristics of the Ba0.67Ni0.33Mn1−xFexO3 perovskite compound with varying Fe doping levels (x = 0, 0.2) at the Mn-site. The structural and electrical aspects of the material were comprehensively examined. X-ray diffraction analysis confirmed the consistent crystal structure, maintained by the substitution of Fe3+ ions for Mn3+ ions due to their similar ionic radii. The material demonstrated a monophasic orthorhombic structure with the Imma space group, as indicated by investigations into nano crystallinity. The synthesis was carried out through a conventional solid-state sintering route, and the Williamson–Hall method was applied to estimate the size of the crystallites and peak broadening in X-ray diffraction patterns. Complex impedance spectroscopy was employed to thoroughly analyze the electrical properties of the samples at different temperatures and frequencies. Techniques, such as energy dispersive EDX and SEM, were used to assess the chemical composition, revealing distinct grains and well-defined grain boundaries. The activation energy values, extracted from the analysis, increased from 0.138 eV for x = 0 to 0.171 eV for x = 0.2, corresponding to the higher Fe content. This increase in activation energy resulted in reduced dc conductivity across the temperature range studied. The introduction of Fe doping demonstrated a proportional enhancement in dielectric permittivity and was found to influence the impedance profiles (Z′), highlighting a relaxation phenomenon in the samples. The complex impedance spectra exhibited semicircular arcs at various temperatures, which were interpreted using an explanatory circuit model (Rg + Rgb//CPEgb). This research contributes to understanding the intricate interplay between Fe doping, activation energy, and electrical conductivity in the Ba0.67Ni0.33Mn1−xFexO3 perovskite. These insights hold significance for electronic and energy-related applications. The wide range of applications for perovskite-based nanomaterials, including solar cells, light-emitting devices, transistors, sensors, and energy storage, further underscores the relevance and potential impact of this study in various environmental contexts.
Conflicts of interest
The authors declare that they have no known competing financial interests or personal relationships that could have appeared to influence the work reported in this paper.
Acknowledgements
This work was supported and funded by the Deanship of Scientific Research at Imam Mohammad Ibn Saud Islamic University (IMSIU) (grant number IMSIU-RPP2023045).
References
- J. Mizusaki, N. Mori, H. Takai, J. Mizusaki, N. Mori, H. Takai, Y. Yonemura, H. Minamiue, H. Tagawa and T. Hashimoto, Oxygen nonstoichiometry and defect equilibrium in the perovskite-type oxides La1−xSrxMnO3+d, Solid State Ionics, 2000, 129, 163–177 CrossRef CAS
 .
. - M. H. Phan and S. C. Yu, Review of the magnetocaloric effect in manganite materials, J. Magn. Magn. Mater., 2007, 308, 325–340 CrossRef CAS .
- K. I. Nassar, F. Tayari, M. Benamara, S. S. Teixeira and M. P. F. Graça, Exploring bismuth-doped polycrystalline ceramic Ba0.75Bi0.25Ni0.7Mn0.3O3: synthesis, structure, and electrical properties for advanced electronic applications, RSC Adv., 2023, 13, 24023–24030 RSC .
- X. Guan, H. Li, X. Gu, Z. Yu, S. Jin, X. Yu and X. Liu, A-site Ca/Sr co-doping to optimize room-temperature TCR of La0.7Ca0.3-xSrxMnO3 films, Ceram. Int., 2022, 48, 11094–11102 CrossRef CAS .
- K. Derbyshire and E. Korczynski, Giant magnetoresistance for tomorrow's hard drives, Solid State Technol., 1995, 38, 57–66 CAS .
- A. Lisauskas, S. I. Khartsev and A. Grishin, Tailoring the colossal magnetoresistivity: La0.7(Pb0.63Sr0.37)0.3MnO3 thin-film uncooled bolometer, Appl. Phys. Lett., 2000, 77, 756–758 CrossRef CAS .
- M. B. Salamon and M. Jaime, The physics of manganites: Structure and transport, Rev. Mod. Phys., 2001, 73, 583–628 CrossRef CAS .
- M. Hsini, N. Hamdaoui, S. Hcini, M. L. Bouazizi, S. Zemni and L. Beji, Effect of iron doping at Mn-site on complex impedance spectroscopy properties of Nd0.67Ba0.33MnO3 perovskite, Phase Transitions, 2018, 91, 316–331 CrossRef CAS .
- V. Baltz, A. Manchon, M. Tsoi, T. Moriyama, T. Ono and Y. Tserkovnyak, Antiferromagnetic spintronics, Rev. Mod. Phys., 2018, 90, 015005 CrossRef CAS .
- K. I. Nassar, N. Rammeh, S. S. Teixeira and M. P. F. Graça, Physical Properties, Complex Impedance, and Electrical Conductivity of Double Perovskite LaBa0.5Ag0.5FeMnO6, J. Electron. Mater., 2022, 51, 370–377 CrossRef .
- P. Mahajan, A. Singh, R. Datt, W. C. Tsoi, V. Gupta and S. Arya, Synthesis and characterization of NaYF4: Pr3+@ NaYF4: Eu3+ core@ shell nanoparticles as down-conversion material for organic solar cells application, Eur. Phys. J. Plus, 2024, 139(2), 183 CrossRef CAS .
- F. Tayari, K. I. Nassar, M. Benamara, M. Essid, S. S. Teixeira and M. P. F. Graça, Sol–gel synthesized (Bi0.5Ba0.5Ag)0.5(NiMn)0.5O3 perovskite ceramic: An exploration of its structural characteristics, dielectric properties and electrical conductivity, Ceram. Int., 2024, 50, 11207–11215 CrossRef CAS .
- K. I. Nassar, M. Benamara, L. Kechiche, S. S. Teixeira and M. P. F. Graça, Structural, electrical properties of bismuth and niobium-doped LaNiO3 perovskite obtained by sol–gel route for future electronic device applications, Indian J. Phys., 2024, 1–9 Search PubMed .
- S. Khadhraoui, A. Triki, S. Hcini, S. Zemni and M. Oumezzine, Structural and impedance spectroscopy properties of Pr0.6Sr0.4Mn1−xTixO3±δ perovskites, J. Alloys Compd., 2013, 574, 290–298 CrossRef CAS .
- H. Rahmouni, A. Selmi, K. Khirouni and N. Kallel, Chromium effects on the transport properties in La0.7Sr0.3Mn1−xCrxO3, J. Alloys Compd., 2012, 533, 93–96 CrossRef CAS .
- M. Nadeem, M. J. Akhtar and A. Y. Khan, Effects of low frequency near metal-insulator transition temperatures on polycrystalline La0.65Ca0.35Mn1−yFeyO3 (where y = 0.05–0.10) ceramic oxides, Solid State Commun., 2005, 134, 431–436 CrossRef CAS .
- B. Li, K. Nie, Y. Zhang, L. Yi, Y. Yuan, S. Chong and W. Huang, Engineering Single-Layer Hollow Structure of Transition Metal Dichalcogenides with High 1T-Phase Purity for Hydrogen Evolution Reaction, Adv. Mater., 2023, 35(46), 2303285 CrossRef CAS PubMed .
- Z. Liu, K. Nie, X. Qu, X. Li, B. Li, Y. Yuan and W. Huang, General bottom-up colloidal synthesis of nano-monolayer transition-metal dichalcogenides with high 1T′-phase purity, J. Am. Chem. Soc., 2022, 144(11), 4863–4873 CrossRef CAS PubMed .
- M. Benamara, J. Massoudi, H. Dahman, E. Dhahri, L. El Mir, A. Ly and D. Lahem, High response to sub-ppm level of NO2 with 50% RH of ZnO sensor obtained by an auto-combustion method, J. Mater. Sci. Mater. Electron., 2020, 31, 14249–14260 CrossRef CAS .
- M. Benamara, J. Massoudi, H. Dahman, A. Ly, E. Dhahri, M. Debliquy and D. Lahem, Study of room temperature NO2 sensing performances of ZnO1-x (x = 0, 0.05, 0.10), Appl. Phys. A, 2021, 128, 1–18 Search PubMed .
- J. Rodriguez-Carbajal, Program Full Prof. Laboratoire Léon Brillouin (CEACNRS), Version 3.5d LLB-JRS, 1998 Search PubMed .
- M. Benamara, K. Iben Nassar, P. Rivero-Antúnez, M. Essid, S. Soreto Teixeira, S. Zhao and L. Esquivias, Study of Electrical and Dielectric Behaviors of Copper-Doped Zinc Oxide Ceramic Prepared by Spark Plasma Sintering for Electronic Device Applications, Nanomaterials, 2024, 14(5), 402 CrossRef CAS PubMed .
- G. H. Jonker, Semiconducting properties of mixed crystals with perovskite structure, Physica, 1954, 20, 1118–1122 CrossRef CAS .
- Z. Wu, C. Zhang, Y. Zhu, Z. Lu, H. Liu, B. Xu and W. Tian, Visualization of macrophase separation and transformation in immiscible polymer blends, CCS Chem., 2023, 5(3), 718–728 CrossRef CAS .
- M. Benamara, K. I. Nassar, S. Soltani, A. Kallekh, R. Dhahri, H. Dahman and L. El Mir, Light-enhanced electrical behavior of a Au/Al-doped ZnO/p-Si/Al heterostructure: insights from impedance and current–voltage analysis, RSC Adv., 2023, 13(41), 28632–28641 RSC .
- R. Datt, S. Arya, S. Bishnoi, R. Gupta, V. Gupta and A. Khosla, Comparative study of PTB7: PC71BM based polymer solar cells fabricated under different working environments, Microsyst. Technol., 2022, 28(1), 269–274 CrossRef .
- M. D. Ingram, Ionic conductivity in glass, Phys. Chem. Glasses, 1987, 28, 215 CAS .
- M. Benamara, N. Zahmouli, A. Kallekh, S. Bouzidi, L. El Mir, H. R. Alamri and M. A. Valente, Study of the magnetic properties of Mg, Gd, and Co doped maghemite (γ-Fe2O3) nanoparticles prepared by sol–gel, J. Magn. Magn. Mater., 2023, 569, 170479 CrossRef CAS .
- C. Rayssi, S. El Kossi, J. Dhahri and K. Khirouni, Colossal dielectric constant and non-debye type relaxor in Ca0.85Er0.1Ti1-x Co4x/3O3 (x = 0.15 and 0.2) ceramic, J. Alloys Compd., 2018, 759, 93–99 CrossRef CAS .
- A. K. Jonscher, Universal Relaxation Law, Chelsea Dielectric Press, London, UK, 1996 Search PubMed .
- K. Funke, Jump relaxation in solid electrolytes, Prog. Solid State Chem., 1993, 22, 111–195 CrossRef CAS .
- M. Benamara, P. Rivero-Antúnez, H. Dahman, M. Essid, S. Bouzidi, M. Debliquy and L. El Mir, Selective and rapid detection of acetone using aluminum-doped zno-based sensors, J. Sol-Gel Sci. Technol., 2023, 1–15 Search PubMed .
- K. H. Ahn, X. W. Wu, K. Liu and C. L. Chien, Magnetic properties and colossal magnetoresistance of La(Ca)MnO3 materials doped with Fe, Phys. Rev. B: Condens.
Matter Mater. Phys., 1996, 54, 15299–15302 CrossRef CAS .
- S. Bhattacharya, S. Pal, R. K. Mukherjee, B. K. Chaudhuri, S. Neeleshwar, Y. Y. Chen and H. D. Yang, Development of pulsed magnetic field and study of magnetotransport properties of K-doped La1–xCax–yKyMnO3 CMR materials, J. Magn. Magn. Mater., 2004, 269, 359–371 CrossRef CAS .
- F. Tietz, I. A. Raj, M. Zahid and D. Stöver, Electrical conductivity and thermal expansion of La0.8Sr0.2(Mn, Fe, Co)O3-δ perovskites, Solid State Ionics, 2006, 177, 1753–1756 CrossRef CAS .
- H. Rahmouni, B. Cherif, M. Baazaoui and K. Khirouni, Effects of iron concentrations on the electrical properties of La0.67Ba0.33Mn1−xFexO3, J. Alloys Compd., 2013, 575, 5–9 CrossRef CAS .
- M. Nadeem, M. J. Akhtar, A. Y. Khan, R. Shaheen and M. N. Haque, Ac study of 10% Fe-doped La0.65Ca0.35MnO3 material by impedance spectroscopy, Chem. Phys. Lett., 2002, 366, 433–439 CrossRef CAS .
- A. Ahmed, S. Verma, P. Mahajan, A. K. Sundramoorthy and S. Arya, Upcycling of surgical facemasks into carbon based thin film electrode for supercapacitor technology, Sci. Rep., 2023, 13(1), 12146 CrossRef CAS PubMed .
- R. N. Bhowmik and M. C. Aswathi, Modified dielectric and ferroelectric properties in the composite of ferrimagnetic Co1.75Fe1.25O4 ferrite and ferroelectric BaTiO3 perovskite in comparison to Co1.75Fe1.25O4 ferrite, Compos. B Eng., 2019, 160, 457–470 CrossRef CAS .
- M. Benamara, A. Ly, S. Soltani, M. Essid, H. Dahman, R. Dhahri and D. Lahem, Enhanced detection of low concentration volatile organic compounds using advanced doped zinc oxide sensors, RSC Adv., 2023, 13(43), 30230–30242 RSC .
- O. Bidault, P. Goux, M. Kchikech, M. Belkaoumi and M. Maglione, Space-charge relaxation in perovskites, Phys. Rev. B: Condens. Matter Mater. Phys., 1994, 49, 7868–7873 CrossRef CAS PubMed .
- S. Sahoo, U. Dash, S. Parashar and S. M. Ali, Frequency and temperature dependent electrical characteristics of CaTiO3 nano-ceramic prepared by high-energy ball milling, J. Adv. Ceram., 2013, 2, 291–300 CrossRef CAS .
- M. Mahmoudi and M. Kavanlouei, Temperature and frequency dependence of electromagnetic properties of sintering Li–Zn ferrites with nano SiO2 additive, J. Magn. Magn. Mater., 2015, 384, 276–283 CrossRef CAS .
- S. Khadhraoui, A. Triki, S. Hcini, S. Zemni and M. Oumezzine, Variable-range-hopping conduction and dielectric relaxation in Pr0.6Sr0.4Mn0.6Ti0.4O3±δ perovskite, J. Magn. Magn. Mater., 2014, 371, 69–76 CrossRef CAS .
- M. Benamara, N. Zahmouli, S. S. Teixeira, M. P. F. Graça, L. E. Mir and M. A. Valente, Electrical and magnetic studies of maghemite (γ-Fe2O3) prepared by the sol–gel route, J. Electron. Mater., 2022, 51, 2698–2707 CrossRef CAS .
- M. Benamara, S. Bouzidi, N. Zahmouli, S. S. Teixeira, M. P. F. Graça, L. E. Mir and M. A. Valente, Electrical transport of Mg-doped maghemite (γ-Fe2O3) nanoparticles, Appl. Phys. A, 2022, 128, 624 CrossRef CAS .
- M. Idrees, M. Nadeem and M. M. Hassan, Investigation of conduction and relaxation phenomena in LaFe0.9Ni0.1O3 by impedance spectroscopy, J. Phys. D, 2010, 43, 155401–155409 CrossRef .
- A. Shukla, R. N. P. Choudhary and A. K. Thakur, Thermal, structural and complex impedance analysis of Mn4+ modified BaTiO3 electroceramic, J. Phys. Chem. Solids, 2009, 70, 1401–1407 CrossRef CAS .
- K. Hayat, S. Ali, A. ur Rahman, S. Khan, S. K. Shah and Y. Iqbal, Effect of B-site dopants on the electrical properties of BaMn1−xAxO3 ceramics
via low temperature impedance spectroscopy, Mater. Res. Express, 2018, 5, 086304 CrossRef .
- B. Padha, S. Verma, A. Ahmed, S. P. Patole and S. Arya, Plastic turned into MXene–based pyro-piezoelectric hybrid nanogenerator-driven self-powered wearable symmetric supercapacitor, Appl. Energy, 2024, 356, 122402 CrossRef CAS .
- D. Z. Johnson, A Software Program for IES Analysis; Version 2.8 Southern Pines (NC), Scribner Associates Inc.: Southern Pines, NC, USA, 2008 Search PubMed .
- D. K. Pradhan, B. Behera and P. R. Das, Studies of dielectric and electrical properties of a new type of complex tungsten bronze electroceramics, J. Mater. Sci. Mater. Electron., 2012, 23, 779–785 CrossRef CAS .
- J. Plcharski and W. Wieczorek, PEO based composite solid electrolyte containing nasicon, Solid State Ionics, 1988, 28–30, 979–982 CrossRef .
- S. A. Hashmi, K. T. Awalendra and H. M. Upadhaya, Experimental studies on polyethylene oxide–NaClO4 based composite polymer electrolytes dispersed with Na2SiO3, Eur. Polym. J., 1998, 34, 1277 CrossRef CAS .
|
| This journal is © The Royal Society of Chemistry 2024 |
Click here to see how this site uses Cookies. View our privacy policy here. 
 Open Access Article
 This Open Access Article is licensed under a Creative Commons Attribution-Non Commercial 3.0 Unported Licence
 ab,
Saja Algessairc,
Mokhtar Hjiri*c and
Majdi Benamara
ab,
Saja Algessairc,
Mokhtar Hjiri*c and
Majdi Benamara