 Open Access Article
Creative Commons Attribution 3.0 Unported Licence
Confined microemulsions: pore diameter induced change of the phase behavior†
René Haverkamp a,
Margarethe Dahl
 b,
Tim Julian Stank
 a,
Jessica Hübnerc,
Peter Strasser
 c,
Stefan Wellert
 *b and
Thomas Hellweg
 *a
*a
aDepartment of Physical and Biophysical Chemistry, University of Bielefeld, Universitätsstraße 25, Bielefeld, 33615, Germany. E-mail: thomas.hellweg@uni-bielefeld.de
bStranski-Laboratorium für Physikalische und Theoretische Chemie, Technical University of Berlin, Straße des 17. Juni 124, Berlin, 10623, Germany. E-mail: s.wellert@tu-berlin.de
cDepartment of Chemistry, Chemical Engineering Division, Technical University of Berlin, Straße des 17. Juni 124, Berlin, 10623, Germany
First published on 19th April 2024
Abstract
In the present work, the temperature-dependent phase behavior of a C10E4 based microemulsion is studied in different meso–macroporous glasses, as a function of their pore diameter. The phase behavior in these pores is investigated by small-angle X-ray scattering (SAXS). The crucial parameter we discuss based on the SAXS results is the domain size of the bicontinuous phase. Using a simplified model to fit the scattering data, we can observe the microemulsion inside the pores. These experiments reveal a temperature-dependent change in domain sizes of the bicontinuous microemulsion only for large pores.
1 Introduction
Microemulsions are thermodynamically stable mixtures of oil and water that exhibit a complex phase behavior.1–8 Their unique properties have led to applications in enhanced oil recovery (EOR),9–11 decontamination,12–14 cosmetics,15 drug delivery,16–18 nanoparticle fabrication,19 and catalysis.20 Due to the growing demand for EOR applications worldwide, there are many studies aiming at enhancing efficiency and reduce the environmental impact of microemulsion flooding.21–23 In our study, we use microemulsions based on alkyloligoethyleneglycol surfactants, because of their relative nontoxicity and low impact of the salt concentration on the phase behavior.24 These surfactants show a pronounced temperature-dependent phase behavior.25 This is why the phase behavior of these microemulsions can be studied regarding their composition and temperature.26 To reduce complexity, many studies focus on equal volume fractions of oil and water and then investigate the phase behavior as a function of temperature and surfactant concentration. This approach leads to the Kahlweit-fish cut of the phase prism. Under certain conditions, an isotropic, single-phase region, the bicontinuous phase, is obtained.26 The geometry of oil and water within this structure is bicontinuous, and the interfacial tension between the oil and water phases reaches its minimum in this temperature range.27–29 This is also why this phase is promising for cleaning, decontamination, or EOR applications.30–32 However, in these applications, understanding the bulk phase behavior can only serve as a base for understanding the actual processes in the system, because the confinement of the microemulsion by an interface must be considered. The interaction of a nonionic surfactant microemulsion with a flat surface has been studied in many works,33–36 including simulations,37 investigations under shear stress,38 and at high-pressure conditions.39 In the case of bicontinuous microemulsions, the main difference between the interface and the bulk structure is the planar geometry near an interface, which becomes sponge-like when the distance to the interface increases. Since, in many relevant applications, the surface is rough or even porous, we must also consider the influence of curved interfaces. For example, water confined in a porous solid smaller than 2 nm will not form ice.40 The binary isobutyric acid–water solution shows an extended temperature-dependent phase transition, exhibiting a lowered upper critical solution temperature when confined in a controlled pore glass.41,42 Concerning ternary microemulsions, a paper by Prause et al. shows the arrangement of microemulsion droplets in pores43 and concludes that the microemulsion droplets have a bulk-like size when the diameter of the droplets is smaller than the pore diameter and that they are elongated cylinders when the size of the microemulsion droplets is larger than the pore diameter. However, at least to our knowledge, the temperature-dependent phase behavior of a bicontinuous tetraethyleneglycol–monodecylether (C10E4) microemulsion in a hydrophilic pore system has not yet been studied. This study aims at investigating the general phase behavior of microemulsions confined in porous glasses by investigating the domain sizes over a large temperature and pore size range.2 Experimental
2.1 Materials
Water was taken from a Sartorius Arium VF pro ultrapure water system (Göttingen, Germany). Tetraethyleneglycol–monodecylether C10E4 (>95.0%) was obtained from Bachem, and n-octane (>99.0%) was obtained from Honeywell. The controlled pore glasses (CPG) used in this work were obtained from PolyOrg, Inc. The nominal pore diameters of the CPG studied were 1000 Å, 500 Å, 184 Å. To purify the CPG, they were stored in concentrated H2SO4 solution for two days and then rinsed with ultrapure water using a Soxhlet extractor. To test for remaining SO42−, the samples were washed with water, then tested for remaining SO42− anions using a BaCl2 solution. After no SO42− could be detected, the CPG was dried overnight at 80 °C.2.2 Sample preperation
To characterize ternary microemulsions, the weight fraction of the surfactant γ and the relative volume ratio of oil and water α are useful comparators, regardless of the total volume of the batch.
 | (1) |
 | (2) |
The microemulsion (ME) used was prepared and tempered at 22 °C and consisted of C10E4/water/n-octane with α = 0.5 and γ = 0.14. The complete formation of a bicontinuous phase at 20 °C was confirmed by a faint blue translucent sample that showed birefringence only under shear when observed under a microscope with crossed polarizers. For the subsequent SAXS experiments, 1 mm quartz capillaries from WJM-Glas Müller GmbH are used as sample cells. They were filled with the microemulsion, and the CPG was slowly added until a 5 mm supernatant of the microemulsion was left. Throughout the process, the turbidity of the microemulsion did not increase, indicating a stable microemulsion after adding the porous solid. The prepared quartz capillary was sealed and transferred to a temperature-controlled SAXS sample holder to perform SAXS measurements.
3 Methods
3.1 Porosimetry
To obtain the pore diameter ØHg,BET of the CPGs (Table 1), Hg- and N2-porosimetry were performed. The Hg-intrusion measurements were performed for CPG1000 and CPG500 by the Bundesanstalt für Materialforschung und -prüfung. For CPG184, N2-physisorption isotherms were obtained at 77 K using an Autosorb-1 (QUANTACHROME). To minimize the dead volume, the used glass tubes were also filled with a glass rod and glass wool. The samples were degassed under vacuum at 90 °C for at least 24 h to remove any water and gas adsorbates. Brunauer–Emmett–Teller (BET) method in a pressure range of p/p0 = 0.04 to 0.2 was applied to calculate the overall surface area using a multipoint fit. The Barrett–Joyner–Halenda (BJH) method was applied to calculate the pore size distribution. A detailed description of these methods can be found in the literature.44| CPG/Å | d/Å | ξ/Å | B | Porosity/% | ØSAXS/Å | ØHg,BET/Å |
|---|---|---|---|---|---|---|
| 1000 | 1353 | 507 | 2.325 × 10⁶ | 77 | 1038 | 1116 |
| 500 | 625 | 313 | 5.550 × 10⁵ | 72 | 445 | 491 |
| 184 | 381 | 79 | 8.581 × 10³ | 66 | 251 | 157 |
3.2 Small-angle X-ray scattering (SAXS)
Small-angle X-ray scattering is a well-established method to obtain information about the structure of microemulsions. Hence, using SAXS to obtain information about the microemulsion inside the pores seems straightforward. SAXS measurements were performed using an in-house SAXS/WAXS system (XEUSS, Xenocs, Sassenage, France). Radial integration of the 2D detector image recorded by a Pilatus 300K hybrid pixel detector (Dectris, Baden Deattwil, Switzerland) was performed using the Foxtrot software.45 To obtain the intensity of the scattered beam on an absolute scale, background correction and normalization with glassy carbon type 2 (ref. 46) were performed. In small-angle X-ray scattering, the intensity of a diffracted X-ray beam is determined as a function of the scattering vector q. The scattering vector, which depends on the scattering angle θ and the wavelength of light λ, is given as follows:
 | (3) |
The scattering signal from controlled porous glasses can be modeled in several ways.47,48 In general, CPGs also have a bicontinuous, sponge-like structure.49
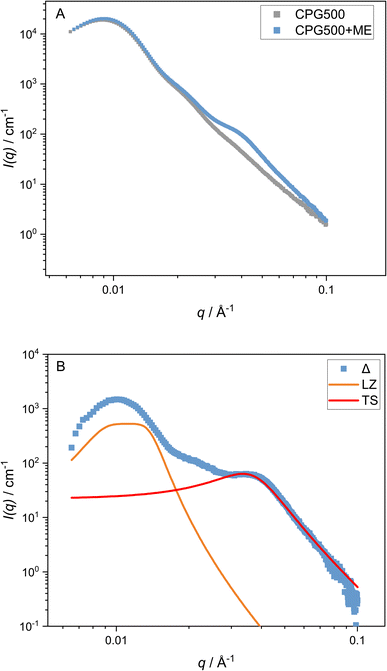
Despite the scattering of the porous matrix, two distinct scattering contributions can be observed when the microemulsion is inside the pores. One is at q values smaller than the signal of the CPG, and one is at higher q values than the signal of the CPG. It has been shown that the scattering contribution from randomly distributed binary fluid domains leads to a quadratic Lorentzian scattering behavior.50,51 Hence, to model the scattering contribution of these regions at small q values, the quadratic Lorentzian term in eqn (4) is used. The Lorentzian we use has A as the scaling factor, ξL as the Lorentzian correlation length, and n as the Lorentzian exponent. The parameter q0 is the peak position of the Lorentzian.
 | (4) |
The relation dLz = 2π/q0 can be used to find the average center-to-center distance of microphase-separated structures, while the Lorentzian screening length is obtained from the size of the structures. The Lorentzian exponent is set to n = 4.
The Teubner–Strey model provides a simple model that describes the scattering of the bicontinuous phase around the maximum qmax of the correlation peak.52 High q values can be fitted if the diffuse surfactant layer is considered.53 The scattering intensity of the Teubner–Strey model ITS(q) scales with the factor B in which the volume fraction of a phase, the scattering contrast, and the correlation length ξ are considered. However, because these parameters cannot be accurately determined inside the porous solid, B is used only as a scaling factor.
 | (5) |
The parameters a2, c1, and c2 yield the periodicity of the oil and water domains, i.e. the domain size d,
 | (6) |
 | (7) |
The parameters a2, c1, and c2 are defined by d and ξ using the following relations.
 | (8) |
To model the complete signal of the microemulsion inside the CPG matrix, we use a linear combination of the signal from the CPG matrix, the Teubner–Strey model to account for the microemulsion signal, and a Lorentzian for possible phase-separated regions for data analysis. Note that the scattering contribution of the matrix is scaled by a factor C to account for different contrasts of the CPG matrix in the presence of the microemulsion. In total, this approach leads us to seven variable parameters (A, B, C, d, ξ, q0, ξL), three of which are amplitude parameters (A, B, C).
| I(q) = C × I(q)CPG + I(q)L + I(q)TS | (9) |
4 Results and discussion
4.1 Bulk microemulsion
Firstly, the bulk behavior of the microemulsion is examined as a reference. A temperature-dependent measurement of the bulk microemulsion at 20 °C with SAXS revealed a broad correlation peak at qmax = 0.031 Å−1 typical of a bicontinuous microemulsion, which can be described by the Teubner–Strey model (eqn (5), Fig. 1). The determined mean domain size d = 191 Å and a correlation length of ξ = 97 Å. Under the assumption that the oil and the water phases are isometric, we get a mean domain size of 95.5 Å for the oil and water domains.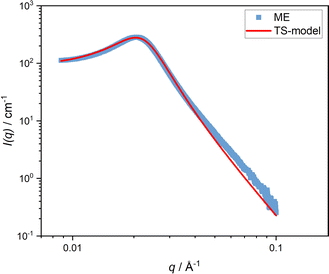 | ||
| Fig. 1 SAXS curves of a ternary C10E4/water/n-octane microemulsion at 20 °C. The fit to the Teubner–Strey model (eqn (5)) is shown as a red line. | ||
4.2 Controlled pore glasses
We performed SEM measurements on all investigated CPGs to get a general impression of the real space structure. For the large structures of CPG1000, the bicontinuous character can be seen and is displayed in the ESI.† The Hg- and N2-porosimetry normalized pore size distribution of the CPGs is shown in Fig. 2A. We observed a broad pore size distribution for the ØBET(CPG184) = 8 nm to 60 nm and a narrow distribution for ØHg(CPG500) = 37 nm to 59 nm and ØHg(CPG1000) = 82 nm to 143 nm. The measured mean pore diameters ØHg,BET are close to the nominal pore diameters given by the supplier (Table 1).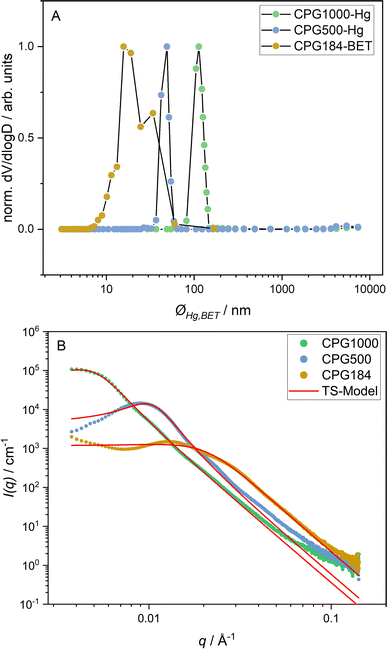 | ||
| Fig. 2 Porosimetry data in (A) and SAXS curves in (B) of CPG-1000, -500, and -184. The fit according to the Teubner–Strey model (eqn (5)) is shown as a red line (B). | ||
The SAXS curves of the CPGs used in this work are shown in Fig. 2B. For the CPG500 and the CPG184, a broad scattering peak at qmax = 0.009 Å−1 and qmax = 0.013 Å−1 is observable. For the CPG1000, only about half of the main correlation peak is detected at qmax = 0.0045 Å−1. Additionally, a shoulder is present at q > qmax. In this q range, the decay of the scattering signals follows a q−3.8 power law typical of a fractally rough pore surface, attributed in the literature to chemisorbed water clusters.54 At q < qmax, an increased scattering intensity is observed for CPG184. Using USANS, Kim et al. demonstrated that mesopores could not be the reason for this increase, as the signal persists when the signal from the main correlation peak is matched out.55 A possible explanation for this signal is an incomplete leaching process during the CPG production, resulting in an inhomogeneous scattering length density of the solid phase.
A bimodal pore size distribution could be responsible for the shoulder at higher q values. Also, a fractal structure scattering56 and a long-range structure correlation leading to a second structure factor peak55 have been discussed earlier. For bicontinuous structures, multiple scattering effects can also lead to a shoulder in this region.57
The analysis of the scattering signal of CPG is not trivial, and there is not yet a complete model describing all its properties. Several ways of modeling the scattering curves of CPGs are presented in the literature.47,48 Since the structure of CPG is known to be bicontinuous, the Teubner–Strey model (eqn (5)) is chosen to fit the data to obtain information about the mean domain sizes of the CPG. However, there are deviations from the Teubner–Strey-like scattering, such as the pronounced shoulder at q > qmax.
The results of the Teubner–Strey fit are shown as a red line in Fig. 2B. Table 1 lists the resulting fitting parameters. For the CPG1000 and CPG500, we observe a good fit to the scattering data in the peak region. However, the model fails partly to describe the scattering curve of CPG184. Indicating a bimodal pore size distribution, as seen in the porosimetry results in Fig. 2A.
4.3 Imbibed microemulsion
By comparison of the scattering signal of the matrix (Fig. 2) and the signal of the microemulsion imbibed in CPG (Fig. 3), a pronounced shoulder at q > qmax can be observed. After subtracting the matrix signal scaled by a factor, which is necessary because the contrast of the matrix changes after the pores are filled with the microemulsion, we can also observe another contribution at low q < qmax. To fit both features, a combination of the matrix scattering signal, the Teubner–Strey model, and a Lorentzian peak for the contribution at q < qmax are employed as described in eqn (9). This simplification of the scattering signal can describe the signal of the microemulsion inside the CPG well enough to model the shoulder contribution of the microemulsion at high q-values. However, the model does not describe the contribution at lower q values, discussed in Section 3.2.4.4 Temperature dependent behavior
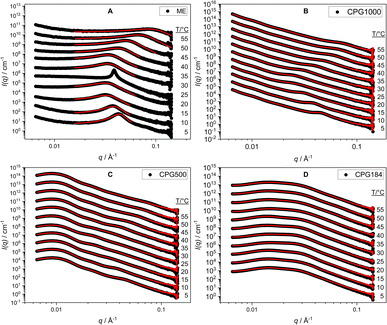 | ||
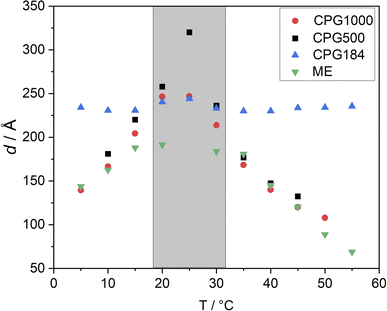
| Fig. 4 SAXS curves for the ME as bulk (A) and in CPG-1000 (B), -500 (C), and -184 (D) at temperatures from 5 °C to 55 °C. The fits according to eqn (9) are shown in red. | ||
5 Conclusion
No macroscopic phase separation was observable in sample cells at any measured temperature in the range of 5 °C to 55 °C. This indicates that the two-phase region of the microemulsion, if present, is formed at the scale of the pore network. In regards to the domain size of the microemulsion, we have shown that the temperature-dependent phase behavior of the C10E4/water/n-octane microemulsion in a CPG resembles the bulk phase of the microemulsion for samples with large pore diameters. This hints at a low interaction of the CPG surface with the microemulsion. These results are desirable for applications such as decontamination and enhanced oil recovery. Low surfactant interaction with the pore surface is necessary to remove substances from the pores without losing the surfactant. These findings can potentially help address one of the main challenges of using microemulsions in EOR. Up-to-date approaches lead to high surfactant losses or include further manufacturing steps, like adding alcohols or inducing a salinity gradient, increasing the environmental impact.59–62The water/oil interface does seem to alter the microemulsion domain size in small pores. This would be remarkable because it happens even if the domain sizes in the larger CPG pores and the bulk microemulsion would be much smaller than the pore diameter of the CPG184 with dME = 120 Å and pore diameter ØBET = 251 Å (Fig. 5) respectively. However, as the SAXS signal of the microemulsion and the SAXS signal of CPG184 overlap, this can also be an artifact. Further insights into the actual geometry inside the CPG remain unclear and require other methods to be used in future research on this system. Self-diffusion NMR, small-angle neutron scattering contrast variation,43 and neutron spin-echo experiments are our following research goals, as they have led to insights into binary fluids inside porous CPG.
Conflicts of interest
The authors declare no conflict of interest.Acknowledgements
The authors thank the German Research Foundation for funding (DFG, project number: 455432427), Annett Zimathies from: “Bundesanstalt für Materialforschung und prüfung (BAM)” for the Hg-intrusion measurements, and Karsten Rott from the University of Bielefeld for the SEM measurement of CPG1000. We acknowledge support for the publication costs by the Open Access Publication Fund of Bielefeld University and the Deutsche Forschungsgemeinschaft (DFG).References
- M. Kahlweit, R. Strey, D. Haase, H. Kunieda, T. Schmeling, B. Faulhaber, M. Borkovec, H.-F. Eicke, G. Busse, F. Eggers, T. Funck, H. Richmann, L. Magid, O. Söderman, P. Stilbs, J. Winkler, A. Dittrich and W. Jahn, J. Colloid Interface Sci., 1987, 118, 436–453 CrossRef CAS.
- R. Strey, Colloid Polym. Sci., 1994, 272, 1005–1019 CrossRef CAS.
- Microemulsions: Background, New Concepts, Applications, Perspectives, Wiley, Chichester, West Sussex, 1st edn, 2009 Search PubMed.
- M. Fanun, Microemulsions, CRC Press, 2008 Search PubMed.
- T. Hellweg, Curr. Opin. Colloid Interface Sci., 2002, 7, 50–56 CrossRef CAS.
- C. Jolivalt, N. Minier and N. Renon, Fluid Phase Equilib., 1989, 53, 483–489 CrossRef CAS.
- D. Langevin, Annu. Rev. Phys. Chem., 1992, 43, 341–369 CrossRef CAS.
- M. Lu, B. Lindman and K. Holmberg, Phys. Chem. Chem. Phys., 2024, 26, 3699–3710 RSC.
- Handbook of Microemulsion Science and Technology, ed. P. Kumar and K. L. Mittal, Taylor and Francis, London, 1st edn, 2017 Search PubMed.
- A. Mandal and K. Ojha, Enhanced Oil Recovery, CRC Press, Boca Raton, 2023 Search PubMed.
- V. C. Santanna, F. Curbelo, T. N. Castro Dantas, A. A. Dantas Neto, H. S. Albuquerque and A. Garnica, J. Pet. Sci. Eng., 2009, 66, 117–120 CrossRef CAS.
- S. Wellert, M. Karg, H. Imhof, A. Steppin, H.-J. Altmann, M. Dolle, A. Richardt, B. Tiersch, J. Koetz, A. Lapp and T. Hellweg, J. Colloid Interface Sci., 2008, 325, 250–258 CrossRef CAS PubMed.
- S. Wellert, H. Imhof, M. Dolle, H.-J. Altmann, A. Richardt and T. Hellweg, Colloid Polym. Sci., 2008, 286, 417–426 CrossRef CAS.
- Decontamination of Warfare Agents: Enzymatic Methods for the Removal of B/C Weapons, ed. A. Richardt, Wiley-VCH, Weinheim, 1st edn, 2008 Search PubMed.
- P. Boonme, J. Cosmet. Dermatol., 2007, 6, 223–228 CrossRef PubMed.
- F. Luo, T. Zhong, Y. Chen, Q. Guo, L. Tao, X. Shen, Y. Fan and X. Wu, Pharmaceutics, 2023, 15(7), 2014 CrossRef CAS PubMed.
- T. Shukla, N. Upmanyu, M. Agrawal, S. Saraf, S. Saraf and A. Alexander, Biomed. Pharmacother., 2018, 108, 1477–1494 CrossRef CAS PubMed.
- A. K. Sharma, T. Garg, A. K. Goyal and G. Rath, Artif. Cells, Nanomed., Biotechnol., 2016, 44, 1177–1185 CAS.
- L. Ström, H. Ström, P.-A. Carlsson, M. Skoglundh and H. Härelind, Langmuir, 2018, 34, 9754–9761 CrossRef PubMed.
- M. Schwarze, T. Pogrzeba, I. Volovych and R. Schomäcker, Catal. Sci. Technol., 2015, 5, 24–33 RSC.
- A. Kumar, R. K. Saw and A. Mandal, Chem. Eng. Res. Des., 2019, 147, 399–411 CrossRef CAS.
- A. Kaushik, D. Joshi, R. Kumar Saw, K. Bala Rathi, S. Mitra and A. Mandal, Fuel, 2024, 359, 130500 CrossRef CAS.
- R. K. Saw, P. M. Rane, D. Joshi, S. Prakash, L. Jangid and A. Mandal, J. Mol. Liq., 2023, 392, 123452 CrossRef CAS.
- R. K. Saw, D. Sinojiya, P. Pillai, S. Prakash and A. Mandal, ACS Omega, 2023, 8, 12445–12455 CrossRef CAS PubMed.
- J. F. Ontiveros, C. Pierlot, M. Catté, V. Molinier, J.-L. Salager and J.-M. Aubry, Colloids Surf., A, 2014, 458, 32–39 CrossRef CAS.
- C. Stubenrauch, Microemulsions, John Wiley & Sons, Ltd, Chichester, UK, 2009 Search PubMed.
- D. Langevin, Annu. Rev. Phys. Chem., 1992, 341–369 CrossRef CAS.
- R. Strey, Curr. Opin. Colloid Interface Sci., 1996, 1(3), 402–410 CrossRef CAS.
- T. Sottmann and R. Strey, J. Chem. Phys., 1997, 106, 8606–8615 CrossRef CAS.
- T. Zhu, W. Kang, H. Yang, Z. Li, B. Zhou, Y. He, J. Wang, S. Aidarova and B. Sarsenbekuly, Adv. Colloid Interface Sci., 2022, 299, 102527 CrossRef CAS PubMed.
- J.-L. Salager, A. M. Forgiarini and J. Bullón, J. Surfactants Deterg., 2013, 16, 449–472 CrossRef CAS.
- J.-L. Salager, A. M. Forgiarini, L. Márquez, L. Manchego and J. Bullón, J. Surfactants Deterg., 2013, 16, 631–663 CrossRef CAS PubMed.
- X. L. Zhou, L. T. Lee, S. H. Chen and R. Strey, Phys. Rev. A: At., Mol., Opt. Phys., 1992, 46, 6479–6489 CrossRef CAS PubMed.
- H. Frielinghaus, M. Kerscher, O. Holderer, M. Monkenbusch and D. Richter, Phys. Rev. E: Stat., Nonlinear, Soft Matter Phys., 2012, 85, 041408 CrossRef CAS PubMed.
- S. Vargas-Ruiz, O. Soltwedel, S. Micciulla, R. Sreij, A. Feoktystov, R. von Klitzing, T. Hellweg and S. Wellert, Langmuir, 2016, 32, 11928–11938 CrossRef CAS PubMed.
- O. Holderer, F. Lipfert, H. Frielinghaus, M. Ohl and D. Richter, EPJ Web Conf., 2015, 83, 02006 CrossRef.
- M. Kerscher, P. Busch, S. Mattauch, H. Frielinghaus, D. Richter, M. Belushkin and G. Gompper, Phys. Rev. E: Stat., Nonlinear, Soft Matter Phys., 2011, 83, 030401 CrossRef CAS PubMed.
- F. Lipfert, M. Kerscher, S. Mattauch and H. Frielinghaus, J. Colloid Interface Sci., 2019, 534, 31–36 CrossRef CAS PubMed.
- M. Berghaus, M. Paulus, P. Salmen, S. Al-Ayoubi, M. Tolan and R. Winter, J. Phys. Chem. B, 2016, 120, 7148–7153 CrossRef CAS PubMed.
- V. Soprunyuk, M. Reinecker and W. Schranz, Phase Transitions, 2016, 89, 695–707 CrossRef CAS.
- S. Schemmel, D. Akcakayiran, G. Rother, A. Brulet, B. Farago, T. Hellweg and G. H. Findenegg, MRS Online Proceedings Library, 2003, vol. 790, p. 72, DOI:10.1557/PROC-790-P7.2.
- T. Hellweg, S. Schemmel, G. Rother, A. Brûlet, H. Eckerlebe and G. H. Findenegg, Eur. Phys. J. E: Soft Matter Biol. Phys., 2003, 12(suppl. 1), S1–S4 CAS.
- A. Prause, A. Hörmann, V. Cristiglio, G. J. Smales, A. F. Thünemann, M. Gradzielski and G. H. Findenegg, Mol. Phys., 2021, 119, e1913255 CrossRef.
- O. Šolcová, L. Matějová and P. Schneider, Appl. Catal., A, 2006, 313, 167–176 CrossRef.
- Foxtrot 3.3.4, 2016 Search PubMed.
- F. Zhang, J. Ilavsky, G. G. Long, J. P. G. Quintana, A. J. Allen and P. R. Jemian, Metall. Mater. Trans. A, 2010, 41, 1151–1158 CrossRef.
- P. Wiltzius, F. S. Bates, S. B. Dierker and G. D. Wignall, Phys. Rev. A, 1987, 36, 2991–2994 CrossRef CAS.
- B. Smarsly, C. Göltner, M. Antonietti, W. Ruland and E. Hoinkis, J. Phys. Chem. B, 2001, 105, 831–840 CrossRef CAS.
- D. Enke, F. Janowski and W. Schwieger, Microporous Mesoporous Mater., 2003, 60, 19–30 CrossRef CAS.
- S. B. Dierker and P. Wiltzius, Phys. Rev. Lett., 1991, 66, 1185–1188 CrossRef CAS PubMed.
- M. Y. Lin, S. K. Sinha, J. M. Drake, X. Wu, P. Thiyagarajan and H. B. Stanley, Phys. Rev. Lett., 1994, 72, 2207–2210 CrossRef CAS PubMed.
- M. Teubner and R. Strey, J. Chem. Phys., 1987, 87, 3195–3200 CrossRef CAS.
- G. Beaucage, J. Appl. Crystallogr., 1996, 29, 134–146 CrossRef CAS.
- A. C. Mitropoulos, J. M. Haynes, R. M. Richardson and N. K. Kanellopoulos, Phys. Rev. B: Condens. Matter Mater. Phys., 1995, 52, 10035–10042 CrossRef CAS PubMed.
- M.-H. Kim and C. J. Glinka, Microporous Mesoporous Mater., 2006, 91, 305–311 CrossRef CAS.
- A. Höhr, H. B. Neumann, P. W. Schmidt, P. Pfeifer and D. Avnir, Phys. Rev. B: Condens. Matter Mater. Phys., 1988, 38, 1462–1467 CrossRef PubMed.
- K. Schneider, P. Verkoyen, M. Krappel, C. Gardiner, R. Schweins, H. Frey and T. Sottmann, Langmuir, 2020, 36, 9849–9866 CrossRef CAS PubMed.
- A. Pizzino, V. Molinier, M. Catté, J.-L. Salager and J.-M. Aubry, J. Phys. Chem. B, 2009, 113, 16142–16150 CrossRef CAS PubMed.
- C. J. Glover, M. C. Puerto, J. M. Maerker and E. L. Sandvik, Soc. Pet. Eng. J., 1979, 19, 183–193 CrossRef CAS.
- M. Tagavifar, S. Herath, U. P. Weerasooriya, K. Sepehrnoori and G. Pope, SPE J., 2018, 23, 66–83 CrossRef CAS.
- M. Tagavifar, S. H. Jang, L. Chang, K. Mohanty and G. Pope, Fuel, 2018, 211, 214–222 CrossRef CAS.
- G. J. Hirasaki, H. R. van Domselaar and R. C. Nelson, Soc. Pet. Eng. J., 1983, 23, 486–500 CrossRef CAS.
Footnote |
| † Electronic supplementary information (ESI) available. See DOI: https://doi.org/10.1039/d4ra01283f |
| This journal is © The Royal Society of Chemistry 2024 |

