DOI:
10.1039/D4RA01240B
(Paper)
RSC Adv., 2024,
14, 9985-9995
Dual mechanisms in hydrogen reduction of copper oxide: surface reaction and subsurface oxygen atom transfer
Received
18th February 2024
, Accepted 18th March 2024
First published on 26th March 2024
Abstract
The study of the reduction of copper oxide (CuO) by hydrogen (H2) is helpful in elucidating the reduction mechanism of oxygen carriers. In this study, the reduction mechanism of CuO by H2 and the process of oxygen atom transfer were investigated through the density functional theory (DFT) method and thermodynamic calculation. DFT calculation results showed that during the reaction between H2 and the surface of CuO, Cu underwent a Cu2+ → Cu1+ → Cu0 transformation, the Cu–O bond (−IpCOHP = 2.41) of the Cu2O phase was more stable than that (−IpCOHP = 1.94) of the CuO phase, and the reduction of Cu2O by H2 was more difficult than the reduction of CuO. As the surface oxygen vacancy concentration increased, it was more likely that the subsurface O atoms transfer to the surface at zero H2 coverage (no H2 molecule on the surface), allowing the surface to maintain a stable Cu2O phase. However, when the H2 coverage was 0.25 monolayer (ML) (one H2 molecule every four surface Cu atoms), the presence of H atoms on the surface made the upward transfer of O atoms from the subsurface more difficult. The rate of consuming surface O atoms in the reduction reaction was greater than the rate of subsurface O atom transfer induced by the reduction reaction and the surface Cu2O phase could not be maintained stably. Through thermodynamic analysis, at high H2 concentration, the reaction between H2 and CuO was more likely to generate Cu, while at low H2 concentration, it was more likely to generate Cu2O. In summary, the valence state of Cu in the reaction process between CuO and H2 depended on the concentration of H2.
1 Introduction
Chemical looping combustion (CLC) has been shown to be a promising combustion technology for power production with integrated CO2 capture.1–3 In CLC, a metal oxide that acts as an oxygen carrier is alternately reduced by a fuel (syngas or natural gas) in a fuel reactor and oxidized by air in an air reactor. CuO is a good oxygen carrier for chemical looping combustion.4–6 CuO undergoes a reduction process in the fuel reactor. Numerous studies have been carried out on CuO. However, the reduction mechanism of CuO, especially the influence of reducing gas concentration, is currently unclear. Hydrogen (H2) is the most common reducing gas. There were many studies on the reduction of CuO by H2. The reaction of H2 with CuO was experimentally studied using in situ X-ray diffraction by Kim et al.7 Samples were loaded in an open sapphire capillary having an inner diameter of 0.5 mm. An inlet gas was a 5% H2 and 95% He gas mixture. The results showed that under high H2 flow rate (≈15 cm3 min−1), CuO can be directly reduced to metallic Cu (Cu2+ → Cu0). During the reduction process, no evidence of any intermediate state (Cu+) was found. Cu2O appeared as an intermediate phase only at very low H2 flow rates (<1 cm3 min−1); this result has been supported by multiple studies.8–11
Maimaiti et al.12 investigated the process of H2 reduction on the surface of CuO using the density functional theory (DFT) method and concluded that Cu+ appeared during the reaction. This could not explain the experimentally observed phenomenon that Cu2+ is directly converted into the Cu0 phase under high H2 concentration. This may be due to the fact that, in addition to the reaction between H2 and the CuO surface, other reaction processes are involved in the reduction reaction. Using the DFT method, Jabraoui et al.13 found that oxygen vacancies play an important role in the decomposition of CuO to release O2. Oxygen vacancies on the surface can promote the transfer of internal O to the surface. Yang et al.14 found that rearrangements occurred on the CuO surface as the concentration of surface oxygen vacancies increased. Transition in the surface structure caused by the reaction between H2 and CuO may in turn affect the reaction between H2 and CuO.
In this study, the DFT method was adapted to study the reaction between H2 and the CuO surface initially. Subsequently, subsurface O atom transfer was studied with different H2 coverages (0 ML, 0.25 ML) by DFT. DFT provided a precise approach15,16 to the theoretical problem of electronic structure. Both the climbing image nudged elastic band (CI-NEB)17 and dimer18 methods were applied to find the transition states. The transition state structure of chemical reactions could help us better understand the kinetic properties of chemical reactions. Thermodynamic calculations were applied to the reactions occurring in the H2 reduction of CuO process.
2 Methodology and model
2.1 Computational methodology
All DFT calculations were performed using the software Vienna ab initio simulation package (VASP).19,20 The projector augmented wave (PAW) method was chosen for the calculations to handle the effect of the core electrons on the valence electrons.21 The Perdew–Burke–Ernzerhof (PBE) exchange function under the generalized gradient approximation (GGA) was selected.22 The Monkhorst–Pack method was used to sample the Brillouin zone,23 and k-point grids with sizes of 8 × 8 × 8 and 4 × 4 × 1 were used for CuO unit cells and CuO slab calculations, respectively. The plane wave cutoff energy was 400 eV. Because the conventional DFT functionals cannot accurately describe the strong correlation effect between the Cu 3d orbital electrons in CuO,24 the GGA+U method25 was used in order to accurately describe the strongly correlated, highly localized 3d electrons in CuO. To describe the Cu atom, U = 7 eV and J = 0.98 eV were used.26 The electron energy was relaxed to an accuracy of 10−6 eV, and the atomic positions were optimized until the Hellmann–Feynman force was less than 0.02 eV Å−1. Projected crystal orbital Hamilton population (pCOHP) calculations were conducted using the LOBSTER code.27 The structures were visualized by VESTA software.28 Thermodynamic calculations were conducted using the HSC Chemistry 6.0 software. For H2 adsorption on the CuO surface, the energy of gas adsorption is| | |
Eads = E(H2-surface) − E(surface) − E(H2)
| (1) |
where Eads is the gas adsorption energy, E(H2-surface) is the total energy of the system after H2 is adsorbed to the CuO surface, E(surface) is the total energy of the CuO surface, and E(H2) is the total energy of H2. The activation energy of the reaction is expressed aswhere ETS is the energy of the transition state and EIS is the energy of the initial state. The heat of reaction iswhere EFS is energy of the final state. Microscopically, gas concentration can be reflected by the adsorption surface gas coverage (θ).29 The formula for adsorption gas coverage is as follows:where Ng is the number of adsorbed gas molecules, and NM is the number of surface metal atoms. The unit for θ is monolayer (ML).
2.2 Structural properties
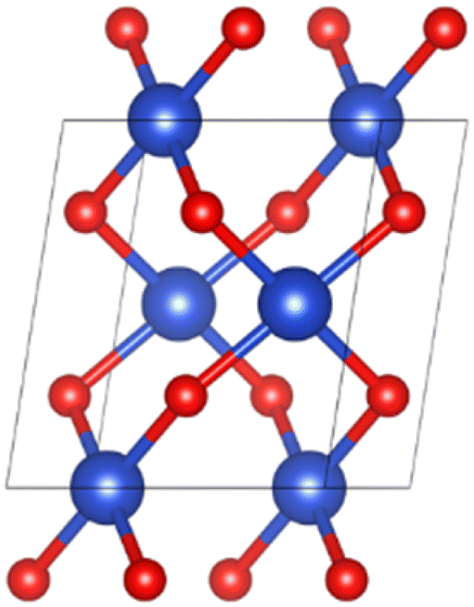
The spatial structure of CuO crystal belonged to the C2/c group.30 Fig. 1 illustrates the unit cell structure of CuO. The CuO unit cell parameters were calculated as a = 4.63 Å, b = 3.43 Å, c = 5.09 Å, β = 99.43°, and the Cu–O bond length was 1.95 Å, which was well aligned with experimental data,30 proving that the chosen parameter settings were appropriate.
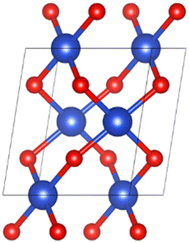 |
| | Fig. 1 Unit cell structure of CuO. | |
Experiments and calculations have both demonstrated that CuO (111) is the most stable surface of copper oxide and the surface most easily observed in experiments.31,32 Therefore, the CuO surface model used in this study was CuO (111), as shown in Fig. 2. The CuO (111) surface used for hydrogen reduction and surface structure calculation was a (2 × 1) supercell that retains four layers of atoms. The thickness of the vacuum layer was 15 Å. The lower two of these layers were fixed, and the upper two were relaxed. Inside the unit cell, there were a total of four oxygen atoms on the surface of CuO (111), which were divided into two categories according to the coordination number. The oxygen atoms with a coordination number of three were labeled O13 and O23, and those with a coordination number of four were labeled O14 and O24. There were four Cu atoms on the surface in total, namely, the three-coordinated Cu13 and Cu23 and the four-coordinated Cu14 and Cu24.
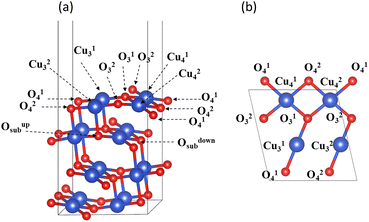 |
| | Fig. 2 CuO (111) surface unit cell: (a) front view (b) top view. | |
3 Results and discussion
3.1 Study of the complete reaction paths of hydrogen on copper oxide surface
On the surface of intact copper oxide, two H2 adsorption sites were considered: the top sites of the three-coordinated Cu and four-coordinated Cu atoms. On the intact CuO surface, the adsorption energy Eads of H2 on Cu13 was −2.30 kJ mol−1, and Eads of H2 on Cu14 was −2.01 kJ mol−1. H2 adsorption on the intact surface of CuO released very little heat, indicating that no chemisorption occurred. However, H2 adsorption on the three-coordinated Cu13 still released more energy, and it could be assumed that H2 was initially adsorbed on the three-coordinated Cu13.
Next, the type of O that H2 reacts with first on the surface was considered. The reaction heat ΔE between H2 and O13 was −182.50 kJ mol−1 and that between H2 and O14 was −93.31 kJ mol−1.
H2 was more likely to combine with the three-coordinated O atoms on the surface of CuO to form H2O, so H2 would react with the three-coordinated O on the surface of CuO first, and then with the four-coordinated O afterward. This has also been confirmed by calculations by Maimaiti et al.12
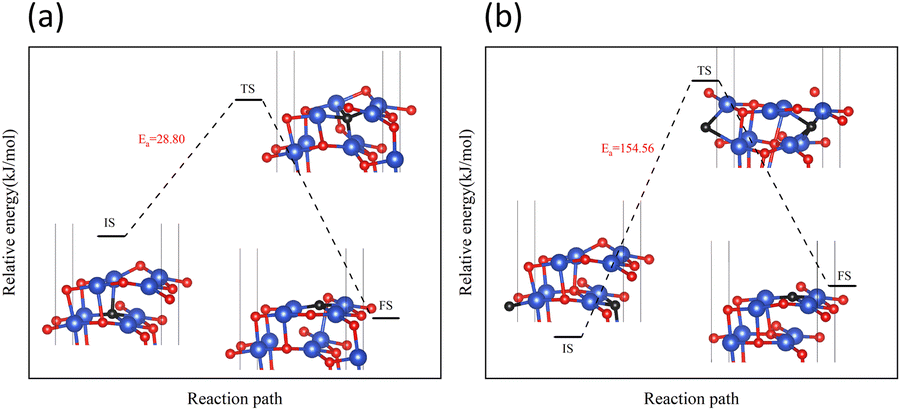
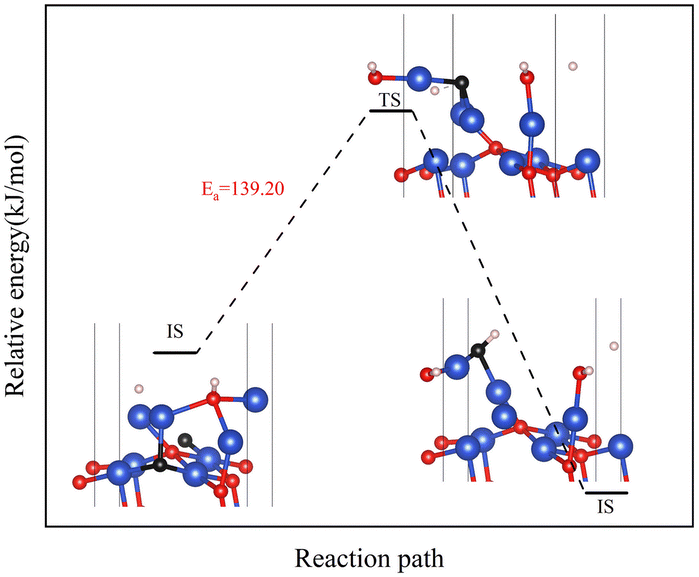
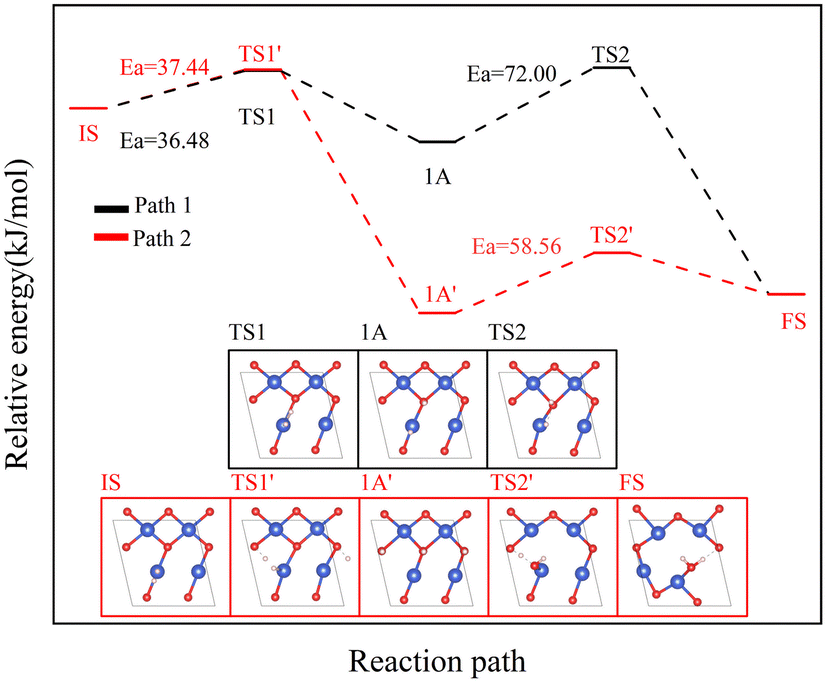
The reaction of H2 with the CuO surface is divided into two parts. First, the dissociation of H2, and then the formation of H2O from the two dissociated H atoms and a surface O atom. H2 dissociates in two ways on the surface of metal oxides:33–36 the first is the dissociation of H2 to form H− and H+, which are adsorbed on the metal and oxygen sites, respectively, producing M–H and O–H groups (path 1); the other is the dissociation of H2 to produce two H atoms, which combine with two O atoms to form two O–H groups (path 2). Both H2 dissociation pathways are possible during the H2 reduction of CuO. The two reaction paths of H2 with CuO are shown in Fig. 3. The energy changes in the process for the two different reactions paths are shown in Fig. 4. In path 1, from 1A to FS was the rate-determining step. In path 2, from 1A′ to FS was the rate-determining step. In path 2, the rate-determining step was an endothermic reaction, which increased the difficulty of the reaction. Xa was used to measure the similarity between the initial and final states, i.e., the root sum squared of the distance between the initial and final states of the corresponding atoms. The smaller Xa was, the smaller the distance of the atom movement before and after the reaction was. In path 1, the Xa between 1A and IS was 2.45, and the Xa between FS and 1A was 3.68. In path 2, the Xa between 1A′ and IS was 3.89, and the Xa between FS and 1A′ was 4.09. From the perspective of H atom diffusion, in path 2, H atoms required more diffusion movement, which increased the difficulty of the reaction in path 2. Hence, the H2 dissociation approach chosen in this study is path 1.
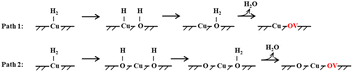 |
| | Fig. 3 Two H2 dissociation modes and CuO reaction paths. | |
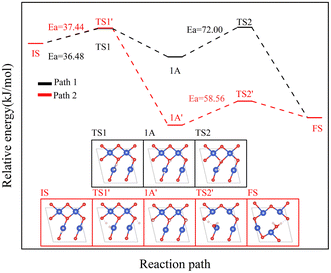 |
| | Fig. 4 The two reaction paths of H2 with CuO (the white atom is the H atom). | |
Next, the full-path process of H2 reduction in the surface reaction of CuO was studied by DFT method.
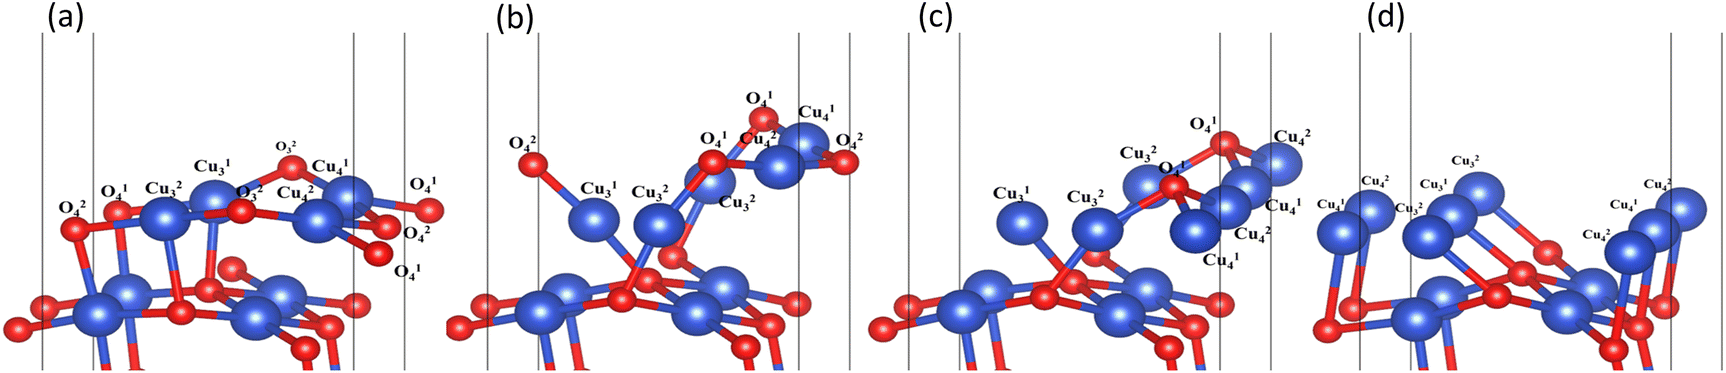
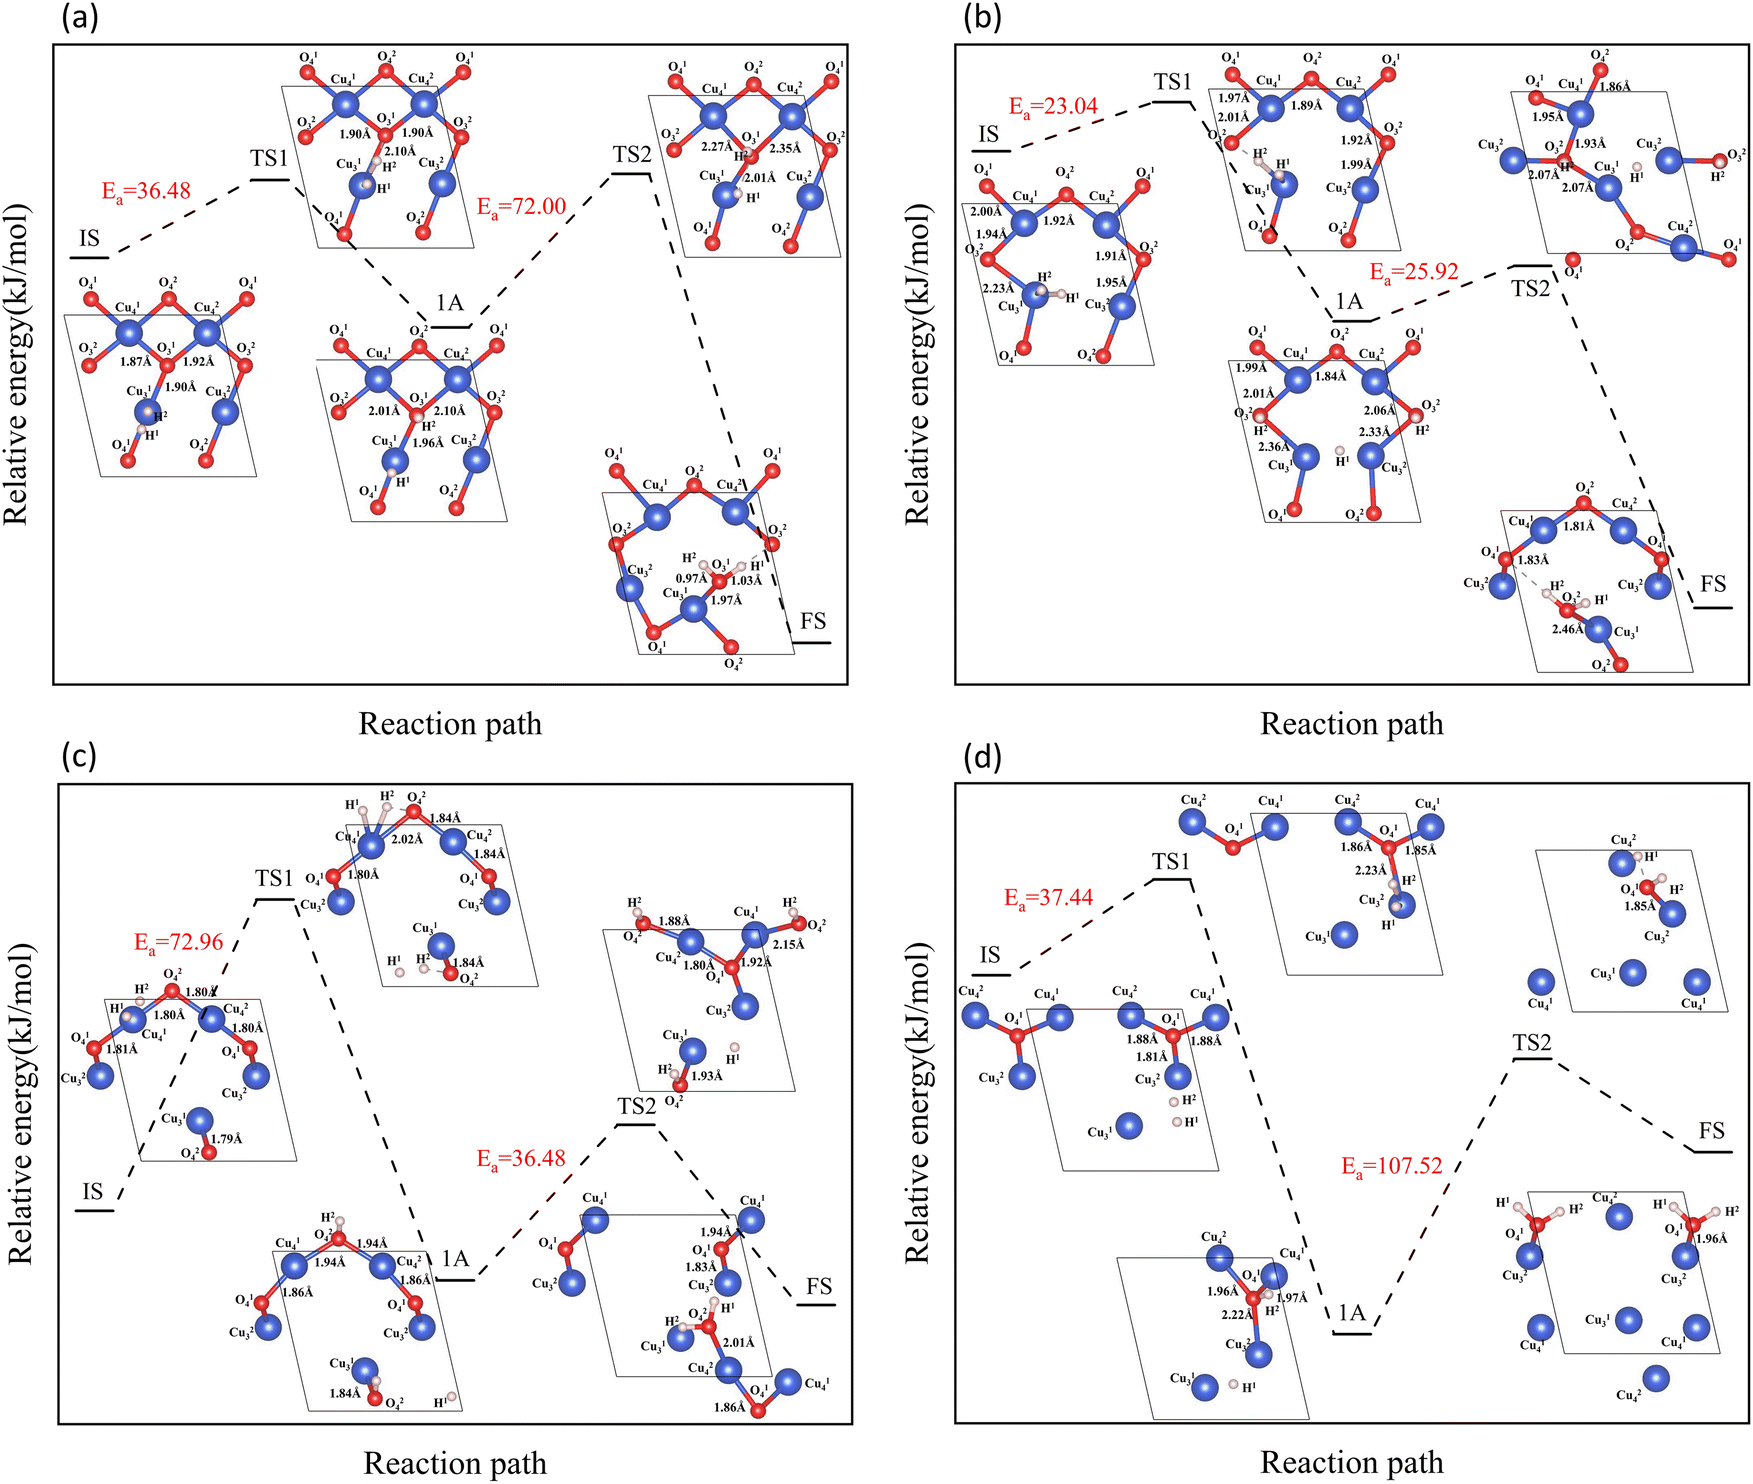
In the process of complete reduction of CuO by H2, as the reaction of H2 with surface O atoms proceeds, H2O is formed on the surface of CuO (111) with different oxygen vacancy concentrations until no O atoms remain on the surface. As shown in Fig. 5, for convenience, this article refers to the surfaces of CuO (111) with 25%, 50%, 75%, and 100% oxygen vacancy concentration as surface I, surface II, surface III, and surface IV, respectively. This designation was used to study the effect of different oxygen vacancy concentrations on the reaction between CuO and H2. The complete reaction process of H2 with the CuO (111) surface is shown in Fig. 6.
 |
| | Fig. 5 Surfaces with different oxygen vacancy concentrations as the reaction of H2 reduction of CuO occurs: (a) surface I (25% oxygen vacancy concentration), (b) surface II (50% oxygen vacancy concentration), (c) surface III (75% oxygen vacancy concentration), and (d) surface IV (100% oxygen vacancy concentration). | |
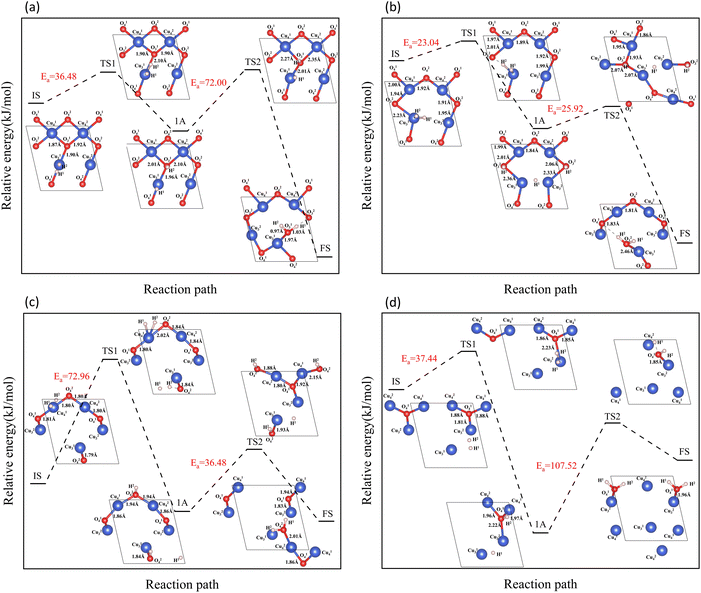 |
| | Fig. 6 Entire process of the reaction path of H2 reduction on the CuO surface: (a) H2 reacts with an intact surface, (b) H2 reacts with surface I, (c) H2 reacts with surface II, (d) H2 reacts with surface III. | |
On the intact surface, the initial state was a state when H2 adsorbed on the top site of Cu13, and the H–H bond length of the adsorbed H2 molecule was 0.75 Å, which was essentially unchanged compared to the H–H bond length of the gaseous H2 molecules (0.74 Å). Then, the H–H bond in the H2 molecule was broken to form an H–O group, and another H atom stayed in the top site of the Cu atom. During this process, the Cu–O bonds were activated, and the Cu–O bonds around O13 lengthened. Subsequently, another H atom was combined with O13 to form two H–O bonds on the surface. The two H–O bonds' lengths were 0.97 Å and 1.03 Å, respectively, and the H–O–H bond angle was 106.40°. In the H2O molecule, the H–O bond length is 0.99 Å, and the H–O–H bond angle is 104.5°. It can be considered that water molecules were generated on the surface.
On surface I, when H2 was adsorbed on the top site of Cu13, the H–H bond length was 0.80 Å, and the H–H bond was activated. The Cu–O bond around O23 was longer than that of the intact CuO surface, and when an H–O bond was formed, the Cu–O bonds were also more active than the ones on intact surfaces. Compared to the intact surface, on surface I, the energy barrier for the reaction between H2 and O23 atoms to form H2O molecules was smaller, the reaction was more likely to occur, and more heat was given off by the entire reaction process. During the reaction, the O atoms on the surface were rearranged, with O14 on the surface migrating to the original position of O23. With the dissociation of H2O, a CuO surface with a 50% oxygen vacancy concentration, which has been denoted as surface II, was formed.
On surface II, the arrangement of Cu and O was similar to the (111) surface of Cu2O.37 The length of the Cu–O bond on this surface was shorter than that on both previous surfaces. At the initial state, H2 adsorbed on the top site of Cu, and the H–H bond length of the H2 molecule was 0.75 Å. They were not activated. The process of cleavage of H2 molecules and formation of an H–O bond had a higher energy barrier. The required energy to break the barrier for the subsequent formation of two H–O bonds was reduced but still high compared to the same reaction process on surface I.
On surface III, H2 cannot adsorb on the top sites of Cu, but instead adsorbed on the hollow sites on Cu atoms. The H–H bond length of the adsorbed H2 molecule was 0.75 Å. During the cleavage of the H2 molecule and the formation of an H–O bond, the required energy barrier was similar to the energy required for the first step of the reaction on the intact surface. The higher energy required in the formation of two H–O bonds may be due to the fact that more energy was required to rearrange the surface Cu atoms as more surface oxygen vacancies appeared.
In summary, the complete reduction of the CuO surface by H2 was calculated. The first chemical process in the two-step reaction was mainly the cleavage of the H2 molecule, the activation of the Cu–O bond, and the formation of the H–O bond. The second step was mainly the breaking of the Cu–O bond and the formation of the H–O–H bond. As the concentration of oxygen vacancies on the surface increased, the reaction between H2 and CuO was more intense on the surface with a 25% oxygen vacancy concentration. The reaction between H2 and CuO became more difficult and slowed down as the concentration of oxygen vacancies continued to increase.
3.2 Electronic structure analysis
Table 1 lists the Bader charge on the intact surface and on surfaces with four different oxygen vacancy concentrations (0%, 25%, 75%, and 100%), as well as the Bader charge of Cu atoms in CuO, Cu2O, and Cu bulks. According to the Bader charge results, it is concluded that on the intact surface, the three-coordinated Cu atoms carry more charge than the four-coordinated Cu atoms, which confirms the choice of three-coordinated Cu as the initial adsorption site for H2. The Bader charge of the O atom remained stable throughout the reaction. This was because the O atom is more electronegative with respect to the Cu atom and therefore always attracts charge to fill its empty orbitals. The Bader charge of the Cu atom increased as the reaction proceeded. Compared with the Bader charge of Cu atom in CuO bulk, on the intact surface, the four-coordinated Cu atoms were at +2 valence, and the three-coordinated Cu atoms were at +2 valence approximately because of the presence of surface dangling bonds. On surface II, the Bader charge of the Cu atoms were near the Bader charge of Cu atom in Cu2O bulk. Each Cu atom had two coordination bonds, which was consistent with the Cu atom in Cu2O bulk. It could be considered that the valence state of Cu atoms on surface II was +1. On surface IV, Cu atoms had no coordination bonds on the surface and only had one coordination bond with the O atoms on the subsurface. Comparing the Bader charge of Cu atoms on surface IV with the Bader charge of Cu atom in Cu bulk, it could be approximated that the Cu atoms on surface IV were at 0 valence. Therefore, during the reduction of a CuO surface by H2, the Cu atoms on the entire surface exhibited a change process of Cu2+ → Cu1+ → Cu0. Based on the calculation of the transition state, it was found that it is more difficult to reduce Cu1+ than Cu2+, a result that has also been confirmed by experiments.9
Table 1 Bader charge values of surface atoms under different oxygen vacancy concentration conditions and Cu atoms in CuO, Cu2O, and Cu bulks
| Bader charge/e |
| Surface |
Atom |
| Cu13 |
Cu23 |
Cu14 |
Cu24 |
O13 |
O23 |
O14 |
O24 |
Bulk |
Cu |
| Intact surface |
10.24 |
10.24 |
10.02 |
10.02 |
6.90 |
6.90 |
6.91 |
6.91 |
CuO |
10.00 |
| Surface I |
10.37 |
10.36 |
10.27 |
10.28 |
|
6.99 |
6.90 |
6.95 |
|
|
| Surface II |
10.44 |
10.46 |
10.41 |
10.41 |
|
|
6.93 |
6.95 |
Cu2O |
10.46 |
| Surface III |
10.73 |
10.50 |
10.71 |
10.67 |
|
|
6.92 |
|
|
|
| Surface IV |
10.77 |
10.77 |
10.86 |
10.86 |
|
|
|
|
Cu |
10.99 |
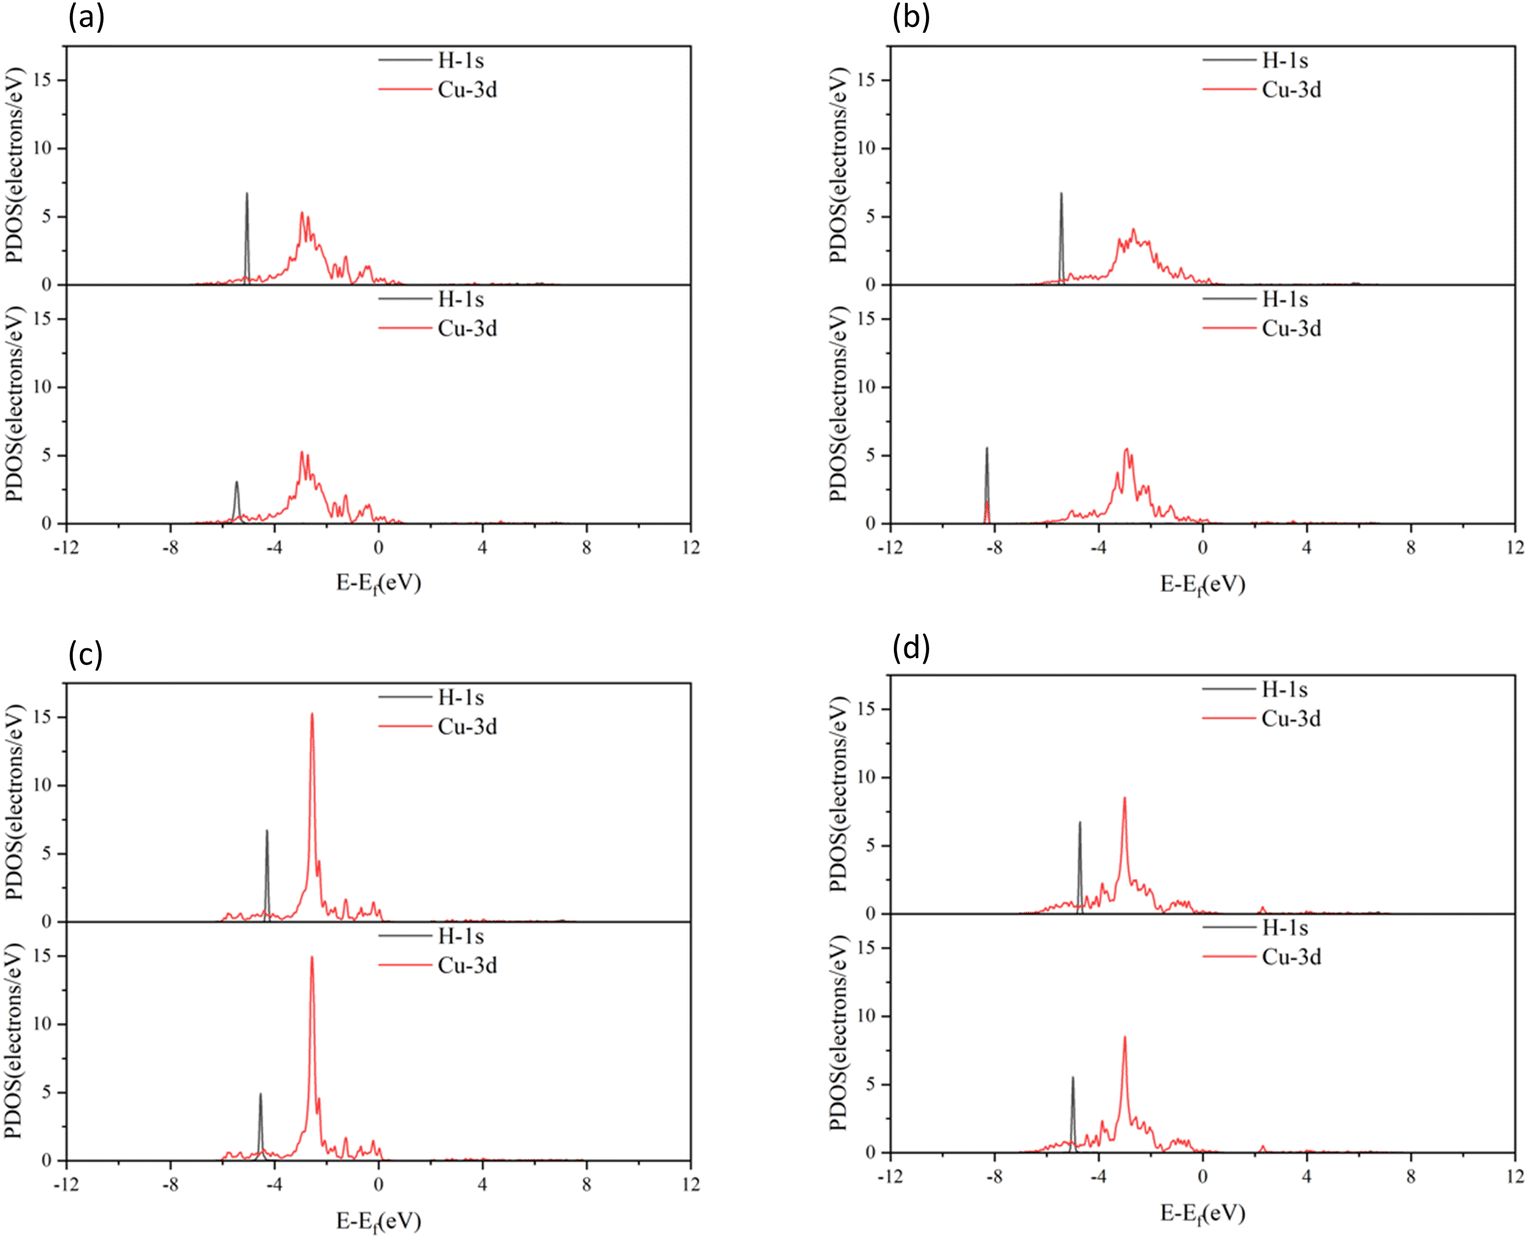
The molecular orbitals before H2 adsorption consisted of the σ1s bonding orbital formed by the 1s orbitals of the two H atoms, and the  antibonding orbital.38 The
  antibonding orbitals were mainly located above the Fermi energy level, and with a small projected density of states (PDOS), so the electrons of H2 were mainly concentrated in the σ1s bonding orbitals. The valence charge of the Cu atom was concentrated in the 3d orbital, which was the active orbital of the Cu atom.39 Fig. 7 shows the PDOS plots of H 1s and Cu 3d before and after H2 adsorption on different surfaces. On the intact CuO surface, after H2 adsorption, the 1s orbitals of H were transferred to a lower energy level, whereas the 3d orbitals of Cu remain almost unchanged. The small overlap region between the two suggests that the hybridization between the 1s orbital of H and 3d orbital of Cu is weak, which corresponds to the relatively low adsorption energy. On surface I, the 1s orbitals of H and 3d orbitals of Cu after H adsorption generated new PDOS peaks at lower energy levels and overlapped. This indicated that, when H2 was adsorbed on surface I, hybrid bonding occurred between the 1s orbital of the H atom and the 3d orbital of Cu, forming a bonding orbital with lower energy, which increased the adsorption energy. At the same time, the original σ1s and
  molecular orbitals of H2 were destroyed, which led to the activation of the covalent bond of H2, which was conducive to the subsequent dissociation and diffusion of the H2. On surfaces II and III, after H adsorption, the H 1s orbital of moved to a lower energy level, the 3d orbital of Cu remained essentially unchanged, and the region of overlap between the two was relatively small. This indicated that on both surfaces the reaction with Cu remains weak when H2 molecular adsorption occurs. The analysis of the PDOS plots led to the conclusion that only surface I activated the covalent bond of H2 well upon adsorption of H2, which facilitated the subsequent dissociation of H2.
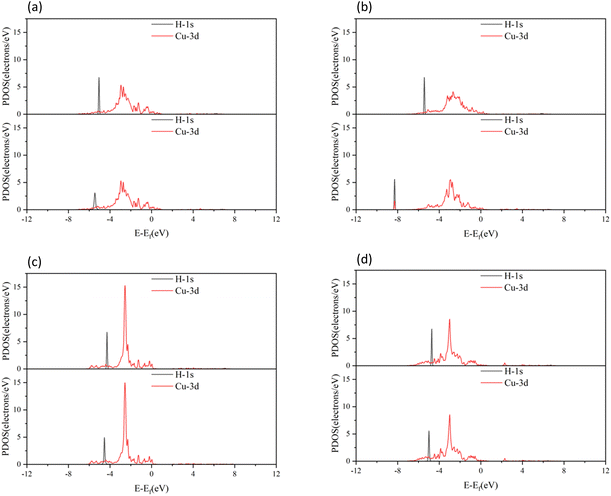 |
| | Fig. 7 PDOS plots of H2 before and after adsorption on different CuO surfaces: (a) H2 adsorbed on the intact surface, (b) H2 adsorbed on surface I, (c) H2 adsorbed on surface II, and (d) H2 adsorbed on surface III. In all parts, the top figure shows before adsorption, and bottom figure shows after adsorption. | |
To understand the bonding of Cu–O on different surfaces, Fig. 8 illustrates the minus projected crystal orbital Hamilton population (−pCOHP) diagrams of Cu–O bonds on CuO surfaces with different oxygen vacancy concentrations. The minus integrated projected crystal orbital Hamilton population (−IpCOHP) of the Cu–O bond is showed in Fig. 9. It can be found that the strength of the Cu–O bond decreased as the concentration of oxygen vacancies on the surface increased. However, as the oxygen vacancy concentration continued to increase, the surface structure underwent rearrangement to form the Cu2O phase. At this point, the strength of Cu–O bond increased again, and then decreased again with further increase in oxygen vacancy concentration. The strength of the Cu–O bond on surface I was reduced, which makes the reaction between H2 and the CuO surface more likely to occur. Less energy was needed to activate the Cu–O bond, and the entire reaction process occurred more easily. However, with the rearrangement of the surface structure, the strength of the Cu–O bond increased, making the reaction of H2 with surfaces II and III more difficult again, because the energy requirement for activating the Cu–O bond became higher.
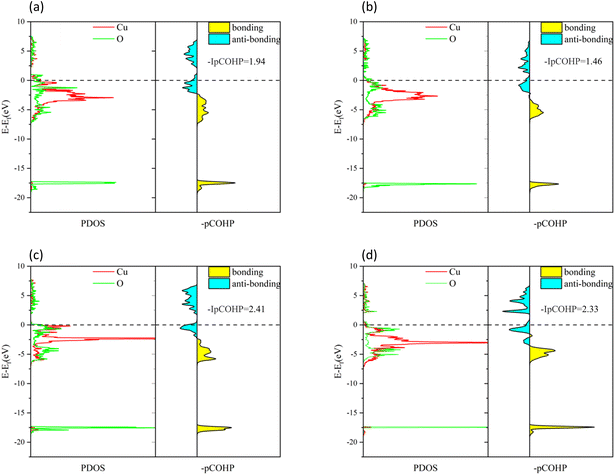 |
| | Fig. 8 −pCOHP diagrams of Cu–O bonds on different CuO surfaces: (a) intact surface, (b) surface I, (c) surface II, and (d) surface III. | |
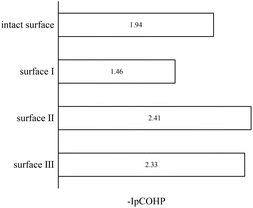 |
| | Fig. 9 −IpCOHP diagrams of Cu–O bonds on different CuO surfaces. | |
Based on the analysis of the electronic structure, it can be concluded that an appropriate concentration of surface oxygen vacancies enhances the activation capacity of the CuO surface for H2 molecules and also reduces the strength of the Cu–O bond, which promotes the reaction of H2 with the surface O atoms. However, an excessive concentration of oxygen vacancies would cause rearrangements on the CuO surface, and the Cu2O phase formed would reduce the activation capacity for H2 molecules and enhance the strength of the Cu–O bond. At the same time, during the reduction of CuO by H2, excess oxygen vacancies caused a drastic rearrangement of Cu atoms on the surface of CuO, which increased the reaction energy barrier.
3.3 Subsurface oxygen transfer
The process of CuO reduction by H2 is not a single process in which H2 reacts with surface O atoms, but also involves the movement of subsurface O atoms to the surface. When oxygen vacancies appear on the surface, subsurface O atoms move upward. H2 reduction of the CuO surface consumes surface O atoms, and the upward movement of O from the subsurface replenishes the surface O atoms. The two processes compete with each other.
The CuO (111) model utilized in this study with zero H2 coverage is capable of simulating the transfer of subsurface O atoms under very low H2 concentration. As shown in Fig. 2, in the CuO (111) model, there are a total of two types of subsurface O atoms: one is the upward-connected, four-coordinated Oupsub and the other is the downward-connected, four-coordinated Odownsub.
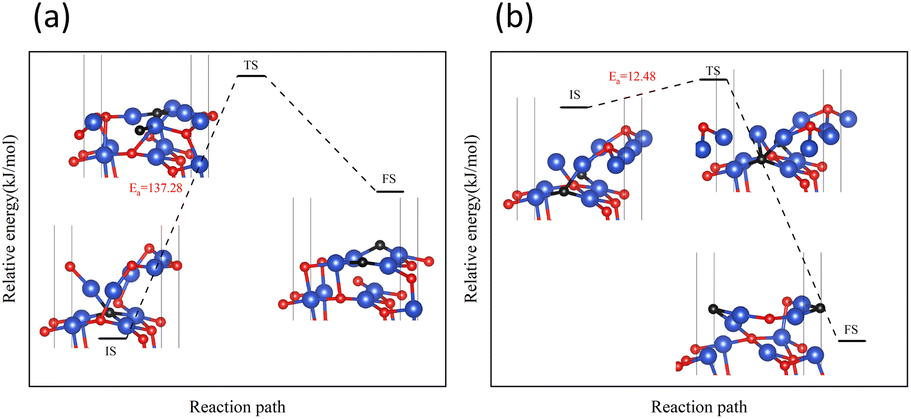
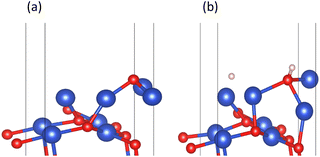
On surface I, both subsurface O atoms could be transferred to the surface to replenish the O, returning the surface to an intact surface. The energy barriers for the upward transfer of these two O atoms were calculated separately. As shown in Fig. 10, on surface I, for the subsurface O atoms to move to the surface, they must first break the Cu–O bonds formed with the subsurface Cu atoms, reaching the transition state in the process. Subsequently, the O atom was bonded with the Cu atoms of the surface. The energy barrier for upward transfer of Oupsub was lower than that of Odownsub, and the transfer of Oupsub to the surface was easier. However, the energy barrier for upward transfer of O atoms in both cases was higher than that for the reaction of H2 with O atoms on surface I (Fig. 6(b)). Therefore, for surface I, the rate of upward O replenishment at the subsurface was lower than the rate of surface O consumption by H2, and the CuO surface became surface II.
 |
| | Fig. 10 Transfer paths of two O atoms from the subsurface to the surface: (a) Oupsub transfers (b) Odownsub transfers. | |
Next, the focus was the upward transfer of the subsurface Oupsub, as shown in Fig. 11. For surface II, Oupsub transferred upward, returning the surface to surface I. The energy barrier is as shown in Fig. 11(a). It can be seen that the energy barrier is very high, and it is difficult for subsurface O to transfer upward. Therefore, the CuO surface changed from surface II to surface III.
 |
| | Fig. 11 Transfer path of subsurface Oupsub to the surface on (a) surface II, and (b) surface III. | |
However, for surface III, the upward transfer of subsurface O became quite easy, and had the upper hand in the competition with H2 consumption of O on the surface. The CuO surface returned to surface II; that is, the Cu2O phase on the surface would remain for a period of time. H2 continuously consumed O atoms on the surface, and subsurface O atoms were continuously transferred to the surface to replenish it, reaching a dynamic equilibrium. This coincides with the experimental observation of the reaction process Cu2+ → Cu1+ → Cu0 under low H2 concentration.
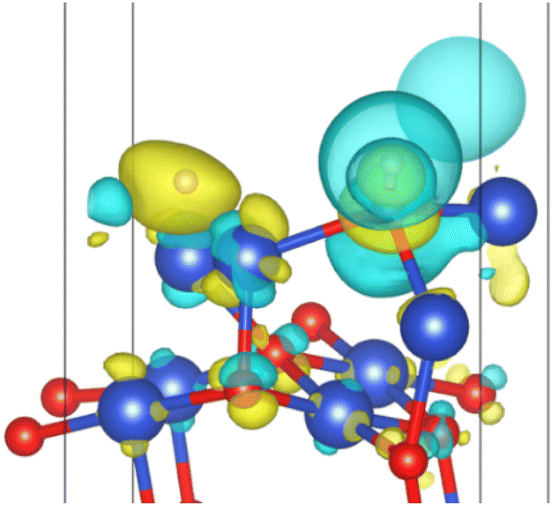
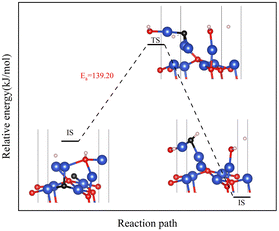
However, in experiments, the Cu2O phase7 was not observed when the H2 concentration was high. The surface III with H2 coverage of 0.25 ML could simulate subsurface O atoms transfer under high H2 concentration, as shown in Fig. 12. This could be considered as having one H2 molecule on the surface III. However, this H2 molecule, after dissociation, occupied a surface oxygen vacancy and the top position of an O atom, respectively. Fig. 13 shows the charge transfer on the surface when there are H atoms on the surface. It can be seen that a large amount of charge was distributed around the H atoms on the oxygen vacancies. Fig. 14 illustrates the energy barrier for the O atom transfer process. For surface III, when oxygen vacancies were occupied by H atoms, the upward transfer of oxygen atoms required a large amount of energy to overcome the barrier. The transition state structure no longer occurred in the process of O atoms breaking the Cu–O bond with subsurface Cu atoms. Instead, it occurred in the process of forming H–O bonds between surface O and H. The transfer of subsurface O atoms was particularly difficult when the oxygen vacancies were occupied by H atoms. This may be due to the fact that H–O bonding replaces the original Cu–O bond breaking as a key step in the upward transfer of subsurface O. In the case of a high H2 concentration, surface III cannot return to surface II, which requires the replenishment of subsurface O. Instead, the surface changes to surface IV due to the reaction of the surface with H2. Therefore, when the H2 concentration is high, the Cu2O phase cannot be stabilized, and only the Cu2+ → Cu0 process can be observed in the experiment.
 |
| | Fig. 12 (a) Surface III and (b) surface III with 0.25 ML H2 coverage. | |
 |
| | Fig. 13 Surface charge transfer at 0.25 ML H2 coverage (yellow represents charge increase and blue represents charge decrease). | |
 |
| | Fig. 14 Transfer path of subsurface Oupsub to the surface at 0.25 ML H2 coverage. | |
3.4 Thermodynamic analysis
The thermodynamic analysis of the H2 reduction process of CuO was investigated. According to relevant papers on thermodynamics, the change of Gibbs free energy (ΔG) can predict the direction and spontaneity of chemical reactions.40 Fe3O4, Co3O4 and NiO are other common oxygen carriers for chemical looping combustion.41–43 The thermodynamic analysis of the reaction between these other common oxygen carriers and H2 was used for comparison with the reaction between CuO and H2. The reactions occurring during the H2 reduction of CuO and the reactions of other common oxygen carriers with H2 are listed below.| | |
H2 + 2CuO → H2O + Cu2O
| (5) |
| | |
H2 + Cu2O → H2O + 2Cu
| (6) |
| | |
H2 + 0.25Fe3O4 → H2O + 0.75Fe
| (8) |
| | |
H2 + 0.25Co3O4 → H2O + 0.75Co
| (9) |
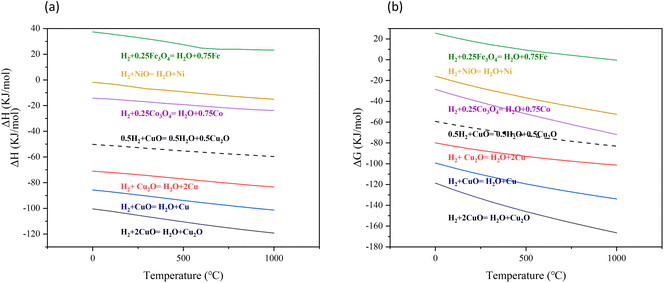
ΔH and ΔG of each reaction are shown in Fig. 15. All reactions (reaction (5)–(10)) show the same trend. As the temperature increased, both ΔH and ΔG decreased, indicating that the reactions were more favorable at higher temperatures. The reduction of CuO to Cu2O by H2 (reaction (5)) released more heat compared to the reduction of Cu2O to Cu by H2 (reaction (6)). According to the ΔG, it could be concluded that reducing CuO to Cu2O by H2 is easier than reducing Cu2O to Cu by H2. The DFT calculation in this study obtained the same result that the reduction of CuO to Cu2O by H2 was more likely to occur and released more heat as thermodynamic analysis. The reaction between Fe2O3 and H2 was an endothermic reaction (reaction (8)). The reaction between NiO and H2 was exothermic, but the heat released was small (reaction (10)). Compared to the reaction between NiO and H2, the reaction between Co3O4 and H2 released more heat (reaction (9)). However, in contrast to these common oxygen carriers, the reaction between CuO and H2 released much more heat. The molar ratio of H2 to CuO in reaction (5) was 1![[thin space (1/6-em)]](https://www.rsc.org/images/entities/char_2009.gif) :2 and 1:1 in reaction (6). Compared to reaction (6), reaction (5) required more CuO at the same molar amount of H2. It can be observed that when the H2 concentration was low, the amount of CuO was sufficient, and reaction (5) was thermodynamically favorable. However, as the H2 concentration increased, the amount of CuO limited the reaction. Under the same amount of CuO, reaction (6) was more likely to occur.
:2 and 1:1 in reaction (6). Compared to reaction (6), reaction (5) required more CuO at the same molar amount of H2. It can be observed that when the H2 concentration was low, the amount of CuO was sufficient, and reaction (5) was thermodynamically favorable. However, as the H2 concentration increased, the amount of CuO limited the reaction. Under the same amount of CuO, reaction (6) was more likely to occur.
 |
| | Fig. 15 The trend of ΔH and ΔG for each reaction with temperature changes. | |
4 Conclusions
In this study, DFT and thermodynamic calculation were used to study the whole process of the reaction between the CuO (111) surface and H2 as well as the transfer of subsurface O atoms at different H2 coverage (0 ML, 0.25 ML). Throughout the entire process of H2 reduction of the CuO (111) surface, the surface Cu atoms underwent the transformation process of Cu2+ → Cu1+ → Cu0. As the reaction proceeded, the concentration of surface oxygen vacancies increased, and the CuO surface underwent rearrangement of O atoms to form the Cu2O phase. The Cu–O bond of the Cu2O phase was more stable than the Cu–O bond of the CuO phase, and it was therefore more difficult to reduce Cu2O with H2 than to reduce CuO. The surface H2 coverage could reflect the concentration of H2. As the surface oxygen vacancy concentration increased, it was more likely that the subsurface O atoms transfer to the surface at zero H2 coverage, allowing the surface to maintain a stable Cu2O phase. However, when the H2 coverage was 0.25 ML, the H atoms on the surface hindered the upward transfer of O atoms from the subsurface; therefore, O atoms on the surface was not replenished timely, and the Cu2O phase could not be maintained stably. Through thermodynamic analysis, compared to other oxygen carriers (Co3O4, NiO), the reaction between CuO and H2 released more heat. The concentration of H2 affects the reaction products of H2 with CuO. In summary, the concentration of H2 affected the valence state of surface Cu by affecting the transfer of subsurface O atoms. It could be considered that as long as the surface oxygen vacancies were occupied by H atoms, subsurface O atoms could not transfer upward in a timely manner, preventing the stable existence of the Cu2O phase. However, there are various arrangements of H atoms on the surface of CuO, and this study only investigated one particular configuration to examine its impact on subsurface O atom transfer. The study of the effects of different arrangements of H atoms on the surface of CuO will be a primary focus for future research. Meanwhile, AIMD and KMC are two other excellent methods for studying chemical reactions. The application of AIMD and KMC methods will also become the focus of our future work.
Author contributions
Y. Wu performed the calculations and the data analysis and R. Fang prepared the draft of the manuscript. L. Shen initialized the project and proposed the supervision. H. Bai provided the VASP software copyright. All authors have given approval to the final version of the manuscript.
Conflicts of interest
There are no conflicts to declare.
Acknowledgements
This work was supported by the National Natural Science Foundation of China (grants no. 52376099).
References
- J. Adánez, P. Gayán and I. Adánez-Rubio, et al., Use of chemical-looping processes for coal combustion with CO2 capture, Energy Procedia, 2013, 37, 540–549 CrossRef.
- E. M. Eyring, G. Konya and J. S. Lighty, et al., Chemical looping with copper oxide as carrier and coal as fuel, Oil Gas Sci. Technol., 2011, 66(2), 209–221 CrossRef CAS.
- M. M. Hossain and H. I. de Lasa, Chemical-looping combustion (CLC) for inherent CO2 separations—a review, Chem. Eng. Sci., 2008, 63(18), 4433–4451 CrossRef CAS.
- S. Jiang, L. Shen and J. Wu, et al., The investigations of hematite-CuO oxygen carrier in chemical looping combustion, Chem. Eng. J., 2017, 317, 132–142 CrossRef CAS.
- I. Adánez-Rubio, P. Gayán and F. García-Labiano, et al., Development of CuO-based oxygen-carrier materials suitable for Chemical-Looping with Oxygen Uncoupling (CLOU) process, Energy Procedia, 2011, 4, 417–424 CrossRef.
- C. R. Forero, P. Gayán and F. García-Labiano, et al., High temperature behaviour of a CuO/γAl2O3 oxygen carrier for chemical-looping combustion, Int. J. Greenhouse Gas Control, 2011, 5(4), 659–667 CrossRef CAS.
- J. Y. Kim, J. C. Hanson and A. I. Frenkel, et al., Reaction of CuO with hydrogen studied by using synchrotron-based x-ray diffraction, J. Phys.: Condens. Matter, 2004, 16(33), S3479 CrossRef CAS.
- M. S. W. Vong, P. A. Sermon and K. Grant, In-situ study of reduction of copper catalysts, Catal. Lett., 1990, 4, 15–24 CrossRef CAS.
- J. Y. Kim, J. A. Rodriguez and J. C. Hanson, et al., Reduction of CuO and Cu2O with H2: H embedding and kinetic effects in the formation of suboxides, J. Am. Chem. Soc., 2003, 125(35), 10684–10692 CrossRef CAS PubMed.
- J. A. Rodriguez, J. Y. Kim and J. C. Hanson, et al., Reduction of CuO in H2: in situ time-resolved XRD studies, Catal. Lett., 2003, 85, 247–254 CrossRef CAS.
- D. Jelić, B. Tomić-Tucaković and S. Mentus, A kinetic study of copper (II) oxide powder reduction with hydrogen, based on thermogravimetry, Thermochim. Acta, 2011, 521(1–2), 211–217 CrossRef.
- Y. Maimaiti, M. Nolan and S. D. Elliott, Reduction mechanisms of the CuO (111) surface through surface oxygen vacancy formation and hydrogen adsorption, Phys. Chem. Chem. Phys., 2014, 16(7), 3036–3046 RSC.
- H. Jabraoui, M. D. Rouhani and C. Rossi, et al., First-principles investigation of CuO decomposition and its transformation into Cu2O, Phys. Rev. Mater., 2022, 6(9), 096001 CrossRef CAS.
- B. X. Yang, L. P. Ye and H. J. Gu, et al., A density functional theory study of CO oxidation on CuO1-x (111), J. Mol. Model., 2015, 21, 1–7 CrossRef PubMed.
- P. Hohenberg and W. Kohn, Inhomogeneous electron gas, Phys. Rev. [Sect.] B, 1964, 136(3), B864 CrossRef.
- W. Kohn and L. J. Sham, Self-consistent equations including exchange and correlation effects, Phys. Rev. [Sect.] A, 1965, 140(4), A1133 CrossRef.
- G. Henkelman, B. P. Uberuaga and H. Jónsson, A climbing image nudged elastic band method for finding saddle points and minimum energy paths, J. Chem. Phys., 2000, 113(22), 9901–9904 CrossRef CAS.
- G. Henkelman and H. Jónsson, A dimer method for finding saddle points on high dimensional potential surfaces using only first derivatives, J. Chem. Phys., 1999, 111(15), 7010–7022 CrossRef CAS.
- G. Kresse and J. Hafner, Ab initio molecular dynamics for liquid metals, Phys. Rev. B: Condens. Matter Mater. Phys., 1993, 47(1), 558 CrossRef CAS PubMed.
- G. Kresse and J. Furthmüller, Efficiency of ab-initio total energy calculations for metals and semiconductors using a plane-wave basis set, Comput. Mater. Sci., 1996, 6(1), 15–50 CrossRef CAS.
- P. E. Blöchl, Projector augmented-wave method, Phys. Rev. B: Condens. Matter Mater. Phys., 1994, 50(24), 17953 CrossRef PubMed.
- J. P. Perdew, K. Burke and M. Ernzerhof, Generalized gradient approximation made simple, Phys. Rev. Lett., 1996, 77(18), 3865 CrossRef CAS PubMed.
- H. J. Monkhorst and J. D. Pack, Special points for Brillouin-zone integrations, Phys. Rev. B: Solid State, 1976, 13(12), 5188 CrossRef.
- L. Wang, T. Maxisch and G. Ceder, Oxidation energies of transition metal oxides within the GGA+ U framework, Phys. Rev. B: Condens. Matter Mater. Phys., 2006, 73(19), 195107 CrossRef.
- V. I. Anisimov, J. Zaanen and O. K. Andersen, Band theory and Mott insulators: Hubbard U instead of Stoner I, Phys. Rev. B: Condens. Matter Mater. Phys., 1991, 44(3), 943 CrossRef CAS PubMed.
- K. Bhola, J. J. Varghese and L. Dapeng, Influence of Hubbard U parameter in simulating adsorption and reactivity on CuO: Combined theoretical and experimental study, J. Phys. Chem. C, 2017, 121(39), 21343–21353 CrossRef CAS.
- S. Maintz, V. L. Deringer, A. L. Tchougréeff and R. Dronskowski, LOBSTER: A tool to extract chemical bonding from plane-wave based DFT, J. Comput. Chem., 2016, 37, 1030–1035 CrossRef CAS PubMed.
- K. Momma and F. Izumi, VESTA 3 for three-dimensional visualization of crystal, volumetric and morphology data, J. Appl. Crystallogr., 2011, 44(6), 1272–1276 CrossRef CAS.
- A. Hémeryck, A. Motta and C. Lacaze-Dufaure, et al., DFT-D study of adsorption of diaminoethane and propylamine molecules on anatase (101) TiO2 surface, Appl. Surf. Sci., 2017, 426, 107–115 CrossRef.
- S. Åsbrink and L. J. Norrby, A refinement of the crystal structure of copper (II) oxide with a discussion of some exceptional esd's, Acta Crystallogr., Sect. B: Struct. Crystallogr. Cryst. Chem., 1970, 26(1), 8–15 CrossRef.
- J. Hu, D. Li and J. G. Lu, et al., Effects on electronic properties of molecule adsorption on CuO surfaces and nanowires, J. Phys. Chem. C, 2010, 114(40), 17120–17126 CrossRef CAS.
- D. A. Svintsitskiy, T. Y. Kardash and O. A. Stonkus, et al., In situ XRD, XPS, TEM, and TPR study of highly active in CO oxidation CuO nanopowders, J. Phys. Chem. C, 2013, 117(28), 14588–14599 CrossRef CAS.
- M. García-Melchor and N. López, Homolytic products from heterolytic paths in H2 dissociation on metal oxides: the example of CeO2, J. Phys. Chem. C, 2014, 118(20), 10921–10926 CrossRef.
- J. Reedijk and K. R. Poeppelmeier, Comprehensive Inorganic Chemistry II: From Elements to Applications, 2013 Search PubMed.
- V. E. Henrich and P. A. Cox, The Surface Science of Metal Oxides, Cambridge University Press, 1994 Search PubMed.
- J. L. G.Fierro, Metal oxides: chemistry and applications, CRC press, 2005 Search PubMed.
- X. Yu, C. Zhao and T. Zhang, et al., Molecular and dissociative O2 adsorption on the Cu2O (111) surface, Phys. Chem. Chem. Phys., 2018, 20(31), 20352–20362 RSC.
- T. L. Brown, H. E. LeMay and B. E. Bursten, Chemistry: The Central Science, Pearson Educación, 2002 Search PubMed.
- L. Hozoi, L. Siurakshina and P. Fulde, et al., Ab Initio determination of Cu 3d orbital energies in layered copper oxides, Sci. Rep., 2011, 1(1), 65 CrossRef PubMed.
- Z. Hu, Y. Peng and F. Sun, et al., Thermodynamic equilibrium simulation on the synthesis gas composition in the context of underground coal gasification, Fuel, 2021, 293, 120462 CrossRef CAS.
- E. R. Monazam, R. W. Breault and R. Siriwardane, Kinetics of magnetite (Fe3O4) oxidation to hematite (Fe2O3) in air for chemical looping combustion, Ind. Eng. Chem. Res., 2014, 53(34), 13320–13328 CrossRef CAS.
- H. A. Alalwan, D. M. Cwiertny and V. H. Grassian, Co3O4 nanoparticles as oxygen carriers for chemical looping combustion: a materials characterization approach to understanding oxygen carrier performance, Chem. Eng. J., 2017, 319, 279–287 CrossRef CAS.
- T. Mattisson, M. Johansson and A. Lyngfelt, The use of NiO as an oxygen carrier in chemical-looping combustion, Fuel, 2006, 85(5–6), 736–747 CrossRef CAS.
|
| This journal is © The Royal Society of Chemistry 2024 |
Click here to see how this site uses Cookies. View our privacy policy here. 
 Open Access Article
 This Open Access Article is licensed under a
  *a and
Hongcun Baib
*a and
Hongcun Baib


 antibonding orbital.38 The
  antibonding orbitals were mainly located above the Fermi energy level, and with a small projected density of states (PDOS), so the electrons of H2 were mainly concentrated in the σ1s bonding orbitals. The valence charge of the Cu atom was concentrated in the 3d orbital, which was the active orbital of the Cu atom.39 Fig. 7 shows the PDOS plots of H 1s and Cu 3d before and after H2 adsorption on different surfaces. On the intact CuO surface, after H2 adsorption, the 1s orbitals of H were transferred to a lower energy level, whereas the 3d orbitals of Cu remain almost unchanged. The small overlap region between the two suggests that the hybridization between the 1s orbital of H and 3d orbital of Cu is weak, which corresponds to the relatively low adsorption energy. On surface I, the 1s orbitals of H and 3d orbitals of Cu after H adsorption generated new PDOS peaks at lower energy levels and overlapped. This indicated that, when H2 was adsorbed on surface I, hybrid bonding occurred between the 1s orbital of the H atom and the 3d orbital of Cu, forming a bonding orbital with lower energy, which increased the adsorption energy. At the same time, the original σ1s and
  molecular orbitals of H2 were destroyed, which led to the activation of the covalent bond of H2, which was conducive to the subsequent dissociation and diffusion of the H2. On surfaces II and III, after H adsorption, the H 1s orbital of moved to a lower energy level, the 3d orbital of Cu remained essentially unchanged, and the region of overlap between the two was relatively small. This indicated that on both surfaces the reaction with Cu remains weak when H2 molecular adsorption occurs. The analysis of the PDOS plots led to the conclusion that only surface I activated the covalent bond of H2 well upon adsorption of H2, which facilitated the subsequent dissociation of H2.