 Open Access Article
The effect of the gelation temperature on the structural, magnetic and magnetocaloric properties of perovskite nanoparticles manufactured using the sol–gel method
Line Karoui *a,
Mourad Smari
 b and
Taoufik Mnasria
aLaboratory of Technology, Energy and Innovative Materials, TEMI, Department of Physics, Faculty of Sciences of Gafsa, University of Gafsa, 2112, Tunisia. E-mail: linekaroui5@gmail.com
bApplied Physics Laboratory, Faculty of Sciences of Sfax, University of Sfax, B.P. 1171, 3000 Sfax, Tunisia
First published on 9th April 2024
Abstract
This study presents a comprehensive investigation of the structural and magnetic properties of La0.8Sr0.2Mn0.8Co0.2O3 (LS1, LS2 and LS3) compounds synthesized via the sol–gel method at different gelation temperatures through X-ray diffraction and different magnetic measurement techniques. The Rietveld refinement demonstrated that all samples exhibit a rhombohedral perovskite structure with the R![[3 with combining macron]](https://www.rsc.org/images/entities/char_0033_0304.gif) C space group. Their magnetic behavior, characterized through magnetization measurements, hysteresis loops, and Arrot plots, demonstrates a ferromagnetic–paramagnetic transition with notable soft ferromagnetic characteristics. The samples also demonstrate second-order magnetic transitions, short-range magnetic order and the presence of both ferromagnetic and antiferromagnetic contributions. AC magnetic susceptibility measurements, allowing the investigation of the magnetic dynamics of the samples, shows that the Vogel–Fulcher and the Conventional Critical Slowing Down models are the most appropriate for describing the dynamic behavior, confirming the spin-glass nature of the compounds and the presence of medium to strong interaction between magnetic nanoparticles. The influence of gelation temperature in the magnetocaloric effect of the compounds was proven and LS1, synthesized at the lowest gelation temperature (70 °C), exhibits the higher magnetic entropy change (|ΔSmax| = 3.25 J kg−1 K−1 and RCP = 209.83 J kg−1 at 5 T). For a better evaluation of the magnetocaloric efficiency, the temperature average entropy change (TEC) parameter was calculated for all three samples and LS1 showed the highest value (TEC (LS1) ∼3.2 J kg−1 K−1 for ΔTH–C = 10 K and ΔH = 5 T).
C space group. Their magnetic behavior, characterized through magnetization measurements, hysteresis loops, and Arrot plots, demonstrates a ferromagnetic–paramagnetic transition with notable soft ferromagnetic characteristics. The samples also demonstrate second-order magnetic transitions, short-range magnetic order and the presence of both ferromagnetic and antiferromagnetic contributions. AC magnetic susceptibility measurements, allowing the investigation of the magnetic dynamics of the samples, shows that the Vogel–Fulcher and the Conventional Critical Slowing Down models are the most appropriate for describing the dynamic behavior, confirming the spin-glass nature of the compounds and the presence of medium to strong interaction between magnetic nanoparticles. The influence of gelation temperature in the magnetocaloric effect of the compounds was proven and LS1, synthesized at the lowest gelation temperature (70 °C), exhibits the higher magnetic entropy change (|ΔSmax| = 3.25 J kg−1 K−1 and RCP = 209.83 J kg−1 at 5 T). For a better evaluation of the magnetocaloric efficiency, the temperature average entropy change (TEC) parameter was calculated for all three samples and LS1 showed the highest value (TEC (LS1) ∼3.2 J kg−1 K−1 for ΔTH–C = 10 K and ΔH = 5 T).
1 Introduction
Perovskite materials have garnered significant recognition in various fields of physics and industrial technology due to their unique crystal structure and versatile properties.1–4 In the realm of materials science, the family of oxide perovskite compounds, characterized by the general formula R1−xAxMnO3, has emerged as an intriguing research area. Among these compounds, La1−xSrxMnO3 (LSMO) stands out as a promising candidate for a wide range of technological applications, including solid oxide fuel cells, refrigeration, magnetic sensors, and catalysis.5–7One of the key factors that contributes to the diverse properties of LSMO is the substitution of strontium (Sr) for lanthanum (La) at the A-site of the crystal structure. This substitution induces a distortion in the crystalline lattice, resulting in a variation in the Mn–O–Mn bond angle. This structural transformation plays a crucial role in converting the material from its initial antiferromagnetic state, observed in the parent compound LaMnO3, to a new ferromagnetic compound when a rhombohedral distortion is present.8 The ability to manipulate the magnetic behavior through structural modification makes LSMO compound attractive for numerous applications.
LSMO also exhibits intriguing phenomena within a specific temperature range centered around the Curie temperature. Two notable phenomena are the magnetocaloric effect and the giant magnetoresistance,6,9 which have significant implications for cooling and sensor technologies.
To further enhance the performance of LSMO and tailor its properties for specific applications, the introduction of transition metal dopants, such as cobalt (Co), has been investigated. The incorporation of Co into the crystal structure alters the magnetic interactions between Mn3+ and Mn4+ ions, favoring antiferromagnetic super-exchange interactions over ferromagnetic double–exchange interactions. This doping-induced modification leads the emergence of inhomogeneities within the material, resulting in short-range magnetic order, a decrease in the Curie temperature,10 an increased variation of magnetic entropy, and the possible existence of spin-glass or superparamagnetic states.11,12
While previous studies have primarily focused on investigating the effect of different substitution ratios of cobalt at the Mn site and various synthesis methods on the physical properties of La1-xSrxMn1-yCoyO3 compounds,13,14 this study aims to explore the influence of gelation temperature on physical properties of La0.8Sr0.2Mn0.8Co0.2O3 during the preparation process using the sol–gel technique. The incorporation of Co at such a doping concentration (0.2) optimizes the magnetoresistance and simultaneously eliminates its temperature dependence.15 Furthermore, 0.2 is approximately the critical doping concentration of cobalt in La0.8Sr0.2MnO3, as evidenced by the typical insulator characteristics observed in the low temperature transport property when the doping concentration reaches 0.3.15,16
The sol–gel synthesis method offers precise control over the composition and structure of the resulting material. Specifically, we examine the structural and magnetic properties of La0.8Sr0.2Mn0.8Co0.2O3 samples prepared at different gelation temperatures. By systematically varying the gelation temperature, we can investigate its impact on the properties of the samples and understand how this parameter affects the crystalline structure, the cooling performance and the magnetic behavior of the synthesized samples.
2 Experimental
The samples denoted as LS1, LS2 and LS3 with a chemical formula La0.8Sr0.2Mn0.8Co0.2O3, were synthesized utilizing the sol–gel approach and precise amounts of all precursors, a clear red solution was acquired, which was then heated to form a resin. The gelation temperature of the samples was set at 70 °C for LS1, 90 °C for LS2 and 300 °C for LS3. To produce ashes, the samples were heated up to 300 °C to eliminate any remaining organic matter. Once ashes were acquired, they were grounded for 30 minutes each to obtain fine powders, and then sintered for 24 hours at 600 °C in air. A second grinding was performed for each powder, and finally they were sintered again for 24 hours at 900 °C in air.The crystal structure was analyzed using X-ray powder Diffraction (XRD) with an Empyrean PANalytical diffractometer, utilizing a Cu X-ray source (λ = 1.54056 Å) and Bragg–Bentano geometry (2θ) over a range of 20° to 90° with a step size of 0.019 in 2θ. Magnetic properties were measured employing a SQUID magnetometer (MPMS XL7, Quantum Design) within a temperature range of 100–300 K and magnetic fields up to 7 T. The magnetocaloric effect, representing magnetic entropy change, was determined from the magnetic isotherms for all examined compounds.
3 Results and discussion
3.1 Structural characterization
The experimental XRD data analyzed through Rietveld refinement using the FULLPROF software17 and fitted with Pseudo-Voigt function indicate that all three samples are single-phase materials, and exhibit a rhombohedral perovskite structure with the R![[3 with combining macron]](https://www.rsc.org/images/entities/char_0033_0304.gif) C space group16,18 as shown in Fig. 1a–c.
C space group16,18 as shown in Fig. 1a–c.
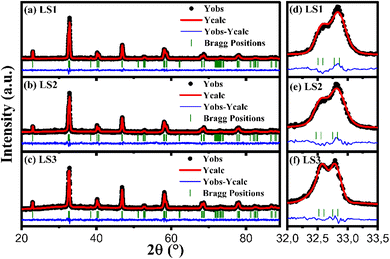 | ||
| Fig. 1 Calculated XRD spectra of LS1 (a), LS2 (b) and LS3 (c) after Rietveld refinement. Zoom on the main peak of LS1 (d), LS2 (e) and LS3 (f). | ||
Fig. 1d–f illustrate that the splitting of the main peak becomes more pronounced for sample LS3, and this type of splitting is indicative of the rhombohedral distortion in the lattice. In addition, the crystal structure of the samples appears to be weakly influenced by the gel formation temperature during the synthesis process, as the peaks are obtained nearly at the same diffraction angle (2θ) for all samples. Furthermore, a lower gelation temperature is associated with a more stable crystalline structure.
The determined lattice parameters obtained from the refinements are presented in Table 1 and depicted in Fig. 1.
| Sample | LS1 | LS2 | LS3 |
|---|---|---|---|
| Space group | R![[3 with combining macron]](https://www.rsc.org/images/entities/char_0033_0304.gif) C C |
R![[3 with combining macron]](https://www.rsc.org/images/entities/char_0033_0304.gif) C C |
R![[3 with combining macron]](https://www.rsc.org/images/entities/char_0033_0304.gif) C C |
| Lattice parameters | |||
| a = b (Å) | 5.5043 | 5.5095 | 5.5017 |
| c (Å) | 13.3202 | 13.3319 | 13.3387 |
| V (Å3) | 349.5089 | 350.4720 | 349.6561 |
| θ Mn–O–Mn | 162.1438 | 163.2758 | 162.2403 |
| d Mn–O | 1.96207 | 1.96092 | 1.96207 |
| Atomic positions | |||
| La/Sr x | 0 | 0 | 0 |
| La/Sr y | 0 | 0 | 0 |
| La/Sr z | 0.25 | 0.25 | 0.25 |
| Mn/Co x | 0 | 0 | 0 |
| Mn/Co y | 0 | 0 | 0 |
| Mn/Co z | 0 | 0 | 0 |
| O x | 0.44468 | 0.44824 | 0.44495 |
| O y | 0 | 0 | 0 |
| O z | 0.25 | 0.25 | 0.25 |
| Agreement factors | |||
| R exp (%) | 8.58 | 9.50 | 8.60 |
| R wp (%) | 9.68 | 8.95 | 9.72 |
| R p (%) | 7.46 | 7.11 | 7.53 |
| χ 2 | 1.447 | 1.762 | 1.415 |
| Cristallite sizes | |||
| D Sc (nm) | 30.369 | 26.478 | 39.583 |
| D W–H (nm) | 84.733 | 34.394 | 73.369 |
| Strain | 1.64 × 10⁻³ | 1.07 × 10⁻³ | 1.44 × 10⁻³ |
The unit cell representation, generated using Vesta software, showcases the atomic positions within the crystal lattice. Fig. 2 demonstrates the unit cell representation for one sample, LS1, as all three samples share the identical unit cell structure.
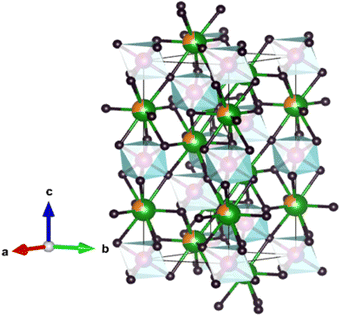 | ||
| Fig. 2 Unit cell of LS1 obtained by Vesta software: La (in green), Sr (in orange), octahedral site: Mn (in purple), Co (in red) and O (in black). | ||
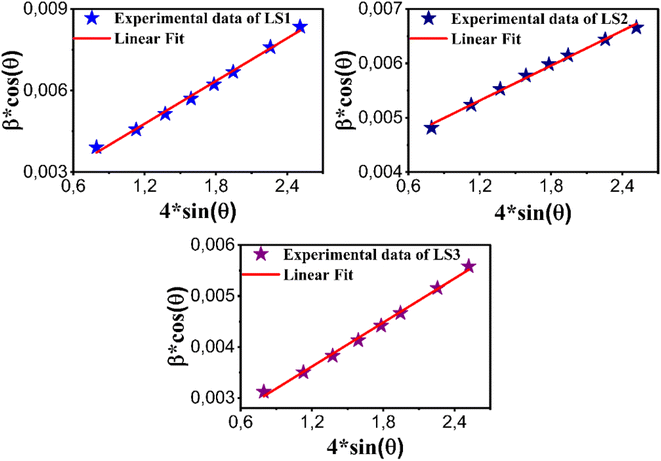
The calculated crystallite sizes using Scherrer formula,19 denoted as DSc, are presented in Table 1. The formula links the crystallite size to the peak broadening β, wavelength λ of the X-ray radiation, and the scattering angle θ using eqn (1), where K equals 0.9:
 | (1) |
Additionally, crystallite sizes were carried out using the Williamson–Hall plot method,20 as shown in Table 1, utilizing eqn (2):
 | (2) |
Fig. 3 illustrates representative Williamson–Hall plots for LS1, LS2 and LS3 compounds. Measurements by Scherrer method vary between 26.478 nm to 39.583 nm, while the Williamson–Hall method indicates sizes from 34.394 nm to 84.733 nm (see Table 1). These variations are likely to be due to different growth conditions, particularly gelation temperatures. The obtained strain values imply that distortions are minimized and that the samples have a well-ordered crystal structure with a minimum of imperfections. They also decrease as the crystallite sizes decrease.
3.2 Magnetic properties
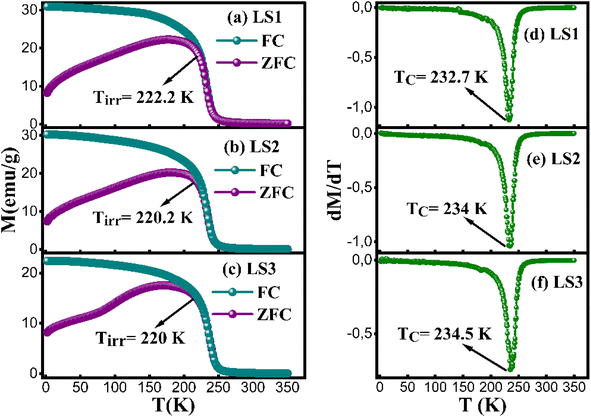
The magnetization behavior of LS1, LS2 and LS3 samples was examined under a 500 Oe magnetic field during both zero-field cooling (ZFC) and field-cooling (FC) processes. The MZFC(T) curves illustrate a rise in magnetization as temperature increases, reaching its peak at 178.2 K for LS1, 182.2 K for LS2 and 172.2 K for LS3. This behavior can be attributed to the presence of both ferromagnetic (FM) and antiferromagnetic (AFM) clusters or magnetic inhomogeneity.21 The decrease observed in the ZFC curve of LS3 sample near T = 100 K can be attributed to the presence of short range antiferromagnetic clusters,22 probably due to a high gelation temperature during the synthesis process. These clusters induce local variation in the magnetic interactions that affect the magnetic response of the compound.
Above these temperatures, the magnetization exhibits a rapid decline due to the ferromagnetic-paramagnetic phase transition, which leads to the disordering of magnetic moments influenced by thermal energy.
When the temperature drops to 222.2 K for LS1, 220.2 K for LS2 and 220 K for LS3, the ZFC and FC magnetization curves begin to separate. Upon surpassing this point at Tirr, ΔM the difference between MFC and MZFC, becomes apparent, providing evidence for the presence of an irreversible transition point.16
In comparison to previous research results, where La0.8Sr0.2Mn0.8Co0.2O3 synthesized using the sol–gel method exhibited a Curie temperature TC of 240 K,15 LS1, LS2 and LS3 samples yielded slightly lower TC values.
Fig. 4d–f show the Curie temperatures TC of the three samples, determined from the minimum of the first derivative curves dMFC(T)/dT as a function of T, which are approximately 232.7 K for LS1, 234 K for LS2 and 234.5 K for LS3. TC appears to be influenced by gel formation temperature, with an observed increase with increasing temperature. This correlation can be due to certain structural factors.
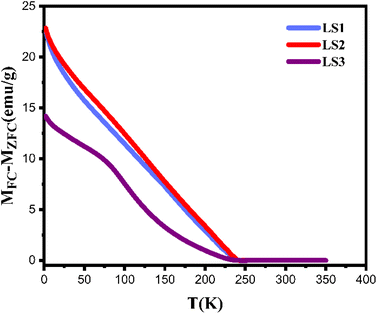
Fig. 5 illustrates the variation of ΔM as a function of temperature. ΔM values are high in all three samples at temperatures below TC, indicating that the magnetic field of 500 Oe was not sufficient for aligning the magnetic moments at low temperatures, which resulted in strong magnetic anisotropies in all three samples. In addition, ΔM decreases with gelation temperature increasing, indicating that the magnetic moments in LS3 are more ordered than those in LS1 and LS2.23
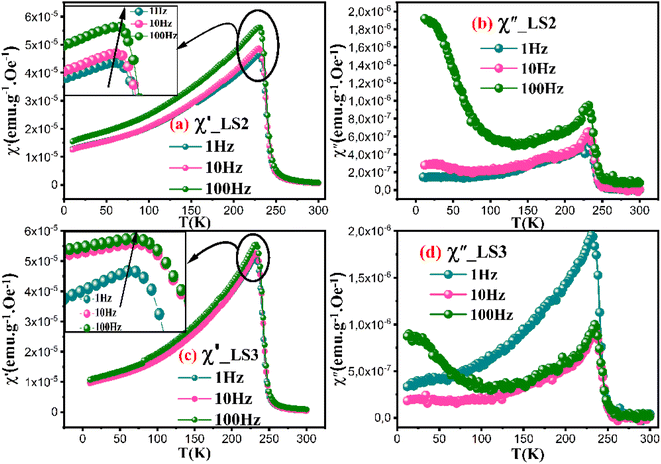
The real part of susceptibility χ′ for all three samples shows similar curves measured at 1 Hz, 10 Hz and 100 Hz frequencies under 500 Oe applied field as shown in Fig. 6a and c, (curves pertaining to LS1 are not shown because they are identical to those of LS2), indicating a negligible dependence of the applied magnetic field. As the applied frequency increases, χ′ curves exhibit a slight shift towards higher temperature values, suggesting a frequency-dependent influence on the magnetic ordering. The increase in χ′ up to a certain point, named Tf, followed by a gradual decrease implies the presence of magnetic transitions, which may be associated with a paramagnetic-ferromagnetic phase transition.24
A second peak is observed in the χ′′ versus temperature curves at low temperature as depicted in Fig. 6b and d. In order to check whether LS1, LS2 and LS3 exhibit spin-glass behavior, Mydosh parameter Ω = ΔTf/(TfΔlog(f)) needs to be calculated, Tf the temperature of the peak in ac susceptibility versus temperature also called the freezing temperature and f is the frequency.25,26Ω is found to be 0.005 for LS1 and LS2, and 0.006 for LS3. It is common that Ω for spin glass systems varies between 0.004 to 0.018,27 which is the case for LS1, LS2 and LS3 samples.
To understand the dynamic of magnetic nanoparticles and distinguish between superparamagnetic systems and those displaying a spin glass character, three models are commonly used. For the three models, we denote by: Ea the activation energy, KB the Boltzmann constant and τ = 1/2πf.
The Neel–Brown model for superparamagnetic non-interacting nanoparticles expresses τ as follow:28
 | (3) |
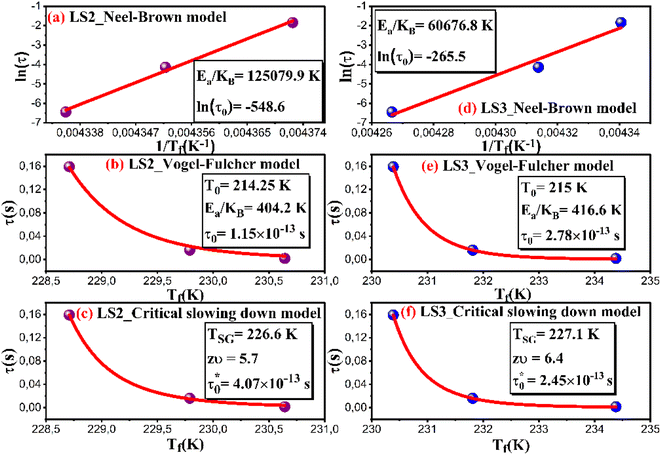
According to this model, τ0 for superparamagnetic systems is in the range of 10−9 to 10−13 s.28 As it can be seen in Fig. 7a and d, fitting the experimental data of LS2 and LS3 with eqn (3) gives an extremely small values of τ0 (τ0 ≪ 10−13 s), indicating that the samples do not exhibit superparamagnetic properties.
The Vogel–Fulcher model is used for interacting nanoparticles according to eqn (4):29
 | (4) |
Fig. 7 b and Fig. 7e show experimental data fitted with eqn (4), where Ea/KB is equal to 404.2 K and 416.6 K, T0 is equal to 214.25 K and 215 K and τ0 is found to be 1.15 × 10⁻¹³ s and 2.78 × 10⁻¹³ s for LS2 and LS3, respectively.
However, for spin glass systems τ0 is in the range of 10−11 to 10−13 s,30 confirming the spin glass behavior in the samples.
Tholence parameter, δTh, is derived in order to verify the nature of the spin interaction using the following formula:29
 | (5) |
Calculated values of the δTh parameter using T0 values obtained from fits with eqn (4) are listed in Table 2. Theoretically, in the medium to strong interaction regime for spin glass system, δTh ranges between 0.07 and 0.3,28 which is the case for the samples in this work.
| Frequency | δ Th(LS2) | δ Th(LS3) |
|---|---|---|
| 1 Hz | 0.07 | 0.072 |
| 10 Hz | 0.072 | 0.078 |
| 100 Hz | 0.076 | 0.09 |
The conventional critical slowing down model is described by the following equation:29
 | (6) |
For spin glass systems, zυ ranging from 4 to 13 and  ranges from 10−11 to 10−13 s.31
From the fitted experimental data with eqn (6) as shown in Fig. 7c and f,  is found to be 4.07 × 10⁻¹³ s and 2.45 × 10⁻¹³ s, zυ is found to be 5.7 and 6.4, TSG is found to be 226.6 K and 227.1 K for LS2 and LS3, respectively. These results confirm the spin glass behavior in LS1, LS2 and LS3 samples.
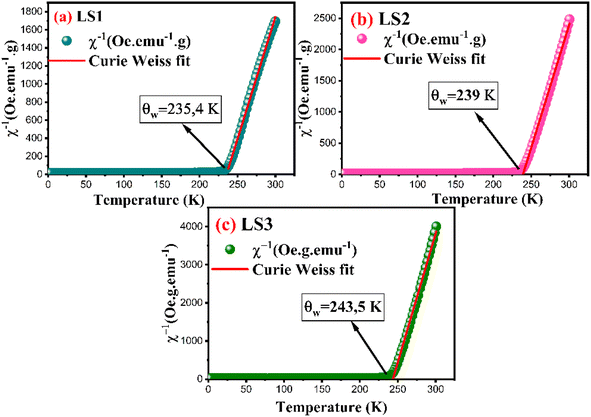 | ||
| Fig. 8 Inverse susceptibility of LS1, LS2 and LS3 derived from magnetization measurements at 500 Oe. | ||
In the case of a ferromagnetic material beyond the transition, the susceptibility follows the Curie–Weiss law:
 | (7) |
 | (8) |
 | (9) |
The theoretical value of the effective moment can be calculated using the general formula:
 | (10) |
For transition metals with ndx electron configuration, the expression of the effective moment is given as:
 | (11) |
Considering g = 2, theoretical effective moments μeff of Mn3+(S = 2), Mn4+(S = 3/2) and Co3+(S = 2) are respectively 4.9μB, 3.9μB and 4.9μB. Therefore, the values of the total theoretical effective moments of different compounds can be obtained using the following formula:
 | (12) |
For LS1, LS2 and LS3 samples, the effective moment is expressed as:
 | (13) |
Table 3 presents the values of the experimental Curie constant, Weiss temperature, the experimental and theoretical effective moments of LS1, LS2 and LS3 samples.
| Sample | C (K emu Oe−1 mol−1) | θ ω (K) | μ theff (μB) | μ expeff (μB) |
|---|---|---|---|---|
| LS1 | 8.596 | 235.4 | 4.712 | 8.293 |
| LS2 | 5.915 | 239 | 4.712 | 6.879 |
| LS3 | 3.436 | 243.5 | 4.712 | 5.243 |
Experimental values of the effective magnetic moments for the three samples, derived from fitting the χ−1 as a function of temperature using eqn (7), are consistently higher than the theoretical values, which can be predominantly attributed to the presence of ferromagnetic inhomogeneities within the paramagnetic phase.32,33
The hypothesis is supported by the θω values, which exceed the Curie temperature for each sample.
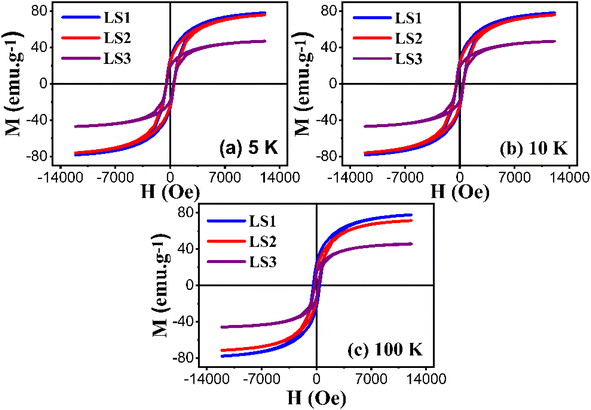
LS1, LS2 and LS3 samples require a relatively high magnetic field for attaining saturation magnetization. In this case, hysteresis curves can be fitted in order to quantify saturation, remanence and coercivity at low temperatures using the following equation:34
 | (14) |
Furthermore, the utilization of this equation for fitting enables the determination of the magnetic susceptibility values, along with the relative fractions of ferromagnetic and antiferromagnetic contributions that are present in the LS1, LS2 and LS3 samples. Fig. 10 displays an example of hysteresis curves (at 5 K) that have been fitted with eqn (14).
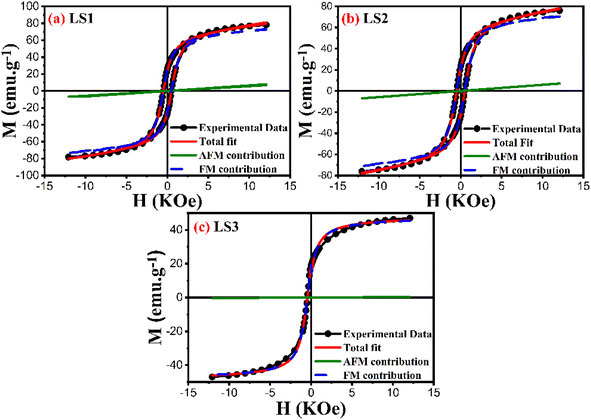 | ||
| Fig. 10 Hysteresis curves at 5 K of LS1 (a), LS2 (b) and LS3 (c) fitted with eqn (14). | ||
Table 4 shows the results of the analysis of the low temperature hysteresis carried out at 5, 10 and 100 K using eqn (14). The low coercivity observed indicates that the samples have a soft ferromagnetic nature. The hysteresis cycle areas are also significantly reduced, suggesting lower energy losses during the cycle, which is important for the magnetic refrigeration. In addition, the ferromagnetic behavior dominates in the samples, as indicated by the higher percentages of ferromagnetic contribution compared to the antiferromagnetic contribution.
| Temperature | 5 K | 10 K | 100 K | ||||||
|---|---|---|---|---|---|---|---|---|---|
| Sample | LS1 | LS2 | LS3 | LS1 | LS2 | LS3 | LS1 | LS2 | LS3 |
| a (Oe) | 1114.05 | 1190.71 | 1062.06 | 703.79 | 648.94 | 241.91 | 794.09 | 772.33 | 769.37 |
| b (Oe2) | 832![[thin space (1/6-em)]](https://www.rsc.org/images/entities/char_2009.gif) 700.21 700.21 |
909![[thin space (1/6-em)]](https://www.rsc.org/images/entities/char_2009.gif) 909.93 909.93 |
836![[thin space (1/6-em)]](https://www.rsc.org/images/entities/char_2009.gif) 376.03 376.03 |
286![[thin space (1/6-em)]](https://www.rsc.org/images/entities/char_2009.gif) 112.41 112.41 |
232![[thin space (1/6-em)]](https://www.rsc.org/images/entities/char_2009.gif) 981.23 981.23 |
32![[thin space (1/6-em)]](https://www.rsc.org/images/entities/char_2009.gif) 988.33 988.33 |
339![[thin space (1/6-em)]](https://www.rsc.org/images/entities/char_2009.gif) 048.38 048.38 |
303![[thin space (1/6-em)]](https://www.rsc.org/images/entities/char_2009.gif) 133.11 133.11 |
358![[thin space (1/6-em)]](https://www.rsc.org/images/entities/char_2009.gif) 969.05 969.05 |
| k (erg cm3) | 120![[thin space (1/6-em)]](https://www.rsc.org/images/entities/char_2009.gif) 922.33 922.33 |
105![[thin space (1/6-em)]](https://www.rsc.org/images/entities/char_2009.gif) 419.93 419.93 |
121![[thin space (1/6-em)]](https://www.rsc.org/images/entities/char_2009.gif) 188.93 188.93 |
71![[thin space (1/6-em)]](https://www.rsc.org/images/entities/char_2009.gif) 885.86 885.86 |
62![[thin space (1/6-em)]](https://www.rsc.org/images/entities/char_2009.gif) 560.03 560.03 |
13![[thin space (1/6-em)]](https://www.rsc.org/images/entities/char_2009.gif) 129.59 129.59 |
75![[thin space (1/6-em)]](https://www.rsc.org/images/entities/char_2009.gif) 344.74 344.74 |
69![[thin space (1/6-em)]](https://www.rsc.org/images/entities/char_2009.gif) 216.69 216.69 |
45![[thin space (1/6-em)]](https://www.rsc.org/images/entities/char_2009.gif) 376.60 376.60 |
| H a (Oe) | 3534.19 | 3694.41 | 3541.98 | 2071.64 | 1869.42 | 679.58 | 2255.16 | 2132.37 | 2320.46 |
| χ (emu g−1 Oe−1) | 5.65 ×10⁻⁴ | 5.79 ×10⁻⁴ | 2.87 ×10⁻⁵ | 6.02 × 10⁻⁴ | 5.78 × 10⁻⁴ | 4.53 × 10⁻⁴ | 4.67 × 10⁻⁴ | 4.52 × 10⁻⁴ | 3.66 × 10⁻⁴ |
| H c (Oe) | 511.93 | 482.01 | 466.08 | 477.14 | 477.54 | 426.58 | 253.23 | 260.53 | 242.85 |
| M sFM (emu g−1) | 68.43 | 57.07 | 47.17 | 66.93 | 66.93 | 38.64 | 66.82 | 64.92 | 39.11 |
| M rFM (emu g−1) | 24.81 | 18.88 | 15.53 | 23.73 | 20.97 | 16.64 | 14.17 | 12.52 | 11.03 |
| % FM | 91.42 | 90.86 | 99.24 | 99.94 | 99.94 | 99.99 | 99.95 | 99.95 | 99.96 |
| % AFM | 8.58 | 9.14 | 0.76 | 9.11 | 0.06 | 0.01 | 0.05 | 0.05 | 0.04 |
To study the effect of magnetic anisotropy on the properties of the samples and to determine the anisotropy parameters (the anisotropy constant K and the anisotropy field Ha), it is required to adjust the hysteresis curves to higher fields (H ≫ HC) using the law of approach to saturation,35 defined by eqn (15):
 | (15) |
 represents the contributions of inclusions/microstress,
  represents the contribution of magnetocrystalline anisotropy and χH is the forced magnetization term.
The constant b for a cubic system is related to the anisotropy constant K and to the magnetization of saturation Ms by the following equation:
 | (16) |
 | (17) |
As shown in Table 4, for each of the samples, the K value is higher at 5 K (of the order of 105 erg cm3) than at 10 and 100 K, indicating that the samples are more magnetically ordered at 5 K than at 10 and 100 K. Also, at 10 and 100 k, the values of the anisotropy constant decrease with increasing gelation temperature, whereas at 5 K the anisotropy values are approximately the same for all three samples.
At ambient temperature (T = 300 K), the hysteresis curves for LS1, LS2 and LS3 exhibit clear paramagnetic behavior. This observation is supported by the positive susceptibility values, which are expected to be in the range of 10−3 to 10−5 for all three samples. The determination of χ can be graphically obtained from the slope of M versus H curves as it is presented in Fig. 11. The χ values are respectively 4.3 × 10⁻⁴ emu g−1 Oe−1 for LS1, 3.7 × 10⁻⁴ emu g−1 Oe−1 for LS2 and 2.6 × 10⁻⁴ emu g−1 Oe−1 for LS3.
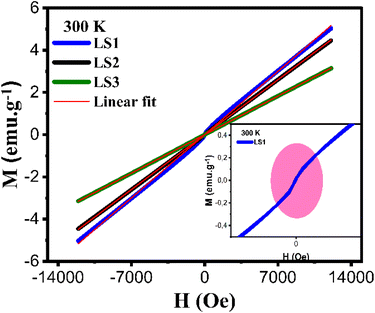 | ||
| Fig. 11 Hysteresis curves at 300 K of LS1, LS2 and LS3. Inset: Enlargement of the hysteresis deviation region of the sample LS1. | ||
The hysteresis curve of sample LS1 exhibits a slight deviation, as illustrated in Fig. 11, which could potentially be attributed to the presence of ferromagnetic clusters.
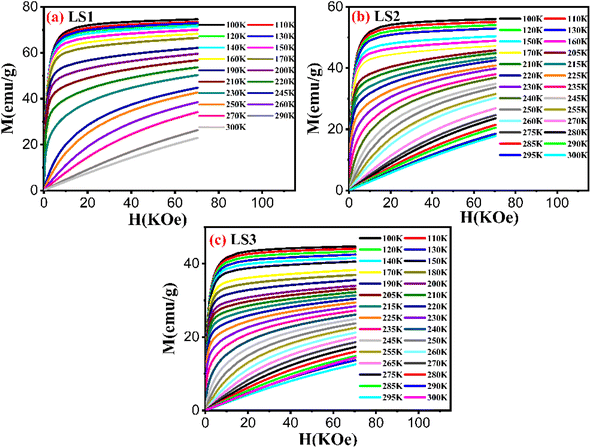 | ||
| Fig. 12 Variation of magnetization as a function of applied magnetic field of LS1 (a), LS2 (b) and LS3 (c) samples. | ||
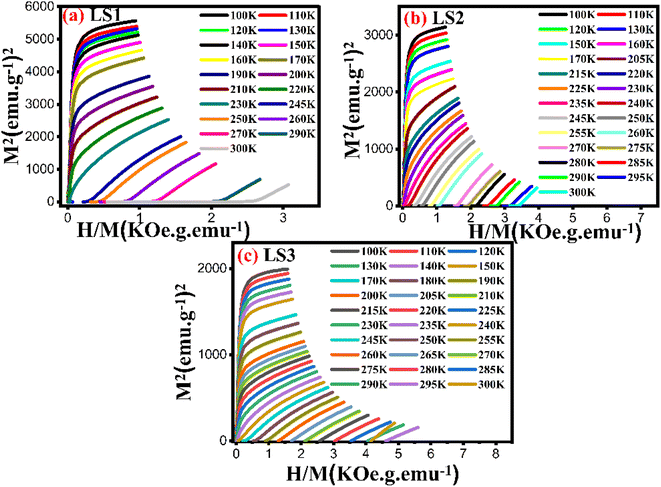
The M–H isothermal curves of the three samples did not display any S-shaped magnetization indicating that all samples exhibited a second-order magnetic transition.16,36 To confirm this supposition, Arrot plots were generated37 as shown in Fig. 13.
The Arrot plots of the three samples did not exhibit a series of parallel lines, as expected for long-range ferromagnetic order. Instead, they showed nonlinearity suggesting the presence of short-range magnetic order.
The curves in both temperature regions, T < TC and T > TC, for low values of H/M are set in converse orientations, confirming the ferromagnetic-paramagnetic transition.14
The nature of the magnetic transition was verified using Banjeree criterion. The slopes of the Arrot plots generated for LS1, LS2, and LS3 remained positive over the entire temperature range measured near TC, indicating the presence of a second order-phase transition for each sample, as determined by the Banjeree criterion.38
3.3 Magnetocaloric effect
Although magnetometers are primarily designed to measure the total magnetization M directly, the entropy change can be calculated from the isothermal magnetization M(H)T or the isofield magnetization M(T)H using the Maxwell relation:39
 | (18) |
Fig. 14 depicts the variation of magnetic entropy change ΔS as a function of temperature for LS1, LS2 and LS3 at different magnetic field values H = 0.5, 1, 1.5, 2, 3, 4, 5, 6 and 7 T.
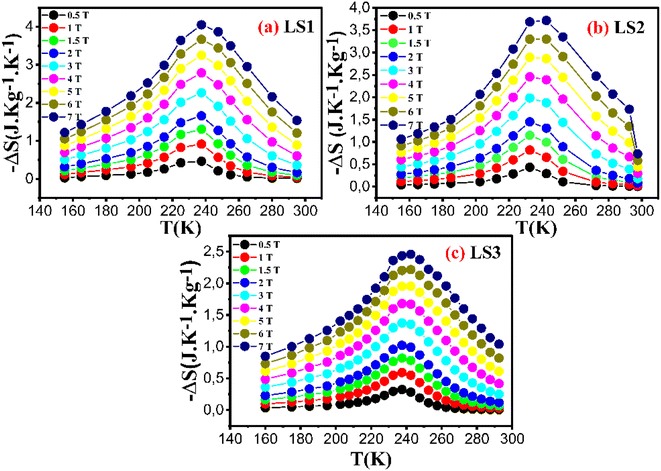 | ||
| Fig. 14 Variation of magnetic entropy change of LS1 (a), LS2 (b) and LS3 (c) as a function of temperature at different magnetic field values ranging from 0.5 T to 7 T. | ||
The temperature dependent behavior of (−ΔS) shows an initial rise until reaching a certain point around the Curie temperature, followed by a gradual decline. This along with the observed increase in (−ΔS) with higher magnetic field values, suggests that the samples are good candidates for application such as magnetic refrigeration.
Table 5 and Fig. 14 show that the sample formed at the lower gelation temperature, LS1, has the highest (−ΔS) value for each value of the applied magnetic fields, indicating that the gel formation temperature has a significant influence on the magnetic properties of the samples.
| Sample | H (T) | |−ΔSmax| (J kg−1 K−1) | RCP (J kg−1) | Ref. |
|---|---|---|---|---|
| Gd | 2 | 5 | 196 | 40 |
| Gd | 5 | 10.2 | 410 | 41 |
| La0.67Sr0.33MnO3 | 5 | 1.69 | 211 | 42 |
| La0.84Sr0.16MnO3 | 5 | 5.85 | 240 | 43 |
| La0.87Sr0.13MnO3 | 5 | 5.80 | 232 | 43 |
| La0.845Sr0.155Mn0.98Co0.02O3 | 1.35 | 2.25 | 52 | 44 |
| La0.67Sr0.33Mn0.9Co0.1O3 | 5 | 3.1 | 156 | 45 |
| La0.8Sr0.2Mn0.8Co0.2O3 | 7 | 2.36 | — | 16 |
| LS1 | 2 | 1.66 | 78.41 | This work |
| 5 | 3.25 | 209.83 | ||
| LS2 | 2 | 1.45 | 75.06 | This work |
| 5 | 2.89 | 191.09 | ||
| LS3 | 2 | 1.02 | 43.54 | This work |
| 5 | 1.95 | 110.83 |
Also, |−ΔSmax| for LS1 and LS2 (3.24 and 2.89 J kg−1 K−1 respectively) under applied magnetic field of 5 T remains greater than |−ΔSmax| of La0.8Sr0.2Mn0.8Co0.2O3 (2.36 J kg−1 K−1)16 under an applied magnetic field of 7 T. This result reveals the influence of the process of synthesis on the magnetic properties of the samples and suggests that LS1 and LS2 could be the best performers in the field of magnetic cooling.
The relative cooling power RCP, also known as the cooling coefficient of performance, can be determined by multiplying the maximum magnetic entropy change by the full width at half-maximum δTFWHM of the ΔSmax(T, H) curve following the expression below:41
| RCP = −ΔSmax∂TFWHM | (19) |
Table 5 presents The RCP values, and Fig. 15 illustrates the variation of RCP coefficient of the three samples as a function of gelation temperature. The results indicate that the sample LS1, with a lower gelation temperature, shows higher RCP values (∼210 J kg−1 for LS1, 191 J kg−1 for LS2, and 111 Jkg−1 for LS3 under 5 T).
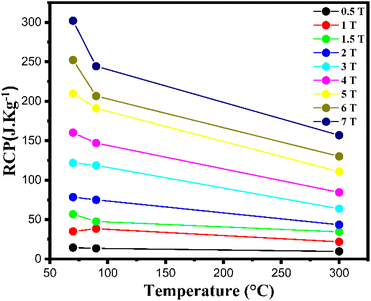 | ||
| Fig. 15 Variation of RCP coefficient as a function of gelation temperature of LS1, LS2 and LS3 samples at different magnetic field ranging from 0.5 T to 7 T. | ||
In addition, as shown in Table 5, the RCP values for LS1, which are approximately 50% of those for pure Gd, position our compounds as promising candidates for potential use in magnetic refrigeration applications.
For a better evaluation of magnetocaloric materials for solid state cooling applications, the study of temperature average entropy change (TEC) is required. Unlike traditional measures such as ΔS and RCP, the TEC parameter is proposed as a more suitable metric to determine the performance of a magnetocaloric material and to provide a more comprehensive analysis by considering entropy changes over a range of temperatures.
This parameter can be readily determined from the obtained ΔS (T, H) curves using the following equation:46
 | (20) |
Fig. 16a and b show the dependence of the TEC parameter on ΔTH–C for LS1, LS2 and LS3 samples at 2 T and 5 T respectively.
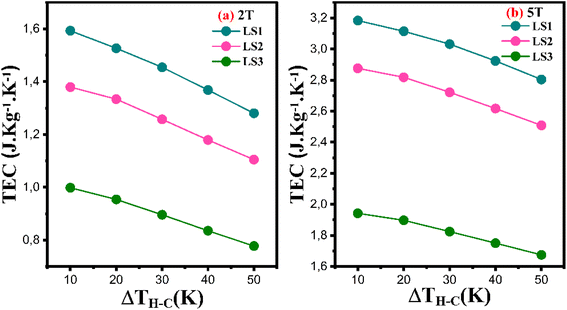 | ||
| Fig. 16 The temperature average entropy change (TEC) as a function of ΔTH–C for LS1, LS2 and LS3 samples calculated for ΔH = 2 T (a) and ΔH = 5 T (b). | ||
As can be clearly seen from Fig. 16, the TEC values decrease with increasing gel formation temperature and increase with increasing ΔH. They are maximal for the LS1 compound, especially for ΔH = 5 T and ΔTH–C = 10 K, where TEC ∼3.2 J kg−1 K−1, making them candidates for magnetocaloric refrigeration.
Furthermore, as ΔTH–C increases, the TEC values decrease for all three samples at 2 T and 5 T. this behavior is observed in other manganite compounds.47,48
4 Conclusion
The sol–gel synthesis method was successfully applied to the preparation of La0.8Sr0.2Mn0.8Co0.2O3 (LS1, LS2 and LS3) samples with a rhombohedral perovskite structure. In particular, lower gelation temperature were found to improve the structural stability of the samples.The dynamic magnetic response studied by AC magnetic susceptibility reveals that the LS1, LS2 and LS3 samples exhibit spin glass behavior associated with medium to strong interaction between the magnetic nanoparticles of the samples.
In addition, magnetization measurements and hysteresis curves revealed the soft ferromagnetic behavior of the prepared samples, characterized by low coercive fields. Remarkably, the samples showed promising magnetocaloric effects, indicating their potential for applications in magnetic refrigeration. In particular, LS1 synthesized at the lower gelation temperature showed greater magnetocaloric effects. These results demonstrate the essential role of optimizing the gelation temperature in regulating the magnetic properties and cooling performance of the materials.
Conflicts of interest
There are no conflicts to declare.Acknowledgements
The authors would like to acknowledge the contribution of Anna Bajorek from the A. Chelkowski Institute of Physics, University of Silesia, for conducting the magnetic measurements.References
- P. Narwat, R. J. Choudhary and A. Mishra, Investigating magnetic and magneto-transport properties of ferromagnetic (FM) structure and antiferromagnetic/ferromagnetic (AFM/FM) heterostructures, Physica B, 2023, 665, 415048 CrossRef CAS.
- I. Dhahri, M. Ellouze, T. Mnasri, E. K. Hlil and R. Jotania, Structural, magnetic, magnetocaloric and critical exponents of oxide manganite La0.7Sr0.3Mn0.95Fe0.05O3, J. Mater. Sci. Mater. Electron., 2020, 31, 12493–12501 CrossRef CAS.
- K. Sunita and B. Sonali, Synthesis, physical properties, and biomedical applications of magnetic nanoparticles: a review, Prog. Biomater., 2022, 11, 1–26 CrossRef.
- H. Chouaibi, B. Rivas-Murias, M. Smari, J. Massoudi, E. Dhahri and V. Salgueiriño, Unraveling the multi-featured magnetic behavior of Nd0.75Sr0.25CoO3 perovskite nanocrystals annealed at different temperatures, J. Alloys. Comp., 2021, 874, 159870 CrossRef CAS.
- D. Deeksha, P. Kour, I. Ahmed, S. Sharma, S. K. Sharma, K. Yadav and Y. K. Mishra, Transition metal based perovskite oxides: emerging electrocatalysts for oxygen evolution reaction, ChemCatChem, 2023, 15, e202300040 CrossRef.
- X. Zhuojia, Z. Zhengguang, H. Bangrong, L. Lilin and M. Zheng, Research Progress of Doped Manganite Materials in Magnetic Refrigeration, Front. Mater., 2021, 8, 771941 CrossRef.
- A. M. Tishin and Y. I. Spichkin, The Magnetocaloric Effect and its Applications, CRC Press, Boca Raton, FL, 2016 Search PubMed.
- C. Zener, Interaction between the d-Shells in the Transition Metals. II. Ferromagnetic Compounds of Manganese with Perovskite Structure, Phys. Rev., 1951, 82, 403 CrossRef CAS.
- U. K. Sinha, B. Das and P. Padhan, Interfacial reconstruction in La0.7Sr0.3MnO3 thin films: giant low-field magnetoresistance, Nanoscale Adv., 2020, 308, 2792–2799 RSC.
- J. Liu, W. Q. Wang, H. Y. Wu, Y. Tian, F. Z. Cao and J. J. Zhao, Electromagnetic Property of Co-doped La0.8Sr0.2MnO3 Perovskite Manganese Oxides, J. Inorg. Mater., 2018, 33, 1237–1247 CrossRef.
- P. Anil Kumar, A. Nag, R. Matheiu, R. Das, S. Ray, P. Nordblad, A. Hossain, D. Cherian, D. Alba Venero, L. DeBeer-Schmitt, O. Karis and D. D. Sarma, Magnetic polarons and spin-glass behavior in insulating La1-xSrxCoO3 (x = 0.125 and 0.15), Phys. Rev. Res., 2020, 2, 043344 CrossRef CAS.
- M. C. Ramírez Camacho, C. F. Sánchez Valdés, M. Curiel, J. L. Sánchez Llamazares, J. M. Siqueiros and O. Raymond Herrera, Superparamagnetic state in La0.7Sr0.3MnO3 thin films obtained by rf-sputtering, Sci. Rep., 2020, 10, 2568 CrossRef.
- T. L. Phan, T. D. Thanh and S. C. Yu, Influence of Co doping on the critical behavior of La0.7Sr0.3Mn1−xCoxO3, J. Alloys Compd., 2014, 615, S247–S251 CrossRef CAS.
- T. D. Thanh, D. C. Linh, T. V. Manh, T. A. Ho, T. Phan and S. C. Yu, Coexistence of short- and long-range ferromagnetic order in La0.7Sr0.3Mn1−xCoxO3 compounds, J. Appl. Phys., 2015, 117, 17C101 CrossRef.
- J. Kuo and G. Sheng-Kai, Chin. Phys. B, 2009, 18, 3035 CrossRef.
- J. Liu, W. Wang and H. Wu, et al., Negative Magnetic Entropy Change and Critical Behavior of Manganite La0.8Sr0.2Mn1−xCoxO3 (x = 0, 0.2), J. Low Temp. Phys., 2019, 195, 81–95 CrossRef CAS.
- J. Rodríquez-Carvajal and T. Roisnel, Line Broadening Analysis Using FullProf: Determination of Microstructural Properties, Mater. Sci. Forum., 2004, 443–444, 123–126 Search PubMed.
- T. A. Salaheldin, A. A. Ghani and A. E. R. T. AboZied, et al., Synthesis, structural, magnetic and magnetocaloric properties of La0.8Sr0.2MnO3 nanoparticles, J. Therm. Anal. Calorim., 2018, 136, 621–627 CrossRef.
- P. Scherrer, Bestimmung der Größe und der inneren Struktur von Kolloidteilchen mittels Röntgenstrahlen, Nachrichten von der Gesellschaft der Wissenschaften zu Göttingen, Math.-Phys. Kl., 1918, 2, 98–100 Search PubMed.
- Y. T. Prabhu, K. V. Rao, V. S. S. Kumar and B. S. Kumari, World J. Nano Sci. Eng., 2014, 4, 21–28 CrossRef CAS.
- J. Moradi, M. E. Ghazi, M. H. Ehsani and P. Kameli, Structural and magnetic characterization of La0.8Sr0.2MnO3 nanoparticles prepared via a facile microwave-assisted method, J. Solid State Chem., 2014, 215, 1–7 CrossRef CAS.
- C. Shang, Z. Xia, H. Dai, Y. Wang, D. Liu and X. Zhai, Fe doping induced cluster/spin glass state and metamagnetic transition in phase separated La0.5Sr0.5Mn1−xFexO3, J. Magn. Magn. Mater., 2024, 590, 171622 CrossRef CAS.
- H. Thi Anh, N. N. Huyen and P. D. Thang, Influence of Sr Doping on Magnetic and Magnetocaloric Properties of Nd0.6Sr0.4MnO3, VNU J. Sci. Math. – Phys., 2020, 36, 2588–1124 Search PubMed.
- D. Yang, P. Zhao, S. Huang, T. Yang and D. Huo, Ferrimagnetism, resistivity, and magnetic exchange interactions in double perovskite La2CrMnO6, Results Phys., 2019, 12, 344–348 CrossRef.
- Y. Su, Z. Chen, Y. Li, D. Deng, S. Cao and J. Zhang, Effect of Bivalent Cation Ca-Doping on Magnetic Properties in Multiferroic YMnO3 Manganites, J. Supercon. Novel Magn., 2010, 23, 501–506 CrossRef CAS.
- N. N. Loshkareva, E. V. Mostovshchikova, A. V. Korolyov, S. V. Naumov, B. A. Gizhevskii, N. I. Solin, L. I. Naumova, S. V. Telegin and L. V. Elokhina, Magnetism and infrared magnetotransmission of Nd0.5Sr0.5MnO3 manganite in nanostate, J. Magn. Magn. Mater., 2013, 341, 49–55 CrossRef CAS.
- J. A. Mydosh, Spin Glasses: an Experimental Introduction, Taylor & Francis, London, 1993 Search PubMed.
- J. L. Dormann, D. Fiorani and E. Tronc, J. Magn. Magn. Mater., 1999, 202, 251 CrossRef CAS.
- J. Massoudi, M. Smari, K. Khirouni, E. Dhahri and L. Bessais, J. Magn. Magn. Mater., 2021, 528, 167806 CrossRef CAS.
- D. Gangwar and C. Rath, Phys. Chem. Chem. Phys., 2020, 22, 14236–14245 RSC.
- J. Souletie and J. L. Tholence, Phys. Rev. B: Condens. Matter Mater. Phys., 1985, 32, 516 CrossRef CAS.
- H. Terashita and J. J. Neumeier, Bulk magnetic properties of La1−xCaxMnO3 (0⩽x⩽0.14): Signatures of local ferromagnetic order, Phys. Rev. B: Condens. Matter Mater. Phys., 2005, 71, 134402 CrossRef.
- S. Zemni, A. Gasmi, M. Boudard and M. Oumezzine, Effect of nominal strontium deficiency on the structure and the magnetic properties of La0.6Sr0.4−δMnO3 manganese perovskites, Mater. Sci. Eng. B, 2007, 144, 117–122 CrossRef CAS.
- Y. Marouani, A. Mabrouki, R. Dhahri, E. Dhahri and B. F. O. Costa, Experimental and theoretical studies of structural, magnetic and electronic properties of Ba1-xSrxFe12O19 (x = 0, 0.5, 1) hexaferrites, Inorg. Chem. Commun., 2022, 136, 109163 CrossRef CAS.
- B. D. Cullity and C. D. Graham, Introduction to Magnetic Materials, 2nd edn, John Wiley and Sons, Hoboken, NJ, 2011 Search PubMed.
- Y. Zhang, H. Wang, Y. Zhang, Y. Ge and S. H. I. Hua, Phys. B, 2013, 410, 1 CrossRef.
- A. Arrott, Criterion for Ferromagnetism from Observations of Magnetic Isotherms, Phys. Rev., 1957, 108, 1394 CrossRef CAS.
- B. K. Banerjee, On a generalised approach to first and second order magnetic transitions, Phy. Lett., 1964, 12, 16–17 CrossRef.
- M. H. Phan and S. C. Yu, Review of the magnetocaloric effect in manganite materials, J. Magn. Magn. Mater., 2007, 308, 325–340 CrossRef CAS.
- V. K. Pecharsky and K. A. Gschneidner Jr, Giant Magnetocaloric Effect in Gd5(Si2Ge2), Phys. Rev. Lett., 1997, 78, 4494 CrossRef CAS.
- K. A. Gschneidner Jr, V. K. Pecharsky and A. O. Tsokol, Recent developments in magnetocaloric materials, Rep. Prog. Phys., 2005, 68, 1479 CrossRef.
- D. T. Morelli, A. M. Mance, J. V. Mantese and A. L. Micheli, Magnetocaloric properties of doped lanthanum manganite films, J. Appl. Phys., 1996, 79, 373–375 CrossRef CAS.
- A. Szewczyk, H. Szymczak, A. Wiśniewski, K. Piotrowski, R. Kartaszyński, B. Dabrowski, S. Koleśnik and Z. Bukowski, Magnetocaloric effect in La1−xSrxMnO3 for x=0.13 and 0.16, Appl, Phys. Lett., 2000, 77, 1026–1028 CAS.
- N. Chau, H. N. Nhat, N. H. Luong, D. Le Minh, N. D. Tho and N. N. Chau, Structure, magnetic, magnetocaloric and magnetoresistance properties of La1− xPbxMnO3 perovskite, Physica B: Cond. Matter., 2003, 327, 270–278 CrossRef CAS.
- C. P. Reshmi, S. Savitha Pillai, M. Vasundhara, G. R. Raji and K. G. Suresh, ManojRaamaVarma, Co-existence of magnetocaloric effect and magnetoresistance in Co substituted La0.67Sr0.33MnO3 at room temperature, J. Appl. Phys., 2013, 114, 033904 CrossRef.
- V. Ya. Mitrofanov, S. Kh. Estemirova and G. A. Kozhinaa, Effect of oxygen content on structural, magnetic and magnetocaloric properties of (La0.7Pr0.3)0.8Sr0.2Mn0.9Co0.1O3±δ, J. Magn. Magn. Mater., 2019, 476, 199–206 CrossRef CAS.
- Z. Juan, L. Lirong and W. Gui, Synthesis and magnetocaloric properties of La0.85K0.15MnO3 nanoparticles, Adv. Powder Technol., 2011, 22, 68 CrossRef.
- S. Choura-Maatar, M. Nofal Muaffaq, R. M'nassri, W. Cheikhrouhou-Koubaa, N. Chniba-Boudjada and A. Cheikhrouhou, Enhancement of the magnetic and magnetocaloric properties by Na substitution for Ca of La0.8Ca0.2MnO3 manganite prepared via the Pechini-type sol–gel process, J. Mater. Sci.: Mater. Electron., 2020, 31, 1634–1645 CrossRef CAS.
| This journal is © The Royal Society of Chemistry 2024 |

