 Open Access Article
Thermally modified nanocrystalline snail shell adsorbent for methylene blue sequestration: equilibrium, kinetic, thermodynamic, artificial intelligence, and DFT studies
Abisoye Abidemi Adaramajaa,
Abayomi Bamisaye *a,
Shakirudeen Modupe Abatia,
Kayode Adesina Adegoke
 *b,
Morenike Oluwabunmi Adesina
 acd,
Ayodeji Rapheal Igee,
Oluwatobi Adelekef,
Mopelola Abidemi Idowug,
Abel Kolawole Oyebamiji
 h and
Olugbenga Solomon Bello
 i
i
aDepartment of Chemistry, Faculty of Natural and Applied Sciences, Lead City University, Ibadan, Oyo State, Nigeria. E-mail: abayomibamisaye@gmail.com
bDepartment of Industrial Chemistry, First Technical University, Ibadan, Nigeria. E-mail: kwharyourday@gmail.com
cAfrican Centre of Excellence for Water and Environment Research (ACEWATER), Ede, Osun State, Nigeria
dRedeemer's University, PMB 230, Ede, Osun State, Nigeria
eFaculty of Civil Engineering and Environmental Sciences, Białystok University of Technology, Wiejska 45E, 15-351 Białystok, Poland
fDepartment of Mechanical Engineering Science, University of Johannesburg, Johannesburg, South Africa
gDepartment of Chemistry, College of Physical Sciences, Federal University of Agriculture, Abeokuta, Nigeria
hIndustrial Chemistry Programme, Bowen University, PMB 284, Iwo, Osun State, Nigeria
iDepartment of Pure and Applied Chemistry, Ladoke Akintola University of Technology, P. M. B. 4000, Ogbomoso, Oyo State, Nigeria
First published on 19th April 2024
Abstract
In recent years, the quest for an efficient and sustainable adsorbent material that can effectively remove harmful and hazardous dyes from industrial effluent has become more intense. The goal is to explore the capability of thermally modified nanocrystalline snail shells (TMNSS) as a new biosorbent for removing methylene blue (MB) dye from contaminated wastewater. TMNSS was employed in batch adsorption experiments to remove MB dye from its solutions, taking into account various adsorption parameters such as contact time, temperature, pH, adsorbent dosage, and initial concentration. SEM, EDS, XRD, and FTIR were used to characterize the adsorbent. The study further developed and adopted adaptive neuro-fuzzy inference system (ANFIS) and density functional theory (DFT) studies to holistically examine the adsorption process of MB onto the adsorbent. EDX and FTIR confirm the formation of CaO with a sharp peak at 547 cm−1, and C–O and O–H are present, as well. SEM and XRD show an irregularly shaped highly crystalline nanosized (65 ± 2.81 nm) particle with a lattice parameter value of 8.611617 Å. The adsorption efficiency of 96.48 ± 0.58% was recorded with a pH of 3.0 and an adsorbent dose of 10 mg at 30 °C. The findings from the study fit nicely onto Freundlich isotherms, with Qm = 31.7853 mg g−1 and R2 = 0.9985. Pseudo-second-order kinetics recorded the least error value of 0.8792 and R2 = 0.9868, thus indicating chemisorption and multilayer adsorption processes. The exothermic and spontaneous nature of the adsorption process are demonstrated by ΔH° and ΔG°. The performance of the ANFIS-based prediction of removal rate, which was demonstrated by a root mean square error (RMSE) value of 2.2077, mean absolute deviation (MAD) value of 1.1429, mean absolute error (MAE) value of 1.8786, and mean absolute percentage error (MAPE) value of 2.0178, revealed that the ANFIS model predictions and experimental findings are in good agreement. More so, DFT provides insights into the molecular interactions between MB and the adsorbent surface, with a calculated adsorbate–adsorbent binding affinity value of −1.3 kcal mol−1, thus confirming the ability of TMNSS for MB sequestration. The findings of this study highlight the promising potential of thermally modified nanocrystalline snail shells as sustainable and efficient adsorbents for MB sequestration.
1 Introduction
Increased economic activity is the main cause of water pollution, and scientists are highly concerned about the resultant dangers to the ecosystem, plants, and animals.1 Most significant is the ongoing increase in pollution of water bodies through the release of dyes and other organic pollutants from industries, facilitated by the rapid increase in global population.2 Due to the color's propensity to cling on even after standard removal techniques, managing water contamination, as a result, is challenging.3 Dye pollution in water tends to block light absorption, whereby photosynthesis is significantly impacted.4–6 The cleansing of wastewater from color dyestuff becomes significant for the environment due to the widespread use of dye compounds and their various dangerous and harmful byproducts.7Several researchers have used a variety of approaches to remove these contaminants in their investigations to lessen the impact of pollution on the water environment.8 The majority of these methods fall into one of three categories, which include biological, physical (adsorption, membrane filtration, coagulation, etc.), and chemical.9–11 Ion exchange, ozone generation, chemical precipitation, and advanced oxidation are examples of chemical approaches. Enzymes or microbes are used in biological processes, such as the activated sludge technique.1,10,12 Adsorption is used more often than other approaches because it is relatively easy to build and operate, environmentally friendly, energy-efficient, and affordable. This is supported by a substantial body of literature.12–18
Previous studies have examined the application of biosorbents for adsorption, which have proven to be affordable, environmentally acceptable, and plentiful biological materials that include a variety of functional groups, including carboxyl, sulfate, phosphate, and amino groups.19–22 A variety of biological materials have been employed as biosorbents for the removal of dyes, heavy metals, and other contaminants from wastewater or their respective aqueous solutions. The ideal sorbent should be reasonably inexpensive, widespread, easily modifiable, and have higher removal effectiveness.23 Animal-based waste products are hazardous to the well-being of people and various other living beings when they are dumped in the environment without being processed or composted, or when they are simply washed into waterways. It should be noted that there is little chance of using those waste products beneficially if they are dumped recklessly.24 To remove contaminants from wastewater, some researchers have concentrated on using these animal waste products as an inexpensive, easily accessible adsorbent.
Animal-derived wastes such as fish bones,25,26 pig bones,26,27 egg shells,28,29 ark shell,19 crab,28,30 and poultry litter 31–33 have been researched as potential adsorbents for the uptake of harmful or lethargic material from wastewater. In the current study, the potential of snail shells to remove methylene blue (MB) from polluted aqueous solutions was investigated. This was done in line with the ongoing search for less expensive, practical, and efficient materials for removing pollutants and remediation of the environment. Snail shells are abundant and affordable organic wastes which could provide a viable alternative to replace the expensive and scarce commercial activated carbon. Many nations, including Nigeria, value snails as a delectable meal. Local populations offer an accessible supply of protein, dumping their shells as garbage.23 The presence of these wastes in the environment is dangerous to both humans and the ecosystem. Their interaction with other wastes in the environment creates serious pollution that makes the surroundings unbearable. Therefore, converting these abundant wastes into a value-added product in the form of adsorbent is a viable way of contributing to the waste management system and remediating dye pollution in water. In this study, these shells are used as adsorbents, turning waste into valuable material for sequestrating the methylene blue dye.
Similar techniques have been used in the majority of recent studies to assess the effectiveness of heavy-metal and dye removal under various environmental factors, including solution pH and beginning dye concentration.34,35 After modeling and confirmation using the data, the maximum dye removal value, isotherm, and adsorption kinetics have been determined.36,37 Under specific experimental circumstances, the adsorbate's potential to cling to the adsorbent at ambient conditions is assessed. It took a long time and involved a lot of steps to determine the relative contributions of the various adsorption methods (e.g., starting concentration), utilizing various agro-waste adsorbent characteristics. Integral adsorption processes were not taken into account in the aforementioned studies. Understanding the relative significance of each variable will help find the best option for increasing adsorption capacity and managing dyes in real water and wastewater more effectively.
In the last few years, machine learning has drawn interest due to its significant significance in computing, energy, chemical science, and biology.36,38 As opposed to empirical models, which can hardly predict results and make the connections among working conditions and adsorption capacity unobtainable,39,40 machine learning is opted for today via modeling and learning the processes of adsorption on agricultural (biomass) waste.40 To resolve this challenge, it could be preferable to simulate and understand how dyes adhere to agricultural waste. The complexity, quantity, and duration of tests can be reduced by using high-quality exceptional machine-learning models to forecast the efficiency of the adsorption processes. Furthermore, they can be employed to show a mathematical relation, that is, a non-linear form of relationship between independent and dependent input variables. In addition, the chemical compounds in the snail shell were observed and screened using density functional theory, and the selected compounds were optimized using Spartan 14 software via 6.31-G* as a basis set. The adsorbent and the adsorbate were further subjected to docking software to observe the inhibition strength of the adsorbent against MB (adsorbate). To the best of our knowledge, the combinational approaches along with experimental data have not been reported previously. Therefore, this work aimed at studying the kinetics, equilibrium, and thermodynamics, along with modelling, using artificial intelligence, the inhibition strength of thermally modified nanocrystalline snail shells for MB adsorption.
2 Materials and methods
2.1 Materials
The snail shell was collected from Oyingbo market, Ebute Metta Lagos (N 6° 29′ 8.592′′, E 3° 23′ 16.9044′′), Southwest of Nigeria. Distilled water was obtained from Lead City University's central research laboratory. Methylene blue, C16H18N3SCl (≥97%), was obtained from Sigma-Aldrich. Sodium hydroxide and hydrochloric acid were purchased from Bendosen Laboratory Chemicals. All reagents used in this study are analytical grade.2.2 Methods
![[thin space (1/6-em)]](https://www.rsc.org/images/entities/char_2009.gif) 000. Carbon glue was used to distribute the adsorbent on an aluminum sample holder before examination. To prevent the induction of electric current, the sample was subsequently coated with gold using a sputter coater, and Fourier transform infrared spectroscopy (FTIR; Bruker Vector 22 spectrometer) at 400–4000 cm−1 range was used to the determine the functional group in the adsorbent material. The diffraction pattern of the samples was determined using X-ray diffraction (XRD) (Rigaku Ultima IV, Kuraray Co. Ltd Japan) using 40 kV applied voltage, 30 mA intensity, and 2θ = 3–80° angular range, with 0.02 steps(s). A Cu Ka radiation source (λ = 1.540562) was utilized with a nickel filter in the 2θ range of 3–80°.
000. Carbon glue was used to distribute the adsorbent on an aluminum sample holder before examination. To prevent the induction of electric current, the sample was subsequently coated with gold using a sputter coater, and Fourier transform infrared spectroscopy (FTIR; Bruker Vector 22 spectrometer) at 400–4000 cm−1 range was used to the determine the functional group in the adsorbent material. The diffraction pattern of the samples was determined using X-ray diffraction (XRD) (Rigaku Ultima IV, Kuraray Co. Ltd Japan) using 40 kV applied voltage, 30 mA intensity, and 2θ = 3–80° angular range, with 0.02 steps(s). A Cu Ka radiation source (λ = 1.540562) was utilized with a nickel filter in the 2θ range of 3–80°.
 | (1) |
 | (2) |
2.3 Isotherm models
Various models were employed to describe the relationship between the equilibrium concentration of adsorbate in the liquid phase and the solid phase at room temperature. This was carried out to establish the best model that correlates with the adsorption equilibrium curves. The present investigation employed the following non-linear adsorption models: Freundlich (eqn (4)), Langmuir–Freundlich (eqn (5)), and Elovich (eqn (6)). The non-linear equations of these isotherm models are shown below:
 | (3) |
| qe = KF(Ce)1/n | (4) |
 | (5) |
| qe = qm(1 − (e(kw|Ce)α)), | (6) |
2.4 Effects of process variables
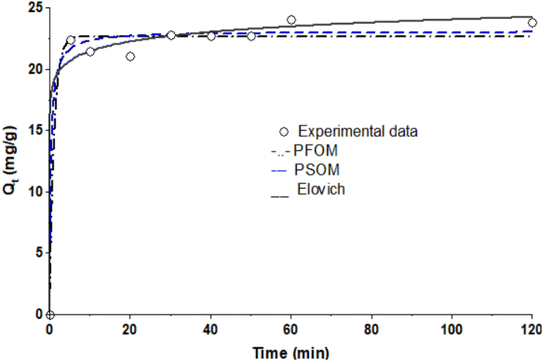
A measured quantity of 10 mg TMNSS was utilized to investigate the impact of varying MB concentrations from 25 to 300 mg L−1 on MB adsorption. Additionally, the influence of pH was examined by using initial solution pH values within the range of 3.0 to 11.0, and the effect of adsorbent dose was explored with doses ranging from 10 to 100 mg. The pH of the solution was adjusted using 0.1 M HCl and 0.1 M NaOH. Finally, the study assessed the influence of temperature on the adsorption process with a fixed MB concentration of 25 mg L−1, ranging from 283 to 323 K.In a parallel experiment to the one described above, kinetic studies were conducted with a constant MB concentration. Residual MB concentrations were measured at intervals of 5, 10, 40, 60, 80, 100, and 120 minutes after aliquots were extracted from the reaction medium. This analysis establishes the connection between the adsorption rate and the amount of pollutant removed, offering crucial insights into the reaction pathways. The experimental data were fitted to the pseudo-first-order (PFOM), pseudo-second-order (PSOM), and Elovich models. By using these models, one may determine the correlation coefficient or R2.
The general expression for the PFOM is:
 | (7) |
The non-linear expression for the PFOM is:
| qt = qe − qee−k1t | (8) |
The PSOM equation is given as:42
 | (9) |
 | (10) |
Furthermore, the thermodynamic parameters were determined using the Vant Hoff equation.
 | (12) |
| KC = Mw × 55.5 × 1000 × qe, | (13) |
| ΔG(Gibbs free energy (J mol−1)) = ΔH − TΔS | (14) |
2.5 Point of zero charge (pHpcz) determination
Understanding the point of zero charge of the adsorbent is crucial for a comprehensive grasp of the adsorption mechanism, as it reveals the net surface charge of the adsorbent. Additionally, insights into the electrostatic interactions between the adsorbent and adsorbate can be gained through the pH and point of zero charge, which signifies the pH at which the adsorbent surface achieves net electrical neutrality. The solid addition method was employed to determine the point of zero charge pH of the adsorbent. In this approach, a series of beakers with 20 mL of distilled water each were prepared, and the pH of each beaker was adjusted from 2 to 12 using 0.1 M of HCl and NaOH. Subsequently, 0.1 g of the adsorbents was added to each beaker and immediately covered with foil paper. The suspension was shaken in the oven for 2 hours and then allowed to rest for 24 hours for pH stabilization. The final pH was then measured.2.6 Machine learning
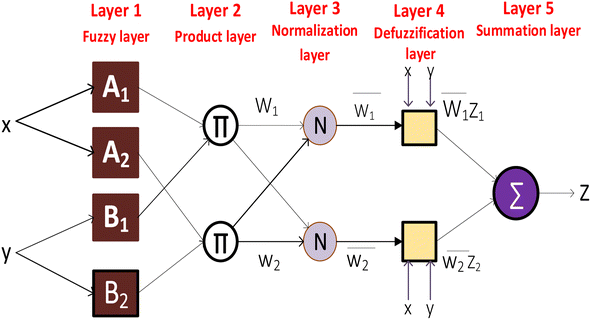
Fuzzy layer. The ANFIS model begins by fuzzifying input variables. Fuzzification is mapping crisp input values to fuzzy sets, which represent language phrases or categories. Each input variable's fuzzy sets are defined by its membership functions. This layer handles uncertain and imprecise input data. In this layer, the system receives data as eqn (15) depicts.
| O1i = μAi(a) | (15) |
Product layer. Each fuzzy rule's membership is determined by fuzzified inputs. The rule evaluation step uses fuzzy logic operators (e.g., AND, OR) to calculate each rule's firing strength. This firing strength indicates the rule's activation based on input variables. The membership functions transform input data into fuzzy sets in this layer as in eqn (16).
| O2i = wi = μAi(a) × μBi(b), i = 1, 2 | (16) |
Normalized layer. Each rule's consequence represents the ANFIS model's forecast. It has a premise portion, a linear function of the input variables, and a consequent part, a rule parameter. The rule consequent converts fuzzy rule firing strength to a sharp output value. Based on training data, the product rule in this layer generates fuzzy rules as follows.
 | (17) |
Defuzzification layer. Here, each rule's firing strength is divided by all rules' firing strengths. It guarantees that rules contribute to the output proportionally to their strengths. In this layer, deffuzifation of the output was observed. The reported signals observed in the normalization layer are spontaneously multiplied with the fuzzy rule's function in which the output O4i is expressed as shown in eqn (18):
O4i = ![[w with combining macron]](https://www.rsc.org/images/entities/i_char_0077_0304.gif) if = if = ![[w with combining macron]](https://www.rsc.org/images/entities/i_char_0077_0304.gif) i(sia + rib + ti) i(sia + rib + ti)
| (18) |
Output layer. Defuzzification combines all rule outputs to provide a clear value. The weighted averages of rule outputs, based on normalized firing strengths, are combined. Eqn (19) shows the systems's output in this layer:
 | (19) |
The ANFIS model for methylene blue sequestration utilizing thermally modified nanocrystalline snail shells benefits from parameter optimization. We may optimize the model's prediction powers and increase its accuracy in capturing the sequestration process's equilibrium, kinetic, and thermodynamic behavior by fine-tuning its parameters. Clustering is a significant step in the process of building the ANFIS model. In this study, the data set was divided into clusters using fuzzy c-means (FCM) clustering, where each of the data points to some extent belongs to each cluster. Iterative minimization techniques are used in this method to cluster a finite set of data, X = (x1, x2…….xm), into clusters of integers, where xi, i = 1,…m is an l-dimensional vector.48 FCM clustering is preferred for applications where speed is crucial, because of its capacity to accelerate computations.49 FCM was adopted in this study to build the fuzzy inference system. Until the partition matrix changes, the iterative process continues until the next rounds are less than a predefined threshold. For the FCM method, a range of 2 to 4 clusters was optimized to find the best model for predicting the removal rate of methylene blue. Table 1 provides a list of additional model parameters for the FCM-ANFIS method used in this experiment.
| Parameters | Values |
|---|---|
| FIS structure | Takagi-Sugeno-type |
| FIS function | Genfis3 (fuzzy c-means) |
| Number of clusters | 2–4 |
| Number of exponents for matrix portioning | 2 |
| Maximum iteration | 100 |
| Stopping criteria | Maximum number of iterations |
| Minimum improvement | 1 × 10⁻⁵ |
Using 30% of the holdout data for testing and 70% of the total data set for training, the best model was chosen. The developed model's total cluster numbers are evaluated using the following metrics: mean absolute deviation (MAD), mean absolute error (MAE), mean absolute percentage error (MAPE), and root mean square error (RMSE). These statistical indicators are estimated using eqn (20)–(22):
 | (20) |
 | (21) |
 | (22) |
 = predicted values,
  = median
  = median of the values“ as this does not appear as defined in the preceding equations. Please make any necessary changes to the proof. -->of the values, ȳ = mean value, and N = number of hold-out data.
2.7 Density functional theory studies
The equilibrium geometries of the chemical compounds obtained from snail shells were completely optimized at the DFT level via the 6-31G* basis set. The density functional theory used in this work was executed using the three-parameter B3LYP density functional, and it also includes Becke's gradient exchange correction as well as the Lee, Yang, Parr correlation functional. In this work, every calculation was performed using the Spartan ‘14 program implemented on a core i5 2.40 GHz and 2.50 GHz computer. The chemical compounds in the snail shell were observed and screened, and the selected compounds were N-[(2R)-2,4,5-trihydroxy-6-(hydroxymethyl)oxan-3-yl]acetamide (NTHA) and methyl N-[(2S,3R,4R,5S,6R)-5-[(2S,3R,4R,5S,6R)-3-amino-5-[(2S,3R,4R,5S,6R)-3-amino-5-[(2S,3R,4R,5S,6R)-3-amino-5-[(2S,3R,4R,5S,6R)-3-amino-5-[(2S,3R,4R,5S,6R)-3-amino-5-[(2S,3R,4R,5S,6R)-3-amino-4,5-dihydroxy-6-(hydroxymethyl)oxan-2-yl]oxy-4-hydroxy-6-(hydroxymethyl)oxan-2-yl]oxy-4-hydroxy-6-(hydroxymethyl)oxan-2-yl]oxy-4-hydroxy-6-(hydroxymethyl)oxan-2-yl]oxy-4-hydroxy-6-(hydroxymethyl)oxan-2-yl]oxy-4-hydroxy-6-(hydroxymethyl)oxan-2-yl]oxy-2-[(2R,3S,4R,5R,6S)-5-amino-6-[(2R,3S,4R,5R,6R)-5-amino-4,6-dihydroxy-2-(hydroxymethyl)oxan-3-yl]oxy-4-hydroxy-2-(hydroxymethyl)oxan-3-yl]oxy-4-hydroxy-6-(hydroxymethyl)oxan-3-yl]carbamate (MAOAC).50 The selected compounds were optimized using Spartan 14 software via 6.31-G* as a basis set51 to obtain the full geometry of the compounds. The optimized compounds (adsorbents) and methylene blue (adsorbate) were converted to .pdb format and further subjected to docking software to observe the inhibiting strength of the adsorbent against methylene blue (adsorbate). The improvement of the investigated substances resulted in several descriptors, which were used for further investigation. Also, the two compounds were docked against the adsorbate (methylene blue) using Discovery Studio, Autodock Tools, and AutoDock Vina software so as to observe the inhibition ability of the ligands under study against methylene blue (adsorbate).2.8 Statistical analysis
Graph Pad Prism® (Version 6.04) was used to perform a T-test and calculate the means of all the experimental parameters that were investigated at n = 3. All data were shown as mean ± SD (standard deviation), with the level of significance set at p < 0.05. All equilibrium and kinetic plots were made using KyPlot® version 2.0 software with the non-linear mathematical versions of the equilibrium and kinetic models. The software used the Quasi Newton (least square) optimization tool for fitting the data to the models.3 Results and discussion
3.1 Surface morphology of the biosorbent
SEM was used to determine the nature of the adsorbent morphology, while EDX was used to examine and ascertain the morphological restructuring due to the thermal treatment. The SEM micrographs and average particle size of CaO from calcined snail shells are presented in Fig. 2a and b, while the EDX micrographs of CaO are presented in Fig. 3a–d. Fig. 2a and b show an irregularly shaped material with an average particle size of 65 ± 2.81 nm, as shown by the Gaussian plot using image J software.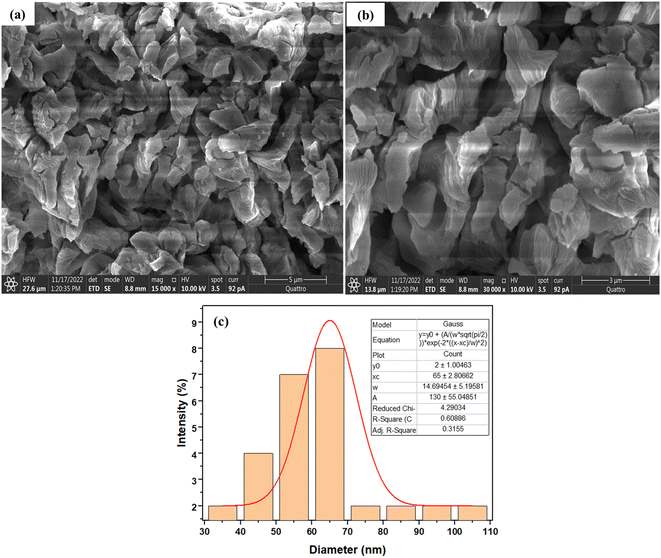 | ||
| Fig. 2 (a and b) SEM micrographs of calcined snail shells (CaO) (a × 15000 magnification and b × 30000 magnification). (c) The mean particle size of calcined snail shells (CaO). | ||
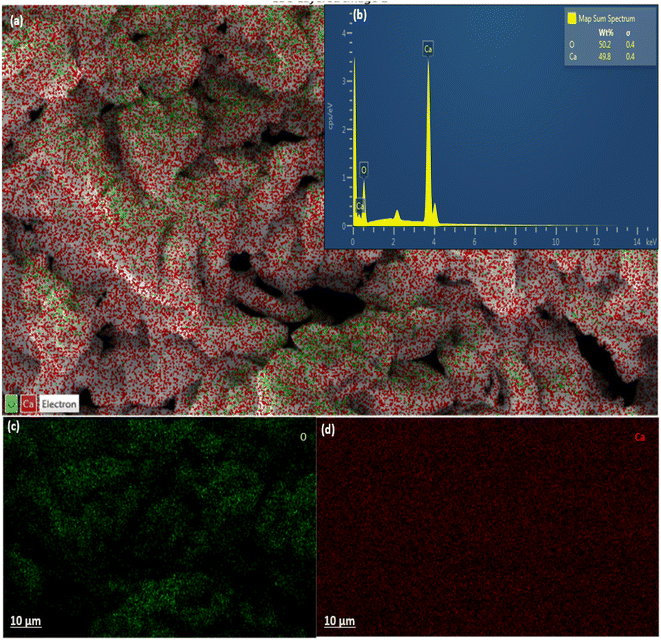 | ||
| Fig. 3 EDX chart of calcined snail shells (CaO): (a) elemental distribution; (b) elemental composition in wt%; (c and d) micrograph of the dispersibility on adsorbent surfaces. | ||
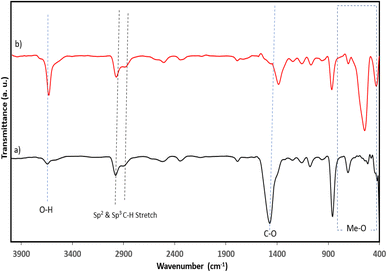
Furthermore, EDX analysis shows the distribution and the percentage composition of each atom on the adsorbent surface, otherwise known as chemical mapping. This analysis is one of the major characterizations utilized to confirm the doping of any composite material. The presence, distribution, and percentage composition of calcium and oxygen in CaO from calcined snail shells are presented in Fig. 3a–d, which show and ascertain the formation of oxides of calcium due to the thermal degradation of CaCO3 into carbon oxide and CaO, respectively. This is in agreement with the result obtained in the FTIR analysis, in which a weak adsorption value of 512 cm−1 was observed in the uncalcined SS compared to a prominent strong metal oxide adsorption band at 547 cm−1 for TMNSS, as presented in Table 2. The result of the analysis confirms the formation of metal oxides as shown in the EDX chart.
| Wavenumber range (cm−1) | Uncalcined SS (cm−1) | TMNSS (cm−1) | Difference (cm−1) | Functional group |
|---|---|---|---|---|
| 3630–3600 | 3644 | 3639 | −5 | O–H (stretch) |
| 3000–2850 | 2978 | 2978 | 0 | C–H (stretch) |
| 2896 | 2888 | −6 | ||
| 1810–1775 | 1786 | 1793 | 7 | C![[double bond, length as m-dash]](https://www.rsc.org/images/entities/char_e001.gif) O (stretch) O (stretch) |
| 1500 – 1350 | 1469 | 1388 | −81 | C–C (aromatic stretch) and C–O stretch |
| 1350–1000 | 1157 | 1161 | −89 | |
| 900–690 | 857 | 868 | 11 | C–H (out of plane bend) |
| 800–400 | 512 | 547 | 35 | Me–O |
3.2 Surface chemistry of the biosorbent
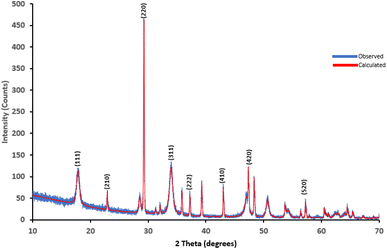
The TMNSS surface functional groups were determined using FTIR spectroscopy. The wave number values and the absorption characteristics of all the biosorbent materials are presented in Table 2, while Fig. 3 shows the FTIR spectra of uncalcined and calcined snail shells (CaO). Characteristic absorption values of 3644 cm−1 and 3639 cm−1 for SS and CaO, respectively, were observed in the adsorbent, as presented in Table 2 and Fig. 4. This is attributed to O–H stretch with a range value of 3630–3100 cm−1. The observed shifts, as shown in Fig. 4a and b, in the absorption values suggest thermal modification (for CaO) of the biomass material (snail shell). Furthermore, the C–H stretch value between 3000 and 2850 cm−1 shows the alkyl C–H stretch, and the pristine CaO recorded a similar value of 2978 cm−1. The characteristic metal oxide (Me–O adsorption band in the range of (400–800 cm−1)52,53 was noted in the snail shell, although weak at 705 cm−1, and a strong Me–O adsorption band was observed in CaO, as noted in Table 2 and Fig. 4, respectively, thereby suggesting the formation of a Ca–O functional group due to the removal of carbon dioxide. It could be inferred that the appearance, disappearance, and band shift observed in the adsorption is attributed to the morphological restructuring, resulting in modification of the adsorbent surfaces.XRD analysis was used to determine and identify whether a material is crystalline or amorphous in nature, as a result of the sharpness and intensity shown by any analyzed material. Furthermore, studies have shown that 800 °C is the optimum temperature in which CaCO3 and Ca(OH)2 from snail shells, quicklime, and egg shells are converted into CaO.54 CaCO3 is one of the main components of snail shells. After being calcined at 800 °C for two hours, this was entirely converted into CaO. Fig. 5 shows the XRD patterns of the calcined snail shell obtained to further reveal details about the microstructure of the material at an X-ray wavelength of λ = 1.540562 Å Cu Kα. The diffractogram patterns were theoretically calculated using mathematical methods. The XRD diffractogram reveals patterns that show crystallinity. The following lattice parameters, Miller indices (hkl), and crystal structure were therefore determined. The mean lattice parameter “a” in angstrom, a (Å), for the calcined snail shell (CaO) recorded a consistent value of 8.611617 Å with five consecutive hkl values of 111, 210, 220, 220, and 311 at the 2θ values of 17.91°, 22.95°, 29.26°, 33.96°, and 34.01°. This shows that the adsorbent is crystalline in nature. The finding of this study is in agreement with previous studies,53,55 thereby corroborating the results obtained in the SEM-EDX and FTIR analysis.
3.3 Kinetic studies
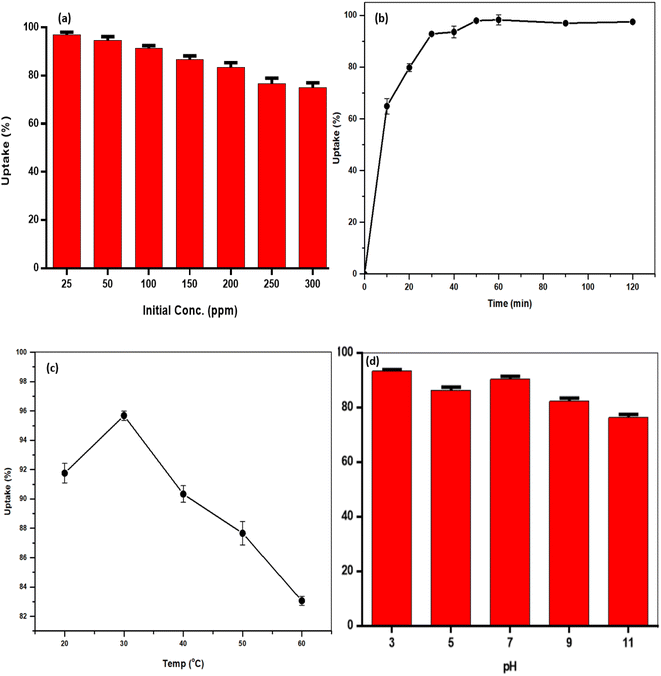
The kinetic investigation involves a systematic approach to assess the rate at which pollutants are best eliminated from an aqueous solution.56 It also aids in evaluating whether the adsorption process occurred via physisorption, chemisorption, or a more complex interaction.57 The experimental data were modeled using Elovich, pseudo-first-order (PFO), and pseudo-second-order (PSO) models (Table 3). The effect of contact time experiment (Fig. 6) shows that almost 95% of the MB was removed after 50 min, indicating a rapid adsorption process. The PSO model, which had the lowest error value of 0.8792 and correlation coefficient of 0.9868, more accurately describes the uptake of the dyes from the solution. This model shows that during the adsorption process, MB and polar functional groups on the TMNSS surface interacted chemically.| Model | R2 | Error | Parameters |
|---|---|---|---|
| PFOM | 0.9838 | 1.0735 | Qe = 22.7163 mg g−1, k1 = 0.8741 min−1 |
| PSOM | 0.9868 | 0.8792 | Qe = 0.1306 mg g−1, k2 = 23.0972 g mg−1 min−1 |
| Elovich | 0.9886 | 0.8832 | β = 0.8978 g mg−1, α = 26![[thin space (1/6-em)]](https://www.rsc.org/images/entities/char_2009.gif) 769 769![[thin space (1/6-em)]](https://www.rsc.org/images/entities/char_2009.gif) 784.95 mg g−1 min−1 784.95 mg g−1 min−1 |
3.4 Isothermal studies
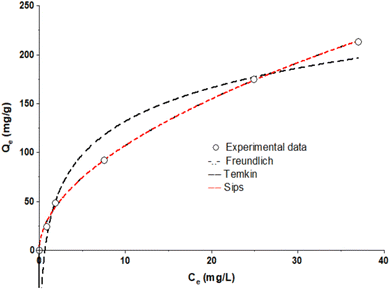
To further illustrate how the TMNSS and MB interacted and demonstrate the equilibrium link between the sorbate concentration and adsorption capacity of the sorbent, experimental data were fitted with isotherm models, as shown in Fig. 7. This study uses Langmuir, Freundlich, and Sips. According to the correlation coefficient and error values shown in Table 4, the Freundlich model fit was more accurate for the uptake of MB onto TMNSS. It successfully predicts that the adsorption process is multilayer, showing that the MB adsorption is proportional to the fraction of occupied sites. Additionally, the reactive groups present on the adsorbent surface, as seen by the FTIR spectra in Fig. 4, serve as a demonstration of the materials’ heterogeneity. The zenith of the adsorption capacity of MB unto TMNSS is 31 mg g−1.| Model | R2 | Parameters |
|---|---|---|
| Freundlich | 0.9985 | KF = 31.7853 (mg g−1) (L mg−1)1/n; n = 1.8926 |
| Sips | 0.9985 | Qo = 13.0798; K = 4.6697; n = 0.5384 |
| Temkin | 0.9702 | α = 49.2380; L g−1; KT = 1.45980J mg |
For the comparative study, Table 5 presents the maximum adsorption capacities of other adsorbents obtained from previous literature alongside TMNSS, which were employed for the removal of MB from aqueous solutions. It is clear that TMNSS adsorbent can be classified as both cost-effective and efficient among the other adsorbents for methylene blue removal. Furthermore, it is noteworthy that the adsorption capacity of TMNSS surpasses some adsorbents studied previously, while also showing a similar level of efficiency to others. This demonstrates that TMNSS is a potential adsorbent for the removal of MB from aqueous phases.
3.5 Effects of process variables on the adsorption of MB
The adsorption mechanism noted could be a result of the negative charge in the adsorbent surface being neutralized by the positive charge of H+. Moreover, the addition of HCl in the dilution of powdered methylene blue increased the acid site of the adsorbents. Thus, at acidic conditions, it is possible for the MB to be more basic, making it easy to attach to the acid site of the adsorbents.
The observed pattern of MB removal capability to decrease with increasing temperature suggests that the adsorption kinetic is an exothermic mechanism. The results are consistent with previous investigations.64,65
3.6 Point of zero charge studies
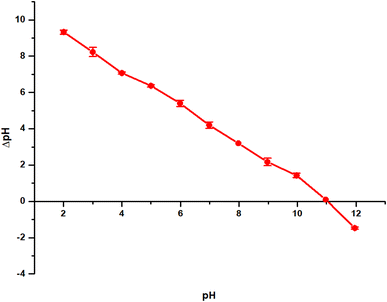
The pHpzc value determines the surface charge of the adsorbent, the chemistry of the aqueous environment, and the adsorbent–adsorbate interaction. This is very important especially when adsorption is predominantly via electrostatic interactions. This is because, at solution pH lower than the adsorbent pHpzc, excess H+ in solution is attracted to the adsorbent's surface, thereby making the net surface charge positive and favoring the adsorption of negatively charged species. Meanwhile, when the solution pH is higher than the pHpzc, the net surface charge becomes negative due to the desorption of H+, favoring the adsorption of positively charged moieties.66 The interfacial characteristics are based on the pH at the point zero charge (pHpzc), which can be used to determine which ionic species the TMNSS can adsorb at a particular pH. For this test, 50 mL of sodium chloride (NaCl) 0.1 N electrolyte, buffered to pH 2.00–12.00 by adding HCl (0.01 M) and NaOH (0.01 M), were combined with 0.10 g of the adsorbent as the sorbent mass. Plotting ΔpH (final pH − initial pH) vs. initial pH allowed the pHpzc of the adsorbent to be identified as presented in Fig. 9. The study was done at room temperature, and the suspension was agitated for 24 hours before the final pH of each suspension was determined. Fig. 9 shows that the pHpzc of TMNSS is 11.04 ± 0.00, indicating that the surface of TMNSS possesses a wide pH range for positively charged surfaces; hence, the materials are expected to have great electrostatic affinity for negatively charged moieties.3.7 Thermodynamic studies
The thermodynamic parameters for the adsorption of MB onto TMNSS are presented in Table 6. The negative values for Gibbs free energy (ΔG°) values indicate the feasibility and spontaneous adsorption of the MB on the adsorbent.35,51 The ΔH° value is also negative (−2.18 kJ mol−1), indicating that the uptake of the MB molecules using TMNSS is an exothermic process, while the positive ΔS° (+157.700 J mol−1) value indicates increasing randomness in the adsorbent-solution interphase during the uptake.51| Temp (K) | TMNSS | ||
|---|---|---|---|
| ΔG (J mol−1) | ΔH (kJ mol−1) | ΔS (J mol−1) | |
| 293 | −48.39 | −2.18 | +157.700 |
| 303 | −49.96 | ||
| 313 | −51.53 | ||
| 323 | −53.11 | ||
| 333 | −54.69 | ||
3.8 Mechanism of adsorption
The effect of electrostatic attraction on dye adsorption was investigated. The pH study revealed that the impact of pH adjustment on the adsorption efficiency of TMNSS was minimal. According to the recorded pHpzc value of the adsorbent, the surface of the adsorbent comprises mostly positively charged ions within the pH range (3–10). However, this is not favorable for the sorption of MB, which is cationic in nature because, in an aqueous solution, MB is present as a neutral (MB°), cationic species (MB+), or undissociated molecule (MB°). At pH = 3, MB exists predominantly as a neutral species; at pH = pKa = 3.8, both neutral and positively charged MB species coexist; at pH > 6, MB+ is almost the only species present.67 Therefore, it is reasonable to assume that electrostatic interaction is not the primary mechanism in the adsorption of MB. As a result, it can be assumed that other mechanisms play a larger part in the adsorption process. Similarly, the isotherm model predicts that the adsorbent has a heterogeneous surface, which might lead to the involvement of other mechanisms in the adsorption process. When both the adsorbent and the adsorbate have positively charged surfaces, a cation–electron donor acceptance (EDA) interaction between the protonated group on the adsorbate and the ring structure of the adsorbent may take place at low pH.67 The adsorption process is described as including the interaction of π-electrons between the aromatic rings of MB and the π-electrons from TMNSS, along with the hydrophobic interaction between the long-chain carbon on the adsorbent and the aromatic groups in the adsorbates.683.9 Performance metrics of the neuro-fuzzy model
| Cluster number | Stages | RMSE | MAD | MAE | MAPE |
|---|---|---|---|---|---|
| 2 | Training | 2.5632 | 1.1953 | 0.0276 | 5.214 |
| Testing | 2.3324 | 1.1352 | 0.0232 | 4.438 | |
| 3 | Training | 2.6217 | 1.2063 | 0.0256 | 3.163 |
| Testing | 2.2689 | 1.6324 | 0.0232 | 2.056 | |
| 4 | Training | 2.5277 | 1.1809 | 2.2734 | 2.6634 |
| Testing | 2.2077 | 1.1429 | 1.8786 | 2.0178 |
These results highlight the ANFIS model's capability to optimize the adsorption settings and advance knowledge of the equilibrium, kinetic, and thermodynamic aspects of methylene blue sequestration. The RMSE value of 2.2077 during the testing phase indicates the average size of the discrepancies or errors between the predicted and actual values. Better prediction accuracy is shown by a lower RMSE value. The ANFIS model in this instance exhibits a reasonably low RMSE, indicating that it is capable of accurately capturing the thermodynamic, kinetic, and equilibrium behavior of methylene blue sequestration. The recorded mean size of the absolute disparities between the expected and actual values is represented by the MAD value of 1.1429 at the testing phase. It gives a hint as to the model's typical accuracy. Better agreement between the expected and actual values is indicated by a lower MAD value. The ANFIS model's relatively low MAD suggests that it can provide precise predictions for the sequestration of methylene blue. The average magnitude of predicted-to-actual errors is 1.8786 at the testing phase. MAE evaluates the model's average prediction accuracy like MAD. Prediction accuracy improves with reduced MAE. The low MAE of ANFIS suggests it can estimate methylene blue sequestration using thermally modified nanocrystalline snail shells. The average percentage difference between the projected and actual values is represented by the MAPE value of 2.0178 at the testing phase. The relative accuracy of the predictions is revealed by MAPE. An improved prediction performance is shown by a lower MAPE value. The comparatively low MAPE of the ANFIS model shows that it can provide predictions for methylene blue sequestration using thermally altered nanocrystalline snail shells that are rather accurate.
While there is some variation in the performance metrics between the training and testing phases, the ANFIS model generally demonstrates good predictive capabilities for methylene blue sequestration using thermally modified nanocrystalline snail shells. The small improvement noticed during the testing phase when compared to the training phase suggests that the model effectively adapts to new data and performs well in estimating the sequestration process. During training, the RMSE is 2.5277; during testing, it is 2.2077. The model's predicted accuracy using the novel data set is slightly better. RMSE decreases between phases, indicating that the model generalizes well to additional observations. In addition, the MAD value is 1.1809 for training and 1.1429 for testing. This marginal decline demonstrates that the model regularly makes correct predictions with a significantly lower average absolute deviation in testing. Low MAD values imply that the model's predictions are close to the observed values regardless of phase.69 Further to this, during training, the MAE is 2.2734; during testing, it is 1.8786. This implies a somewhat reduced average absolute error on unseen data for the model's predictions. The model's predictions are closer to real values when applied to new data in the testing phase due to the reduced MAE value. Similarly, the MAPE is 2.6634 during training and 2.0178 during testing. During testing, the model's predictions had a slightly lower average percentage deviation from the actual values. The reduced MAPE value during the testing phase suggests that the model's predictions are more accurate when applied to new data, closely aligning with the actual values. The removal rate of methylene blue utilizing thermally modified nanocrystalline snail shells can be significantly affected by changes in the input variables, such as temperature, time, dosage, concentration, and pH. Understanding how these factors affect the adsorption process enables its optimization and offers useful information for using the ANFIS model to accurately forecast the removal rate under various operating conditions. By examining how the model responds to variations in these input variables, we can gain insights into their influence on the removal rate.
Temperature greatly affects methylene blue elimination. Higher temperatures improve adsorption by increasing molecular mobility and surface contact. Thus, the ANFIS model's predicted removal rate increases with temperature. Furthermore, the ANFIS model is more likely to predict higher removal rates with increased time, as longer contact times allow for more interaction between the methylene blue molecules and the adsorbent surface, leading to higher removal rates. In addition, higher dosages provide more available surface area for adsorption and, thus, can lead to higher removal rates. Therefore, it is expected that an increase in dosage will result in higher removal rates as predicted by the ANFIS model.
Finding an optimal cluster number is crucial to strike a balance between capturing relevant information and avoiding overfitting.70 Therefore, the selection of cluster number in this FCM-clustered ANFIS model must factor in the features of the data set and the distribution of the data points. This is because a lower number of clusters may oversimplify the representation of the data, while a higher cluster number can result in overfitting if the complexity is not compensated by enough data. The number of clusters in the FCM clustering approach affects how well the ANFIS model performs, as indicated by the RMSE values. For clusters 2, 4, and 5, the RMSE values are 2.3324, 2.2689, and 2.2077, respectively, at the testing phase. This variation implies that the outcome of the model may be influenced by the number of clusters. An improved fit of the model to the observed data is shown by a decreased RMSE. In this instance, the drop in RMSE from 2.3324 (2 clusters) to 2.2077 (4 clusters) indicates that better model performance results from adding more clusters. The additional clusters' ability to capture data at a greater degree of detail and produce more precise predictions may be responsible for this increase.
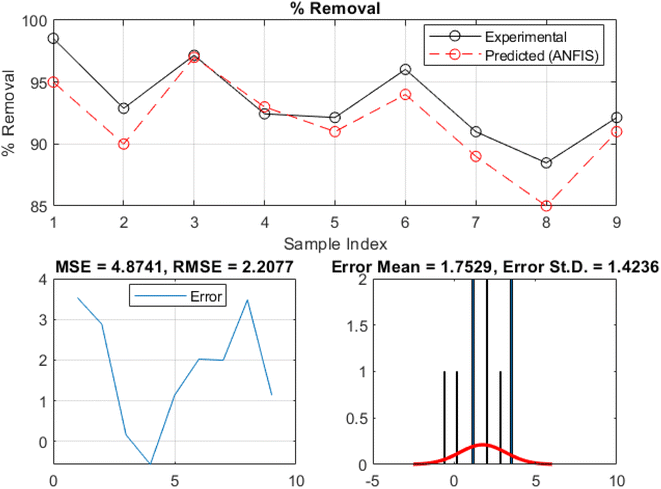
The ANFIS model performance is shown graphically in addition to the model's statistical metrics results. Fig. 10 and 11 present the comparison between the experimental and ANFIS-predicted values of the MB removal rate during the training and testing phases, respectively. Moreover, these plots display a uniform pattern and trend with minimal variation, indicating the ANFIS model's capacity to capture the overall trends and behavior of the MB sequestration process using TMNSS. The model can describe the kinetics and properties of MB sequestration, since the experimental and ANFIS-predicted values match. Further to this, the ANFIS model appears to have learned and assimilated the correlations between input variables and methylene blue removal rate. This consistency suggests the model is accurately forecasting sequestration behavior. The comparison plot shows a marginal difference between experimental and ANFIS-predicted values, indicating the model's accuracy. Due to system uncertainties and complexities, the ANFIS model may deviate. However, the predicted values match the experimental values, validating the ANFIS model's efficacy. The model's validity and reliability increase when ANFIS-predicted values match experimental values. The closeness between the two sets of values implies that the ANFIS model may accurately estimate methylene blue elimination using thermally modified nanocrystalline snail shells. This improves the model's sequestration prediction and practicality.
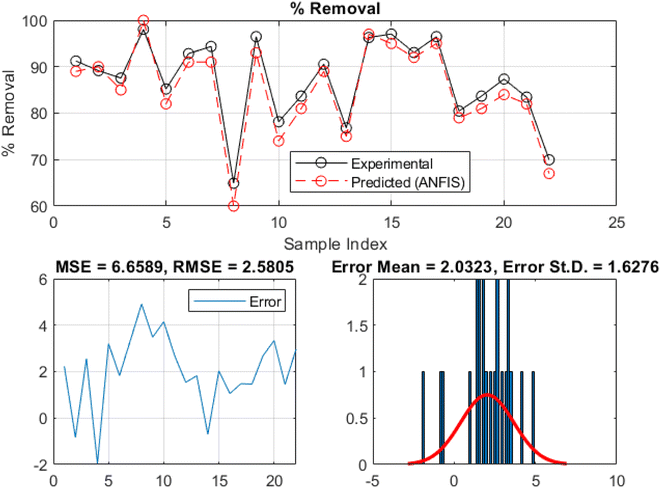 | ||
| Fig. 10 Plots comparing the experimental and predicted removal rates of methylene blue at the training phase. | ||
3.10 Molecular docking study
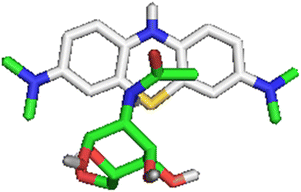
The selected ligands from the adsorbents, N-[(2R)-2,4,5-trihydroxy-6-(hydroxymethyl)oxan-3-yl]acetamide (NTHA) and methyl N-[(2S,3R,4R,5S,6R)-5-[(2S,3R,4R,5S,6R)-3-amino-5-[(2S,3R,4R,5S,6R)-3-amino-5-[(2S,3R,4R,5S,6R)-3-amino-5-[(2S,3R,4R,5S,6R)-3-amino-5-[(2S,3R,4R,5S,6R)-3-amino-5-[(2S,3R,4R,5S,6R)-3-amino-4,5-dihydroxy-6-(hydroxymethyl)oxan-2-yl]oxy-4-hydroxy-6-(hydroxymethyl)oxan-2-yl]oxy-4-hydroxy-6-(hydroxymethyl)oxan-2-yl]oxy-4-hydroxy-6-(hydroxymethyl)oxan-2-yl]oxy-4-hydroxy-6-(hydroxymethyl)oxan-2-yl]oxy-4-hydroxy-6-(hydroxymethyl)oxan-2-yl]oxy-2-[(2R,3S,4R,5R,6S)-5-amino-6-[(2R,3S,4R,5R,6R)-5-amino-4,6-dihydroxy-2-(hydroxymethyl)oxan-3-yl]oxy-4-hydroxy-2-(hydroxymethyl)oxan-3-yl]oxy-4-hydroxy-6-(hydroxymethyl)oxan-3-yl]carbamate (MAOAC), were docked against the adsorbate (MB), and the recorded binding affinity for the studied ligands were −1.3 kcal mol−1 for NTHA and 42.2 kcal mol−1 for MAOAC. As reported by ref. 71, a lower binding affinity value denotes a compound with better ability to inhibit the studied receptor; therefore, NTHA proved to have greater capacity than MAOAC, as presented in Table 8. Also, it showed that NTHA greatly enhanced the ability of TMNSS for MB sequestration, which agrees with the experimental report (Fig. 12).| Binding affinity (kcal mol−1) | |
|---|---|
| NTHA | −1.3 |
| MAOAC | 42.2 |
4 Conclusion
This comprehensive research has offered valuable insights into the capability of TMNSS as an appropriate and sustainable biosorbent, proving its effectiveness in removing methylene blue dye from wastewater and providing a thorough understanding of the adsorption process. The SEM micrographs reveal an irregularly shaped biosorbent with an average particle size of 65 ± 2.81 nm determined using Image J software. Analysis of the XRD results indicates a highly crystalline material, with a recorded lattice parameter value of 8.611617 Å. EDX and FTIR confirm the formation of CaO with sharp peaks at 547 cm−1, and C–O and O–H are present, as well. The maximum adsorption efficiency of 96.48 ± 0.58% was recorded with a pH of 3.0, an adsorbent dose of 10 mg, and at 30 °C, while the pHpzc value is 11.04 ± 0.00, indicating basic surface characteristics. Freundlich isotherms recorded a maximum adsorption capacity (Qm) and R2 value of 31.7853 mg g−1 and 0.9985, respectively, among others, which demonstrates the remarkable adsorption capacity of the snail shell-based adsorbents, confirming their suitability for MB dye sequestration. The adsorption kinetic investigations fit into the pseudo-second order kinetic model with recorded least error and R2 values of 0.8792 and 0.9868, respectively, thereby showing that the rapidity of the adsorption process is governed by the chemisorption mechanism. The recorded ΔH° and ΔG° values of −2.18 kJ mol−1 and +157.700 J mol−1, respectively, show that the adsorption thermodynamics is spontaneous and endothermic, underscoring its feasibility under diverse environmental conditions.In addition, the integration of artificial intelligence techniques allowed us to develop predictive models, which can facilitate process optimization and practical applications. The most accurate MB sequestration calculations recorded values of 2.5277 for root mean square error (RMSE), 1.809 for mean absolute deviation (MAD), 2.6634 for mean absolute percentage error (MAPE), and 1.6276 for correlation determination (R1), thus showing that the GP-ANFIS model is in tandem with the experimental finding. Moreso, DFT calculations provided molecular-level insights into the interaction between methylene blue and the adsorbent surface, enhancing our understanding of the adsorption mechanism. The ligand N-[(2R)-2,4,5-trihydroxy-6-(hydroxymethyl)oxan-3-yl]acetamide (NTHA) was docked against the adsorbate (methylene blue) with a recorded binding affinity value of −1.3 kcal mol−1, thereby possessing a better adsorption capacity.
The findings of this study underscore the potential of thermally modified nanocrystalline snail shells as an eco-friendly and efficient biosorbent for dye removal. This research not only contributes to the advancement of sustainable wastewater treatment but also highlights the interdisciplinary nature of addressing environmental challenges through the convergence of chemistry, materials science, artificial intelligence, and computational modeling.
Conflicts of interest
The authors declare no conflict of interest.Acknowledgements
Authors appreciate their respective universities for the enabling platform to carry out this work.References
- K. O. Iwuozor, J. O. Ighalo, E. C. Emenike, L. A. Ogunfowora and C. A. Igwegbe, Curr. Res. Green Sustainable Chem., 2021, 4, 100179 CrossRef CAS.
- L. T. Popoola, T. A. Aderibigbe, A. S. Yusuff and M. M. Munir, Environ. Qual. Manag., 2018, 28, 63–78 CrossRef.
- A. M. Aljeboree, A. N. Alshirifi and A. F. Alkaim, Arabian J. Chem., 2017, 10, S3381–S3393 CrossRef CAS.
- M. Auta and B. H. Hameed, Chem. Eng. J., 2011, 175, 233–243 CrossRef CAS.
- S. Banerjee and M. C. Chattopadhyaya, Arabian J. Chem., 2017, 10, S1629–S1638 CrossRef CAS.
- S. Hajati, M. Ghaedi, F. Karimi, B. Barazesh, R. Sahraei and A. Daneshfar, J. Ind. Eng. Chem., 2014, 20, 564–571 CrossRef CAS.
- M. Ghaedi, A. Ansari and R. Sahraei, Spectrochim. Acta, Part A, 2013, 114, 687–694 CrossRef CAS PubMed.
- J. Mittal, A. Mariyam, F. Sakina, R. T. Baker, A. K. Sharma and A. Mittal, J. Cleaner Prod., 2021, 321, 129060 CrossRef CAS.
- K. O. Iwuozor, Adv. J. Chem., Sect. A, 2019, 2, 105–127 CrossRef CAS.
- V. Selvaraj, T. Swarna Karthika, C. Mansiya and M. Alagar, J. Mol. Struct., 2021, 1224, 129195 CrossRef CAS.
- O. A. Ajala, S. O. Akinnawo, A. Bamisaye, D. T. Adedipe, M. O. Adesina, O. A. Okon-Akan, T. A. Adebusuyi, A. T. Ojedokun, K. A. Adegoke and O. S. Bello, RSC Adv., 2023, 13, 4678–4712 RSC.
- L. A. Ogunfowora, K. O. Iwuozor, J. O. Ighalo and C. A. Igwegbe, Cleaner Mater., 2021, 2, 100024 CrossRef CAS.
- O. Ogunlalu, I. P. Oyekunle, K. O. Iwuozor, A. D. Aderibigbe and E. C. Emenike, Curr. Res. Green Sustainable Chem., 2021, 4, 100188 CrossRef.
- O. S. Bello, K. A. Adegoke, A. A. Olaniyan and H. Abdulazeez, Desalin. Water Treat., 2015, 53, 1292–1315 CAS.
- O. S. Bello, K. A. Adegoke, O. O. Sarumi and O. S. Lameed, Heliyon, 2019, 5, e02323 CrossRef PubMed.
- M. A. Ahmad, N. Adilah Ahmed, K. Adesina Adegoke and O. S. Bello, J. Dispersion Sci. Technol., 2022, 43, 583–597 CrossRef CAS.
- M. A. Ahmad, N. B. Ahmed, K. A. Adegoke and O. S. Bello, Chem. Data Collect., 2019, 22, 100249 CrossRef CAS.
- K. A. Adegoke, O. Adeleke, M. O. Adesina, R. O. Adegoke and O. S. Bello, Curr. Res. Green Sustainable Chem., 2022, 5, 100275 CrossRef CAS.
- S. K. Bozbaş and Y. Boz, Process Saf. Environ. Prot., 2016, 103, 144–152 CrossRef.
- J. Mo, Q. Yang, N. Zhang, W. Zhang, Y. Zheng and Z. Zhang, J. Environ. Manage., 2018, 227, 395–405 CrossRef CAS.
- K. A. Adegoke and O. S. Bello, Water Resour. Ind., 2015, 12, 8–24 CrossRef.
- I. M. Reck, R. M. Paixão, R. Bergamasco, M. F. Vieira and A. M. S. Vieira, J. Cleaner Prod., 2018, 171, 85–97 CrossRef CAS.
- K. A. Adegoke, O. O. Adesina, O. A. Okon-Akan, O. R. Adegoke, A. B. Olabintan, O. A. Ajala, H. Olagoke, N. W. Maxakato and O. S. Bello, Curr. Res. Green Sustainable Chem., 2022, 5, 100274 CrossRef CAS.
- K. A. Adegoke and O. S. Bello, Water Resour. Ind., 2015, 12, 8–24 CrossRef.
- M. Nurhadi, R. Kusumawardani, I. I. Widiyowati, Wirhanuddin and H. Nur, J. Phys.: Conf. Ser., 2018, 1022, 012031 CrossRef.
- Y. Zhou, D. Chang and J. Chang, Int. J. Appl. Ceram. Technol., 2017, 14, 1125–1133 CrossRef CAS.
- A. Wongrueng, P. Rakruam, A. Siri and A. Siyasukh, Water Sci. Technol., 2018, 79, 857–865 CrossRef PubMed.
- L. Dai, W. Zhu, L. He, F. Tan, N. Zhu, Q. Zhou, M. He and G. Hu, Bioresour. Technol., 2018, 267, 510–516 CrossRef CAS PubMed.
- G. De Angelis, L. Medeghini, A. M. Conte and S. Mignardi, J. Cleaner Prod., 2017, 164, 1497–1506 CrossRef CAS.
- T. Zhang, Y. Sun, K. Song, W. Du, W. Huang, Z. Gu and Z. Feng, Chemosphere, 2021, 271, 129479 CrossRef CAS PubMed.
- A. S. Yusuff, O. A. Ajayi and L. T. Popoola, Sci. Afr., 2021, 13, e00850 CAS.
- L. Chaves, J. Fernandes, J. Mendes, G. Tito, H. Guerra and L. Laurentino, Chem. Eng. Trans., 2021, 86, 1507–1512 Search PubMed.
- B. Ghanim, J. J. Leahy, T. F. O'Dwyer, W. Kwapinski, J. T. Pembroke and J. G. Murnane, J. Chem. Technol. Biotechnol., 2022, 97, 55–66 CrossRef CAS.
- A. Bamisaye, M. O. Adesina, M. O. Alfred, A. R. Ige, M. A. Idowu and K. A. Adegoke, Chem. Data Collect., 2023, 45, 101024 CrossRef CAS.
- M. O. Bello, N. Abdus-Salam, F. A. Adekola and U. Pal, Chem. Data Collect., 2021, 31, 100607 CrossRef CAS.
- A. Bamisaye, M. O. Adesina, M. O. Alfred, M. A. Idowu, O. Adeleke and K. A. Adegoke, Biomass Convers. Biorefin., 2023 DOI:10.1007/s13399-023-03804-x.
- K. A. Adegoke, O. Adeleke, M. O. Adesina, R. O. Adegoke and O. S. Bello, Curr. Res. Green Sustainable Chem., 2022, 5, 100275 CrossRef CAS.
- Ş. Tulun, G. Akgül, A. Alver and H. Çelebi, Arabian J. Chem., 2021, 14(12), 103443 CrossRef.
- H. Zhu, X. Xiao, Z. Guo, X. Han, Y. Liang, Y. Zhang and C. Zhou, Appl. Clay Sci., 2018, 161, 310–316 CrossRef CAS.
- X. Zhu, X. Wang and Y. S. Ok, J. Hazard. Mater., 2019, 378, 120727 CrossRef CAS PubMed.
- S. Chowdhury and P. Das Saha, Environ. Sci. Pollut. Res., 2013, 20, 1050–1058 CrossRef CAS PubMed.
- Y.-S. S. Ho and A. E. Ofomaja, J. Hazard. Mater., 2006, 129, 137–142 CrossRef CAS PubMed.
- M. O. Omorogie, F. O. Ilesanmi, M. O. Alfred and B. Helmreich, New J. Chem., 2022, 15, 20918–20931 RSC.
- J.-S. R. Jang, IEEE Trans. Syst. Man. Cybern., 1993, 23, 665–685 CrossRef.
- O. Adeleke and T.-C. Jen, Energy Rep., 2022, 8, 576–584 CrossRef.
- V. Güldal and H. Tongal, Water Resour. Manage., 2010, 24, 105–128 CrossRef.
- O. Sanni, O. Adeleke, K. Ukoba, J. Ren and T.-C. Jen, J. Mater. Res. Technol., 2022, 20, 4487–4499 CrossRef CAS.
- S. Ghosh, A. P. Hazarika, A. Chandra and R. K. Mudi, Vis. Inform., 2021, 5, 67–80 CrossRef.
- M. Mustapha, M. W. Mustafa, S. N. Khalid, I. Abubakar and A. M. Abdilahi, Indian J. Sci. Technol., 2016, 9(46), 1–8 Search PubMed.
- M. Sundalian, S. G. Husein and N. K. D. Putri, Biointerface Res. Appl. Chem., 2022, 12, 508–517 CAS.
- A. Omotayo Ibrahim, A. Kolawole Oyebamiji, B. Semire, A. Omotayo, O. Abel Kolawole and S. Banjo, Int. J. Mod. Chem., 2018, 10, 117–137 Search PubMed.
- N. T. McDevitt and W. L. Baun, Spectrochim. Acta, 1964, 20, 799–808 CrossRef CAS.
- S. Modupe Abati, A. Bamisaye, A. Abidemi Adaramaja, A. Rapheal Ige, K. Adesina Adegoke, E. Olurotimi Ogunbiyi, M. Abidemi Idowu, A. B. Olabintan and T. A. Saleh, Fuel, 2024, 364, 130847 CrossRef CAS.
- M. J. Borah, A. Das, V. Das, N. Bhuyan and D. Deka, Fuel, 2019, 242, 345–354 CrossRef CAS.
- V. Enguilo Gonzaga, R. Romero, R. M. Gómez-Espinosa, A. Romero, S. L. Martínez and R. Natividad, ACS Omega, 2021, 6, 24092–24105 CrossRef CAS PubMed.
- H. K. Agbovi and L. D. Wilson, in Natural Polymers-Based Green Adsorbents for Water Treatment, ed. S. Kalia, Elsevier, 2021, pp. 1–51 Search PubMed.
- T. R. Sahoo and B. Prelot, in Nanomaterials for the Detection and Removal of Wastewater Pollutants, ed. B. Bonelli, F. S. Freyria, I. Rossetti and R. Sethi, Elsevier, 2020, pp. 161–222 Search PubMed.
- R. Han, Y. Wang, P. Han, J. Shi, J. Yang and Y. Lu, J. Hazard. Mater., 2006, 137, 550–557 CrossRef CAS PubMed.
- M. Rafatullah, O. Sulaiman, R. Hashim and A. Ahmad, J. Hazard. Mater., 2010, 177, 70–80 CrossRef CAS PubMed.
- V. Vadivelan and K. V. Kumar, J. Colloid Interface Sci., 2005, 286, 90–100 CrossRef CAS PubMed.
- Y. Liu, X. Zhao, J. Li, D. Ma and R. Han, Desalin. Water Treat., 2012, 46, 115–123 CrossRef CAS.
- R.-L. Tseng, S.-K. Tseng and F.-C. Wu, Colloids Surf., A, 2006, 279, 69–78 CrossRef CAS.
- G. Annadurai, R.-S. Juang and D.-J. Lee, J. Hazard. Mater., 2002, 92, 263–274 CrossRef CAS.
- F. Yang, C. Jin, S. Wang, Y. Wang, L. Wei, L. Zheng, H. Gu, S. S. Lam, M. Naushad, C. Li and C. Sonne, Chemosphere, 2023, 323, 138245 CrossRef CAS PubMed.
- C. Waghmare, S. Ghodmare, K. Ansari, M. H. Dehghani, M. Amir Khan, M. A. Hasan, S. Islam, N. A. Khan and S. Zahmatkesh, J. Environ. Manage., 2023, 345, 118815 CrossRef CAS.
- J. Freitas Resende, I. M. Reck Paulino, M. dos Reis Oliveira, B. B. Ferri, R. Bergamasco, M. R. Guilherme, A. W. Rinaldi and A. M. S. Vieira, Can. J. Chem. Eng., 2024, 102, 685–702 CrossRef CAS.
- J. J. Salazar-Rabago, R. Leyva-Ramos, J. Rivera-Utrilla, R. Ocampo-Perez and F. J. Cerino-Cordova, Sustainable Environ. Res., 2017, 27, 32–40 CrossRef CAS.
- S. E. Agarry and O. O. Ogunleye, J. Environ. Prot., 2012, 03, 748–759 CrossRef CAS.
- O. Adeleke, S. A. Akinlabi, T.-C. Jen and I. Dunmade, Environ. Technol., 2020, 43, 1634–1647 CrossRef.
- O. Adeleke and T.-C. Jen, Prediction of Electrical Energy Consumption in University Campus Residence Using FCM-Clustered Neuro-Fuzzy Model, ASME 2022 International Mechanical Engineering Congress and Exposition, 2022, vol. 6, DOI:10.1115/IMECE2022-96793.
- M. Abdul-Hammed, B. Semire, S. Adewale Adegboyega, A. Kolawole Oyebamiji and T. Ayodele Olowolafe, Phys. Chem. Res., 2020, 8, 297–311 Search PubMed.
| This journal is © The Royal Society of Chemistry 2024 |

