DOI:
10.1039/D4RA01052C
(Paper)
RSC Adv., 2024,
14, 12058-12070
Optimization of isotropic MoS2/PES membranes for efficient treatment of industrial oily wastewater†
Received
10th February 2024
, Accepted 1st April 2024
First published on 16th April 2024
Abstract
Elimination of tiny oil droplets nearly miscible with wastewater can be realized using membrane technology through ultrafiltration. The novelty of this work was to blend different phases of molybdenum disulfide (MoS2) in isotropic polyethersulfone (PES). We prepared isotropic PES membranes by optimizing nonsolvent vapour-induced phase separation (VIPS). Membranes were blended with MoS2 nanosheets of different phases to promote separation performance and antifouling resistance. FE-SEM revealed the flower-like surface morphology of MoS2 nanosheets. HR-TEM of MoS2 revealed 2H domains in the monolayer, flakes of a few layers and a d-spacing of 0.22 nm. Raman spectroscopy could be used to distinguish mixed-phase MoS2 from single-phase MoS2. Isotropic PES membranes modified with 70% 1T/2H MoS2 had a significantly high permeance to pure water (6911 kg m−2 h bar). The same membrane possessed a high efficiency of oil rejection of 98.78%, 97.85%, 99.83% for emulsions of industrial crude oil at 100, 1000 and 10![[thin space (1/6-em)]](https://www.rsc.org/images/entities/char_2009.gif) 000 mg L−1, respectively. Removal of oil droplets from wastewater was dominated by a mechanism based on size exclusion. Isotropic PES modified with 2H MoS2 possessed superior oleophilicity, which resulted in low rejection of crude oil. Modified membranes showed excellent fouling resistance for three successive filtration cycles, as evidenced by enhanced antifouling parameters. Our study reveals how the phase composition of MoS2 nanosheets can significantly affect the performance of isotropic PES membranes during the ultrafiltration of oily wastewater.
000 mg L−1, respectively. Removal of oil droplets from wastewater was dominated by a mechanism based on size exclusion. Isotropic PES modified with 2H MoS2 possessed superior oleophilicity, which resulted in low rejection of crude oil. Modified membranes showed excellent fouling resistance for three successive filtration cycles, as evidenced by enhanced antifouling parameters. Our study reveals how the phase composition of MoS2 nanosheets can significantly affect the performance of isotropic PES membranes during the ultrafiltration of oily wastewater.
1. Introduction
Oil removal from wastewater is crucial because it provides an alternative avenue to reuse such water instead of placing it in an open environment.1,2 Enormous amounts of oily wastewater is generated in processing plants that work with different grades of oil, food industries, metallurgical factories, oil refineries or which has been created by oil spills in open natural water sources.3,4 If released into the natural environment, oily wastewater negatively affects aquatic life by cutting off the oxygen supply.5–8 Several treatment technologies for oily wastewater, such as floatation, adsorption, coagulation, flocculation as well as membrane–separation processes have been employed to mitigate negative effects caused by oily wastewater and other harmful organic foulants found in wastewater.9–11 However, membrane technology has proven to be one of the most desirable due to its simplicity of operation, cost effectiveness and low requirements of energy.12–15 In addition, membrane technologies utilize recyclable materials, are made up of compact systems and do not generate secondary pollutants which are unavoidably created in other wastewater treatment techniques (e.g., coagulation and flocculation methods).16 Several types of membranes can be used (e.g., ceramic, metallic, and polymeric). Separation processes based on polymeric membranes are among the chief technologies in membrane–separation processes.17,18 Depending on the size of dispersed oil in the liquid water phase, several filtration processes have been employed, such as microfiltration and ultrafiltration, with the latter being utilized mostly to treat emulsions.19 Due to low consumption of energy as well as the ability to achieve high separation efficiencies, ultrafiltration is applied extensively in fields such as bioengineering, food sterilization, water treatment and purification.20,21 Membrane technology has also been extended to treating wastewater, such as car-wash wastewater, which is composed of different species of foulants such as grease, detergents, oils, heavy metals and sand.22 However, the water obtained from the treatment of wastewater containing multiple foulants should meet the required quality standards to be permitted for reuse in other applications.
PES has found favour as a membrane material owing to its outstanding properties, which include working along a wide pH range, being mechanically consistent, and thermal stability, but causes fouling.23–26 Several approaches have been employed to eliminate fouling through material development or optimization of membrane fabrication.27 For the minimization/elimination of fouling, nanomaterials aimed at improving the surface properties of membranes have been utilized to improve the top selective layer, support layer, interface between the top and support layer or the entire membrane matrix.28 Owing to optimized non solvent-induced phase separation processing (NIPS), it is possible to fabricate anisotropic PES (which is usually simple to achieve but with low performance) or to create an isotropic PES with enhanced performance via vapour-induced phase separation (VIPS).29–31 Isotropic PES membranes possess enhanced resistance to fouling and, if embedded with hydrophilic nanoparticles, this resistance can be improved significantly.32–34
MoS2 is a type of 2D material that can greatly improve the performance of ultrafiltration membranes, especially if used as nanosheets.35,36 This due to several advantages possessed by MoS2 nanosheets: ease of exfoliation, hydrophilicity vs. hydrophobicity properties, and chemical stability.37–40 This creates a possibility for surface and cross-sectional modifications of polymeric membranes by MoS2 nanosheets to enhance performance.41 MoS2 has been utilized to create heterostructures with the help of low-cost hydrothermal techniques and utilized effectively thereafter in the rejection of foulants such as dyes, heavy metals and pharmaceutical foulants from wastewater.42
MoS2 occurs in a metastable metallic octahedral phase i.e., 1T in addition to two semiconducting phases, 2H and 3R, which are stable, and both have trigonal prismatic molybdenum centres.43,44 Preparation of MoS2 in favour of the 1T phase improves the hydrophilicity of the nanosheets which may not be achieved with a single 2H phase.45 By optimizing process parameters, one can synthesize MoS2 nanosheets of mixed or single phases and, if used to modify isotropic PES, this might influence the performance of the resultant nanocomposite membrane. Several researchers have made attempts to blend MoS2 with anisotropic PES but have been scuppered by membranes of low permeability.46,47 The novelty of the present work focussed on blending MoS2 with isotropic PES and assessing the resultant performance towards oil rejection.
In this work, we optimized isotropic PES with MoS2 nanosheets to achieve efficient treatment of industrial oily wastewater. Analyses of the effect of changing the phase of MoS2 nanosheets towards the performance of isotropic PES was keenly considered because use of a given phase could result into a significantly different performance towards treatment of oily wastewater. Defect-free MoS2 nanosheets were synthesized by a low-cost hydrothermal technique to obtain single-phase and mixed-phase powder samples. Thereafter, MoS2 nanosheets were blended with PES after optimal exfoliation of nanosheets in a solvent to create a homogenous doped solution. The latter was casted using VIPS to fabricate large-area flat-sheet isotropic membranes. Oily wastewater was created from a real sample of industrial crude oil and used to formulate several known concentrations of oily wastewater to analyze membrane performance. The samples of fabricated membrane were subjected to several cycles of separation to analyze membrane recyclability as well as antifouling properties. Experimental results enabled deduction of the dominant rejection mechanism, in addition to the correlation between membrane performance and type of MoS2 nanosheets used to enhance the membrane matrix.
2. Methodology
2.1 Materials
The materials used in this study were used as received because they were all of analytical grade. Polyethersulfone (PES) and tagged Ultrason E6020P was supplied by BASF (Germany). Thiourea (CH4N2S) was acquired from Advent ChemBio PVT Limited (India), whereas ammonium molybdate ((NH4)6Mo7O24·4H2O) was bought from Suv Chem Laboratory Chemicals (India). Polyvinylpyrrolidone (PVP) as well as N-methyl-2-pyrrolidone (NMP) were purchased from Loba Chemie PVT Limited (India). Triethylenglycol (TEG) of 98% purity was purchased from Arcos (Belgium). Crude oil collected from a real sample obtained locally from an Egypt-based petroleum company was utilized to synthesize emulsions of crude oil in water at three concentrations (100 mg L−1, 1000 mg L−1, and 10![[thin space (1/6-em)]](https://www.rsc.org/images/entities/char_2009.gif) 000 mg L−1). The viscosity (cSt), specific gravity, API gravity, sulphur concentration (%), density (kg m−3) and P.P (F0) of the crude oil used in this study were 45, 0.915, 23, 3, 0.945 and 40, respectively. All emulsions were made fresh prior to use to avoid the coalescence of oil droplets.
000 mg L−1). The viscosity (cSt), specific gravity, API gravity, sulphur concentration (%), density (kg m−3) and P.P (F0) of the crude oil used in this study were 45, 0.915, 23, 3, 0.945 and 40, respectively. All emulsions were made fresh prior to use to avoid the coalescence of oil droplets.
2.2 Preparation of membranes
MoS2 nanosheets were synthesized using a hydrothermal technique as reported previously.48 Hydrothermal synthesis is a low-cost approach that gives control of molar ratio as well as filling ratios of the autoclave and yields samples with a high degree of purity.49 As shown by the summary in Table 1, sample S1 was fabricated as 70% 1T/2H MoS2. S2 was prepared as 2H MoS2 in the same way as S1 but with addition of thermal treatment at 200 °C for 2 h in a tube furnace under argon gas. Then, MoS2 powders were exfoliated using a water-bath sonicator for 2 h in NMP and later blended with PES, TEG and PVP via magnetic stirring for homogenous mixing. This action was followed by extraction of air bubbles from the doped solution and then casting of membrane sheets using VIPS. This membrane-processing technique involved spreading the doped solution onto a neat glass plate with the help of a casting knife with a gap thickness of 200 μm. The thin liquid film was rapidly subjected to humid air of relative humidity of 80% for a time lag of 3 min. Thereafter, the growing membrane was transferred to a non-solvent (water) coagulation bath at room temperature for 24 h. Modified isotropic membranes comprising PES were enhanced with 0.2 wt% of MoS2 as the best percentage weight of nanosheets added for both phases of MoS2 (Table 2)35 because this had worked well previously with anisotropic PES in one of our published articles.
Table 1 Summary of parameters for the preparation MoS2 samples
| MoS2 |
Hydrothermal cell filling ratio |
Thermal treatment |
Mass of (NH4)6Mo7O24·4H2O (g) |
Mass of NH2CSNH2 (g) |
| S1 (70% 1T/2H) |
0.45 |
— |
2.47 |
0.76 |
| S2 (2H) |
0.45 |
800 °C (2 h under inert atmosphere) |
2.47 |
0.76 |
Table 2 Percentage composition of materials used in blending membrane doped solutions
| Membrane name |
PES (wt%) |
PVP (wt%) |
Relative humidity |
NMP (wt%) |
TEG (wt%) |
MoS2 (wt%) |
| M0 |
12.5 |
12 |
80% |
27 |
48.5 |
— |
| M1 |
12.5 |
12 |
80% |
26.8 |
48.5 |
0.2 of S1 |
| M2 |
12.5 |
12 |
80% |
26.8 |
48.5 |
0.2 of S2 |
2.3 Characterization methods
MoS2 powder was investigated using a field-emission scanning electron microscope (Sigma; Zeiss, Switzerland) with an accelerating voltage set at 20 kV to expose the surface morphology. FE-SEM was also utilized to study the morphology of membrane samples. Atomic-scale images of MoS2 were analysed using a transmission electron microscope (JEM 2100F; Joel, Japan) at an operational voltage of 200 kV. Raman spectroscopy was done using a ProRaman-L system (Enwave Optronics, USA) and an excitation wavelength of 532 nm. The hydrophilicity of the membrane surface was assessed by the sessile-drop method. We dispensed 1.0 μL s−1 of a sample onto a neat surface of the membrane in triplicate using the contact angle (CA) goniometer (OCA Plus 25; Dataphysics, Germany). The bubble-point pore size and mean flow pore size were examined using a porometer (Porolux 1000; IB-FT, Germany). Analysis of changes in functional groups in isotropic PES membranes as a result of adding MoS2 was accomplished by attenuated total reflection-Fourier transform infrared spectroscopy (ATR-FTIR) using the 8400 S system (Shimadzu, Japan). Evaluation of the response to increasing thermal energy as a result of blending MoS2 in isotropic PES was accomplished using a thermogravimetric analyser (TGA 1000; Linseis, Germany).
2.4 Membrane permeability
Permeability (permeance to pure water) for specimens of prepared membranes was studied using a dead-end acrylic filtration/separation cell. To ensure that all tested membranes possessed a stable flow rate of the permeate, all fabricated membranes M0, M1, and M2 (in triplicate) were exposed to high-pressure compaction. The membrane surface must be stabilized adequately to avoid the loss of flux and ensure that the membrane sustains the required performance for an extended time.50 Compaction lasted for 30 min at 2 bar. Before filtration experiments, using an inert argon gas and later using a working pressure of 0.5 bar, pure-water permeance was calculated using the following eqn (1):| |
 | (1) |
This equation is based on the measured volume of solution V (L) crossing the membrane surface (or from the measured mass solution m (kg), crossing the membrane surface) across an active area, A (m2), for specific time t (h), using an operational pressure P (bar), in consideration that the density of water ρw is nearly 1 g cm−3.
2.5 Membrane performance
Removal of crude-oil foulant by M0, M1 and M3 was examined using emulsions of oil in water from industrial heavy-duty crude oil. Three concentrations (100 mg L−1, 1000 mg L−1, and 10![[thin space (1/6-em)]](https://www.rsc.org/images/entities/char_2009.gif) 000 mg L−1) were created in the laboratory using a water-bath sonicator for 2 h. Cyclic separation experiments were conducted simultaneously for each membrane sample to analyse its performance towards oil rejection from emulsions of crude oil in water. Dynamic light scattering (DLS) was used to examine the size distribution of oil droplets in feed and permeate solutions using a Zetasizer Nano ZS system (Malvern Instruments, UK). Removal efficiency was calculated from chemical oxygen demand (COD) analysis utilized in assessment of concentrations of feed solutions (Cf) and that of the permeate solution through membrane samples (Cp). A spectrophotometer (MD200 COD Vario; Lovibond, Germany) was employed to determine COD values. The obtained parameters of Cf and Cp were utilized to compute for oil-removal efficiency via eqn (2):51
000 mg L−1) were created in the laboratory using a water-bath sonicator for 2 h. Cyclic separation experiments were conducted simultaneously for each membrane sample to analyse its performance towards oil rejection from emulsions of crude oil in water. Dynamic light scattering (DLS) was used to examine the size distribution of oil droplets in feed and permeate solutions using a Zetasizer Nano ZS system (Malvern Instruments, UK). Removal efficiency was calculated from chemical oxygen demand (COD) analysis utilized in assessment of concentrations of feed solutions (Cf) and that of the permeate solution through membrane samples (Cp). A spectrophotometer (MD200 COD Vario; Lovibond, Germany) was employed to determine COD values. The obtained parameters of Cf and Cp were utilized to compute for oil-removal efficiency via eqn (2):51| |
 | (2) |
Analysis of the antifouling properties of membranes was studied utilizing emulsions of crude oil in water (100, 1,000, and 10![[thin space (1/6-em)]](https://www.rsc.org/images/entities/char_2009.gif) 000 mg L−1), for different membrane samples (Table 2). A dead-end filtration cell pressurized with argon gas was utilized to subject membrane samples to harsh conditions. We started with membrane compaction, after which we measured permeability to pure water, F0 (kg m−2 h bar), assessed for 1 h and at a working pressure of 0.5 bar. After replacement of pure water with an emulsion of crude oil in water of known concentration, the obtained permeability F1 (kg m−2 h bar) was recorded for 1 h and at a working pressure of 0.5 bar. The surface of the fouled membrane was washed and backwashed using deionized water for 30 min to prepare it for reuse to measure permeability to pure water again. Finally, permeability to pure water, F3 (kg m−2 h bar), was measured at a working pressure of 0.5 bar for 1 h. Switching emulsions of crude oil in water with pure water was repeated for 3 consecutive cycles. The permeance parameters obtained from these cyclic experiments were used to calculate the flux recovery ratio (FRR) by the help of eqn (3). Other parameters of fouling resistance, such as the reversible fouling ratio (Rr, given by eqn (4)), irreversible fouling ratio (Rir, calculated using eqn (5)) and total fouling ratio (Rt, given by eqn (6)), were obtained.29,52,53
000 mg L−1), for different membrane samples (Table 2). A dead-end filtration cell pressurized with argon gas was utilized to subject membrane samples to harsh conditions. We started with membrane compaction, after which we measured permeability to pure water, F0 (kg m−2 h bar), assessed for 1 h and at a working pressure of 0.5 bar. After replacement of pure water with an emulsion of crude oil in water of known concentration, the obtained permeability F1 (kg m−2 h bar) was recorded for 1 h and at a working pressure of 0.5 bar. The surface of the fouled membrane was washed and backwashed using deionized water for 30 min to prepare it for reuse to measure permeability to pure water again. Finally, permeability to pure water, F3 (kg m−2 h bar), was measured at a working pressure of 0.5 bar for 1 h. Switching emulsions of crude oil in water with pure water was repeated for 3 consecutive cycles. The permeance parameters obtained from these cyclic experiments were used to calculate the flux recovery ratio (FRR) by the help of eqn (3). Other parameters of fouling resistance, such as the reversible fouling ratio (Rr, given by eqn (4)), irreversible fouling ratio (Rir, calculated using eqn (5)) and total fouling ratio (Rt, given by eqn (6)), were obtained.29,52,53
| |
 | (3) |
| |
 | (4) |
| |
 | (5) |
| |
 | (6) |
3. Results and discussion
3.1 Structural properties of MoS2 nanosheets
The percentage composition of the 1T phase used in this work had been calculated by M. R. Saber et al., from XPS data while examining the photocatalytic degradation of organic dyes by molybdenum disulfide.48 The micro-flowers characteristic to MoS2 nano-sheets was observed under FE-SEM for all MoS2 powder samples (Fig. 1 a).54,55 HRTEM of S1 in (Fig. 1b) revealed thin petals comprising a few layers of MoS2 nanosheets. The same technique was used to expose the atomic arrangement of Mo and S atoms in the monolayer (Fig. 1 d) and revealed an interatomic distance of 0.22 nm for all MoS2 samples (Fig. 1 c), and a closer size was similarly obtained by H. Tian et al.,36 Raman spectroscopy for powder specimens was done (Fig. 2). Sample S2 showed significant peaks at 405 cm−1 and 377 cm−1, which are linked to A1g and E2g1 modes, respectively, in the 2H phase. However, S1 revealed characteristic peaks for the 1T phase at 239 cm−1 and 334 cm−1, in addition to the optical A2u mode, which was mainly due to octahedral 1T MoS2 at 485 cm−1. This decisively distinguished mixed-phase MoS2 from single phase MoS2. Other characterization methods, such as X-ray diffraction, UV-vis, dynamic light scattering analysis were previously studied in our recent publication40 and used to decisively distinguish between single-phase MoS2 and mixed-phase MoS2.
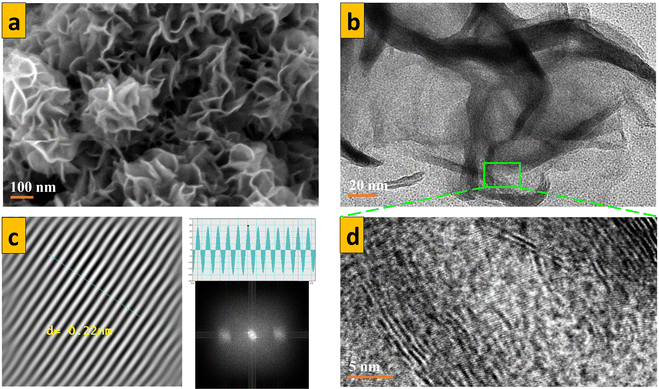 |
| | Fig. 1 (a) SEM and (b) TEM of S1. (c) d-spacing measurement and (d) HRTEM of MoS2 powders revealing the interlayer spacing of nanosheets. | |
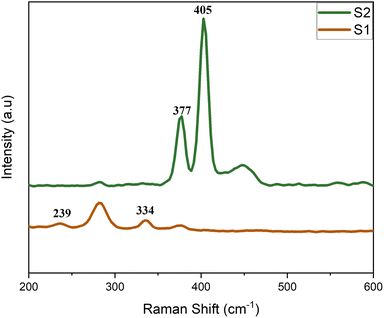 |
| | Fig. 2 Raman spectra of MoS2 powder samples. | |
3.2 Morphology of isotropic PES nanocomposite membranes
Surface as well as cross-sectional SEM images of isotropic membrane samples were obtained for control isotropic PES (Fig. 3a), 70% 1T/2H MoS2-modified isotropic PES (b) and their corresponding cross-sections (c and d). Membrane cross-sections possessed a spongy structure characteristic of isotropic membranes.29,56 Usually, if membrane fabrication using VIPS is not optimized, it can result in an uneven distribution of pores along the membrane structure, which is tantamount to a ‘finger-like structure’ usually obtained via NIPS.57 This was a vital analysis to reveal that preparation of the isotropic membrane had been optimized. EDX elemental analysis (Fig. 4d) confirmed homogenous dispersion of MoS2 along the entire membrane matrix. Mo element was all over the cross-section of the modified isotropic PES membrane, which was not the case for the control membrane (Fig. 4c).
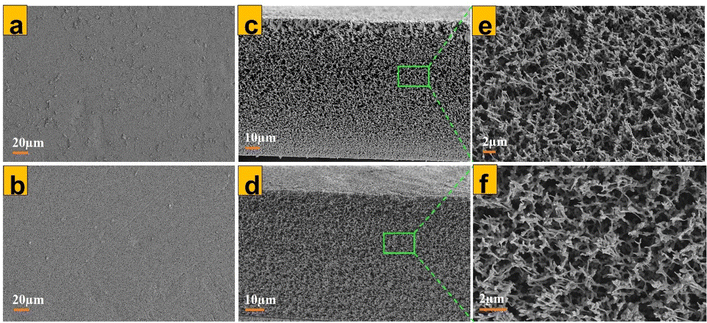 |
| | Fig. 3 (a) and (b) SEM images of the upper surface for an unmodified isotropic PES membrane, M0 as well as 70% 1T/2H-modified isotropic PES membrane, M1. (c) and (d) SEM images of cross-sections for M0 and M1 isotropic PES samples. (e) and (f) Enlarged cross-sections for M0 and M1 isotropic PES membranes. | |
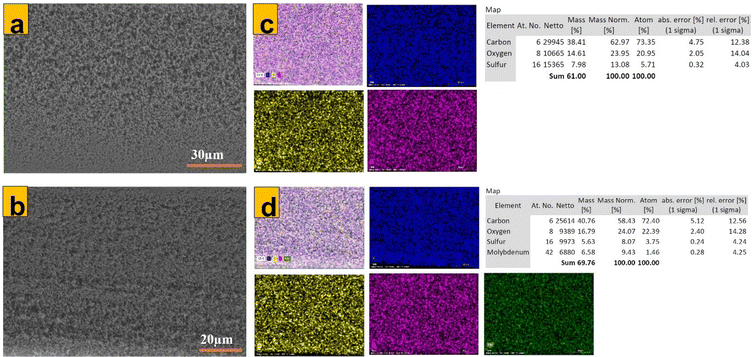 |
| | Fig. 4 (a) and (b) SEM images of cross-sections of unmodified, M0 and 70% 1T/2H-MoS2 modified M1 isotropic PES membranes, with their respective EDX mappings in (c) and (d). | |
3.3 Average pore size and water contact angle of membranes
Bubble-point pore sizes and average pore sizes for modified and unmodified membranes were obtained (Fig. 5a). The homogenous dispersion of MoS2 nanosheets along the symmetric membrane matrix of isotropic PES resulted in a higher average pore size for 70% 1T/2H MoS2-modified isotropic PES than for 2H modified or unmodified isotropic PES. This finding was consistent with the bubble-point pore size obtained for the respective membrane samples. During membrane fabrication by VIPS, there was a slower escape of the solvent from the casted nascent film. Water–vapour conditions and the presence of MoS2 made this escape even slower, resulting in the formation of an evenly distributed and symmetrical optimum-sized pore structure. Measurement of the surface contact angle is an accurate way to assess surface wettability, and this is linked directly to surface hydrophilicity (which influences the permeability and antifouling properties of the surface). A contact angle image was taken 2 s after dropping the liquid water droplet. Isotropic membranes possessed a relatively lower contact angle (41°), which is characteristic of hydrophilic samples. Modification of isotropic PES with 70% 1T/2H MoS2 made the nanocomposite membrane more hydrophilic (CA = 35° whereas 2H MoS2 made the membrane hydrophobic (contact angle = 44° The presence of hydrophilic nanosheets in M1 gave the resultant membrane a superior average pore size as compared with that of M2 (which was modified with hydrophobic MoS2). A high permeance to pure water of M1 could be linked to the hydrophilic nature of 70% 1T/2H MoS2.
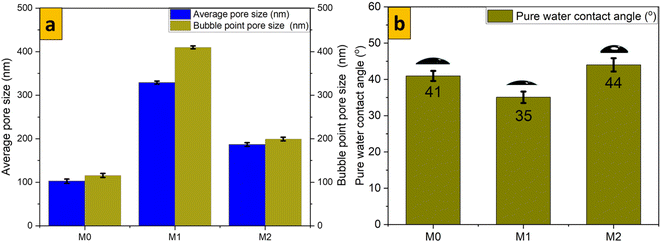 |
| | Fig. 5 (a) Bubble-point size and average pore size; (b) pure water contact angle for membrane samples. | |
3.4 Functional groups and thermogravimetric analysis
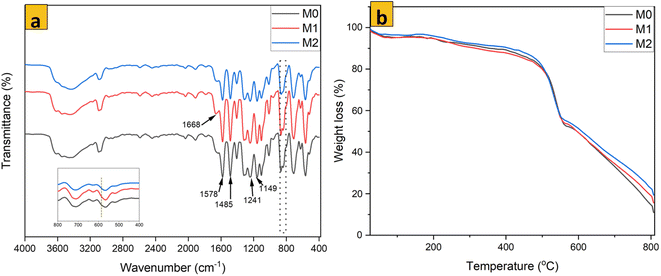
Addition of MoS2 within PES membranes did not alter the functional groups present within PES membranes considerably (Fig. 6a). All IR absorption peaks for unmodified PES were also found in the specimens of modified membranes. Observed peaks could be linked to numerous bond interactions in the PES membrane matrix. The peak at 1578 cm−1 was linked to stretching in the benzene ring or in plane bending of N–H groups. Especially when shifted to 1580 cm−1, the peak at 1485 cm−1 referred to C![[double bond, length as m-dash]](https://www.rsc.org/images/entities/char_e001.gif) C rotation. Aromatic ether expansion was identified at 1241 cm−1. C
C rotation. Aromatic ether expansion was identified at 1241 cm−1. C![[double bond, length as m-dash]](https://www.rsc.org/images/entities/char_e001.gif) O expansion at 1668 cm−1 and peak at 1149 cm−1 were linked to O–H deformation. Stretching vibrations of C–S, C–H, C–N, C–O–C, and C–S were identified at wavenumbers 1487, 1401, 1295, 1242, and 1102 cm−1, respectively.41 An absorption peak for the Mo–S bond was expected to be observed at 590 cm−1. However, the wt% of MoS2 used in nanocomposite membranes was very low, so this peak did not appear in this position, especially for modified membranes (see the inserted plot focused on wavenumbers from 800 to 400 cm−1 in Fig. 6a). ATR-FTIR showed that the nanosheets were dispersed in the PES membrane matrix only by physical blending.
O expansion at 1668 cm−1 and peak at 1149 cm−1 were linked to O–H deformation. Stretching vibrations of C–S, C–H, C–N, C–O–C, and C–S were identified at wavenumbers 1487, 1401, 1295, 1242, and 1102 cm−1, respectively.41 An absorption peak for the Mo–S bond was expected to be observed at 590 cm−1. However, the wt% of MoS2 used in nanocomposite membranes was very low, so this peak did not appear in this position, especially for modified membranes (see the inserted plot focused on wavenumbers from 800 to 400 cm−1 in Fig. 6a). ATR-FTIR showed that the nanosheets were dispersed in the PES membrane matrix only by physical blending.
 |
| | Fig. 6 (a) FTIR spectra and (b) thermogravimetric analysis for membrane samples. | |
The response of membrane samples towards increasing temperature from room temperature, 25 °C to 1000 °C is shown in Fig. 6b. The presence of MoS2 in isotropic PES membrane samples did not cause a significant alteration to the decomposition temperature of the resultant nanocomposite membrane. All membrane samples possessed a similar TGA profile with regard to mass reduction. However, beyond the degradation temperature of PES, reduction of mass for modified samples was slower than that of unmodified PES. This phenomenon could be linked to the enhanced rigidity of the polymer chain and enhanced fracture energy due to the presence of MoS2 in the nanocomposite membrane.36 Residual mass was higher for modified membrane samples than that for unmodified PES. Hence, MoS2 nanosheets had been dispersed and embedded within the PES membrane matrix.58
3.5 Permeability to pure water and permeance of crude oil in water
Pressurizing pure water to cross through isotropic membrane samples (Fig. 7) revealed that permeance to pure water was higher in isotropic membrane samples than in anisotropic samples, as we have shown previously. For isotropic membrane samples, permeance to pure water was highest in M1 at 6911 kg m−2 h bar and lowest in M0. Permeance to pure water for all tested membrane samples was stable after sufficient compaction of membranes. From our previous work on optimal modification of anisotropic PES with 70% 1T/2H MoS2, permeance to pure water up to 778 kg m−2 h bar was obtained, which implied that the same modification in the isotropic PES membrane increased permeance by more than 8-fold.40 Changes in permeance to pure water were consistent for anisotropic and isotropic membrane samples (Fig. 7a and b). A high permeance to pure water of M1 could be ascribed to the hydrophilic nature of 70% 1T/2H MoS2, as confirmed by the contact angle analysis. A lower permeance to pure water of M2 could be linked to 2H MoS2 nanosheets that were blended in this membrane sample, which rendered the membrane hydrophobic, thereby negatively affecting the permeation of water across the membrane matrix.
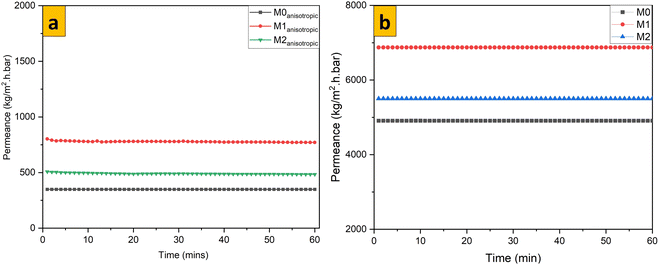 |
| | Fig. 7 Comparison of permeance to pure water for (a) anisotropic and (b) isotropic membrane samples. | |
Different concentrations of emulsions of heavy crude oil in water were passed through M1. All sample solutions possessed the same decay curve for a plot of permeance vs. time revealed by other researchers.59 This behaviour was connected to the fouling tendency of the membrane specimen (because heavy-duty crude oil was used to create the emulsions of oil in water) and harsh operation conditions subjected by the dead-end filtration cell. The decay curve was also characteristic of anisotropic membrane samples and was more affected than that for isotropic membranes. A lower concentration (100 mg L−1) of the emulsion made of real crude oil in water had higher permeance, followed by that for emulsions at 1000 mg L−1 and 10![[thin space (1/6-em)]](https://www.rsc.org/images/entities/char_2009.gif) 000 mg L−1 (Fig. 8a). The fouling tendency of membrane samples increased with an increase in the oily emulsion concentration, and a similar observation has been noted by other researchers working with anisotropic membranes.60 However, anisotropic PES samples suffered increased fouling due to their low flux of pure water compared with that of isotropic PES (for which pure-water flux was extremely high and which led to minimal fouling). For all filtration experiments across M1 (Fig. 8b), all permeate solutions were clear and different from their respective feed solutions. Analysis of particle-size distribution for 1000 mg L−1 feed and permeate solutions across M1 revealed that there was a clear size difference between solutions (Fig. 9).
000 mg L−1 (Fig. 8a). The fouling tendency of membrane samples increased with an increase in the oily emulsion concentration, and a similar observation has been noted by other researchers working with anisotropic membranes.60 However, anisotropic PES samples suffered increased fouling due to their low flux of pure water compared with that of isotropic PES (for which pure-water flux was extremely high and which led to minimal fouling). For all filtration experiments across M1 (Fig. 8b), all permeate solutions were clear and different from their respective feed solutions. Analysis of particle-size distribution for 1000 mg L−1 feed and permeate solutions across M1 revealed that there was a clear size difference between solutions (Fig. 9).
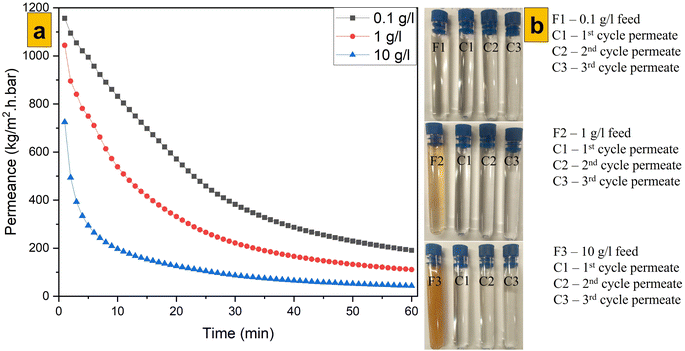 |
| | Fig. 8 (a) Permeance to oil for M1 and (b) feed and permeate solutions through M1. | |
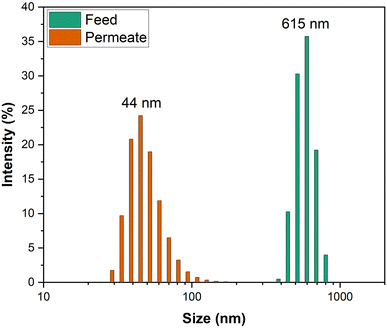 |
| | Fig. 9 Variation in particle size for a crude oil emulsion (1000 mg L−1) passing through M1. | |
3.6 Membrane performance
The main motivation for this study is that unmodified isotropic membranes possess higher performance as compared with anisotropic membranes, as reported recently by Ahmed et al. while working with different concentrations of oil emulsions.29 M1 (Fig. 10b) possessed the highest performance towards cyclic rejection of real emulsions of crude oil compared with that of M0 (Fig. 10a) and M2 (Fig. 10c). As clearly indicated in Fig. 11a–c for M0, M1 and M2, respectively, during the first cycle of rejecting 10![[thin space (1/6-em)]](https://www.rsc.org/images/entities/char_2009.gif) 000 mg L−1 of real crude-oil emulsions, M1 exhibited a rejection of 99.83% compared with M0 for 98.29% and M2 for 81.29%. Higher rejection was achieved at higher concentrations of emulsions due to the possibility of forming larger oil particles, which could be rejected readily. The recombination of dispersed oil particles could have been supported by concentration polarization and because the emulsions used were free of surfactants.61,62 Enhanced performance of oil rejection by M1 could be linked to the hydrophilic nature of embedded 70% 1T/2H MoS2 nanosheets. The latter could have created a continuous hydration layer that minimized the interactions of oil particles with the membrane surface. A low permeability and oil rejection of 2H MoS2-enhanced isotropic PES, M2, s associated with its hydrophobic nature, as earlier confirmed by the water contact angle, which made the nanocomposite membrane more oleophilic.
000 mg L−1 of real crude-oil emulsions, M1 exhibited a rejection of 99.83% compared with M0 for 98.29% and M2 for 81.29%. Higher rejection was achieved at higher concentrations of emulsions due to the possibility of forming larger oil particles, which could be rejected readily. The recombination of dispersed oil particles could have been supported by concentration polarization and because the emulsions used were free of surfactants.61,62 Enhanced performance of oil rejection by M1 could be linked to the hydrophilic nature of embedded 70% 1T/2H MoS2 nanosheets. The latter could have created a continuous hydration layer that minimized the interactions of oil particles with the membrane surface. A low permeability and oil rejection of 2H MoS2-enhanced isotropic PES, M2, s associated with its hydrophobic nature, as earlier confirmed by the water contact angle, which made the nanocomposite membrane more oleophilic.
 |
| | Fig. 10 Permeance to pure water and cyclic oil-rejection performance of (a) M0, (b) M1 and (c) M2. | |
 |
| | Fig. 11 Parameters of cyclic rejection for (a) M0, (b) M1 and (c) M2. | |
The antifouling parameters of different membrane samples towards rejection of an emulsion of crude oil in water (1000 mg L−1) after 3 consecutive cycles are shown Fig. 12–14. The flux recovery ratio of modified samples after the third cycle was higher than that of unmodified PES. Enhanced flux recovery in M1 even after the third cycle could be linked to its improved hydrophilicity. However, there was an anomaly whereby M2 also showed significant flux recovery, and this could have been due to its enhanced pore size (as noted earlier by pore-size analysis). The total fouling ratio of the hydrophilic M1 membrane was lower after the third cycle as compared with that of the hydrophobic M2 membrane and unmodified membrane. The reversible fouling ratio for M0 continued to decrease, whereas that of modified samples remained constant when using the emulsion of crude oil in water at 1000 mg L−1. The irreversible fouling ratio for M0 continued to increase from the first cycle to the third cycle, whereas that for modified samples stayed virtually the same. Membrane fouling increased as the concentration of emulsions of crude oil in water increased. The parameters for membrane fouling for cyclic filtration experiments using concentrations of 100 mg L−1 and 10![[thin space (1/6-em)]](https://www.rsc.org/images/entities/char_2009.gif) 000 mg L−1 are represented in Fig. SI1–SI6.† Comparison of membrane performance in this work with that of other related published work is summarized in Table 3. Digital images of membrane surfaces captured after the first and third cycles (Fig. 15b) revealed that M1 was less affected by fouling due to its hydrophilic nature, when compared with M2 and M0. These data are in agreement with results published recently by our research team: when anisotropic PES membranes were enhanced with MoS2 nanosheets, membrane fouling was enhanced more on hydrophobic surfaces than on hydrophilic surfaces.62
000 mg L−1 are represented in Fig. SI1–SI6.† Comparison of membrane performance in this work with that of other related published work is summarized in Table 3. Digital images of membrane surfaces captured after the first and third cycles (Fig. 15b) revealed that M1 was less affected by fouling due to its hydrophilic nature, when compared with M2 and M0. These data are in agreement with results published recently by our research team: when anisotropic PES membranes were enhanced with MoS2 nanosheets, membrane fouling was enhanced more on hydrophobic surfaces than on hydrophilic surfaces.62
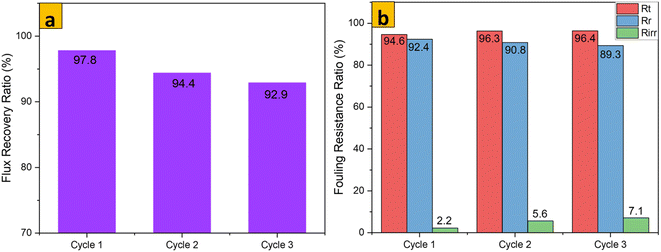 |
| | Fig. 12 FRR and flux resistance ratio of M0 for an emulsion of crude oil in water (1000 mg L−1) after 3 cycles. | |
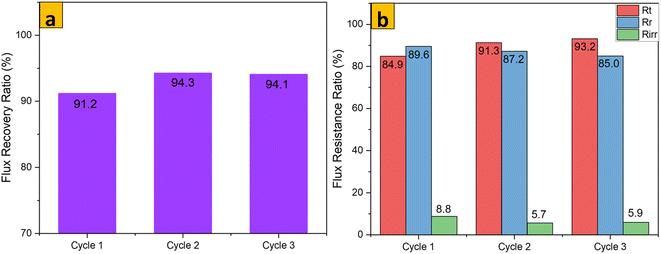 |
| | Fig. 13 FRR and flux resistance ratio of M1 for an emulsion of crude oil in water (1000 mg L−1) after 3 cycles. | |
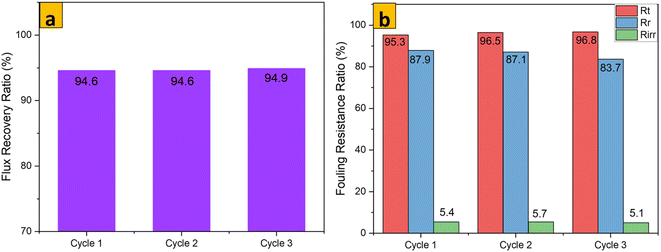 |
| | Fig. 14 FRR and flux resistance ratio of M2 for an emulsion of crude oil in water (1000 mg L−1) after 3 cycles. | |
Table 3 Comparison of the performance of PES membranes towards rejection of organic foulants
| Polymer type |
Nanoadditive (optimum wt%) |
PWF (L /(m2 H)) |
FRR (%) |
Contact angle (°) |
Foulant |
Rejection (%) |
Reference |
| Anisotropic PES |
— |
347 |
— |
72.0 |
Crude oil |
98 (1 g L−1) |
29 |
| Anisotropic PES |
MoS2 (0.2 wt%) |
388 |
79.0 |
61.6 |
Crude oil |
99 (1 g L−1) |
40 |
| Isotropic PES |
— |
4721 |
— |
39.0 |
Crude oil |
99 (1 g L−1) |
29 |
| Anisotropic PES |
PFSA-g-MWCNT |
477.83 |
70.96 |
58 |
Bovine serum albumin |
86.29 (0.5 g L−1) |
66 |
| Anisotropic PES |
ZnFe2O4 |
687 |
82 |
52 |
Oil/water emulsion |
96 (500 mg L−1) |
67 |
| Anisotropic PES |
TiO2–CdS |
42.1 |
97 |
47 |
Activated sludge suspension |
95 (1 g L−1) |
68 |
| Anisotropic PES |
UiO-66-NH2/MOF |
66.01 |
95.22 |
62.15 |
Diesel oil |
99 (500 ppm) |
69 |
| Anisotropic PES |
Antimony tin oxide |
25 |
99 |
57 |
Oil sands produced water |
40 (organic matter removal) |
70 |
| Isotropic PES |
MoS2 (0.2 wt%) |
6911 |
94.1 |
35.0 |
Crude oil |
97.85 (1.0 g L−1) |
This work |
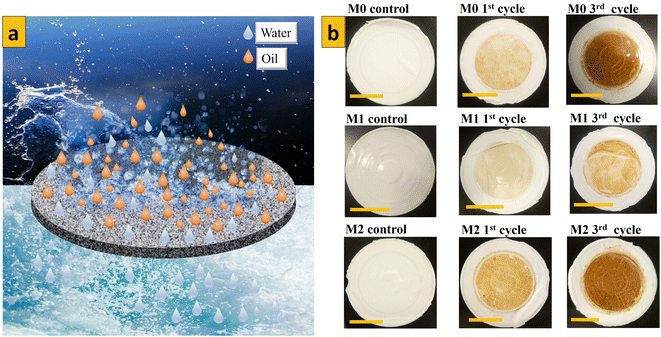 |
| | Fig. 15 (a) Mechanism of fouling of isotropic membranes (schematic). (b) Digital images of fouled membranes by an emulsion of crude oil in water (1000 mg L−1) after different cycles. | |
Immiscible oil droplets dispersed in used emulsions were eliminated by size exclusion (Fig. 15a).57,63 The presence of MoS2 nanosheets during pore formation resulted in the creation of characteristic pore sizes in the membrane matrix, which could eliminate only oil particles but let water pass through the membrane. If particles are not reacting with the membrane surface for separation to occur, filtration is controlled by membrane cut-off, which is determined by the particle-size distribution in the emulsion being separated and pore size.64 Dispersed oil particles were larger than membrane pores and so could not pass through the membrane, but the hydrophilicity of the membrane surface also affected oil-droplet rejection significantly (see the graphical abstract). Improved membrane performance coupled with the potential for reuse after appropriate cleaning procedures render the membranes we fabricated economically feasible because operational costs associated with the membranes we prepared will be lower compared with those of other techniques. For the latter, extra operational costs are inevitable for dealing with secondary pollutants (in flocculation and coagulation processes) and if the material used to treat oily wastewater is almost irrecoverable (adsorption processes using powder adsorbents).65 However, before modification of isotropic PES membranes with MoS2 nanosheets, the nature of the nanosheets to be used and, most importantly, the phase must be considered. Therefore, keen attention must be paid to the phase type of MoS2 nanosheets to be mixed within the isotropic PES membrane matrix because various phases can alter the performance of isotropic PES membranes in different ways.
4. Conclusions
In this work, isotropic PES membranes were optimized with MoS2 nanosheets of different phases by optimum processing factors to achieve homogenously blended large-sheet membranes. VIPS was utilized to achieve high-performance membranes and used for the elimination of crude oil from synthetic emulsions of oil in water formulated using industrial crude oil. SEM revealed the flower-like structure of MoS2. HR-TEM revealed the atomic structure and interlayer spacing of MoS2 nanosheets. A decisive distinction of single-phase MoS2 from multiple phase. MoS2 was revealed using Raman spectroscopy. The isotropic PES sample modified with addition of 0.2 wt% of 70% 1T/2H MoS2 exhibited optimal performance, with a significantly higher permeance to pure water of 6911 kg m−2.h.bar. The same membrane (M1) showed a high efficiency of oil rejection of 98.78%, 97.85%, 99.83% for crude-oil emulsions of 100, 1000 and 10![[thin space (1/6-em)]](https://www.rsc.org/images/entities/char_2009.gif) 000 mg L−1, respectively, and these emulsions were prepared from real industrial crude-oil emulsions. This work revealed that phase variation of MoS2 nanosheets influenced the performance of modified isotropic PES membranes if applied by ultrafiltration of oily wastewater. The improved permeance to pure water, in addition to the rejection of oil from crude-oil emulsions, indicates the potential of using high-performance MoS2-modified isotropic PES membranes for enhanced oil rejection from oily wastewater.
000 mg L−1, respectively, and these emulsions were prepared from real industrial crude-oil emulsions. This work revealed that phase variation of MoS2 nanosheets influenced the performance of modified isotropic PES membranes if applied by ultrafiltration of oily wastewater. The improved permeance to pure water, in addition to the rejection of oil from crude-oil emulsions, indicates the potential of using high-performance MoS2-modified isotropic PES membranes for enhanced oil rejection from oily wastewater.
Data availability
Upon reasonable request, raw data regarding this work can be requested through the corresponding author.
Author contributions
Oscar Kayanja carried out data collection and manuscript writing. Mohsen A. Hassan supervised research activities and analysed the results. Ahmed Hassanin supervised the methodology and analysed the results. Hidenori Ohashi supervised research work and revised the manuscript. Ahmed S. G. Khalil supervised overall research activities as well as reviewing and verifying the final version of this manuscript.
Conflicts of interest
There are no conflicts of interest to declare.
Acknowledgements
This work was funded under the TICAD 7 scholarship and partially funded by Excel-Water supported by DAAD. Our sincere appreciation is extended to the governments of Japan and Egypt for their generosity in sponsoring this study from the Egypt-Japan University of Science and Technology (E-JUST) within the framework of TICAD 7 scholarships. Some analyses in this work were sponsored through a project (Excel-Water) supported financially through DAAD in partnership with the University of Duisburg-Essen(UDE). Appreciation is extended to Ahmed Abdel-Aty of the Materials for Environmental and Biomedical Applications Laboratory (MEBA) in E-JUST due to his wonderful assistance in experimental studies. Some characterizations in this work were acquired from the Center for Environmental and Smart Technology, ESTG within Fayoum University (Egypt).
References
- H. J. Tanudjaja, C. A. Hejase, V. V. Tarabara, A. G. Fane and J. W. Chew, Water Res., 2019, 156, 347–365 CrossRef CAS PubMed.
- T. C. Mokhena and A. S. Luyt, J. Clean. Prod., 2017, 156, 470–479 CrossRef CAS.
- T. Ahmad, C. Guria and A. Mandal, J. Water Process Eng., 2020, 36, 101289 CrossRef.
- M. K. M. Abd-Elbaki, R. M. G. Ahmed and A. S. G. Khalil, J. Clean. Prod., 2022, 365, 132707 CrossRef CAS.
- L. Kumar, M. Chugh, S. Kumar, K. Kumar, J. Sharma and N. Bharadvaja, Process Saf. Environ. Prot., 2022, 159, 362–375 CrossRef CAS.
- S. Huang, R. H. A. Ras and X. Tian, Curr. Opin. Colloid Interface Sci., 2018, 36, 90–109 CrossRef CAS.
- W. Ma, L. Lin, J. Yang, Z. Liu, X. Li, M. Xu, X. Li, C. Wang, Q. Xin and K. Zhao, J. Ind. Eng. Chem., 2023, 120, 231–243 CrossRef CAS.
- N. Zhang, Y. Qi, Y. Zhang, J. Luo, P. Cui and W. Jiang, Ind. Eng. Chem. Res., 2020, 59, 14546–14568 CrossRef CAS.
- C. Xing, L. Liu, X. Guo, M. Zhang, M. Zhou, S. Zhang and C. Liu, Sep. Purif. Technol., 2023, 317, 123774 CrossRef CAS.
- D. Weerakoon, B. Bansal, L. P. Padhye, A. Rachmani, L. J. Wright, G. Silyn and S. Baroutian, Sep. Purif. Technol., 2023, 314, 123652 CrossRef CAS.
- Z. Niavarani, D. Breite, B. Ulutaş, A. Prager, N. Ömer Kantoğlu, B. Abel, R. Gläser and A. Schulze, RSC Adv., 2023, 13, 32928–32938 RSC.
- Z. Yang, P. F. Sun, X. Li, B. Gan, L. Wang, X. Song, H. D. Park and C. Y. Tang, Environ. Sci. Technol., 2020, 54, 15563–15583 CrossRef CAS PubMed.
- P. D. Sutrisna, K. A. Kurnia, U. W. R. Siagian, S. Ismadji and I. G. Wenten, J. Environ. Chem. Eng., 2022, 10, 107532 CrossRef CAS.
- N. Nasrollahi, L. Ghalamchi, V. Vatanpour, A. Khataee and M. Yousefpoor, J. Ind. Eng. Chem., 2022, 109, 100–124 CrossRef CAS.
- N. S. N. Hasnan, M. A. Mohamed, N. A. Anuar, M. F. Abdul Sukur, S. F. Mohd Yusoff, W. N. A. Wan Mokhtar, Z. A. Mohd Hir, N. A. Mohd Shohaimi and H. Ahmad Rafaie, J. Ind. Eng. Chem., 2022, 113, 32–71 CrossRef CAS.
- O. Kayanja, A. A. R. Abdel-Aty, M. A. Hassan, A. Hassanin, H. Ohashi and A. S. G. Khalil, Surface. Interfac., 2023, 43, 103578 CrossRef CAS.
- L. Jaber, I. W. Almanassra, S. N. Backer, V. Kochkodan, A. Shanableh and M. A. Atieh, Membranes, 2022, 12, 1143 CrossRef CAS PubMed.
- W. Al-gethami, A. Qamar, A. M. A. Alaghaz and A. Farhan, RSC Adv., 2024, 14, 2804–2834 RSC.
- S. Saki and N. Uzal, Environ. Sci. Pollut. Res., 2018, 25, 25315–25326 CrossRef CAS PubMed.
- H. Wu, L. Wang, W. Xu, Z. Xu and G. Zhang, Membranes, 2023, 13, 241 CrossRef CAS PubMed.
- R. Joshi, N. Sebat, K. Chi, M. Khan, K. I. Johnson, A. G. Alhamzani, M. A. Habib, T. Lindstrom and B. S. Hsiao, Membranes, 2023, 13, 1–19 CrossRef PubMed.
- W. Tomczak and M. Gryta, Membranes, 2023, 13, 321 CrossRef CAS PubMed.
- T. Arumugham, M. Ouda, R. Krishnamoorthy, A. Hai, N. Gnanasundaram, S. W. Hasan and F. Banat, Environ. Res., 2022, 204, 112390 CrossRef CAS PubMed.
- I. M. A. Elsherbiny, A. S. G. Khalil and M. Ulbricht, Membranes, 2019, 9, 67 CrossRef CAS PubMed.
- M. Gao, S. Wang, Y. Ji, Z. Cui, F. Yan, M. Younas, J. Li and B. He, J. Ind. Eng. Chem., 2022, 111, 247–254 CrossRef CAS.
- D. Mazerolle, B. Bronson and B. Kruczek, Ind. Eng. Chem. Res., 2021, 60, 3083–3094 CrossRef CAS.
- Y. K. Poon, S. Kartini, E. Ab, Q. H. Ng, P. Y. Hoo, N. Y. Abdullah, A. Nasib and N. S. Abdullah, Membranes, 2023, 13, 373 CrossRef CAS PubMed.
- S. Lyn, S. El, M. Majumder and E. Von Lau, Sep. Purif. Technol., 2023, 314, 123544 CrossRef.
- A. A. R. Abdel-Aty, Y. S. A. Aziz, R. M. G. Ahmed, I. M. A. ElSherbiny, S. Panglisch, M. Ulbricht and A. S. G. Khalil, Sep. Purif. Technol., 2020, 253, 117467 CrossRef CAS.
- I. M. A. ElSherbiny, R. Ghannam, A. S. G. Khalil and M. Ulbricht, J. Membr. Sci., 2015, 493, 782–793 CrossRef CAS.
- A. Dehban, A. Kargari and F. Z. Ashtiani, J. Ind. Eng. Chem., 2020, 88, 292–311 CrossRef CAS.
- M. Sharma, C. V. T. Mendes, P. Alves and L. M. Gando-Ferreira, J. Ind. Eng. Chem., 2022, 114, 254–262 CrossRef CAS.
- L. Ghalamchi, S. Aber, V. Vatanpour and M. Kian, J. Ind. Eng. Chem., 2019, 70, 412–426 CrossRef CAS.
- S. Pourjafar, A. Rahimpour and M. Jahanshahi, J. Ind. Eng. Chem., 2012, 18, 1398–1405 CrossRef CAS.
- S. Arefi-Oskoui, A. Khataee, M. Safarpour and V. Vatanpour, Sep. Purif. Technol., 2020, 238, 116495 CrossRef CAS.
- H. Tian, X. Wu and K. Zhang, Membranes, 2021, 11, 96 CrossRef CAS PubMed.
- Y. Li, C. Tang, L. Yang, Y. Sun and W. Ju, Arab. J. Sci. Eng., 2021, 46, 6753–6763 CrossRef CAS.
- J. J. Beh, B. S. Ooi, J. K. Lim, E. P. Ng and H. Mustapa, J. Water Process Eng., 2020, 33, 101031 CrossRef.
- B. A. Ali, O. I. Metwalli, A. S. G. Khalil and N. K. Allam, ACS Omega, 2018, 3, 16301–16308 CrossRef CAS PubMed.
- O. Kayanja, M. A. Hassan, A. Hassanin, H. Ohashi and A. S. G. Khalil, Process Saf. Environ. Prot., 2023, 171, 55–70 CrossRef CAS.
- X. Wang, C. Wu, T. Zhu, P. Li and S. Xia, Chemosphere, 2020, 256, 127099 CrossRef CAS PubMed.
- S. Zhou, J. Gao, S. Wang, H. Fan, J. Huang and Y. Liu, Environ. Sci. Pollut. Res., 2020, 27, 13882–13894 CrossRef CAS PubMed.
- A. M. Omar, O. I. Metwalli, M. R. Saber, G. Khabiri, M. E. M. Ali, A. Hassen, M. M. H. Khalil, A. A. Maarouf and A. S. G. Khalil, RSC Adv., 2019, 9, 28345–28356 RSC.
- C. Mutalik, D. I. Krisnawati, S. B. Patil, M. Khafid, D. S. Atmojo, P. Santoso, S. C. Lu, D. Y. Wang and T. R. Kuo, ACS Sustain. Chem. Eng., 2021, 9, 7904–7912 CrossRef CAS.
- L. Liu, S. Qu, Z. Yang and Y. Chen, Ind. Eng. Chem. Res., 2020, 59, 18160–18169 CrossRef CAS.
- I. Alam, L. M. Guiney, M. C. Hersam and I. Chowdhury, J. Membr. Sci., 2020, 599, 117812 CrossRef CAS.
- X. Wen, C. He, Y. Hai, X. Liu, R. Ma, J. Sun, X. Yang, Y. Qi, J. Chen and H. Wei, RSC Adv., 2021, 11, 26391–26402 RSC.
- M. R. Saber, G. Khabiri, A. A. Maarouf, M. Ulbricht and A. S. G. Khalil, RSC Adv., 2018, 8, 26364–26370 RSC.
- S. Iftekhar, A. Deb, G. Heidari, M. Sillanpää, V. P. Lehto, B. Doshi, M. Hosseinzadeh and E. N. Zare, Environ. Sci. Pollut. Res., 2023, 30, 16947–16983 CrossRef CAS PubMed.
- D. Kalmykov, S. Shirokikh, E. A. Grushevenko, S. A. Legkov, G. N. Bondarenko, T. S. Anokhina, S. Molchanov and S. D. Bazhenov, Membranes, 2023, 13, 544 CrossRef CAS PubMed.
- U. Zulfiani, A. Junaidi, C. Nareswari, B. T. I. Ali, J. Jaafar, A. R. Widyanto, N. Saiful, H. N. C. Dharma and N. Widiastuti, RSC Adv., 2023, 13, 7789–7797 RSC.
- F. Mohammadnezhad, M. Feyzi and S. Zinadini, J. Ind. Eng. Chem., 2019, 71, 99–111 CrossRef CAS.
- M. A. Hussein, H. K. Shahzad, F. Patel, M. A. Atieh, N. Al-Aqeeli, T. N. Baroud and T. Laoui, Nanomaterials, 2020, 10, 1–15 CrossRef PubMed.
- N. Kong, C. Chen, Q. Zeng, B. Li, L. Shen and H. Lin, Sep. Purif. Technol., 2022, 302, 122178 CrossRef CAS.
- X. Wang, Q. Xiao, C. Wu, P. Li and S. Xia, Chem. Eng. J., 2021, 416, 129154 CrossRef CAS.
- A. L. Ahmad, A. A. Abdulkarim, B. S. Ooi and S. Ismail, Chem. Eng. J., 2013, 223, 246–267 CrossRef CAS.
- S. Arefi-Oskoui, A. Khataee, S. Jabbarvand Behrouz, V. Vatanpour, S. Haddadi Gharamaleki, Y. Orooji and M. Safarpour, Sep. Purif. Technol., 2022, 280, 119822 CrossRef CAS.
- H. Tian, S. Yang, X. Wu and K. Zhang, Colloids Surf., A, 2023, 656, 130328 CrossRef CAS.
- A. A. R. Abdel-Aty, R. M. G. Ahmed, I. M. A. ElSherbiny, S. Panglisch, M. Ulbricht and A. S. G. Khalil, Sep. Purif. Technol., 2023, 311, 123286 CrossRef CAS.
- N. Nasrollahi, S. Aber, V. Vatanpour and N. M. Mahmoodi, Mater. Chem. Phys., 2019, 222, 338–350 CrossRef CAS.
- N. H. Othman, N. S. Fuzil, N. H. Alias, M. Z. Shahruddin, M. S. M. Shayuti, W. J. Lau, A. F. Ismail, S. Z. Abidin, S. Sulaiman and T. D. Kusworo, Emergent Mater., 2022, 0123456789 Search PubMed.
- J. J. Torres, N. E. Rodriguez, J. T. Arana, N. A. Ochoa, J. Marchese and C. Pagliero, J. Clean. Prod., 2017, 141, 641–647 CrossRef CAS.
- N. S. Suhalim, N. Kasim, E. Mahmoudi, I. J. Shamsudin, A. W. Mohammad, F. M. Zuki and N. L. A. Jamari, Nanomaterials, 2022, 12, 473 CrossRef PubMed.
- N. F. Al Harby, M. El-Batouti and M. M. Elewa, Nanomaterials, 2022, 12, 3637 CrossRef CAS PubMed.
- I. Petrinic, J. Korenak, D. Povodnik and C. Hélix-Nielsen, J. Clean. Prod., 2015, 101, 292–300 CrossRef CAS.
- C. Wang, L. Zhang, H. Yuan, Y. Fu, Z. Zeng and J. Lu, New J. Chem., 2021, 45, 4950–4962 RSC.
- P. Kallem, I. Othman, M. Ouda, S. W. Hasan, I. AlNashef and F. Banat, Process Saf. Environ. Prot., 2021, 148, 813–824 CrossRef CAS.
- H. Zangeneh, A. A. Zinatizadeh and S. Zinadini, Sep. Purif. Technol., 2020, 240, 116591 CrossRef CAS.
- M. Samari, S. Zinadini, A. A. Zinatizadeh, M. Jafarzadeh and F. Gholami, Sep. Purif. Technol., 2020, 251, 117010 CrossRef CAS.
- B. Khorshidi, S. A. Hosseini, G. Ma, M. McGregor and M. Sadrzadeh, Polymers, 2019, 163, 48–56 CrossRef CAS.
|
| This journal is © The Royal Society of Chemistry 2024 |
Click here to see how this site uses Cookies. View our privacy policy here.  Open Access Article
 *de
*de
![[thin space (1/6-em)]](https://www.rsc.org/images/entities/char_2009.gif) 000 mg L−1, respectively. Removal of oil droplets from wastewater was dominated by a mechanism based on size exclusion. Isotropic PES modified with 2H MoS2 possessed superior oleophilicity, which resulted in low rejection of crude oil. Modified membranes showed excellent fouling resistance for three successive filtration cycles, as evidenced by enhanced antifouling parameters. Our study reveals how the phase composition of MoS2 nanosheets can significantly affect the performance of isotropic PES membranes during the ultrafiltration of oily wastewater.
000 mg L−1, respectively. Removal of oil droplets from wastewater was dominated by a mechanism based on size exclusion. Isotropic PES modified with 2H MoS2 possessed superior oleophilicity, which resulted in low rejection of crude oil. Modified membranes showed excellent fouling resistance for three successive filtration cycles, as evidenced by enhanced antifouling parameters. Our study reveals how the phase composition of MoS2 nanosheets can significantly affect the performance of isotropic PES membranes during the ultrafiltration of oily wastewater.![[thin space (1/6-em)]](https://www.rsc.org/images/entities/char_2009.gif) 000 mg L−1). The viscosity (cSt), specific gravity, API gravity, sulphur concentration (%), density (kg m−3) and P.P (F0) of the crude oil used in this study were 45, 0.915, 23, 3, 0.945 and 40, respectively. All emulsions were made fresh prior to use to avoid the coalescence of oil droplets.
000 mg L−1). The viscosity (cSt), specific gravity, API gravity, sulphur concentration (%), density (kg m−3) and P.P (F0) of the crude oil used in this study were 45, 0.915, 23, 3, 0.945 and 40, respectively. All emulsions were made fresh prior to use to avoid the coalescence of oil droplets.

![[thin space (1/6-em)]](https://www.rsc.org/images/entities/char_2009.gif) 000 mg L−1) were created in the laboratory using a water-bath sonicator for 2 h. Cyclic separation experiments were conducted simultaneously for each membrane sample to analyse its performance towards oil rejection from emulsions of crude oil in water. Dynamic light scattering (DLS) was used to examine the size distribution of oil droplets in feed and permeate solutions using a Zetasizer Nano ZS system (Malvern Instruments, UK). Removal efficiency was calculated from chemical oxygen demand (COD) analysis utilized in assessment of concentrations of feed solutions (Cf) and that of the permeate solution through membrane samples (Cp). A spectrophotometer (MD200 COD Vario; Lovibond, Germany) was employed to determine COD values. The obtained parameters of Cf and Cp were utilized to compute for oil-removal efficiency via eqn (2):51
000 mg L−1) were created in the laboratory using a water-bath sonicator for 2 h. Cyclic separation experiments were conducted simultaneously for each membrane sample to analyse its performance towards oil rejection from emulsions of crude oil in water. Dynamic light scattering (DLS) was used to examine the size distribution of oil droplets in feed and permeate solutions using a Zetasizer Nano ZS system (Malvern Instruments, UK). Removal efficiency was calculated from chemical oxygen demand (COD) analysis utilized in assessment of concentrations of feed solutions (Cf) and that of the permeate solution through membrane samples (Cp). A spectrophotometer (MD200 COD Vario; Lovibond, Germany) was employed to determine COD values. The obtained parameters of Cf and Cp were utilized to compute for oil-removal efficiency via eqn (2):51
![[thin space (1/6-em)]](https://www.rsc.org/images/entities/char_2009.gif) 000 mg L−1), for different membrane samples (Table 2). A dead-end filtration cell pressurized with argon gas was utilized to subject membrane samples to harsh conditions. We started with membrane compaction, after which we measured permeability to pure water, F0 (kg m−2 h bar), assessed for 1 h and at a working pressure of 0.5 bar. After replacement of pure water with an emulsion of crude oil in water of known concentration, the obtained permeability F1 (kg m−2 h bar) was recorded for 1 h and at a working pressure of 0.5 bar. The surface of the fouled membrane was washed and backwashed using deionized water for 30 min to prepare it for reuse to measure permeability to pure water again. Finally, permeability to pure water, F3 (kg m−2 h bar), was measured at a working pressure of 0.5 bar for 1 h. Switching emulsions of crude oil in water with pure water was repeated for 3 consecutive cycles. The permeance parameters obtained from these cyclic experiments were used to calculate the flux recovery ratio (FRR) by the help of eqn (3). Other parameters of fouling resistance, such as the reversible fouling ratio (Rr, given by eqn (4)), irreversible fouling ratio (Rir, calculated using eqn (5)) and total fouling ratio (Rt, given by eqn (6)), were obtained.29,52,53
000 mg L−1), for different membrane samples (Table 2). A dead-end filtration cell pressurized with argon gas was utilized to subject membrane samples to harsh conditions. We started with membrane compaction, after which we measured permeability to pure water, F0 (kg m−2 h bar), assessed for 1 h and at a working pressure of 0.5 bar. After replacement of pure water with an emulsion of crude oil in water of known concentration, the obtained permeability F1 (kg m−2 h bar) was recorded for 1 h and at a working pressure of 0.5 bar. The surface of the fouled membrane was washed and backwashed using deionized water for 30 min to prepare it for reuse to measure permeability to pure water again. Finally, permeability to pure water, F3 (kg m−2 h bar), was measured at a working pressure of 0.5 bar for 1 h. Switching emulsions of crude oil in water with pure water was repeated for 3 consecutive cycles. The permeance parameters obtained from these cyclic experiments were used to calculate the flux recovery ratio (FRR) by the help of eqn (3). Other parameters of fouling resistance, such as the reversible fouling ratio (Rr, given by eqn (4)), irreversible fouling ratio (Rir, calculated using eqn (5)) and total fouling ratio (Rt, given by eqn (6)), were obtained.29,52,53


![[double bond, length as m-dash]](https://www.rsc.org/images/entities/char_e001.gif) C rotation. Aromatic ether expansion was identified at 1241 cm−1. C
C rotation. Aromatic ether expansion was identified at 1241 cm−1. C![[double bond, length as m-dash]](https://www.rsc.org/images/entities/char_e001.gif) O expansion at 1668 cm−1 and peak at 1149 cm−1 were linked to O–H deformation. Stretching vibrations of C–S, C–H, C–N, C–O–C, and C–S were identified at wavenumbers 1487, 1401, 1295, 1242, and 1102 cm−1, respectively.41 An absorption peak for the Mo–S bond was expected to be observed at 590 cm−1. However, the wt% of MoS2 used in nanocomposite membranes was very low, so this peak did not appear in this position, especially for modified membranes (see the inserted plot focused on wavenumbers from 800 to 400 cm−1 in Fig. 6a). ATR-FTIR showed that the nanosheets were dispersed in the PES membrane matrix only by physical blending.
O expansion at 1668 cm−1 and peak at 1149 cm−1 were linked to O–H deformation. Stretching vibrations of C–S, C–H, C–N, C–O–C, and C–S were identified at wavenumbers 1487, 1401, 1295, 1242, and 1102 cm−1, respectively.41 An absorption peak for the Mo–S bond was expected to be observed at 590 cm−1. However, the wt% of MoS2 used in nanocomposite membranes was very low, so this peak did not appear in this position, especially for modified membranes (see the inserted plot focused on wavenumbers from 800 to 400 cm−1 in Fig. 6a). ATR-FTIR showed that the nanosheets were dispersed in the PES membrane matrix only by physical blending.

![[thin space (1/6-em)]](https://www.rsc.org/images/entities/char_2009.gif) 000 mg L−1 (Fig. 8a). The fouling tendency of membrane samples increased with an increase in the oily emulsion concentration, and a similar observation has been noted by other researchers working with anisotropic membranes.60 However, anisotropic PES samples suffered increased fouling due to their low flux of pure water compared with that of isotropic PES (for which pure-water flux was extremely high and which led to minimal fouling). For all filtration experiments across M1 (Fig. 8b), all permeate solutions were clear and different from their respective feed solutions. Analysis of particle-size distribution for 1000 mg L−1 feed and permeate solutions across M1 revealed that there was a clear size difference between solutions (Fig. 9).
000 mg L−1 (Fig. 8a). The fouling tendency of membrane samples increased with an increase in the oily emulsion concentration, and a similar observation has been noted by other researchers working with anisotropic membranes.60 However, anisotropic PES samples suffered increased fouling due to their low flux of pure water compared with that of isotropic PES (for which pure-water flux was extremely high and which led to minimal fouling). For all filtration experiments across M1 (Fig. 8b), all permeate solutions were clear and different from their respective feed solutions. Analysis of particle-size distribution for 1000 mg L−1 feed and permeate solutions across M1 revealed that there was a clear size difference between solutions (Fig. 9).![[thin space (1/6-em)]](https://www.rsc.org/images/entities/char_2009.gif) 000 mg L−1 of real crude-oil emulsions, M1 exhibited a rejection of 99.83% compared with M0 for 98.29% and M2 for 81.29%. Higher rejection was achieved at higher concentrations of emulsions due to the possibility of forming larger oil particles, which could be rejected readily. The recombination of dispersed oil particles could have been supported by concentration polarization and because the emulsions used were free of surfactants.61,62 Enhanced performance of oil rejection by M1 could be linked to the hydrophilic nature of embedded 70% 1T/2H MoS2 nanosheets. The latter could have created a continuous hydration layer that minimized the interactions of oil particles with the membrane surface. A low permeability and oil rejection of 2H MoS2-enhanced isotropic PES, M2, s associated with its hydrophobic nature, as earlier confirmed by the water contact angle, which made the nanocomposite membrane more oleophilic.
000 mg L−1 of real crude-oil emulsions, M1 exhibited a rejection of 99.83% compared with M0 for 98.29% and M2 for 81.29%. Higher rejection was achieved at higher concentrations of emulsions due to the possibility of forming larger oil particles, which could be rejected readily. The recombination of dispersed oil particles could have been supported by concentration polarization and because the emulsions used were free of surfactants.61,62 Enhanced performance of oil rejection by M1 could be linked to the hydrophilic nature of embedded 70% 1T/2H MoS2 nanosheets. The latter could have created a continuous hydration layer that minimized the interactions of oil particles with the membrane surface. A low permeability and oil rejection of 2H MoS2-enhanced isotropic PES, M2, s associated with its hydrophobic nature, as earlier confirmed by the water contact angle, which made the nanocomposite membrane more oleophilic.
![[thin space (1/6-em)]](https://www.rsc.org/images/entities/char_2009.gif) 000 mg L−1 are represented in Fig. SI1–SI6.† Comparison of membrane performance in this work with that of other related published work is summarized in Table 3. Digital images of membrane surfaces captured after the first and third cycles (Fig. 15b) revealed that M1 was less affected by fouling due to its hydrophilic nature, when compared with M2 and M0. These data are in agreement with results published recently by our research team: when anisotropic PES membranes were enhanced with MoS2 nanosheets, membrane fouling was enhanced more on hydrophobic surfaces than on hydrophilic surfaces.62
000 mg L−1 are represented in Fig. SI1–SI6.† Comparison of membrane performance in this work with that of other related published work is summarized in Table 3. Digital images of membrane surfaces captured after the first and third cycles (Fig. 15b) revealed that M1 was less affected by fouling due to its hydrophilic nature, when compared with M2 and M0. These data are in agreement with results published recently by our research team: when anisotropic PES membranes were enhanced with MoS2 nanosheets, membrane fouling was enhanced more on hydrophobic surfaces than on hydrophilic surfaces.62


![[thin space (1/6-em)]](https://www.rsc.org/images/entities/char_2009.gif) 000 mg L−1, respectively, and these emulsions were prepared from real industrial crude-oil emulsions. This work revealed that phase variation of MoS2 nanosheets influenced the performance of modified isotropic PES membranes if applied by ultrafiltration of oily wastewater. The improved permeance to pure water, in addition to the rejection of oil from crude-oil emulsions, indicates the potential of using high-performance MoS2-modified isotropic PES membranes for enhanced oil rejection from oily wastewater.
000 mg L−1, respectively, and these emulsions were prepared from real industrial crude-oil emulsions. This work revealed that phase variation of MoS2 nanosheets influenced the performance of modified isotropic PES membranes if applied by ultrafiltration of oily wastewater. The improved permeance to pure water, in addition to the rejection of oil from crude-oil emulsions, indicates the potential of using high-performance MoS2-modified isotropic PES membranes for enhanced oil rejection from oily wastewater.


