 Open Access Article
Synthesis and characterization of TiO2/hydrochar matrix composites for enhanced ammonia degradation
Ling Zhaoa,
Jiaxing Sunab,
Shuang E.bc,
Kuichuan Sheng bcd,
Kaiying Wangb and
Ximing Zhang
 *bcde
*bcde
aCollege of Engineering, Shenyang Agricultural University, Shenyang 110161, China
bCollege of Biosystems Engineering and Food Science, Zhejiang University, Hangzhou, 310058, China. E-mail: zhangximing@zju.edu.cn
cInstitute of Zhejiang University-Quzhou, 99 Zheda Road, Quzhou, Zhejiang Province 324000, China
dKey Laboratory of Intelligent Equipment and Robotics for Agriculture of Zhejiang Province, Hangzhou, 310058, China
eNational Key Laboratory of Biobased Transportation Fuel Technology, Zhejiang University, Hangzhou 310027, China
First published on 16th April 2024
Abstract
This study explores the limitations of TiO2 as a photocatalyst, focusing on its narrow bandwidth and high electron–hole complexation probabilities that restrict its applications. A novel one-pot synthesis method for TiO2/hydrochar matrix composites is presented, with variations achieved through control of hydrothermal temperature, time, and loading concentration. The efficacy of these composites in ammonia removal is investigated, revealing optimal performance for the composite denoted as 3Ti-160-7, synthesized with a titanium salt concentration of 0.3 mol L−1, a hydrothermal temperature of 160 °C, and a hydrothermal time of 7 hours. Comparative analyses with commercial TiO2 (P25) and hydrochar demonstrate superior performance of 3Ti-160-7, exhibiting significantly lower ammonia concentration and reduced NO and NO2 concentrations. This research underscores the cost-effectiveness and application potential of TiO2/hydrochar matrix composites, offering valuable insights for the enhancement of photocatalytic activity and broader applicability in addressing TiO2-related challenges.
Introduction
It is widely acknowledged that large-scale atmospheric pollution has inflicted profound negative consequences, posing a substantial threat to human well-being and sustainable development, particularly in developing nations.1,2 Hazardous gases, including sulfur oxides, nitrogen oxides, and ammonia, have been identified as culprits in causing severe health issues such as nasopharyngeal inflammation, nausea, breathing difficulties, and even cancer. NH3 gas, known for its potent alkaline and corrosive nature, emits undesirable odors even at concentrations as low as 50–100 ppm, leading to severe ocular, dermal, and respiratory effects.3,4 Furthermore, elevated concentrations of NH3/NH4+ in drinking water compromise the effectiveness of chlorine disinfection for human consumption. To safeguard water quality, the World Health Organization has established a stringent maximum ammonia concentration in drinking water at 1.24 ppm. On the other hand, the reduced nitrogen form of NH4+, existing in an ionized and water-soluble state, differs from free ammonia, which is a gaseous molecule.Ammonia stems from various sources, including agricultural activities,5 wastewater treatment,6 and landfills.7 Due to its highly hydrophilic nature, ammonia readily reacts with air pollutants like SOx, NOx, and liquid-phase sulfuric and nitric acids, forming secondary particulate matter such as ammonium salts, accounting for a significant portion of PM2.5 (20–80%). The correlation between atmospheric NH4+ content and PM2.5 levels has a detrimental impact on air quality, posing a serious threat to environmental balance. Moreover, ammonia can be oxidized to nitrogen oxides (NOx), emerging as a primary contributor to recent air pollution, drawing increasing attention as a pollutant.8
Presently, ammonia removal methods in China predominantly rely on traditional physical, chemical, and biological approaches, characterized by drawbacks such as high cost, extended cycle times, and high operating expenses, rendering them inadequate to meet increasingly stringent emission standards.9,10 Thus, there is a pressing need to explore alternative treatment methods to effectively address the challenges posed by ammonia pollution. Photocatalytic reactions, known for their mild conditions, present a promising approach for pollutant removal, generating highly active oxidants under ultraviolet and visible light to interact with environmental pollutants, decomposing them into smaller, benign molecules such as CO2 or H2O.11–14 Despite the widespread use of semiconductors like TiO2, ZnO, and CuO in photocatalysis, TiO2, in particular, stands out due to its low toxicity, chemical stability, and environmental friendliness.15,16 However, inherent limitations, such as high photoelectron–hole pair complexation rates, a wide bandgap, and poor reactant adsorption,17,18 hinder its ability to produce hydroxyl radicals (-OH), limiting its photocatalytic activity.19,20
To overcome these limitations, researchers have explored various techniques, including metal and non-metal doping21,22 or precious metal loading,23 with carbon materials such as graphene, fullerene, and nanotubes garnering attention for their potential to enhance photogenerated carrier separation and improve photocatalytic efficiency.24 However, the synthesis of these carbon materials involves hazardous reagents, extreme conditions, and high costs,25 necessitating the exploration of alternative materials with low cost, high chemical stability, and environmental friendliness. Biochar, derived from waste biomass, emerges as a promising candidate.
Biochar, particularly from agricultural and forestry waste, exhibits a tailorable pore structure, dominant position, and modifiable surface functional groups, making it an ideal carrier for photocatalysts.26,27 Biochar is mainly classified into pyrolytic carbon and hydrochar. The application of pyrolytic carbon as a photocatalytic carrier has been reported28,29 Compositing TiO2 with biochar has shown promise in designing photocatalysts with stable multiphase properties, improving catalyst aggregation, pore volume, and recycling efficiency. Biochar's unique ability to capture electrons transferred from TiO2 enhances carrier separation efficiency.30,31 The low cost, environmental friendliness, and carbon sequestration properties of biochar make it an ideal carrier for nano-TiO2 catalyst loading.
The preparation methods of TiO2/biochar composites mainly include sol–gel method, direct impregnation method, roasting method, hydrothermal/solvent-thermal method, etc. The one-step hydrothermal method is a non-homogeneous reaction using water as the reaction medium under high temperature and high pressure. One-step hydrothermal method is a non-homogeneous reaction carried out under high temperature and high pressure with water as the reaction medium, which has the advantages of low synthesis temperature, mild conditions, stable system, less impurity mixing, and has the advantages of crystal integrity, less agglomeration, etc. Compared with other methods, some of them are complicated and costly.32 Compared with other methods, some of them are complicated and time-consuming to operate, some of them require high temperature treatment and high energy consumption, and the formed morphology is irregular, which is not conducive to the timely desorption of pollutants.33,34
This research investigates TiO2/hydrochar matrix composites, synthesized via a one-pot method, optimizing preparation conditions for enhanced photocatalytic degradation of pollutants. Comparative analyses of surface properties and chemical structures shed light on the composite's characteristics, emphasizing the synergy of adsorption and photocatalysis. The developed TiO2/hydrochar matrix composites address the drawbacks of TiO2, providing an effective and economically viable solution for ammonia removal, with potential applications in swine farm pollutant remediation.
Experimental part
Materials
The corn straw was collected in Shenhe District, Shenyang City, Liaoning Province, China, air-dried and crushed through 40 mesh sieves, and stored in sealed bags. Tributyl titanate (98%) was purchased from China Pharmaceutical Chemical Reagent Company. Commercial TiO2 (P25) was purchased from Shanghai Nai Cheng Biotechnology Company, China.Sample preparation
![[thin space (1/6-em)]](https://www.rsc.org/images/entities/char_2009.gif) :
:![[thin space (1/6-em)]](https://www.rsc.org/images/entities/char_2009.gif) 3. After that, a certain amount of deionised water was added slowly, and the configured precursor solution was ultrasonicated for 10 min to make the mixture homogeneous and form a milky white solution.
3. After that, a certain amount of deionised water was added slowly, and the configured precursor solution was ultrasonicated for 10 min to make the mixture homogeneous and form a milky white solution.After that, the preparation conditions such as temperature, time and precursor concentration were optimized. First optimize the temperature conditions, 5.0 g of corn straw (40 mesh) was weighed and mixed with 50 mL (0.3 mol L−1) of precursor solution in a quartz liner, and the reaction temperatures were controlled to be 160, 220, and 280 °C. The reaction time was 4 h with continuous magnetic stirring at 200 rpm. And after cooled down to the ambient temperature, the solid product was washed with deionised water for several times, and dried overnight in an oven at 105 °C. The prepared materials were photocatalytic tested to determine the optimal conditions, and then time and precursor concentration were optimized sequentially; the specific preparation steps and processes were the same as above, and the samples were labeled according to the 10-fold precursor concentration–temperature–time, and the resulting samples were named as 3Ti-160-4, 3Ti-220-4, and 3Ti-280-4, 3Ti-160-1, 3Ti-160-7, 1Ti-160-7, and 5Ti-160-7, respectively.
![[thin space (1/6-em)]](https://www.rsc.org/images/entities/char_2009.gif) :
:![[thin space (1/6-em)]](https://www.rsc.org/images/entities/char_2009.gif) 10 to a reactor with an adapted inner liner at a reaction temperature of 160 °C, a magnetic stirring speed of 200 rpm, and a reaction time of 7 h. The solid product was cooled to ambient temperature and washed several times with deionized water. The solid product was cooled to ambient temperature, washed several times with deionized water and dried in an oven at 105 °C overnight. The resulting sample was labeled as CS-160-7.
10 to a reactor with an adapted inner liner at a reaction temperature of 160 °C, a magnetic stirring speed of 200 rpm, and a reaction time of 7 h. The solid product was cooled to ambient temperature and washed several times with deionized water. The solid product was cooled to ambient temperature, washed several times with deionized water and dried in an oven at 105 °C overnight. The resulting sample was labeled as CS-160-7.Characterization
X-Ray diffraction (D2 Phaser, Bruker, Germany) was used to study the phase and crystallization of samples. The diffraction spectrum in the range of 2θ = 5–80° was scanned at a rate of 4°/min. Scanning electron microscope (SEM, Gemini 300, Germany) was used to observe the morphology of the samples. FTIR spectra was obtained using a FTIR Spectrometer (Nicolet FT-IR, Thermo Fisher, USA) and the data were obtained in the wavenumber range from 4000 to 500 cm−1. Specific surface areas and porosity characteristics were conducted with Brunauer–Emmett–Teller (BET) method using an automatic nitrogen adsorption analyzer (ASAP 2460, Micromeritics, USA). Its composition and chemical state were analyzed using X-ray photoelectron spectroscopy (Thermo Scientific K-Alpha, Thermo Fisher, USA). UV-Vis spectroscopy (UV-3600plus, Shimazhu, Japan) was used to detect UV-vis absorption characteristics.Photocatalytic test
The evaluation of NH3 removal was carried out in a fixed bed continuous flow reactor as shown in Fig. 1. The gas type, concentration and flow rate were controlled by a portable gas calibrator (146i-GO, Thermo Fisher Scientific, USA). The reaction device is a quartz tube, placed in a black box, the quartz tube size is 50 cm long and 5 cm in diameter, made of high purity quartz with high light transmission, the light source is placed directly above the quartz tube. The light source is divided into ultraviolet lamps and fluorescent lamps, ultraviolet light source for the wavelength of 254 nm ultraviolet lamp (Philips), the power of 11 W. Fluorescent lamps for the silicone strip, the wavelength in the 455–175 nm, the power of 14 W. Light source illumination of about 500lx. When the test will be the sample laid flat in the size of 3 × 5 cm slide, placed in the centre of the quartz tube, so that the light source directly on the material.The flow rate at the inlet end was 1 L min−1 at 10 ppm NH3 (O2 and N2 as equilibrium gases), controlled by a portable gas calibrator (146i-GO, Thermo Fisher Scientific, USA). The outlet side was directly connected to a detector for determination of NH3, NO, NO2 and NOx concentrations via an air quality instrument (17i, Thermo Fisher Scientific, USA). The tests were performed at room temperature.
(1) Test of ammonia removal effect of optimised process materials under different light sources
Firstly, the TiO2/hydrochar matrix composites prepared by optimising the conditions in each step were tested for NH3 removal effect separately. The time of each test was 1.5 h, the amount of sample used was 0.1 g, and the ammonia concentration C was automatically recorded by the machine every minute during the test.
In the absence of samples, nitrogen was first introduced for 30 min to exclude other gases from interfering, after which ammonia at a concentration of 10 ppm at 1 L min−1 was continuously introduced for 90 min to obtain the background value of the device, recorded as C0.
To test the removal effect of the samples, nitrogen was first introduced for 30 min to exclude the interference of other gases, and then ammonia gas with a concentration of 10 ppm at 1 L min−1 was continuously introduced for 90 min under different light sources (dark environment, ultraviolet light and daylight) to obtain the removal effect of the samples on ammonia under different light sources, and the ammonia concentration in the testing process was recorded as Cx (x represents different samples).
The experiment assessed the effectiveness of the photocatalyst by the removal rate (ηx), where the removal formula was calculated by the following equation
The effects of temperature, residence time and precursor concentration on the physicochemical properties and removal effect of the materials were analysed by comparing the test results of the seven materials prepared above. And the optimal preparation conditions were preferred as the precursor concentration of 0.3 mol L−1, and the treatment group with hydrothermal at 160 °C for 7 h had the best ammonia removal effect.
(2) Test of outlet NH3, NO and NO2 concentration of CS-160-7 (hydrochar), P25 and 3Ti-160-7
In order to compare the material prepared in this study with the existing commercially available TiO2 (P25), whether it has an advantage in the removal of ammonia. And whether it is a synergistic effect of TiO2 with hydrochar matrix composites or it simply increases the adsorption of ammonia by hydrochar. So subsequent comparative analyses were carried out to analyse the changes in the concentrations of NH3, NO, NO2 and NOx in the photocatalytic tests of 3Ti-160-7, TiO2 (P25) and CS-160-7 under the same conditions.
Results and discussion
X-Ray diffraction
We used XRD to analyze the crystal structure information of the prepared TiO2/hydrochar based photocatalysts and TiO2 (P25) as shown in Fig. 2 The XRD analysis offers valuable insights into the structural properties of hydrothermal carbon-based photocatalysts. Understanding the intricate relationship between synthesis conditions and material structure holds the key to enhancing the activity of these materials for specific environmental applications. The X-ray diffraction (XRD) patterns of carbon-based photocatalysts synthesized under diverse hydrothermal conditions and TiO2 (P25) are presented, revealing diffraction peaks at 2θ = 25.3°, 37.7°, 48.1°, 55.1°, 62.7°, 70.2°, 75.0° corresponding to (101), (004), (200), (211), (204), (220), and (215) of the anatase phase TiO2 crystalline planes, as specified in Standard Card PDF #04-0477. The XRD analysis confirms the anatase phase structure of TiO2/hydrochar matrix composites, aligning with the diffraction peaks observed in P25. However, the primary peak (101) of the TiO2/hydrochar matrix composites is comparatively lower than that of P25. This attenuation results primarily from the reduced intensity of characteristic peaks of the titanium dioxide anatase phase in the composite, leading to the formation of defective structures, such as oxygen vacancies, which impact its crystallization. | ||
| Fig. 2 XRD spectra of carbon based photocatalysts and P25 (a) different hydrothermal temperatures (b) different heating times (c) different concentrations of catalyst precursor (tetrabutyl titanate). | ||
Additionally, the appearance of a diffraction peak at 22.5° in Fig. 2 is attributed to the cellulose (002) crystal plane, a characteristic diffraction peak of type I cellulose.35 Fig. 2(a) illustrates the XRD plot of samples prepared at 160, 220, and 280 °C with a tetrabutyl titanate solution concentration of 0.3 mol L−1 and a hold time of 4 h. As the hydrothermal temperature increases, the TiO2 diffraction peaks are notably enhanced, and the characteristic peaks of cellulose gradually diminish. Fig. 2(b) displays samples prepared with a solvent concentration of 0.3 mol L−1 at a hydrothermal temperature of 160 °C, held for 1, 4, and 7 h, respectively. Fig. 2(c) showcases samples prepared with the catalyst precursor (tetrabutyl titanate) at concentrations of 0.1, 0.3, 0.5 mol L−1, at a hydrothermal temperature of 160 °C, with a holding time of 7 h, respectively. The XRD analysis demonstrates that the diffraction peaks of TiO2 are heightened with an increase in Ti element concentration in the solvent, concurrently promoting the hydrolysis of cellulose.
Fourier infrared spectroscopy
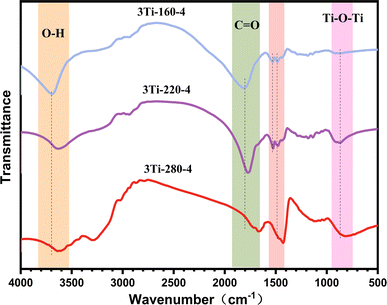
To investigate surface group changes in carbon photocatalysts prepared at varying temperatures, the IR spectra of 3Ti-160-4, 3Ti-220-4, and 3Ti-280-4 are depicted in Fig. 3. The prominent absorption peak observed around 3635 cm−1 is attributed primarily to the O–H tensile vibration, and this stretching vibration gradually diminishes with increasing reaction temperature. Peaks within the 1793–1666 cm−1 range are attributed to saturated C![[double bond, length as m-dash]](https://www.rsc.org/images/entities/char_e001.gif) O groups, while those in the 1532–1113 cm−1 range correspond to various tensile vibrations of carbon–carbon double bonds and single bonds.36 The intensities of these peaks progressively increase with a rise in hydrothermal temperature. The bond between metal and oxygen (O–Ti–O) is discernible in the strong absorption band at 804 cm−1.37,38
O groups, while those in the 1532–1113 cm−1 range correspond to various tensile vibrations of carbon–carbon double bonds and single bonds.36 The intensities of these peaks progressively increase with a rise in hydrothermal temperature. The bond between metal and oxygen (O–Ti–O) is discernible in the strong absorption band at 804 cm−1.37,38
Building upon literature reports,39 it is established that, under the influence of an applied light source, the hydroxyl group on the carbon-based material's surface can be captured by holes generated by titanium dioxide, leading to the production of hydroxyl radicals. This mechanism prevents holes from recombining with electrons, thereby enhancing photocatalytic performance. Consequently, water and hydroxyl groups emerge as pivotal factors in improving photocatalytic efficiency.32,40–42 The peak of maximum intensity was observed in the hydroxyl vibration of the sample prepared at 160 °C, making it the most promising photocatalyst for effective photocatalytic degradation.
Scanning electron microscopy and energy spectrometry
SEM analysis was employed to examine the morphology and microstructure of TiO2/hydrochar matrix composites prepared at different temperatures, as illustrated in Fig. 4. During the hydrothermal treatment process, the structure of corn straw undergoes deconstruction, leading to the emergence of numerous nano-scale spherical carbon particles on its surface. This phenomenon may be attributed to the hydrothermal treatment converting hemicellulose, cellulose, and lignin in corn straw into small organic molecules, which subsequently undergo condensation and polymerization, resulting in the formation of the observed spherical carbon particles.43 Notably, titanium dioxide was observed to be anchored on the surface of these carbon microspheres. At a preparation temperature of 220 °C, a significant enlargement of the char microspheres was observed. Conversely, at a preparation temperature of 280 °C, a marked reduction in the size of char microspheres was evident.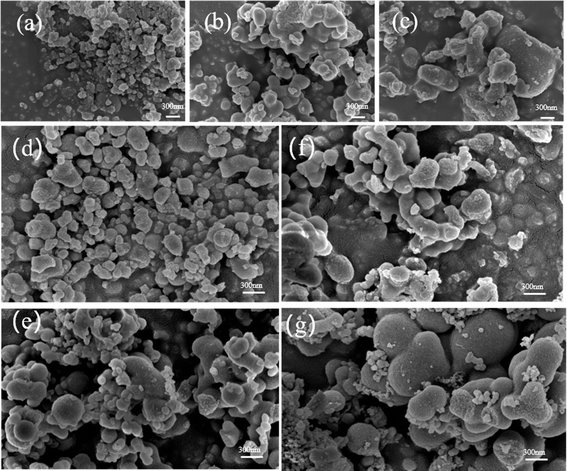 | ||
| Fig. 4 (a) SEM images of (a) 3Ti-160-4, (b) 3Ti-220-4, (c) 3Ti-280-4, (d) 3Ti-160-1, (e) 3Ti-160-7, (f) 1Ti-160-7, (g) 5Ti-160-7. | ||
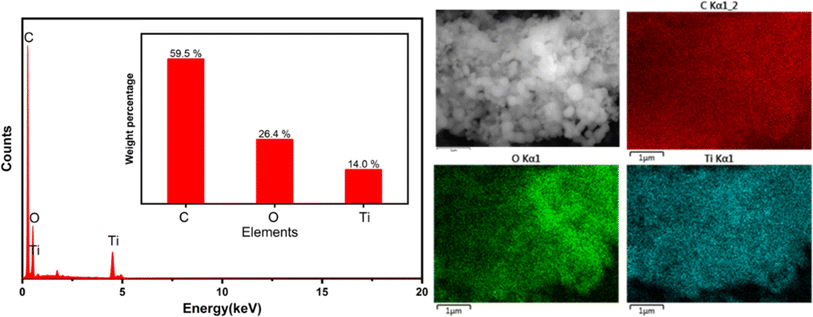
Energy dispersive X-ray (EDS) spectra were acquired through scanning electron microscopy (SEM) for an in-depth analysis of the elemental composition of the 3Ti-160-7 carbon-based photocatalysts, as depicted in Fig. 5. The obtained spectra unequivocally revealed the presence and homogeneous dispersion of carbon, oxygen, and titanium elements across the material's surface. This elemental composition insight is crucial for understanding the structural characteristics and potential catalytic properties of the synthesized photocatalysts. The atomic mass ratios, expressed in weight percentages (wt%), were found to be 59.5% for carbon, 26.4% for oxygen, and 14.0% for titanium. These ratios signify a well-balanced and controlled distribution of the constituent elements, indicative of the successful integration of titanium dioxide onto the carbon matrix. The uniform dispersion of these elements highlights the potential synergy between carbon and titanium in the photocatalytic performance of the 3Ti-160-7 composite, offering valuable information for further elucidating its catalytic mechanisms and optimizing its application in environmental remediation processes.
Specific surface area and isothermal adsorption–desorption curves
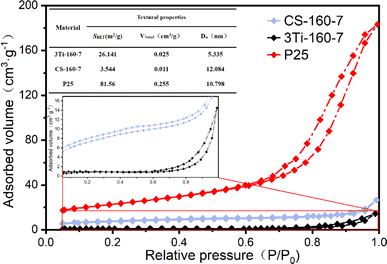
Fig. 6 illustrates the nitrogen adsorption isotherms of CS-160-7, 3Ti-160-7, and TiO2, revealing distinctive characteristics of their porous structures. At low relative pressures (P/P0 < 0.1), all three materials exhibited relatively low nitrogen adsorption capacities, each below 20 cm3 g−1, suggesting the presence of a limited number of micropores. As the relative pressure increased (P/P0 > 0.1), a gradual uptick in adsorption was observed, indicating the existence of mesopores and macropores in both 3Ti-160-7 and TiO2 (P25). The nitrogen adsorption–desorption isotherms for all three materials conformed to type IV adsorption isotherms (IUPAC classification).44 TiO2 (P25) exhibited an H2 hysteresis loop, characteristic of typical inorganic oxide porous substances, resulting from the channel interconnection effect.45 In contrast, 3Ti-160-7 displayed H4-type hysteresis loops, indicating the presence of gap-like pores in the composite, with a tendency to rise at higher relative pressures.The specific surface area of CS-160-7 measured 3.54 m2 g−1, whereas 3Ti-160-7 showed a substantial improvement, reaching 26.14 m2 g−1—an enhancement of nearly 8 times compared to CS-160-7. Additionally, the total pore volume of 3Ti-160-7 nearly doubled compared to CS-160-7, with the average pore size reduced to approximately 5 nm. Loading titanium elements onto the carbon-based photocatalyst contributed to these improvements in specific surface area and total pore volume characteristics. In comparison, TiO2 (P25) exhibited an SBET of 81.556 m2 g−1, a total pore volume of 0.255 cm3 g−1, and an average pore size of 10.798 nm—significantly larger than those of CS-160-7 and 3Ti-160-7, respectively. These findings underscore the impact of titanium loading on the porous structure of the photocatalyst, showcasing its potential for enhanced adsorption and catalytic performance in environmental applications.
UV-visible diffuse reflectance spectrum
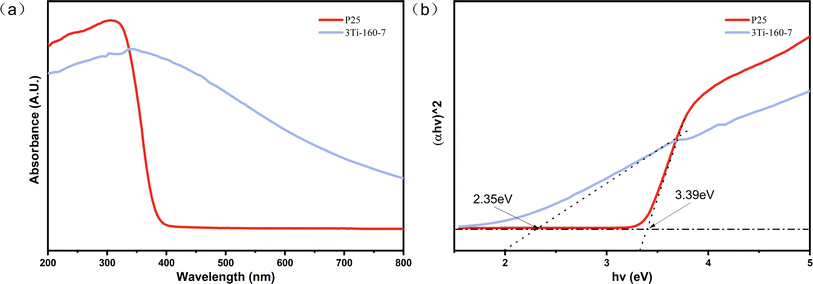
The optical absorption characteristics of the synthesized 3Ti-160-7 and TiO2 (P25) were investigated, as illustrated in Fig. 7. Commercial TiO2 (P25) exhibited an absorption peak around 400 nm, indicative of its limited responsiveness to visible light. In contrast, 3Ti-160-7 demonstrated significant absorption in the visible region, attributed to its elevated carbon content. The hydrothermal processes, involving the hydrolysis of substances like hemicellulose and cellulose into small molecules that subsequently polymerize into carbon microspheres, could lead to the entrapment of titanium dioxide within carbonaceous materials. This finding aligns with Maletić et al.'s observations in the synthesis of TiO2/biochar composites using glucose.46 This substitution or doping mechanism effectively narrows the band gap of TiO2, enabling the catalyst to efficiently absorb visible light, a crucial factor for enhanced photocatalytic performance.39 It provides a broad prospect for enhancing the photocatalytic activity and expanding the application of using solar energy for environmental remediation.The optical bandgap energies (Eg) of 3Ti-160-7 and commercial titanium dioxide (P25) were estimated to be 2.35 eV and 3.39 eV, respectively, using the Tauc plot method.47 3Ti-160-7 showed a significantly reduced bandgap compared to titanium dioxide (P25), which may be due to the absorption of the carrier hydrothermal charcoal matrix, or the charcoal elemental participation effect; this indicates that its ability to utilize visible light has been improved, which provides a broad prospect for enhancing the photocatalytic activity and expanding the application of solar energy for environmental remediation.
X-Ray photoelectron spectroscopy
Fig. 8 provides a detailed insight into the X-ray photoelectron spectroscopy (XPS) spectra of the 3Ti-160-7 carbon-based photocatalyst. A thorough analysis of the high-resolution C 1s spectrum reveals dominant elemental carbon peaks at 284.6 and 285.6 eV, corresponding to sp2 and sp3 hybridized carbon, respectively. Additionally, a subtle peak near 287.1 eV is discernible, attributed to oxygen-bound species denoted as C–O/N. This comprehensive C 1s spectrum offers valuable information about the carbon bonding environment within the photocatalyst. Fig. 8(b) depicts the XPS spectra of O 1s, presenting two distinctive peaks at 532.8 and 530.5 eV. These peaks are attributed to C–O and Ti–O, respectively, offering insights into the oxygen-containing functionalities present in the 3Ti-160-7 photocatalyst. The detailed examination of the O 1s spectrum provides valuable information about the surface oxygen chemistry and its interaction with carbon and titanium components.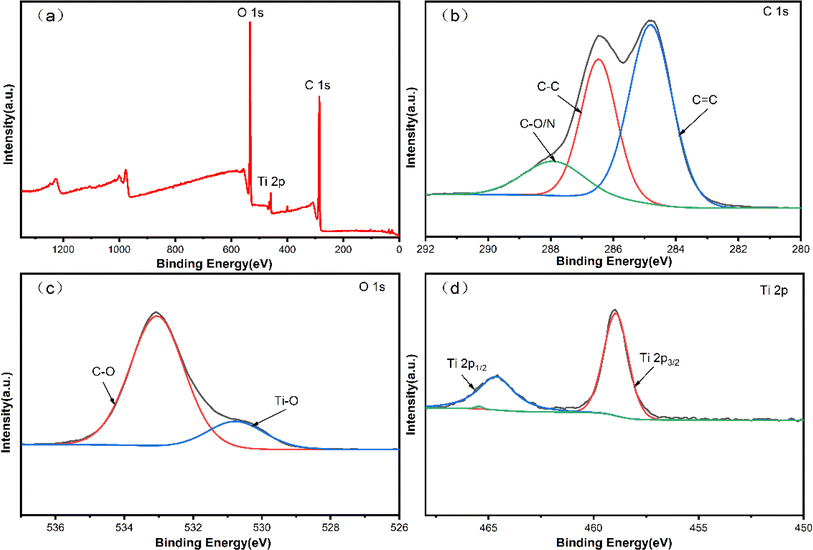 | ||
| Fig. 8 XPS pattern of 3Ti-160-7 carbon based photocatalytic material (a) 3Ti-160-7 total spectrum; (b) C 1s resolved spectrum; (c) O 1s resolved spectrum; (d) Ti 2p resolved spectrum. | ||
Further exploration of the fine spectrum of Ti 2p unveils two binding energies at 464.6 and 459.0 eV, corresponding to Ti 2p1/2 and Ti 2p3/2, respectively. This observation is indicative of the coexistence of Ti4+ and Ti3+ species within the TiO2 component of the 3Ti-160-7 composite. The identification of both oxidation states of titanium provides crucial information regarding the photocatalyst's electronic structure and the potential redox processes occurring during photocatalytic reactions. This detailed XPS analysis enhances our understanding of the surface composition and chemical states of the 3Ti-160-7 photocatalyst, laying the groundwork for optimizing its performance in various catalytic applications.
Photocatalytic test under different light source
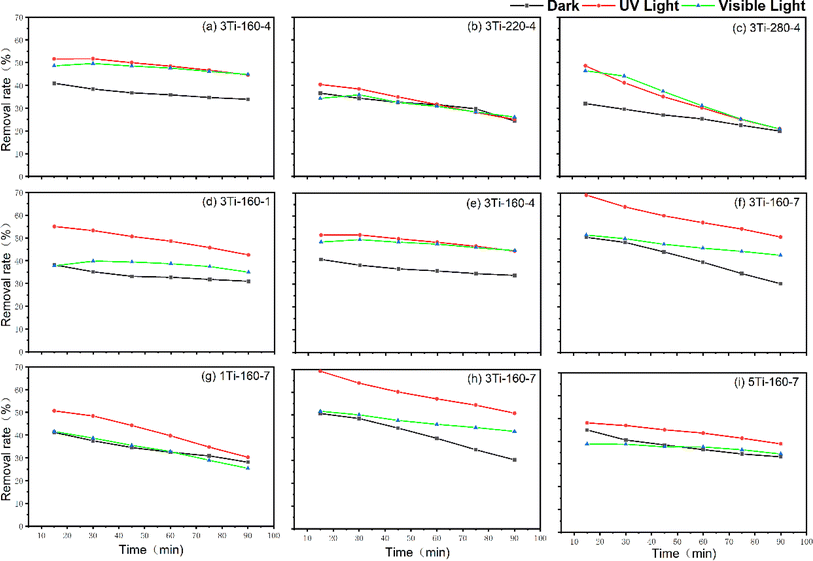
To explore the photocatalytic activation of hydrothermal carbon-based photocatalysts under varied preparation conditions, ammonia removal rates were assessed in the absence of light, under UV light, and visible light for a duration of 90 minutes, as depicted in Fig. 9. In the absence of light, the adsorption–degradation efficacy of 3Ti-220-4 and 3Ti-280-4 exhibited a slight decrease with increasing temperature. Conversely, under external light sources at both 160 °C and 280 °C, the removal rate of ammonia gas significantly improved compared to conditions without light. This enhancement is attributed to the active material having sufficient active sites to generate radicals, thereby improving the efficiency of ammonia gas removal during light irradiation.However, at a preparation temperature of 280 °C, the removal rate exhibited a continuous decline with increasing time. Towards the end of the test, the effect under the light source aligned with that observed in the absence of light. Conversely, the removal effect of ammonia prepared at 220 °C remained consistent under both light and dark conditions. Consequently, the TiO2/hydrochar matrix composite demonstrated superior ammonia removal efficiency at a preparation temperature of 160 °C. Subsequently, the impact of varying hydrothermal heating times on ammonia adsorption and degradation was investigated (Fig. 9(d)–(f)). With prolonged hydrothermal time, removal effects under both dark and UV light were enhanced, although the effects under sunlight showed only marginal improvement.
Fig. 9(g)–(i) illustrates the influence of different precursor concentrations on the ammonia removal rate of TiO2/hydrochar matrix composites. In dark, visible light, and UV light, the ammonia removal rate exhibited an increasing and then decreasing trend with rising solvent concentration during material preparation. Notably, materials prepared at solvent concentrations of 0.1 and 0.5 mol L−1 proved as effective in removing ammonia as in conditions without light and UV light. This comprehensive analysis provides valuable insights into the optimal conditions for maximizing the photocatalytic efficiency of TiO2/hydrochar matrix composites in ammonia removal applications.
Analysis of photocatalytic effect and products of hydrothermal carbon, P25 and 3Ti-160-7
Based on the photocatalytic tests conducted under different light sources, 3Ti-160-7 emerged as the most effective catalyst for ammonia removal. To further assess its potential, experiments were conducted to analyze changes in the content of ammonia and nitrogen-containing products over a 300 minute reaction period under UV light, comparing 3Ti-160-7 with CS-160-7 and TiO2 (P25). The results revealed that hydrochar exhibited poor adsorption effects on ammonia, reaching saturation after approximately 1 hour with only about a 20% removal ratio. However, the adsorption–degradation of ammonia was significantly enhanced after loading titanium elements into the material. Furthermore, the initial effect surpassed that of TiO2 (P25), although the duration of action was not as prolonged as that of TiO2 (P25). UV photocatalytic tests were conducted with a material quantity of 200 mg to investigate the effect of the amount on adsorption–degradation. The photocatalytic interaction of TiO2 (P25) with ammonia generated a substantial amount of NO, increasing with reaction time to about 500 ppb. In contrast, the NO produced by the photocatalytic reaction of 3Ti-160-7 was considerably lower than that of TiO2 (P25), consistently hovering around 6 ppb. Although direct measurement of nitrogen content was not undertaken in this study, TiO2 heterogeneous photocatalysis has been demonstrated as a technology capable of decomposing NH4+/NH3 into harmless gas (nitrogen). García-Prieto et al.48 investigated the mechanism of UV-C photolysis of NH4+/NH3, revealing that the photocatalytic reaction produced a significant amount of nitrogen and a minimal quantity of nitrogen oxides.Comparing the NO production and NO selectivity of P25 and 3Ti-160-7 in the photocatalytic oxidation of ammonia gas process (as shown in Fig. 10(b)), the carbon-based photocatalyst exhibited lower NO production and NO selectivity. This can be attributed to the cross-linking of titanium dioxide and hydrochar composites, facilitating better dispersion and a higher specific surface area. Consequently, ammonia, nitrogen oxides, and other pollutants are adsorbed onto the material's surface, generating more defects in titanium dioxide. Moreover, titanium dioxide can capture more charge carriers, inhibiting the recombination of electrons and holes, thereby enhancing the efficiency of photocatalysis and reducing the generation of nitrogen oxide intermediates. This comprehensive analysis highlights the promising potential of 3Ti-160-7 for effective and environmentally friendly ammonia removal applications.
 | ||
| Fig. 10 (a) Outlet NH3 concentration (b) outlet NO concentration (c) outlet NO2 concentration of different samples (3Ti-160-7 100 mg, 3Ti-160-7 200 mg, P25 and CS-160-7) under UV light. | ||
The photocatalytic mechanism of TiO2 relies on its absorption of high-energy photoelectrons and matching bands. The process involves lifting the electron (e−) in the VB to the CB, creating electron–hole pairs where a positive hole is missing an electron. This photoexcitation prevents recombination since electrons from the guide band are bound to the material's surface and cannot form complexes, as supported by previous studies.49–51 The attracted electrons and vacancies can either deactivate or activate substances adsorbed on the material itself.50 Moreover, positron holes may interact with aqueous or hydroxyl ions on their surfaces, forming highly oxidized hydroxyl radicals.51 Simultaneously, chemical reactions between the system's electrons and oxygen generate superoxide anions (˙O2−). These free radicals can absorb water or hydroxyl ions on the surface, producing more hydroxyl radicals.
Under ultraviolet irradiation, NH3 adsorbed by a carbon-based photocatalyst collides with the valence band holes on the surface of TiO2, leading to the production of active amine-based radicals, a crucial intermediate in past research on TiO2 oxidation by NH3.52,53 When exposed to light, ˙NH2 can combine with ˙O2 and ˙O2− formed on a carbon-based photocatalyst, resulting in the emission of NOx (NO and NO2) and subsequent oxidation to NO2− and NO3−. The NOx material formed can then combine with intermediate products or NH3 to produce N2 in the presence of light.54
Throughout the NH3 removal process, sample 3Ti-160-7 exhibited excellent photocatalytic activity, attributed to its remarkable morphological structure and physicochemical properties. The surface titanium dioxide, existing in the anatase phase with high catalytic activity, enhanced both the adsorption and removal of ammonia gas. In comparison to P25, 3Ti-160-7 demonstrated lower NO generation, indicating that the hydrothermal carbon carrier compounded with TiO2 effectively reduces NO production. These findings underscore the promising potential of 3Ti-160-7 as an efficient and environmentally friendly catalyst for NH3 removal applications.
Conclusion
In this study, TiO2/hydrochar matrix composites with uniformly distributed TiO2 nanoparticles on their surfaces were successfully synthesized, revealing a predominant anatase phase with the (101) crystalline surface structure. The introduction of hydrochar carriers into the composites resulted in non-metallic element doping in TiO2, narrowing the band gap and causing a redshift in the absorption spectrum. Notably, 3Ti-160-7 demonstrated superior ammonia removal, with lower concentrations at the outlet compared to P25 and hydrochar, along with significantly reduced NO and NO2 levels, enhancing environmental safety. The effective removal mechanism involves adsorption-enrichment of ammonia, synergistic effects suppressing TiO2 clustering, reducing particle size, and improving charge migration, as well as enhanced interfacial exposure interaction between hydrochar and TiO2. The one-step synthesis method holds scientific importance for advancing the use of hydrothermal carbon in environmentally friendly photocatalytic carrier materials.Consent for publication
All authors voluntarily participated in the writing of this article and all agreed to its publication.Ethical statement
Written informed consent was obtained from individual or guardian participants. All authors voluntarily participated in the writing of this article and all agreed to its publication.Data availability
The datasets used or analyzed during the current study are available from the corresponding author on reasonable request.Author contributions
Jiaxing Sun conducted the experiment; Ming Yang helped analyzed the data of FTIR and edited and reviewed the manuscript; Kuichuan Sheng reviewed the manuscript; Ximing Zhang provided funding and initialize the research idea and design the experiment, supervised the project, Ling Zhao and Kaiying Wang provided funding and reviewed the manuscript.Conflicts of interest
The authors declare no competing interests.Acknowledgements
This work was supported by the National Key R&D Program of China (No. 2021YFD2000801), the National Natural Science Foundation of China (No. 22208291) and the Scientific Research Project of Liaoning Province (LJKMZ20221001).References
- B. Brunekreef and S. T. Holgate, Lancet, 2002, 360, 1233–1242 CrossRef CAS PubMed.
- A. M. Fiore, V. Naik, D. V. Spracklen, A. Steiner, N. Unger, M. Prather, D. Bergmann, P. J. Cameron-Smith, I. Cionni, W. J. Collins, S. Dalsøren, V. Eyring, G. A. Folberth, P. Ginoux, L. W. Horowitz, B. Josse, J.-F. Lamarque, I. A. MacKenzie, T. Nagashima, F. M. O'Connor, M. Righi, S. T. Rumbold, D. T. Shindell, R. B. Skeie, K. Sudo, S. Szopa, T. Takemura and G. Zeng, Chem. Soc. Rev., 2012, 41, 6663 RSC.
- M. J. Katz, A. J. Howarth, P. Z. Moghadam, J. B. DeCoste, R. Q. Snurr, J. T. Hupp and O. K. Farha, Dalton Trans., 2016, 45, 4150–4153 RSC.
- K. Vikrant, V. Kumar, K.-H. Kim and D. Kukkar, J. Mater. Chem. A, 2017, 5, 22877–22896 RSC.
- W. Yi, J. Shen, G. Liu, J. Wang, L. Yu, Y. Li, S. Reis and J. Wu, Environ. Res. Lett., 2021, 16, 125007 CrossRef CAS.
- K.-L. Huang, C.-C. Liu, C.-W. Lee, C.-Y. Ma, T.-C. Lin, J.-H. Tsai and S.-J. Chen, Aerosol Air Qual. Res., 2019, 19, 2490–2501 CrossRef CAS.
- R. Chang, Y. Yao, W. Cao, J. Wang, X. Wang and Q. Chen, J. Environ. Manage., 2019, 233, 283–290 CrossRef CAS PubMed.
- M. Zhao, S. Wang, J. Tan, Y. Hua, D. Wu and J. Hao, Aerosol Air Qual. Res., 2016, 16, 1378–1389 CrossRef CAS.
- O. Brettschneider, R. Thiele, R. Faber, H. Thielert and G. Wozny, Sep. Purif. Technol., 2004, 39, 139–159 CrossRef CAS.
- B. Ren, Y. Zhao, N. Lyczko and A. Nzihou, Waste Biomass Valorization, 2019, 10, 1443–1458 CrossRef CAS.
- X. Wang, J. Song, J. Huang, J. Zhang, X. Wang, R. Ma, J. Wang and J. Zhao, Appl. Surf. Sci., 2016, 390, 190–201 CrossRef CAS.
- P. Duan, Y. Qi, S. Feng, X. Peng, W. Wang, Y. Yue, Y. Shang, Y. Li, B. Gao and X. Xu, Appl. Catal., B, 2020, 267, 118717 CrossRef CAS.
- J. Song, M. Huang, N. Jiang, S. Zheng, T. Mu, L. Meng, Y. Liu, J. Liu and G. Chen, J. Hazard. Mater., 2020, 391, 122024 CrossRef CAS PubMed.
- C. Sahoo and A. K. Gupta, J. Environ. Sci. Health, Part A: Toxic/Hazard. Subst. Environ. Eng., 2015, 50, 1333–1341 CrossRef CAS PubMed.
- S. Irfan, L. Li, A. S. Saleemi and C.-W. Nan, J. Mater. Chem. A, 2017, 5, 11143–11151 RSC.
- E. M. Bayan, T. G. Lupeiko, L. E. Pustovaya, M. G. Volkova, V. V. Butova and A. A. Guda, J. Alloys Compd., 2020, 822, 153662 CrossRef CAS.
- H. Wang, G.-M. Li, B. Li and J.-L. You, Nanomaterials, 2022, 12, 1390 CrossRef CAS PubMed.
- M. Ge, Q. Li, C. Cao, J. Huang, S. Li, S. Zhang, Z. Chen, K. Zhang, S. S. Al-Deyab and Y. Lai, Adv. Sci., 2017, 4, 1600152 CrossRef PubMed.
- M. R. D. Khaki, M. S. Shafeeyan, A. A. A. Raman and W. M. A. W. Daud, J. Environ. Manage., 2017, 198, 78–94 CrossRef CAS PubMed.
- R. L. Narayana, M. Matheswaran, A. A. Aziz and P. Saravanan, Desalination, 2011, 269, 249–253 CrossRef CAS.
- S. K. Parayil, A. Razzaq, S.-M. Park, H. R. Kim, C. A. Grimes and S.-I. In, Appl. Catal., A, 2015, 498, 205–213 CrossRef CAS.
- A. Razzaq, A. Sinhamahapatra, T.-H. Kang, C. A. Grimes, J.-S. Yu and S.-I. In, Appl. Catal., B, 2017, 215, 28–35 CrossRef CAS.
- M. Kim, A. Razzaq, Y. K. Kim, S. Kim and S.-I. In, RSC Adv., 2014, 4, 51286–51293 RSC.
- B. Chai, T. Peng, X. Zhang, J. Mao, K. Li and X. Zhang, Dalton Trans., 2013, 42, 3402–3409 RSC.
- Y. O. Donar, E. Çağlar and A. Sınağ, Fuel, 2016, 183, 366–372 CrossRef CAS.
- D. S. Su, S. Perathoner and G. Centi, Chem. Rev., 2013, 44, 5782–5816 CrossRef PubMed.
- R. Leary and A. Westwood, Carbon, 2011, 49, 741–772 CrossRef CAS.
- H. Luo, S. Yu, M. Zhong, Y. Han, B. Su and Z. Lei, J. Alloys Compd., 2022, 899, 163287 CrossRef CAS.
- S. Zhang and X. Lu, Chemosphere, 2018, 206, 777–783 CrossRef CAS PubMed.
- J. Liu, S. Zhang, C. Jin, S. E, K. Sheng and X. Zhang, ACS Sustainable Chem. Eng., 2019, 7, 10821–10829 CrossRef CAS.
- X. Peng, M. Wang, H. Dai, F. Qiu and F. Hu, Environ. Sci. Pollut. Res., 2020, 27, 39198–39210 CrossRef CAS PubMed.
- D.-H. Wang, L. Jia, X.-L. Wu, L.-Q. Lu and A.-W. Xu, Nanoscale, 2012, 4, 576–584 RSC.
- H. Zhang, Z. Wang, R. Li, J. Guo, Y. Li, J. Zhu and X. Xie, Chemosphere, 2017, 185, 351–360 CrossRef CAS PubMed.
- B. Wang, B. Liu, X.-X. Ji and M.-G. Ma, Materials, 2018, 11, 670 CrossRef PubMed.
- H. Chen, R. Li, J. Xie, X. Xu and S. Chen, Mater. Lett., 2019, 245, 18–21 CrossRef CAS.
- C.-M. Chen, Q. Zhang, M.-G. Yang, C.-H. Huang, Y.-G. Yang and M.-Z. Wang, Carbon, 2012, 50, 3572–3584 CrossRef CAS.
- T. Fazal, A. Razzaq, F. Javed, A. Hafeez, N. Rashid, U. S. Amjad, M. S. Ur Rehman, A. Faisal and F. Rehman, J. Hazard. Mater., 2020, 390, 121623 CrossRef CAS PubMed.
- P. Lisowski, J. C. Colmenares, O. Mašek, W. Lisowski, D. Lisovytskiy, A. Kamińska and D. Łomot, ACS Sustainable Chem. Eng., 2017, 5, 6274–6287 CrossRef CAS.
- F. Dong, H. Wang and Z. Wu, J. Phys. Chem. C, 2009, 113, 16717–16723 CrossRef CAS.
- H. Wang, S. Dong, Y. Chang and J. L. Faria, J. Hazard. Mater., 2012, 235–236, 230–236 CrossRef CAS PubMed.
- L. Pan, J.-J. Zou, X. Zhang and L. Wang, J. Am. Chem. Soc., 2011, 133, 10000–10002 CrossRef CAS PubMed.
- Y. Huang, W. Ho, S. Lee, L. Zhang, G. Li and J. C. Yu, Langmuir, 2008, 24, 3510–3516 CrossRef CAS PubMed.
- S. E, C. Jin, J. Liu, L. Yang, M. Yang, E. Xu, K. Wang, K. Sheng and X. Zhang, Energy, 2022, 249, 123668 CrossRef.
- D. Feng, Y. Zhang, Y. Zhao, S. Sun, J. Wu and H. Tan, Fuel, 2020, 279, 118450 CrossRef CAS.
- L. Guo, B. Zhao, Y. Jia, F. He and W. Chen, Atmosphere, 2022, 13, 452 CrossRef CAS.
- M. Maletić, M. Vukčević, A. Kalijadis, I. Janković-Častvan, A. Dapčević, Z. Laušević and M. Laušević, Arabian J. Chem., 2019, 12, 4388–4397 CrossRef.
- J. Sha, Y. Sun, H. Yu, Z. Yang, H. Chu, Y. Wang, Q. Yue, W. Yin and S. Xu, J. Environ. Chem. Eng., 2022, 10, 107544 CrossRef CAS.
- J. C. García-Prieto, L. A. González-Burciaga, J. B. Proal-Nájera and M. García-Roig, Catalysts, 2022, 12, 352 CrossRef.
- X. Chen and S. S. Mao, Chem. Rev., 2007, 107, 2891–2959 CrossRef CAS PubMed.
- F. Dong, S. Guo, H. Wang, X. Li and Z. Wu, J. Phys. Chem. C, 2011, 115, 13285–13292 CrossRef CAS.
- G. Tian, Y. Chen, K. Pan, D. Wang, W. Zhou, Z. Ren and H. Fu, Appl. Surf. Sci., 2010, 256, 3740–3745 CrossRef CAS.
- S. Yamazoe, K. Teramura, Y. Hitomi, T. Shishido and T. Tanaka, J. Phys. Chem. C, 2007, 111, 14189–14197 CrossRef CAS.
- S. Yamazoe, T. Okumura, Y. Hitomi, T. Shishido and T. Tanaka, J. Phys. Chem. C, 2007, 111, 11077–11085 CrossRef CAS.
- Y. Shu, J. Ji, M. Zhou, S. Liang, Q. Xie, S. Li, B. Liu, J. Deng, J. Cao, S. Liu and H. Huang, Appl. Catal., B, 2022, 300, 120688 CrossRef CAS.
| This journal is © The Royal Society of Chemistry 2024 |


