 Open Access Article
Role of iron oxide in retarding the graphitization of de-oiled asphaltenes for amorphous carbon
Zhiwei Liu ,
Ning Pu,
Yanxia Yuan,
Qinghe Yang,
Haiping Shen,
Hong Nie*,
Ranran Hou and
Chuangchuang Yang
Research Institute of Petroleum Processing, SINOPEC, Beijing, 100083, PR China. E-mail: niehong.ripp@sinopec.com
First published on 26th March 2024
Abstract
The solvent deasphalting (SDA) process is widely recognized as a significant technology in processing inferior oil. However, de-oiled asphaltene (DOA), which accounts for about 30% of feedstocks, is not well utilized in conventional processing methods to date. Considering its complicated structure and high heteroatom and metal contents, DOA is suitable for preparing amorphous carbon. Herein, we obtained amorphous carbon from inferior de-oiled asphaltene through direct carbonization of a mixture of DOA and Fe2O3 and revealed the mechanism of iron oxide in retarding graphitization to increase the disordered structure content. After the addition of Fe2O3, XRD results showed that the content of amorphous carbon increased from 25.57% to 59.48%, and a higher defect degree could also be observed in Raman spectra, thus resulting in better electrochemical performance in Na-ion half-cells. As a coke core, Fe2O3 could accelerate the polycondensation of asphaltene molecules; meanwhile, oxygen species derived from Fe2O3 could capture excess H free radicals in the initial pyrolysis stage, which inhibited the formation of planar polycyclic aromatic molecules and weakened π–π interactions. Moreover, O atoms could embed into the carbon skeleton by reacting with DOA at higher temperatures, which could further twist and break the intact carbon layer. Both of the factors enhanced the proportion of amorphous carbon. This work not only provides a new understanding of controlling the carbonization process, but it also promotes the development of the SDA process.
Introduction
During the last decades, there has been growing concern about environmental problems and the declining trend of heavy oil quality.1,2 Highly efficient utilization of heavy oil has become a serious challenge. Asphaltenes, the most complicated and polar fractions, bring about a series of problems in the processing of inferior heavy oil.3,4 Solvent deasphalting (SDA) is widely considered an economic and important method to decrease the asphaltene content in inferior oil.5 SDA technology separates inferior oils into deasphalted oil (DAO) and de-oiled asphaltene (DOA) using paraffinic solvents. DAO is a higher-quality feedstock for hydrotreating and fluid catalyst cracking; however, DOA, accounting for a considerable amount (about 30%) of feedstock, is difficult to be utilized by conventional processing methods.6As the heaviest fraction in the SDA process, DOA contains high heteroatom (S, N, O) and metal (Ni, V, etc.) contents, high polarity, high molecular weight, and the most complicated structure.7 Due to high reactivity, DOA tends to form coke in conventional decarbonization and hydrogenation.8 Carbon and metal deposition caused by DOA lead to the rapid deactivation of a catalyst and short run time in the refining process.9,10 Therefore, DOA can be only applied in road asphalt or mixed with fluid catalytic cracking (FCC) slurry oil to produce inferior coke. It severely restricts the efficient utilization of heavy oil and the development of solvent deasphalting processing.
Moreover, with the rapid development of renewable energy sources, electrochemical energy storage devices play a crucial role in the utilization of clean energy by providing storage support for various electronics.11,12 Benefiting from the abundant resources, lower cost, and wide distribution of Na, sodium ion batteries (SIBs) have recently attracted considerable attention as the next-generation storage technology.13–18 Although sodium possesses similar physicochemical properties as lithium,19 graphite cannot form a stable Na–C compound due to thermodynamic factors20 and shows poor Na storage capacity. Nowadays, the main challenge faced by SIBs is the development of anode materials.21 Undoubtedly, carbonaceous anodes are one of the most promising materials for SIBs from the aspect of practical application.22
Considering the high carbon content and low cost, DOA is a potential raw material for synthesizing carbon materials. Amorphous carbon holds lots of defects, has an inherent larger interlayer distance, and is considered a suitable material for SIBs anodes.23 However, due to the higher H content and stronger π–π interactions between planar aromatic molecules, the materials obtained by the pyrolysis of pitch exhibit a higher graphitization degree, which is detrimental to the storage of sodium ions.24,25 In order to solve this problem, there is a growing body of literature on modification strategies for pitch-based carbon materials.26,27 Wei et al. obtained N-doped porous carbon nanosheets (NPCS) using a NaCl/KCl mixture as a template after heat treatment under NH3/Ar mixed gas. NPCS could deliver a high reversible capacity of 313.6 mA h g−1 at 0.1 A g−1 for SIBs.28 Daher et al. prepared hard carbon through per-oxidation at 300 °C for 12 h followed by carbonization at 1400 °C for 2 h; such material could exhibit 312 mA h g−1 reversible capacity at C/20 and higher initial coulombic efficiency (ICE) of 90% for SIBs.29 Generally, the pitch used in most of the works was high-quality commercial asphalt. In fact, it is the use of inferior DOA that determines the economic benefit and the development of solvent deasphalting processing in the industry, but the corresponding reports are few because of the terrible quality of DOA, i.e. higher metal content and the complicated ingredient. Moreover, most studies in the field of SIBs have only focused on the relationship between electrochemical performance and carbon materials. Previous studies have not dealt with the regulatory mechanism for converting pitch to amorphous carbon.
Herein, we propose a simple strategy to retard the graphitization of DOA and prepare highly disordered amorphous carbon by mixing it with Fe2O3. Moreover, based on the results of TG-MS and XPS, this study elucidated the mechanism of iron oxide in retarding graphitization to increase disordered structures. It was found that Fe2O3 could take away excessive hydrogen in the initial stage of pyrolysis, which suppressed the melting and reordering of pitch. With the increase in temperature, C and S species of DOA could be oxidized by Fe2O3, which further twisted carbon layers and increased the amorphous degree. Finally, this highly disordered amorphous carbon exhibited a higher Na storage capacity than the sample without Fe2O3. This work will promote the development of solvent deasphalting processing and provide new insights into heavy oil processing.
Experimental
Synthesis of materials
The de-oiled asphaltene was supplied by the Sinopec Group and obtained from the industrial unit of Solvent Deasphalting Processing. The main properties of the DOA are listed in Table 1. The de-oiled asphaltene and other chemicals were used as received without further treatment. The preparation of the sample was performed with reference to the literature30 with some modifications. In order to evenly mix the DOA and iron, 2.0 g DOA was dissolved in 60 mL toluene under sonication dispersion for 20 min, and 8.0 g Fe2O3 with particle sizes of about 50 nm was added into the solution under stirring. Toluene was removed by distillation at 160 °C in an oil bath after stirring for 30 min. To ensure that DOA can be more evenly coated on the iron oxide, the prepared homogeneous mixture was firstly pre-oxidized at 300 °C for 3 h under air and then calcined at 800 °C for 2 h under the N2 atmosphere. The heating rate was 5 °C min−1. Fe2O3 was removed by using 3 M HCl at 80 °C under stirring. The sample (named DO) was collected by suction filtration for 30 min with deionized water, centrifuged 5 times, and dried at 80 °C for 3 h. The element analysis showed that the Fe content is about 0.01%. As a comparison, the DOA was calcined at 800 °C for 2 h under the N2 atmosphere to obtain material D.| Items | Value |
|---|---|
| Carbon residue (wt%) | 48.4 |
![[thin space (1/6-em)]](https://www.rsc.org/images/entities/char_2009.gif) |
|
| Elemental composition (wt%) | |
| C | 83.31 |
| H | 8.12 |
| S | 7.52 |
| N | 0.42 |
![[thin space (1/6-em)]](https://www.rsc.org/images/entities/char_2009.gif) |
|
| Group analysis (wt%) | |
| Saturates | 0 |
| Aromatics | 16.1 |
| Resins | 27.6 |
| Asphaltenes | 56.3 |
![[thin space (1/6-em)]](https://www.rsc.org/images/entities/char_2009.gif) |
|
| Metal content (μg g−1) | |
| Ni | 91.3 |
| V | 281 |
| Fe | 96.4 |
| Na | 32.9 |
| Ca | 7.8 |
Characterization of materials
The morphology was investigated using field emission scanning electron microscopy (SEM, Hitachi SU-8010) and high-resolution transmission electron microscopy (HRTEM, Philips Tecnai G2 F20). The content of elements was obtained by a Vario EL III elemental analyzer (Elementar, Germany). The crystalline structure was characterized by X-ray powder diffraction (XRD, Bruker D5005 X'Pert) with Cu Kα radiation, and XRD patterns were collected from 2θ = 5° to 2θ = 70° at a scan rate of 2° min−1. N2 adsorption–desorption was used to examine the specific surface area and pore structure using a Micromeritics ASAP 2002 analyzer. Raman experiment was carried out on a Raman spectrometer (LabRAM HR UV-NIR, Jobin Yvon) using a 532 nm line (Nd-YAG laser). X-ray photoelectron spectroscopy (XPS) was performed on a VG scientific ESCA Lab 250 spectrometer with AlKa radiation and the obtained data were fitted by Avantage. Infrared spectroscopy (IR) was performed on a Thermo Fisher Scientific spectrometer. Thermogravimetry mass spectrometry (TG-MS) was analysed on a NETZSCH STA409PC-QMS403 instrument from 50 to 800 °C at 5 °C min−1.Electrochemical measurements
The working electrode was prepared by mixing 90 wt% active materials, 5 wt% styrene butadiene rubber (SBR) and 5 wt% carboxymethyl cellulose (CMC) in deionized water to form a uniform slurry. The slurry was coated on a Cu foil and dried at 110 °C overnight under vacuum. Then, the coated copper foil was fabricated into CR2032 button cells using pure Na foil as the counter electrode. The assembly of the battery was performed in an argon-filled glove box (H2O < 0.01 ppm, O2 < 1 ppm). The electrolyte was 1 M NaPF6 dissolved in diethylene glycol dimethyl ether (diglyme), and the glass fiber was used as a separator. The galvanostatic charge/discharge tests were performed on a Land CT2001A battery test system (Wuhan, China) with a potential window of 0.005–3.0 V at room temperature.Results
Structural features of materials
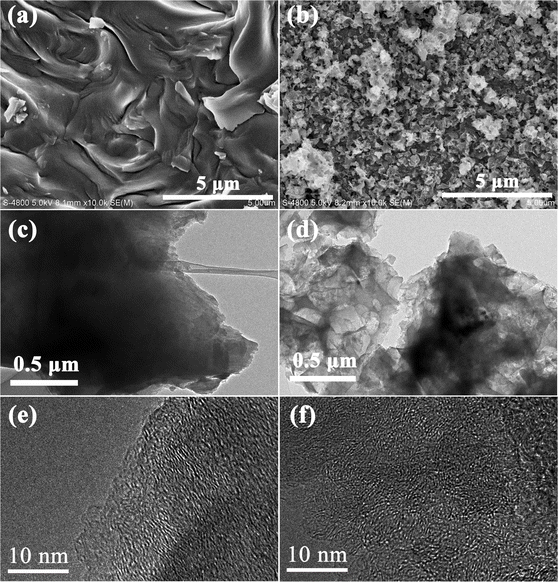
The effects of Fe2O3 on the morphology and the crosslinking mode have been investigated using the SEM and TEM images displayed in Fig. 1. The SEM image of D (Fig. 1a) shows a smooth surface, while DO exhibits a coarse and shaggy surface (Fig. 1b), indicating that Fe2O3 acted as a coke core and asphalt molecules condensed around Fe2O3. Moreover, it could be observed in the lower magnification TEM results that D shows a relatively compact structure (Fig. 1c), while DO displays a pore structure (Fig. 1d), which further confirms that Fe2O3 is the core in the condensation of DOA. For more details about the microstructure, HRTEM was used to investigate the structural features of the two samples, and the results are illustrated in Fig. 1e and f. As shown in Fig. 1e, sample D exhibits longer and orderly graphite crystallites; in contrast, DO possessed shorter and twisty stripe structures, indicating that DO contains more amorphous carbon. During the thermal treatment process, the planar polycyclic aromatic molecules (PPAM) were formed through the pyrolysis, aromatization and polycondensation of asphalt molecules. The PPAMs show stronger π–π interactions, which could promote the formation of an ordered graphite structure in sample D.24,31 After the addition of Fe2O3, asphalt molecules could react with Fe2O3, which hindered the formation of PPAMs and impeded the π–π interactions, and as a result, DO possessed a more disordered structure.XRD analysis and Raman spectroscopy were further applied to investigate the microstructure of the two samples. As illustrated in Fig. 2a, both samples exhibit two diffraction peaks at around 2θ = 24° and 43°, which could represent respectively the (002) and (100) crystallographic planes of low graphitized carbon,32,33 indicating the formation of an amorphous structure. Compared with D, the (002) diffraction peak of DO shifts to a lower angle, demonstrating that DO could exhibit a larger interlayer spacing. Meanwhile, it could also be seen that DO shows a wider and weaker (002) peak than D, indicating that the addition of Fe2O3 could decrease the crystallite size and/or increase the defect degree. In order to identify the effect of Fe2O3 on the microcrystalline structure, the (002) peaks were simulated by a profile-fitting process based on the literature34 and the results are displayed in Fig. 2b and c and Table 2. Generally, the peak located around 22° is assigned to highly disordered amorphous carbon, which has a d-spacing larger than 0.4 nm and this structure is beneficial for the Na+ transformation.27,35 The peaks located at around 25° are attributed to a well-organized graphite-like phase. According to Fig. 2b and c and Table 2, sample D possesses only 25.57% amorphous carbon, but the carbon material DO shows 59.84% after the addition of Fe2O3, which is consistent with the HRTEM result. The structural evolution caused by Fe2O3 could also be confirmed by the Raman spectra in Fig. 2d. It is widely considered that the D band at 1340 cm−1 is assigned to the disordered carbon structure caused by sp3-hybrid carbon, and the G band (the in-plane vibrational mode) located at 1590 cm−1 belongs to the regular graphitic structure caused by strong π–π interactions.36,37 After the addition of Fe2O3, the intensity ratio ID/IG of DO (0.98) is higher than D (0.94), indicating that Fe2O3 inhibits the formation of the graphitic structure and increases the disorder degree. The N2 adsorption–desorption was used to evaluate the texture difference between the two samples. As displayed in Fig. 2e, the sample DO shows a type IV isotherm with a hysteresis loop, suggesting a mesoporous structure.38 Fig. 2f displays that the pore size of DO focuses on 5 nm. At the same time, the BET surface area and pore volume of DO are larger than those of D (460 vs. 1.54 m2 g−1 and 0.38 vs. 0.0039 mL g−1, respectively). The results of N2 adsorption–desorption further proved that the asphalt molecules polycondensed with Fe2O3 as the core, which is also consistent with the HRTEM result.
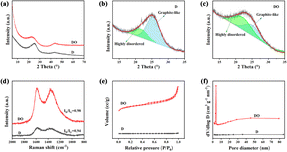 | ||
| Fig. 2 XRD patterns (a), peak fitting of the (002) peaks of D (b) and DO (c), Raman spectra (d), N2 physisorption isotherms (e) and pore size distributions (f) of the synthesized materials. | ||
| Sample | Element analysis (normalization) | XRD analysis | Texture properties | ||||
|---|---|---|---|---|---|---|---|
| C, % | O, % | S, % | Ada, % | Agb, % | Sgc, m2 g−1 | Vpd, mL g−1 | |
| a The area of high disordered carbon.b The area of graphite-like.c BET surface area.d Pore volume. | |||||||
| DOA | 91.76 | 0.64 | 7.60 | — | — | — | — |
| D | 89.69 | 1.03 | 9.28 | 25.57 | 74.43 | 1.54 | 0.0039 |
| DO | 91.23 | 6.03 | 2.74 | 59.48 | 40.52 | 460 | 0.38 |
In order to elucidate the role of Fe2O3 in the DOA high-temperature pyrolysis process, the TG-MS analysis of DOA and a mixture of DOA and Fe2O3 are performed and the corresponding results are illustrated in Fig. 3. It can be seen that the pyrolysis performance of D is different from DO in the TG curves, indicating that there exist some chemical reactions between DOA and Fe2O3 rather than just physical mixing. As shown in Fig. 3a, the TGA-curve of DOA exhibits a sharp weight loss between 400–500 °C, which could be attributed to the release of lots of volatile organic components caused by the pyrolysis, aromatization and polycondensation of asphalt molecules during the carbonization process.39 The MS results (Fig. 3c–f) also show that a large amount of H2O and CO2 could be detected at this stage, and some S atoms could be released as SO2 due to the cleavage of the branched chain. After 700 °C, signals of CO2 and SO2 still could be observed, which could be attributed to the continuous polymerization of the planar polycyclic aromatic molecules and the further removal of heteroatoms, finally leading to the carbon microcrystal becoming more ordered and regular. After the addition of Fe2O3, the weight loss of the mixture could be divided into three stages in Fig. 3b: (1) 50–400 °C, the weight loss could be ascribed to the physical and chemical adsorption of water and volatile organic compounds. It can be found that the OH and H2O peaks of the mixture of DOA and Fe2O3 are located at lower temperatures than DOA in Fig. 3c and d, indicating that Fe2O3 can promote the pyrolysis of asphalt molecules and the content of H could be reduced through reaction with Fe2O3. According to Qi,25 excessive hydrogen brings about the formation of a fusion state in the carbonization process; asphalt molecules have enough time to rearrange and generate PPAMs with strong π–π interactions, which is disadvantageous for obtaining an amorphous structure. Fe2O3 could help take away lots of hydrogen and generate cross-linkages with asphalt molecules, which not only converts the fusion-state to solid-state carbonization, but also disrupts the π–π interactions, resulting in higher disorder degree. (2) 400–700 °C, an obvious weight loss can be found in Fig. 3b, which is caused by the pyrolysis, aromatization and polycondensation of asphalt molecules. CO2-MS curves show that the peak intensity of the mixture is higher than DOA, suggesting that Fe2O3 acts as a coke core, accelerating the pyrolysis and polycondensation reactions. (3) 700–800 °C, it is worth noting that a sharp weight loss could be observed in a mixture of DOA and Fe2O3 but not in the DOA, and the corresponding MS result manifests the generation of lots of CO2. With the temperature increasing over 700 °C, the carbon microcrystalline took part in the redox reaction with Fe2O3, and O atoms could be embedded into the skeleton to warp and destroy the carbon microcrystalline structure, thus increasing the layer spacing and defects. In addition, SO2-MS curves (Fig. 3f) display that the SO2-signal of the mixture is lower than that of DOA, indicating that S atoms preferentially react with Fe2O3 to form SO42− (as confirmed by the next XPS results) rather than decomposing to form SO2. Moreover, combined with the results of the element analysis listed in Table 2, it could be reasonably inferred that Fe2O3 also increases the removal of S atoms, further resulting in the distortion and deformation of carbon layers.
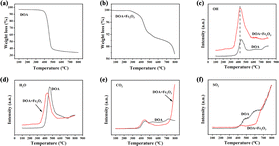 | ||
| Fig. 3 TGA curves of DOA (a); TGA curves of the mixture of DOA and Fe2O3 (b); the OH-MS (c), H2O-MS (d), CO2-MS (e) and SO2 -MS (f) curve of two samples. | ||
FT-IR was applied to analyse the change in functional groups on the surface after the addition of Fe2O3, and the results are illustrated in Fig. 4a. The broad bands around 2920 and 2850 cm−1 were attributed to the stretching vibration of C–H, which is contributed by –CH2–.40 The intensity of –CH2– becomes weaker after the introduction of iron oxide, indicating that Fe2O3 could assist in removing the excess H atoms and promoting the thermal polymerization of DOA. The peaks around 1260 and 1100 cm−1 were assigned to the C–O–C of aromatic ether groups (Ar–O–Ar) and aliphatic ether groups (R–O–C), respectively.41,42 It could clearly be seen that the peak around 1100–1300 cm−1 of DO is stronger than that of D, demonstrating that O atoms in Fe2O3 successfully entered into the carbon skeleton in the form of C–O–C through a redox reaction with asphalt molecules.
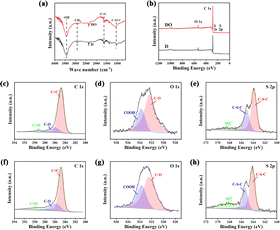 | ||
| Fig. 4 FTIR spectra (a); XPS surveys of two samples (b); high-resolution C 1s (c), O 1s (d), and S 2p (e) of sample D; high-resolution C 1s (f), O 1s (g), and S 2p (h) of sample DO. | ||
Consistent with the TG-MS and FTIR results mentioned above, the surface element statuses obtained by XPS also demonstrated a potential chemical interaction between DOA and Fe2O3. As shown in Fig. 4b, the C 1s, O 1s, S 2s and S 2p could detected in both samples, indicating that the O and S were the main heteroatoms after carbonization. Furthermore, in order to study the chemical bond configuration in detail, the high-resolution XPS spectra of C 1s, O 1s and S 2p are depicted in Fig. 4c–h, and the corresponding deconvolution results are listed in Table 3. Generally, the C 1s could be divided into three carbon environments, which are C–C (284.6 eV), C–O (285.8 eV) and C![[double bond, length as m-dash]](https://www.rsc.org/images/entities/char_e001.gif) O (289.3 eV),43,44 respectively. As for O 1s, the peak at 532.1 eV belonged to C–O and the band at 533.3 eV was associated with –COOH.31 The S elements in the materials possess two states; the peaks at S 2p3/2 (163.7 eV) and S 2p1/2 (165 eV) were associated with –C–S–C– in thiophene, thioether and/or disulfide,45 and the band located at 168.90 eV was attributed to 2−SO42−.46 It could be found in Table 3 that the amount of C–O and C
O (289.3 eV),43,44 respectively. As for O 1s, the peak at 532.1 eV belonged to C–O and the band at 533.3 eV was associated with –COOH.31 The S elements in the materials possess two states; the peaks at S 2p3/2 (163.7 eV) and S 2p1/2 (165 eV) were associated with –C–S–C– in thiophene, thioether and/or disulfide,45 and the band located at 168.90 eV was attributed to 2−SO42−.46 It could be found in Table 3 that the amount of C–O and C![[double bond, length as m-dash]](https://www.rsc.org/images/entities/char_e001.gif) O were higher than D after the addition of Fe2O3 and the sample DO also exhibited higher –COOH content, testifying that there was a redox reaction between Fe2O3 and DOA at high temperatures. In addition, based on the fitting result of S 2p, more SO42− could be detected in DO rather than D, indicating that the S atoms in DOA could be partially oxidized to form S-oxide, which is consistent with the results of TG-MS. The reaction between asphalt molecules and Fe2O3 could weaken the π–π interactions, and the exchange between C, S atoms in DOA and O atoms in Fe2O3 could further twist and break the intact carbon layer; both factors help increase the proportion of amorphous carbon.
O were higher than D after the addition of Fe2O3 and the sample DO also exhibited higher –COOH content, testifying that there was a redox reaction between Fe2O3 and DOA at high temperatures. In addition, based on the fitting result of S 2p, more SO42− could be detected in DO rather than D, indicating that the S atoms in DOA could be partially oxidized to form S-oxide, which is consistent with the results of TG-MS. The reaction between asphalt molecules and Fe2O3 could weaken the π–π interactions, and the exchange between C, S atoms in DOA and O atoms in Fe2O3 could further twist and break the intact carbon layer; both factors help increase the proportion of amorphous carbon.
| Sample | C 1s (%) | O 1s (%) | S 2p (%) | ||||
|---|---|---|---|---|---|---|---|
C![[double bond, length as m-dash]](https://www.rsc.org/images/entities/char_e001.gif) C C |
C–O | C![[double bond, length as m-dash]](https://www.rsc.org/images/entities/char_e001.gif) O O |
C–O | –COOH | C–S–C | SO42− | |
| D | 80.63 | 16.49 | 2.88 | 71.47 | 28.53 | 94.36 | 5.64 |
| DO | 66.90 | 22.99 | 10.11 | 64.20 | 35.80 | 81.84 | 18.16 |
Electrochemical performance of materials
The electrochemical performance of the obtained materials was evaluated in coin cells with Na-foil as a counter electrode, and the corresponding results are illustrated in Fig. 5. As depicted, the material DO exhibits higher initial discharge/charge capacities and lower initial coulombic efficiencies (ICE) compared with D (43.89% vs. 54.29%) at 0.1C, which is caused by higher BET surface area and more defects. After 3 cycles, sample D only retains 177.2 mA h g−1 discharge capacity, but DO still holds 246.6 mA h g−1. Due to the lack of stable Na–C intercalation compounds and the larger ionic radius, it is difficult for Na+ to enter into the turbostratic lattice of carbon materials. The addition of Fe2O3 increased the defect degree and the content of amorphous carbon with larger interlayer spacing, which enhanced the capacity of Na-ions. The rate and cyclic performance were measured to further test the sodium storage performance. As shown in Fig. 5c, it could be clearly seen that the sample DO delivers better rate capacity than D at different current densities. Moreover, the capacity of DO returns to 200.1 mA h g−1 with the current density shifted back to 0.1C, while for D, the value is 149.6 mA h g−1. After the rate capability test, DO also showed great cycling performance, as illustrated in Fig. 5d. During the thermal treatment process, the addition of Fe2O3 hindered the formation of PPAMs and weakened the π–π interactions between polycyclic aromatic hydrocarbons, resulting in the formation of shorter and disordered carbon nanocrystallites, which enhanced the electrochemical performance of the resulting material. Despite these promising results, the low initial coulombic efficiency caused by the high BET surface area limits the electrochemical applications of DO. In future investigations, it might be possible to decrease the BET surface area by adjusting the size and morphology of Fe2O3 and/or increasing the final calcination temperature.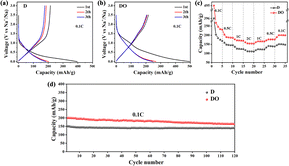 | ||
| Fig. 5 Charge and discharge profiles of D (a) and DO (b) at 0.1C; rate performance (c) and cycling performance (d) of two samples. | ||
The role of iron oxide in retarding graphitization
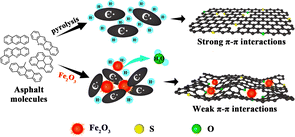
From the above discussion, it is evident that the linkage method between asphalt molecules is crucial for the final microstructure of the carbon material. Hence, based on these results, Fig. 6 illustrates the role of iron oxide in retarding the graphitization of de-oiled asphaltenes. The asphalt pyrolysis mainly follows the free radical mechanism. Lots of free radicals (C˙ and H˙) were formed in the initial stage of the high-temperature treatment. Asphalt derived from the solvent deasphalting process holds a high H content due to many long alkyl side chains. Excessive hydrogen free radicals could weaken the reactivity of carbon-free radicals, which is favorable for asphalt molecules to generate the PPAM via slow aromatization and polycondensation. With the increasing size, the π–π interactions between PPAMs become so strong that the lamellar molecules could orderly stack to form a graphite-like structure. After the addition of Fe2O3, the hydrogen-free radicals were partially consumed by the oxygen species; meanwhile, the C˙ could polycondense with the Fe2O3 as cores. Both factors could hinder the formation of PPAMs and impede the π–π interactions, resulting in the formation of a disordered structure. In the carbonization process, with the temperature increasing over 700 °C, the carbon microcrystalline and the S species could react with Fe2O3, and O atoms could be embedded into the skeleton to tailor the micro-structure, thus further increasing the content of amorphous carbon. Meanwhile, Fe2O3 could change the morphology of the obtained materials and increase the BET surface area and defects, which enhanced the Na+ storage sites. Finally, the sample showed better electrochemical performance.Conclusions
In summary, this work obtained amorphous carbon from inferior de-oiled asphaltene through direct carbonization of a mixture of DOA and Fe2O3, and the role of iron oxide in retarding graphitization was studied via different characterizations. It was demonstrated that asphalt molecules could poly-condense with Fe2O3 as core, and the O species derived from Fe2O3 also could take away the excess H in the initial stage, which inhibited the formation of the planar polycyclic aromatic molecules and weakened the π–π interactions, thus increasing the content of the disordered structure. After higher temperature carbonization, the results of TG, FTIR and XPS showed O atoms derived from Fe2O3 could also embed into the carbon skeleton through reaction with DOA, which further twists and breaks the intact carbon layer, thus increasing the proportion of amorphous carbon. Finally, compared with D, the material DO exhibited a higher capability (246.6 vs. 177.2 mA h g−1 after the third cycle at 0.1C), better rate performance (154.4 vs. 110.9 mA h g−1 at 2C) and good stability, which could be attributed to higher disorder degree and more defects. Meanwhile, this study provides some important insights into the efficient utilization of residual oil and will promote the development of the solvent deasphalting process.Conflicts of interest
There are no conflicts to declare.Acknowledgements
The authors gratefully acknowledge financial support by the National Key R&D program of China (No. 2021YFA1501204).Notes and references
- W. Han, H. Nie, X. Long and D. Li, Appl. Catal., A, 2020, 593, 117458 CrossRef CAS.
- Y. Gao, W. Han, X. Long, H. Nie and D. Li, Appl. Catal., B, 2018, 224, 330–340 CrossRef CAS.
- Q. Sheng, G. Wang, N. Jin, M. M. Husein and J. Gao, Fuel, 2019, 255, 115736 CrossRef CAS.
- D. Fang, G. Wang, Q. Sheng, S. Ge, C. Gao and J. Gao, Fuel, 2019, 257, 115886 CrossRef CAS.
- J. M. Lee, S. Shin, S. Ahn, J. H. Chun, K. B. Lee, S. Mun, S. G. Jeon, J. G. Na and N. S. Nho, Fuel Process. Technol., 2014, 119, 204–210 CrossRef CAS.
- N. Jin, G. Wang, S. Han, Y. Meng, C. Xu and J. Gao, Energy Fuels, 2016, 30, 2594–2603 CrossRef CAS.
- L. Zhang, Z. Xu, Q. Shi, X. Sun, N. Zhang, Y. Zhang, K. H. Chung, C. Xu and S. Zhao, Energy Fuels, 2012, 26, 5795–5803 CrossRef CAS.
- Q. Sheng, G. Wang, Q. Zhang, C. Gao, A. Ren, M. Duan and J. Gao, Energy Fuels, 2017, 31, 5037–5045 CrossRef CAS.
- H. Nie, H. Li, Q. Yang and D. Li, Catal. Today, 2018, 316, 13–20 CrossRef CAS.
- N. Li, B. Yan and X.-M. Xiao, Chem. Eng. Sci., 2015, 134, 230–237 CrossRef CAS.
- T. Zhang, Z. Mao, X. Shi, J. Jin, B. He, R. Wang, Y. Gong and H. Wang, Energy Environ. Sci., 2022, 15, 158–168 RSC.
- H. Liu, Z. Zhu, Q. Yan, S. Yu, X. He, Y. Chen, R. Zhang, L. Ma, T. Liu, M. Li, R. Lin, Y. Chen, Y. Li, X. Xing, Y. Choi, L. Gao, H. S.-y. Cho, K. An, J. Feng, R. Kostecki, K. Amine, T. Wu, J. Lu, H. L. Xin, S. P. Ong and P. Liu, Nature, 2020, 585, 63–67 CrossRef CAS PubMed.
- Y. Sun, P. Lu, X. Liang, C. Chen and H. Xiang, J. Alloys Compd., 2019, 786, 468–474 CrossRef CAS.
- R. Xu, Z. Yi, M. Song, J. Chen, X. Wei, F. Su, L. Dai, G. Sun, F. Yang, L. Xie and C. M. Chen, Carbon, 2023, 206, 94–104 CrossRef CAS.
- N. Yabuuchi, K. Kubota, M. Dahbi and S. Komaba, Chem. Rev., 2014, 114, 11636–11682 CrossRef CAS PubMed.
- C. Huang, J. Yin, W. Shi, Y. Cheng and X. Xu, Mater. Today Energy, 2024, 40, 101501 CrossRef CAS.
- M. Jiang, N. Sun, R. Ali Soomro and B. Xu, J. Energy Chem., 2021, 55, 34–47 CrossRef CAS.
- Y. Zhao, Y. Cong, H. Ning, X. Fei, C. Wu, H. Wang, Z. He, Y. Wang, Q. Zhao and M. Wu, J. Alloys Compd., 2022, 918, 165691 CrossRef CAS.
- Y.-E. Zhu, H. Gu, Y.-N. Chen, D. Yang, J. Wei and Z. Zhou, Ionics, 2018, 24, 1075–1081 CrossRef CAS.
- Y. Liu, B. V. Merinov and W. A. Goddard, Proc. Natl. Acad. Sci. U. S. A., 2016, 113, 3735–3739 CrossRef CAS PubMed.
- X. Hu, X. Sun, S. J. Yoo, B. Evanko, F. Fan, S. Cai, C. Zheng, W. Hu and G. D. Stucky, Nano Energy, 2019, 56, 828–839 CrossRef CAS.
- S. Ghosh, V. K. Kumar, S. K. Kumar, U. Sunkari, S. Biswas and S. K. Martha, Electrochim. Acta, 2020, 353, 136566 CrossRef CAS.
- C. Bommier, T. W. Surta, M. Dolgos and X. Ji, Nano Lett., 2015, 15, 5888–5892 CrossRef CAS PubMed.
- Y. Wang, N. Xiao, Z. Wang, H. Li, M. Yu, Y. Tang, M. Hao, C. Liu, Y. Zhou and J. Qiu, Chem. Eng. J., 2018, 342, 52–60 CrossRef CAS.
- Y. Qi, Y. Lu, L. Liu, X. Qi, F. Ding, H. Li, X. Huang, L. Chen and Y.-S. Hu, Energy Storage Mater., 2020, 26, 577–584 CrossRef.
- Y. Jiang, J. Jiang, P. Nie, W. Guo, C. Geng, Z. Sun, Y. Fei, Y. Chen, Q. Zhuang, Z. Xing, Z. Ju and H. Shao, J. Energy Storage, 2023, 72, 108484 CrossRef.
- W. S. Du, C. Sun and Q. Sun, Materials, 2023, 16, 4871 CrossRef CAS PubMed.
- S. Wei, X. Deng, W. Li, K. Liu, J. Wang, H. Zhao and X. Wang, Chem. Eng. J., 2023, 455, 140540 CrossRef CAS.
- N. Daher, D. Huo, C. Davoisne, P. Meunier and R. Janot, ACS Appl. Energy Mater., 2020, 3, 6501–6510 CrossRef CAS.
- M. Xie, X. Zhu, D. Li, Z. Xu, Y. Huang, H. Zha, M. Ding and C. Jia, J. Power Sources, 2021, 514, 230593 CrossRef CAS.
- Q. Sun, D. Li, J. Cheng, L. Dai, J. Guo, Z. Liang and L. Ci, Carbon, 2019, 155, 601–610 CrossRef CAS.
- A. Beda, P.-L. Taberna, P. Simon and C. Matei Ghimbeu, Carbon, 2018, 139, 248–257 CrossRef CAS.
- D. Yu, L. Zhou, J. Tang, J. Li, J. Hu, C. Peng and H. Liu, Ind. Eng. Chem. Res., 2017, 56, 8880–8887 CrossRef CAS.
- N. Sun, Z. Guan, Y. Liu, Y. Cao, Q. Zhu, H. Liu, Z. Wang, P. Zhang and B. Xu, Adv. Energy Mater., 2019, 9, 1901351 CrossRef.
- Y. Cao, L. Xiao, M. L. Sushko, W. Wang, B. Schwenzer, J. Xiao, Z. Nie, L. V. Saraf, Z. Yang and J. Liu, Nano Lett., 2012, 12, 3783–3787 CrossRef CAS PubMed.
- J. Niu, R. Shao, J. Liang, M. Dou, Z. Li, Y. Huang and F. Wang, Nano Energy, 2017, 36, 322–330 CrossRef CAS.
- Y. Wang, Z. Wang, Y. Chen, H. Zhang, M. Yousaf, H. Wu, M. Zou, A. Cao and R. P. S. Han, Adv. Mater., 2018, 30, 1802074 CrossRef PubMed.
- B. Xing, C. Zhang, Q. Liu, C. Zhang, G. Huang, H. Guo, J. Cao, Y. Cao, J. Yu and Z. Chen, J. Alloys Compd., 2019, 795, 91–102 CrossRef CAS.
- S. Huang, H. Guo, X. Li, Z. Wang, L. Gan, J. Wang and W. Xiao, J. Solid State Electrochem., 2013, 17, 1401–1408 CrossRef CAS.
- P.-Y. Zhao, J.-J. Tang and C.-Y. Wang, J. Solid State Electrochem., 2017, 21, 555–562 CrossRef CAS.
- M. Yuan, B. Cao, C. Meng, H. Zuo, A. Li, Z. Ma, X. Chen and H. Song, Chem. Eng. J., 2020, 400, 125948 CrossRef CAS.
- G. Yuan, X. Li, X. Xiong, Z. Dong, A. Westwood, B. Li, C. Ye, G. Ma, Z. Cui, Y. Cong, J. Zhang and Y. Li, Carbon, 2017, 115, 59–76 CrossRef CAS.
- W. Si, J. Zhou, S. Zhang, S. Li, W. Xing and S. Zhuo, Electrochim. Acta, 2013, 107, 397–405 CrossRef CAS.
- J.-Y. Cheng, Z.-L. Yi, Z.-B. Wang, F. Li, N.-N. Gong, A. Ahmad, X.-Q. Guo, G. Song, S.-T. Yuan and C.-M. Chen, Electrochim. Acta, 2020, 337, 135736 CrossRef CAS.
- L. He, Y.-r. Sun, C.-l. Wang, H.-y. Guo, Y.-q. Guo, C. Li and Y. Zhou, New Carbon Mater., 2020, 35, 420–427 CrossRef CAS.
- Z. Liu, W. Han, D. Hu, H. Nie, Z. Wang, S. Sun, Z. Deng and Q. Yang, Catal. Sci. Technol., 2020, 10, 5218–5230 RSC.
| This journal is © The Royal Society of Chemistry 2024 |

