 Open Access Article
Light-driven methane conversion: unveiling methanol using a TiO2/TiOF2 photocatalyst†
Wibawa Hendra Saputera *abc,
Gita Yuniara and
Dwiwahju Sasongkoac
aDepartment of Chemical Engineering, Research Group on Sustainable Energy and Technology, Faculty of Industrial Technology, Institut Teknologi Bandung, Jl. Ganesha no. 10, Bandung 40132, Indonesia. E-mail: whsaputera@itb.ac.id
bCenter for Catalysis and Reaction Engineering, Institut Teknologi Bandung, Jl. Ganesha no. 10, Bandung 40132, Indonesia
cResearch Center for New and Renewable Energy, Institut Teknologi Bandung, Jl. Ganesha no. 10, Bandung 40132, Indonesia
First published on 14th March 2024
Abstract
A TiO2/TiOF2 composite has been synthesized through a hydrothermal method and characterized using X-ray diffraction, Raman spectroscopy, UV-vis diffuse reflectance, SEM-EDX, TEM, and N2 adsorption–desorption isotherms. The percentage of exposed facet [001] and the composition of TiO2/TiOF2 in the composite were controlled by adjusting the amount of HF and hydrothermal temperature synthesis. Three crucial factors in the photocatalytic conversion of methane to methanol, including the photocatalyst, electron scavenger (FeCl2), and H2O2 were evaluated using a statistical approach. All factors were found to have a significant impact on the photocatalytic reaction and exhibited a synergistic effect that enhanced methanol production. The highest methanol yield achieved was 0.7257 μmole h−1 gcat−1. The presence of exposed [001] and fluorine (F) in the catalyst is believed to enhance the adsorption of reactant molecules and provide a more oxidative site. The Fenton cycle reaction between FeCl2 and H2O2 was attributed to reducing recombination and extending the charge carrier lifetime. Incorporating Ag into the TiO2/TiOF2 catalyst results in a significant 2.2-fold enhancement in methanol yield. Additionally, the crucial involvement of hydroxyl radicals in the comprehensive reaction mechanism highlights their importance in influencing the process of photocatalytic methane-to-methanol conversion.
Introduction
Methane (CH4), the simplest hydrocarbon, has garnered growing interest as a potential alternative energy source. It is widely recognized as a greenhouse gas with a greater global warming potential than carbon dioxide (CO2). However, it possesses the highest hydrogen-to-carbon (H/C) ratio among all hydrocarbons and boasts a substantial calorific value, making it a promising energy resource. Methane has a symmetric tetrahedral structure and exhibits low polarizability, as well as low electron and proton affinity.1 The conversion of methane is a challenging process from a kinetic standpoint due to its stability and non-reactive nature. To initiate the reaction, substantial energy supply in the form of high pressure and temperature is required.Utilizing methane gas directly as an energy source presents challenges in terms of handling, storage, and transportation. Therefore, it is more advantageous to obtain a liquid product from methane conversion. Methanol has emerged as the favored product of methane conversion because it retains the high calorific value of methane and can be directly employed as a fuel source.
The most commonly used method for converting methane into methanol at present is steam reforming, but this approach is associated with significant energy consumption and expense. Recent technological efforts have concentrated on devising a method to convert methane into methanol under ambient conditions. Photocatalytic technology has garnered considerable interest in the realm of renewable energy because it provides an efficient means to produce methanol using solar energy, which is a renewable resource, without the need for extreme operating conditions.
Until now, numerous research studies have been conducted to identify the optimal photocatalyst for facilitating the photocatalytic conversion of methane into methanol. Researchers have explored various semiconductors for this purpose, including TiO2, WO3, ZnO, NiO, and Fe2O3. A modification also applied to semiconductors, such as the incorporation of RuOx onto ZnO/CeO2, enhances the photocatalytic efficiency in producing methanol from methane and water. This enhancement results from an improved separation of interfacial charge and an elevation of free hydroxyl radical species.2
The ideal semiconductor photocatalyst should possess specific characteristics: it must be chemically and biologically inert, maintain photocatalytic stability, be easy to produce and utilize, be activatable with low-energy light such as sunlight, be cost-effective, and be environmentally friendly.3 Titanium dioxide (TiO2) stands out as the most widely utilized semiconductor for photocatalysis due to its wide bandgap, affordability, high photocatalytic activity, robust photostability, non-toxic nature, abundant availability, insolubility in aqueous solutions, and chemical and biological inertness.4
Pure titanium dioxide possesses a wide bandgap that obstructs its ability to harness direct sunlight effectively.5 Various modifications have been implemented on the semiconductor to overcome this limitation, including the creation of heterojunctions,6 doping,7 rearranging crystal facets,8 altering its structure and electronic properties.9
Recent advancements and strategies in photocatalytic of methane to methanol conversion have been comprehensively reported covering aspects such as materials design comprises heterojunction, cocatalyst decoration, and assistance with oxidants, along with engineering prospects.10,11 Doping is a commonly employed modification strategy to optimize the properties of photocatalysts. In elemental doping, impurities, whether metals or non-metals doping, are intentionally introduced into an intrinsic semiconductor. Exploration of doping have been reported with metals such as Au,12 metal-doped,13 and self-doping.14 Additionally, chemical agents are introduced into the system to enhance the overall process through the generation of OH˙ from H2O2 and serve as electron scavengers to capture electrons, thereby preventing the recombination of charge carriers (electrons and holes) and simultaneously improving methanol yield.15
Currently, there is a growing interest in modifying TiO2-based catalysts by incorporating TiOF2. This composite material has found widespread application in photocatalytic reactions, including the degradation of ammonia,8 hydrogen evolution,16 degradation of pollutant.17 The TiO2/TiOF2 composite can be easily synthesized through a one-step hydrothermal process, utilizing titanium butoxide and hydrogen fluoride as precursors.18,19 This modification encourages crystal growth in the desired [001] facet direction. Moreover, additional substances such as H2O2 and electron scavengers are introduced into the system to prevent electron–hole recombination and thus improve the yield and selectivity towards the desired products. However, it's worth noting that some research papers have reported varying findings on this matter.
To date, there has been no documentation of the utilization of the TiO2/TiOF2 composite in the photocatalytic conversion of methane to methanol. This study aims to explore the impact of supplementary substances like H2O2 and electron scavengers using a statistical approach. The research will delve into the photocatalytic conversion process of methane to methanol, taking into account three critical factors: the photocatalyst, H2O2, and an electron scavenger.
Experimental section
Materials
Titanium butoxide (Ti(OBu)4), hydrogen fluoride (HF), hydrogen peroxide (H2O2), and iron(II) chloride (FeCl2) were procured from Sigma Aldrich. Additionally, commercial titanium dioxide P25, which served as a reference photocatalyst, was also obtained from Sigma Aldrich. Methane and argon gases were sourced from CV Sangkuriang in Indonesia.Sample preparation
The TiO2 photocatalysts were prepared using a method outlined in the existing literature, with certain adjustments incorporated for modification.20 Variations in the photocatalysts were achieved by altering the quantities of HF and the reaction temperature, and the specific conditions are elaborated upon in Table 1.| Reagent | Hydrothermal reaction condition | Catalyst code |
|---|---|---|
| 5 mL Ti(Obu)4 + 0.4 mL HF | 180 °C, 24 hours | Ti-A |
| 5 mL Ti(Obu)4 + 0.8 mL HF | 200 °C, 24 hours | Ti-B |
Briefly, Ti(OBu)4 reagent was introduced into a Teflon autoclave with a capacity of 20 mL. Subsequently, a gradual addition of HF solution into the autoclave took place, followed by thorough mixing through vortexing. The resulting mixture underwent a hydrothermal reaction under specified conditions. Afterward, the system was allowed to naturally cool down to room temperature, and the precipitate was separated from the liquid via centrifugation, followed by a thorough wash with ethanol. The sample was then subjected to drying in an oven at 60 °C for a duration of 3 hours and subsequently placed in a desiccator to eliminate any remaining moisture. Finally, the dried solid was ground to obtain the white catalyst powder.
The Ag-loaded TiO2/TiOF2 catalyst was prepared by in situ photodeposited reactions of AgNO3 with TiO2/TiOF2 sample. Briefly, 0.1 g of the prepared TiO2/TiOF2 was suspended in an anaerobic aqueous solution containing 20 mL of deionized water, 5 mL of CH3OH, and 1 wt% of AgNO3. After 30 min irradiation under 300 W Xe lamp, the products were collected via centrifugation, washed with water and dried at 60 °C.
Characterizations
The catalysts crystal structures were analyzed under ambient conditions using X-ray diffraction (XRD, Bruker D8 Advance, Billerica, Massachusetts, USA). Cu-Kα radiation with a wavelength (λ) of 0.15406 nm was employed for this purpose. To estimate the crystallite size, the Scherrer equation was applied, utilizing the full width at half the maximum height of the peak observed at 2θ = 28.9°. Diffuse reflectance spectra were obtained via a UV-Vis spectrophotometer (Thermo Scientific Evolution 200, Waltham, Massachusetts, USA) and converted into absorbance values using the Kubelka–Munk method, with BaSO4 serving as the reference material. To examine the morphology of the catalyst, a scanning electron microscope (SEM, SU3500, Hitachi High-Technologies Corporation, Tokyo, Japan) and transmission electron microscopy (TEM, H9500, Hitachi High-Technologies Corporation, Tokyo, Japan) were used. Nitrogen physisorption measurements were conducted at a temperature of 77 K using a specific surface area analyzer (Quantachrome Nova 4200e Instruments, USA). Before the adsorption measurements, the samples underwent degassing at 150 °C for 3 hours. Specific surface areas were calculated using the Brunauer–Emmett–Teller (BET) method, and porosity parameters were determined using the Barrett–Joyner–Halenda (BJH) method. Raman spectra were recorded with a Raman spectrometer (Bruker-Senterra, Billerica, Massachusetts, USA) equipped with a 514 nm argon-ion laser. The production of hydroxyl radical (˙OH) by the UV-illuminated TiO2/TiOF2 catalysts was assessed using a photoluminescence (PL) method with coumarin as the probe molecule. Coumarin readily reacts with ˙OH to produce a highly fluorescent product, 7-hydroxycoumarin (7HC). The experimental procedure was similar to the photocatalytic activity measurements, except that water was replaced by a coumarin aqueous solution (5 × 10⁻⁴ M). Samples were collected at 30 minute intervals and filtered through a membrane filter. The PL spectra of the generated 7HC were monitored at λmax = 454 nm when excited at λexc = 332 nm. Fluorescence spectra were measured using a spectrofluorometer (Hitachi F-2700).Photocatalytic tests
The evaluation of the photocatalytic performance of the synthesized TiO2/TiOF2 catalyst for methane-to-methanol conversion was conducted within a specially configured batch photoreactor. This reactor is equipped with a 300 W xenon lamp emitting UV-visible light and a cooling system to maintain the ambient temperature. The photocatalyst was dissolved in distilled water to achieve a concentration of 1 g L−1. This mixture was then introduced into the reactor, with a magnetic stirrer facilitating mass transfer between the photocatalyst and the reactants. Before initiating the reaction, the reactor was purged with argon gas, followed by the introduction of methane gas into the mixture, which continued for 15 minutes. The reaction was initiated by turning on the light source. Samples were extracted from both the liquid and gas phases at 30 minute intervals for analysis using Gas Chromatography (Shimadzu 14B, Japan). The gas phase was analyzed to determine methane conversion, while the liquid phase was analyzed to calculate methanol yield.Statistical analysis
The experiment was devised using a statistical approach, employing a two-level full factorial design of experiment. The factors and their respective levels utilized in this two-level full-factorial experimental design are detailed in Table 2.| Factors | −1 (low level) | +1 (high level) |
|---|---|---|
| Photocatalyst | Ti-A | Ti-B |
| Electron scavenger (FeCl2) | 0 | 15 mL |
| H2O2 | 0 | 1 mL |
The experimental design layout was generated by Minitab software program. For this experiment, a single replicate was conducted with eight experimental runs (23 run order) and two additional centre points were included. Consequently, the experimental design layout comprised a total of 10 runs as outlined in Table 3.
| Std order | Run order | Center Pt | Blocks | Catalyst | FeCl2 | H2O2 |
|---|---|---|---|---|---|---|
| 5 | R1 | 1 | 1 | Ti-A | 0.0 | 1.0 |
| 1 | R2 | 1 | 1 | Ti-A | 0.0 | 0.0 |
| 6 | R3 | 1 | 1 | Ti-B | 0.0 | 1.0 |
| 10 | R4 | 0 | 1 | Ti-B | 7.5 | 0.5 |
| 7 | R5 | 1 | 1 | Ti-A | 15.0 | 1.0 |
| 4 | R6 | 1 | 1 | Ti-B | 15.0 | 0.0 |
| 3 | R7 | 1 | 1 | Ti-A | 15.0 | 0.0 |
| 2 | R8 | 1 | 1 | Ti-B | 0.0 | 0.0 |
| 8 | R9 | 1 | 1 | Ti-B | 15.0 | 1.0 |
| 9 | R10 | 0 | 1 | Ti-A | 7.5 | 0.5 |
ANOVA (Analysis of Variance) was employed to identify the influential factors, including the specific levels that yield the most pronounced signals arising from both the primary factors and their interactions. In this experiment, a 95% confidence interval was utilized. Consequently, parameters with p-values below 0.05 were deemed to exert a statistically significant influence on the experimental response. To assess the suitability of the model, a residual analysis was conducted. This examination of residuals allows for the detection of various types of model inadequacies and violations of the underlying assumptions.
Result and discussion
Analysis of characterization results
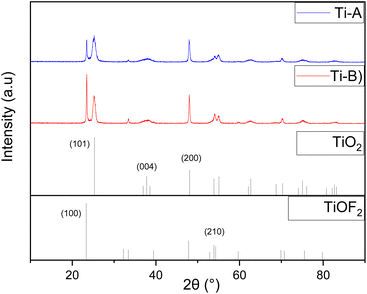
Ti-B showed exhibited a notably stronger peak in the (100) crystal plane of TiOF2 suggesting a higher content TiOF2 within the composite. The composition of each element, TiO2 and TiOF2, was further confirmed through the reference intensity ratio, resulting in a TiO2![[thin space (1/6-em)]](https://www.rsc.org/images/entities/char_2009.gif) :
:![[thin space (1/6-em)]](https://www.rsc.org/images/entities/char_2009.gif) TiOF2 ratio of 88
TiOF2 ratio of 88![[thin space (1/6-em)]](https://www.rsc.org/images/entities/char_2009.gif) :
:![[thin space (1/6-em)]](https://www.rsc.org/images/entities/char_2009.gif) 12 for Ti-A and 45
12 for Ti-A and 45![[thin space (1/6-em)]](https://www.rsc.org/images/entities/char_2009.gif) :
:![[thin space (1/6-em)]](https://www.rsc.org/images/entities/char_2009.gif) 55 for Ti-B.
55 for Ti-B.
The presence of Ti4+ from TiOBu4 and F− from HF plays an pivotal role in the synthesis of TiO2/TiOF2 composites, as highlighted in a study by Li et al.17 Notably, the characteristics of the TiOF2 peaks became more distinct with increased HF content during the synthesis reaction, indicating the higher proportion of TiOF2 within the heterojunction.17 Furthermore, F− ions in HF contribute to the stabilization of the [001] crystal orientation, thereby influencing crystal formation, as previously observed by Han et al. and Ong et al.20,23 This influence is discernible in the diffraction patterns of Ti-A and Ti-B, where the intensity and sharpness of the (200) peak surpass that of the (004) peak, indicating a preference for crystal growth along the [001] plane.24
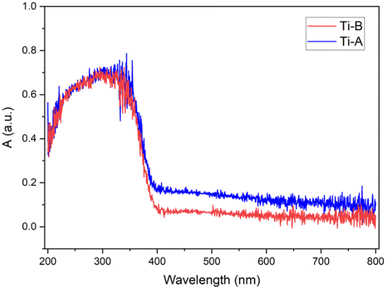
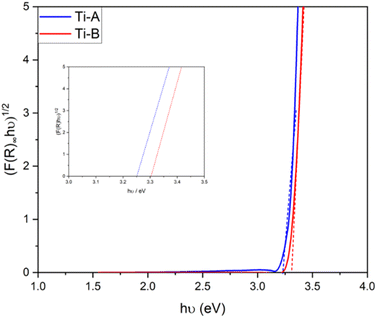
The bandgap values serve as indicators of a photocatalyst's light absorption capability. In terms of electronic band structures, both TiO2 and TiOF2 share similar characteristics, wherein the valence band is primarily composed of 2p O and/or F orbitals, while the conduction band is primarily comprised of 3d Ti orbitals.5 Introducing the appropriate quantity of HF during the synthesis of TiO2/TiOF2 has the potential to enhance visible light absorption.25 The formation of a TiO2/TiOF2 heterojunction involves the insertion of F− ions into the O2− sites on TiO2, requiring an additional electron to balance the charge. This process reduces Ti4+ to Ti3+. The self-doping of Ti3+ can increase the conductivity of TiO2 and enhance the separation and movement of electron–hole charge pairs.26 Additionally, Ti3+ defects from Ti–O bond synthesized via flame spray pyrolysis were able to facilitate the oxidation and reduction processes of water into hydrogen and oxygen.27
Ti-A exhibited a slightly smaller bandgap compared to Ti-B, which is believed to be due to the light-shielding effect of TiOF2. Consequently, Ti-B possesses a lower absorption capacity than Ti-A.
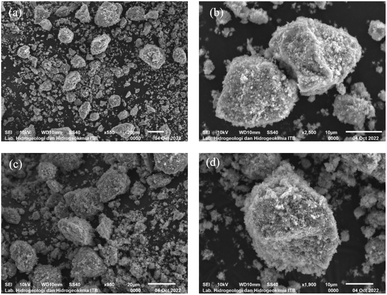
Based on the SEM analysis (Fig. 4), the predominant crystal structure observed in the samples is a truncated bipyramid, suggesting the presence of the [001] facet. Ti-B exhibits a flatter structure compared to Ti-A, likely due to its greater growth towards the [001] facet. The elemental composition of Ti, O, and F in both Ti-A and Ti-B was semi-quantitatively analyzed using energy dispersive X-ray spectroscopy (EDX), as summarized in Table 4.
| Mass element (%) | Ti-A | Ti-B |
|---|---|---|
| Ti | 53.37 | 45.20 |
| O | 36.49 | 38.97 |
| F | 10.14 | 15.83 |
The quantities of elements in Ti-B, as determined through SEM-EDX analysis (Table 4) confirms the fluorine (F) content surpasses that of Ti-A, which can be attributed to the varying amounts of HF incorporated during the synthesis process.
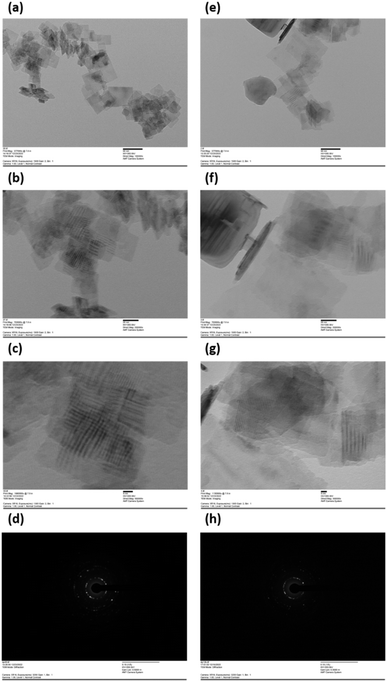
In addition, TEM analysis (Fig. 5) is used to obtain quantitative measures of size distributions and morphology of Ti-A (Fig. 5a–d) and Ti-B (Fig. 5e–h) samples. As depicted in HR-TEM images (Fig. 5c and g) and corresponding electron diffraction pattern (Fig. 5d and h) for Ti-A and Ti-B samples, the lattice fringes measuring 0.352 nm and 0.38 nm correspond to the (101) planes of TiO2 (ref. 30) and (100) planes of TiOF2,16 respectively. This observation aligns with the findings from XRD analyses (Fig. 1). The particle sizes of Ti-A are in the range of 19 to 40 nm with an average size of 27 nm, while Ti-B samples is in the range of 26 to 154 nm with an average size of 72 nm. The even distribution of Ti, O, and F indicates the successful formation of a heterojunction.
| Sample | SBET (m2 g−1) | Vpore (cc g−1) | Dpore (nm) |
|---|---|---|---|
| Ti-A | 114.20 | 0.31 | 10.94 |
| Ti-B | 77.91 | 0.55 | 27.96 |
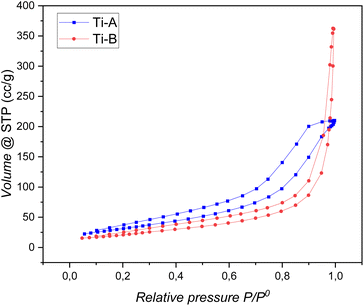
The pore volume and size in Ti-B were found to be greater than those in Ti-A, measuring 0.55 cc g−1 and 27.60 nm for Ti-B compared to 0.31 cc g−1 and 10.94 nm for Ti-A, respectively. In terms of the average pore size, Ti-A and Ti-B both fall within the category of mesoporous catalysts, with average pore sizes of 10.94 nm and 27.96 nm, respectively. Notably, the diameter of both catalysts exceeds that of the reactant (methane) and the product (methanol), which are 3.8 Å and 3.6 Å, respectively. Consequently, it is likely that the adsorption and desorption processes of the reactant and product into the catalyst pores occur without hindrance.
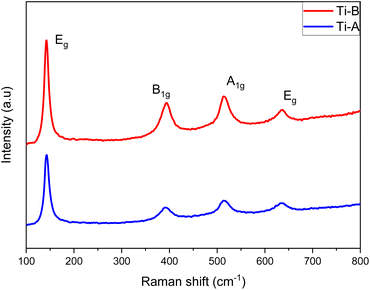
Raman spectroscopy provides an alternative means to evaluate the proportion of exposed [001] facets in anatase TiO2 by capitalizing on distinctive molecular bond vibrations associated with each crystal plane.28 Specifically, the Eg peak corresponds to the symmetric stretch vibration of O–Ti–O in TiO2, the B1g peak results from the symmetric bend vibration of O–Ti–O, and the A1g peak is linked to the antisymmetric bend vibration of O–Ti–O. Consequently, as the percentage of exposed [001] facets increase, there is a concurrent rise in the number of symmetric and antisymmetric bend vibrations of O–Ti–O, leading to an augmentation in the intensities of the A1g and B1g peaks observed in the Raman spectrum. Quantitative assessments of the [001] facet percentages can be derived from the ratio of the Eg and A1g peak values within the Raman spectra. The computed percentage values for the [001] facets in both Ti-A and Ti-B are presented in Table 6.
| Sample | Peak intensity Eg (144 cm−1) | Peak intensity A1g (514 cm−1) | Percentage [001] (%) |
|---|---|---|---|
| Ti-A | 2391.78 | 1254.47 | 52.4 |
| Ti-B | 3533.55 | 2256.47 | 63.8 |
The calculated percentages for Ti-A and Ti-B are 52.4% and 63.8%, respectively. The presence of fluoride (F) ions plays a pivotal role in stabilizing the formation of [001] facets on the surface. Increasing the volume of HF added leads to a higher proportion of exposed [001] facets being formed (Table 6).20
Analysis of photocatalytic activity test
| Std order | Run order | Catalyst | FeCl2 (mL) | H2O2 (mL) | Yield of methanol (μmol h−1 gcat−1) |
|---|---|---|---|---|---|
| 5 | R1 | Ti-A | 0.0 | 1.0 | 0.6440 |
| 1 | R2 | Ti-A | 0.0 | 0.0 | 0.5224 |
| 6 | R3 | Ti-B | 0.0 | 1.0 | 0.2242 |
| 10 | R4 | Ti-B | 7.5 | 0.5 | 0.4251 |
| 7 | R5 | Ti-A | 15.0 | 1.0 | 0.7257 |
| 4 | R6 | Ti-B | 15.0 | 0.0 | 0.3901 |
| 3 | R7 | Ti-A | 15.0 | 0.0 | 0.4935 |
| 2 | R8 | Ti-B | 0.0 | 0.0 | 0.3501 |
| 8 | R9 | Ti-B | 15.0 | 1.0 | 0.3705 |
| 9 | R10 | Ti-A | 7.5 | 0.5 | 0.6679 |
In run order 5, employing photocatalyst Ti-B along with 15 mL of FeCl2 and 1 mL of H2O2, the highest methanol yield was achieved. To comprehensively assess the data pertaining to methanol yield obtained from the specified experimental design, ANOVA analysis was conducted. This analysis aimed to affirm the extent and direction of the factor impacts and identify the variables likely to hold significance, as outlined in Table 8.
| Source | DF | Adj SS | Adj MS | F-value | P-value |
|---|---|---|---|---|---|
| Model | 7 | 0.229734 | 0.032819 | 406.97 | 0.002 |
| Linear | 3 | 0.179845 | 0.059948 | 743.38 | 0.001 |
| Catalyst | 1 | 0.167272 | 0.167272 | 2074.23 | 0.000 |
| FeCl2 | 1 | 0.007144 | 0.007144 | 88.59 | 0.011 |
| H2O2 | 1 | 0.005429 | 0.005429 | 67.32 | 0.015 |
| 2-Way interactions | 3 | 0.039272 | 0.013091 | 162.33 | 0.006 |
| Catalyst·FeCl2 | 1 | 0.002227 | 0.002227 | 27.62 | 0.034 |
| Catalyst·H2O2 | 1 | 0.031162 | 0.031162 | 386.42 | 0.003 |
| FeCl2·H2O2 | 1 | 0.005883 | 0.005883 | 72.95 | 0.013 |
| Curvature | 1 | 0.010617 | 0.010617 | 131.66 | 0.008 |
| Error | 2 | 0.000161 | 0.000081 | ||
| Total | 9 | 0.229895 |
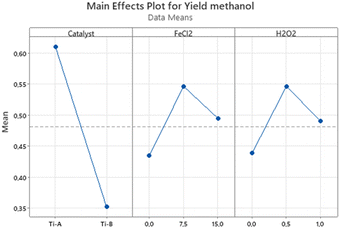
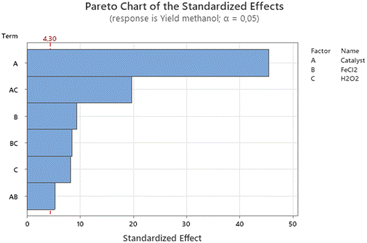
The analysis of the experimental data was carried out at a significance level (Type I error) of 0.05. The model exhibited a p-value below the significance level, indicating its significance with a probability of only 0.2% being attributed to noise. Additionally, both main and interaction effects proved to be statistically significant, with p-values below 0.05, as illustrated in Fig. 8.
The catalyst factor exhibited the most pronounced influence on the response, with Ti-A demonstrating a more favorable impact on methanol yield compared to Ti-B. This difference can be attributed to the characteristics of Ti-A, which boasts superior optical properties, a broader surface area, and a larger [001] facet area. The effects of the electron scavenger (FeCl2) and H2O2 were also observed to be positive, signifying that an increase in the quantities of FeCl2 and H2O2 leads to higher methanol yields. As part of this experimental design, a central point run was conducted to detect any curvature in the response. The p-value associated with curvature, as determined through ANOVA, falls below the significance level, indicating the presence of an optimal response within the tested range of levels.
In this experiment, the absence of replication for each combination posed a potential risk of noise impacting the model's results. To mitigate this concern, we applied the principle of sparsity effect analysis to non-replicated factorial designs. This principle operates under the assumption that the system is primarily influenced by main effects and low-order interactions, enabling us to streamline and derive the most optimal model. Subsequently, through a hierarchical approach, we eliminated higher-order interactions from the Pareto chart, retaining only the most substantial main effects. Fig. 9 visually represents the absolute values of these effects, organized in descending order of magnitude.
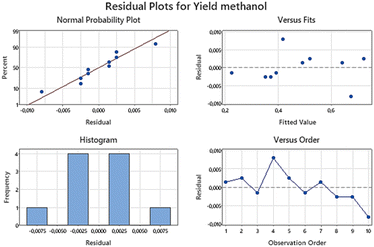
The Pareto chart clearly indicates that all main effects and second-order interactions have a substantial impact on methanol yield. However, it's worth noting that the second-order interactions exhibit comparatively smaller effects when compared to the main effects. In contrast, third-order interactions, particularly those involving the catalyst, FeCl2, and H2O2 factors, do not exert a significant influence on the experimental response. It is important to mention that a 2 full factorial experimental design assumes conditions of constant variance, full randomization, and normally distributed data. To further evaluate the model's adequacy and identify potential variance-related issues, a residual plot analysis was conducted.
Fig. 10 displays the residual plot generated from the experiment. No irregularities or anomalies were observed in any of the residual plots, affirming the validity of the assumptions underlying this experimental design. In standard practice, general regression analysis is commonly employed in 2 full factorial experimental designs to establish an empirical fitting model. However, in this particular experiment, such analysis was not conducted due to the inclusion of qualitative factors. Consequently, interpreting regression results for the factors and response would lack meaningful insight.
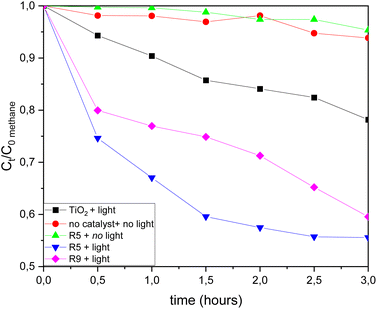
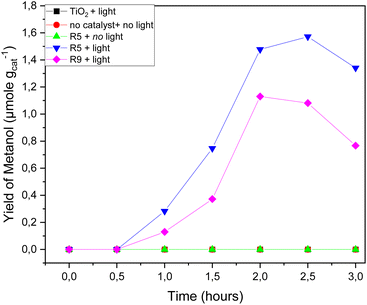
In the absence of light, methane gas did not exhibit a significant reduction, and no methanol was generated during the reaction. This underscores the role of the TiO2/TiOF2 photocatalyst in facilitating the light-driven conversion of methane into methanol. However, it's worth noting that there was a minor decrease in gas levels over time, possibly because gas was being collected for analysis. When employing the commercial TiO2 catalyst along with the addition of the electron scavenger FeCl2, H2O2, and UV-vis light, there was a reduction in methane levels, but methanol was not detected. This discrepancy could be attributed to methane undergoing reactions to form other compounds besides methanol, which were not identified in this particular study.
R5 experiment displayed the highest methane consumption (Fig. 11) and methanol production (Fig. 12). Methanol production was observed between 0.5 and 2.5 hours of the reaction, with a decline in methanol production occurring after the 2.5 hour mark. This decrement could be attributed to the degradation of methanol into other products, especially at certain concentrations, as methanol is susceptible to be oxidized. An excess of ˙O2 and a certain level of methanol can result in further oxidation into various compounds. Additionally, it is worth noting that the [001] facet of the catalyst possesses oxidative properties. A greater presence of [001] facets renders the catalyst more oxidative,31 leading to increased charge carriers and enhanced separation efficiency of photogenerated electron–hole pairs.17 Consequently, in R9, which employs Ti-B with a higher proportion of [001] facets compared to Ti-A, the production and subsequent decline of methanol appear to occur more rapidly.
The inclusion of fluorine (F) in the TiO2/TiOF2 composite serves several beneficial purposes: it enhances the adsorption of reactant molecules on the catalyst surface,26 reduces the crystal surface energy to foster the formation of [001] facets, and diminishes light scattering by replacing high-scattering oxygen atoms with low-scattering fluorine atoms.5 This, in turn, helps prevent recombination and prolongs the lifetimes of charge carriers.17,32 The presence of both FeCl2 and H2O2 has been demonstrated to have a positive impact on the reaction. The results obtained from ANOVA indicate that the main effects and second-order interaction effects of these compounds with the catalyst contribute significantly to efficient methanol production. This can be elucidated by the role played by Fe2+ ions and H2O2 in facilitating the Fenton reaction cycle. Fenton reactions are instrumental in generating free radicals and reducing the recombination of electron–hole pairs, primarily through the production of Fe3+ within the Fenton cycle.33 Furthermore, the assessment of photocatalytic activity depicted in Fig. S1† highlights that incorporating metallic Ag in Ag-TiO2/TiOF2 significantly enhances methane-to-methanol conversion, with a 2.2-fold increase in activity compared to TiO2/TiOF2. The observed methanol yield of 1.5817 μmole h−1 gcat−1 underscores the catalytic efficacy of Ag, suggesting that the presence of metallic Ag contributes positively to the photocatalytic performance of the system.
 | (1) |
The photocatalytic reaction took place within a batch reactor, where methane gas (CH4) was introduced into water (H2O) for a specific duration until saturation was reached. Given the low solubility of methane in water, each dissolved methane molecule swiftly engaged in a reaction with water during the process. As a result, there was an excess of water acting as the reactant in this reaction. Consequently, the kinetics of the photocatalytic conversion of methane to methanol can be accurately modelled using pseudo-first-order reaction kinetics following eqn (2).
 | (2) |
Table 9 displays the reaction rate constants for both catalysts, Ti-A and Ti-B, when subjected to the same quantities of added FeCl2 and H2O2. Notably, the rate constant for catalyst Ti-A is higher in comparison to Ti-B. This observation is consistent with the ANOVA findings, which suggest that Ti-A has a more substantial impact than Ti-B, resulting in a faster reaction rate. Table 10 provides the contrast of methanol yield observed in this research compare to that of another study involving a pure titanium-based photocatalyst.
| Run order | Catalyst | k (minute−1) | R2 |
|---|---|---|---|
| 5 | Ti-A | 0.1080 | 0.93 |
| 9 | Ti-B | 0.0784 | 0.96 |
| Catalyst | Reaction condition | Light source | Yield of methanol | Ref. |
|---|---|---|---|---|
| Ag-TiO2/TiOF2 | 1 atm, room temperature, FeCl2, H2O2 | Xenon lamp (UV-vis light 300 W) | 1.58 μmole h−1 gcat−1 | This study |
| TiO2/TiOF2 | 1 atm, room temperature, FeCl2, H2O2 | Xenon lamp (UV-vis light 300 W) | 0.73 μmole h−1 gcat−1 | This study |
| Pure TiO2 | 1 atm, room temperature | Nd:YAG laser (355 nm) | ∼86 μmole h−1 | 34 |
| m-TiO2 | 1 atm, 55–60 °C | UV light (400 W) | 0.02 μmole h−1 | 7 |
| TiO2/Bi2WO6 | 55 °C, medium pressure | Mercury lamp (450 W) | ∼10 μmole h−1 g−1 | 35 |
| Cu2O/TiO2 | 1 atm, room temperature, H2O2 | Xenon lamp (UV-vis light 300 W) | ∼3 μmole h−1 gcat−1 | 6 |
| FeOx/TiO2 | 1 atm, room temperature, H2O2 | Xenon lamp (UV-vis light 300 W) | 360 μmole h−1 gcat−1 | 6 |
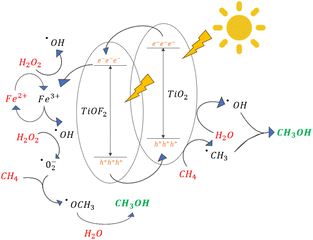
The mechanism reaction proposed from the photocatalytic reaction of methane to methanol in the system with presence of TiO2/TiOF2, FeCl2 and H2O2 can be illustrated in Fig. 13.
Upon the illumination of light, electron (e−) from TiO2 and TiOF2 exited to the higher energy level, leaving a vacant valence band with holes (h+). Photogenerated electrons and protons migrate in the interface between two semiconductors. The CB and the VB levels of TiO2 are higher than the corresponding levels of the TiOF2. Thus, the photogenerated electrons will transfer to TiOF2, while the photogenerated holes will migrate to TiO2.
Reduction reaction and the oxidation reaction take place on TiOF2 with lower reduction potential and on TiO2 with lower oxidation potential, respectively.36 The electrons in the conduction band reacts with Fe3+ to form Fe2+ and subsequently reacts with H2O2 to form Fe3+ and ˙OH. The protons in the valence band oxidize CH4 and H2O to form radical ˙CH3 and ˙OH, respectively. The ˙CH3 radical reacts with ˙OH to produces CH3OH. Based on Fig. S2,† an increase of the ˙OH presence was observed by increasing photocatalytic reaction time using TiO2/TiOF2 and Ag-TiO2/TiOF2 compared to without the presence of catalyst. The comparative analysis of photocatalytic methane-to-methanol conversion, both in the presence and absence of coumarin as a hydroxyl radical scavenger, reveals a substantial decrease in methanol yield, as depicted in Fig. S3.† The observed significant reduction, or even negligible production, of methanol in the presence of scavengers strongly suggests the crucial involvement of hydroxyl radicals in the intricate reaction mechanism governing the conversion of methane to methanol. Alternatively, the ˙OCH3 radical, generated from the reaction between CH4 and ˙O2−, reacts with H2O to produce the product CH3OH. In summary, the mechanism of photocatalytic conversion of methane to methanol involve FeCl2 and H2O2 was speculated as follow eqn (3–12):
| Fe2+ + H2O2 → Fe3+ + ˙OH + OH− | (3) |
| H2O2 + ˙OH → ˙O2− + H2O + H+ | (4) |
| TiO2 + TiOF2 → e− + h+ | (5) |
| Fe3+ + e− → Fe2+ | (6) |
| H2O2 + e− → ˙OH | (7) |
| CH4 + h+ → ˙CH3 | (8) |
| CH4 + ˙OH → ˙CH3 + H2O | (9) |
| CH4 + ˙O2− → ˙OCH3 + OH− | (10) |
| ˙CH3 + ˙OH → CH3OH | (11) |
| ˙OCH3 + H2O → CH3OH + ˙OH | (12) |
Conclusions
In summary, we have successfully developed a heterojunction TiO2/TiOF2 photocatalyst through a one-step hydrothermal method. This modified photocatalyst exhibited truncated bipyramidal shapes, indicating the presence of exposed [001] facets. Our statistical analysis confirmed the significant influence of this modified photocatalyst on methanol production. Moreover, the combined use of photocatalyst TiO2/TiOF2 with the electron scavenger FeCl2 and H2O2 demonstrated a positive synergistic effect on methane-to-methanol conversion, yielding 0.7257 μmole (gcat h)−1 of methanol. Introducing Ag onto the TiO2/TiOF2 catalyst demonstrates a notable 2.2-fold improvement in the methanol yield. Moreover, the pivotal role of hydroxyl radicals in the overall reaction mechanism underscores their significance in influencing the photocatalytic conversion of methane to methanol process. Ultimately, this report paves the way for optimizing methanol yield by pinpointing the crucial factors involving TiO2/TiOF2 photocatalyst, FeCl2, H2O2, and Ag metal, thus leading to the best possible response.Author contributions
Conceptualization, WHS and DS; methodology, GY, WHS, and DS; formal analysis, GY and WHS; investigation, GY and WHS; resources, WHS and DS; writing – original draft preparation, WHS and GY; writing – review and editing, WHS and DS; visualization, GY; supervision, WHS and DS; project administration, WHS; funding acquisition, WHS and DS. All authors have read and agreed to the published version of the manuscript.Conflicts of interest
There is no conflict of interests existing in the manuscript submission, and it is approved by all of the authors for publication. All the authors listed have approved the manuscript to be enclosed.Acknowledgements
This work was supported by ITB Research Program Fund 2022, Grant No. LPPM.PN-6-16-2022 and Research and Innovation for the Advancement of Indonesia (RIIM) 2023 under National Research and Innovation Agency (BRIN) and Indonesia Endowment Fund for Education (LPDP), Ministry of Finance, Republic of Indonesia, Grant No. 37/II.7/HK/2023.Notes and references
- X. Meng, X. Cui, N. P. Rajan, L. Yu, D. Deng and X. Bao, Direct Methane Conversion under Mild Condition by Thermo-, Electro-, or Photocatalysis, Chem, 2019, 5(9), 2296–2325, DOI:10.1016/j.chempr.2019.05.008.
- D. Yu, Y. Jia and Z. Yang, et al., Solar Photocatalytic Oxidation of Methane to Methanol with Water over RuOx/ZnO/CeO2Nanorods, ACS Sustain. Chem. Eng., 2022, 10(1), 16–22, DOI:10.1021/acssuschemeng.1c07162.
- V. Augugliaro, G. Palmisano, L. Palmisano and J. Soria, Heterogeneous Photocatalysis and Catalysis: an Overview of Their Distinctive Features, Elsevier B.V., 2019, DOI:10.1016/B978-0-444-64015-4.00001-8.
- Z. Xiong, H. Wu, L. Zhang, Y. Gu and X. S. Zhao, Synthesis of TiO2 with controllable ratio of anatase to rutile, J. Mater. Chem. A, 2014, 2(24), 9291–9297, 10.1039/c4ta01144a.
- X. Rocquefelte, F. Goubin and Y. Montardi, et al., Analysis of the refractive indices of TiO 2, TiOF 2, and TiF 4: Concept of optical channel as a guide to understand and design optical materials, Inorg. Chem., 2005, 44(10), 3589–3593, DOI:10.1021/ic048259w.
- J. Xie, R. Jin and A. Li, et al., Highly selective oxidation of methane to methanol at ambient conditions by titanium dioxide-supported iron species, Nat. Catal., 2018, 1(11), 889–896, DOI:10.1038/s41929-018-0170-x.
- Y. Negishi, S. Watanabe, M. Aoki, S. Hossain and W. Kurashige, Toward the Creation of Highly Active Photocatalysts That Convert Methane into Methanol Active Photocatalysts, Antimicrob. Agents Chemother., 2019, 32(12), 1854–1858, DOI:10.1128/AAC.32.12.1854.
- J. Zhu, Z. Liu, F. Yang, D. Long, Y. Jian and S. Pu, The Preparation of {001}TiO2/TiOF2 via a One-Step Hydrothermal Method and Its Degradation Mechanism of Ammonia Nitrogen, Materials, 2022, 15(18), 6465, DOI:10.3390/ma15186465.
- J. Li, X. Lv, B. Weng, M. B. J. Roeffaers and H. Jia, Engineering light propagation for synergetic photo- and thermocatalysis toward volatile organic compounds elimination, Chem. Eng. J., 2023, 461, 142022, DOI:10.1016/j.cej.2023.142022.
- G. Yuniar, W. H. Saputera, D. Sasongko, R. R. Mukti, J. Rizkiana and H. Devianto, Recent Advances in Photocatalytic Oxidation of Methane to Methanol, Molecules, 2022, 27, 5496, DOI:10.3390/molecules27175496.
- D. Yu, H. Zhang and H. Liu, et al., Strategies for Improving the Photocatalytic Methane to Methanol Conversion Efficiency, Curr. Org. Chem., 2023, 27, 399–410, DOI:10.2174/1385272827666221219112052.
- C. Wang, H. Zhang and F. Lai, et al., Engineering versatile Au-based catalysts for solar-to-fuel conversion, J. Energy Chem., 2023, 83, 341–362, DOI:10.1016/j.jechem.2023.04.027.
- N. Syuhada, W. Loon and D. Mohamad, ScienceDirect A critical review of metal-doped TiO 2 and its structure e physical properties e photocatalytic activity relationship in hydrogen production, Int. J. Hydrogen Energy, 2020, 45(53), 28553–28565, DOI:10.1016/j.ijhydene.2020.07.233.
- S. P. Hong, S. Kim, N. Kim, J. Yoon and C. Kim, Invited Review Paper A short review on electrochemically self-doped TiO2 nanotube arrays: Synthesis and applications, Korean J. Chem. Eng., 2019, 36(11), 1753–1766, DOI:10.1007/s11814-019-0365-0.
- S. Murcia-López, K. Villa, T. Andreu and J. R. Morante, Improved selectivity for partial oxidation of methane to methanol in the presence of nitrite ions and BiVO4 photocatalyst, Chem. Commun., 2015, 51(33), 7249–7252, 10.1039/c5cc00978b.
- C. Z. Wen, Q. H. Hu, Y. N. Guo, X. Q. Gong, S. Z. Qiao and H. G. Yang, From titanium oxydifluoride (TiOF2) to titania (TiO2): Phase transition and non-metal doping with enhanced photocatalytic hydrogen (H2) evolution properties, Chem. Commun., 2011, 47(21), 6138–6140, 10.1039/c1cc10851d.
- R. Liu, Z. Ji and S. Xie, et al., Fabrication of {001}-facet enriched anatase TiO2/TiOF2 heterostructures with controllable morphology for enhanced photocatalytic activity, Mater. Today Commun., 2021, 26, 102060, DOI:10.1016/j.mtcomm.2021.102060.
- Z. Liu, X. Liu, Q. Lu, Q. Wang and Z. Ma, TiOF2/TiO2 composite nanosheets: Effect of hydrothermal synthesis temperature on physicochemical properties and photocatalytic activity, J. Taiwan Inst. Chem. Eng., 2019, 96, 214–222, DOI:10.1016/j.jtice.2018.11.013.
- Y. Zhang, T. Xia and M. Shang, et al., Structural evolution from TiO2 nanoparticles to nanosheets and their photocatalytic performance in hydrogen generation and environmental pollution removal, RSC Adv., 2014, 4(31), 16146–16152, 10.1039/c3ra48066f.
- X. Han, Q. Kuang, M. Jin, Z. Xie and L. Zheng, Synthesis of Titania Nanosheets with a High Percentage of Exposed (001) Facets, J. Am. Chem. Soc., 2009, 131(001), 3152–3153 CrossRef CAS PubMed.
- K. Thamaphat, P. Limsuwan and B. Ngotawornchai, Phase Characterization of TiO2 Powder by XRD and TEM, Nat. Sci., 2008, 42(5), 357–361 Search PubMed.
- J. Wang, F. Cao, Z. Bian, K. H. Leung and H. Li, Ultrafine single-crystal TiOF2 nanocubes with mesoporous structure, high activity and durability in visible light driven photocatalysis, Nanoscale, 2014, 6, 897–902, 10.1039/c3nr04489k.
- W.-J. Ong, L.-L. Tan, S.-P. Chai, S. T. Yonga and A. R. Mohamed, Highly Reactive {001} Facets of TiO2-Based Composites: Synthesis, View Article Online DOI: 10.1039/C3NR04655A Formation Mechanism and Characterizations, Nanoscale, 2014, 6(207890), 1946–2008, 10.1039/C3NR04655A.
- W. Ong, L. Tan, S. Chai and S. Yong, Facet-Dependent Photocatalytic Properties of TiO2-Based Composites for Energy Conversion and Environmental Remediation, ChemSusChem, 2014, 7(3), 690–719, DOI:10.1002/cssc.201300924.
- C. Hou, H. Liu and Y. Li, The preparation of three-dimensional flower-like TiO2/TiOF2 photocatalyst and its efficient degradation of tetracycline hydrochloride, RSC Adv., 2021, 11(25), 14957–14969, 10.1039/d1ra01772a.
- J. Hu, Y. Lu and X. L. Liu, et al., Photoinduced terminal fluorine and Ti3+ in TiOF2/TiO2 heterostructure for enhanced charge transfer, CCS Chem., 2020, 2(6), 1573–1581, DOI:10.31635/ccschem.020.202000305.
- W. H. Saputera, J. Rizkiana and W. Wulandari, Role of defects on TiO2/SiO2 composites for boosting photocatalytic water splitting Wibawa, RSC Adv., 2020, 10, 27713–27719, 10.1039/d0ra05745b.
- F. Tian, Y. Zhang, J. Zhang and C. Pan, Raman spectroscopy: A new approach to measure the percentage of anatase TiO2 exposed (001) facets, J. Phys. Chem. C, 2012, 116(13), 7515–7519, DOI:10.1021/jp301256h.
- Z. Wang, B. Huang and Y. Dai, et al., Topotactic transformation of single-crystalline TiOF 2 nanocubes to ordered arranged 3D hierarchical TiO 2 nanoboxes, CrystEngComm, 2012, 14(14), 4578–4581, 10.1039/c2ce25271f.
- L. Niu, Q. Zhang, J. Liu, J. Qian and X. Zhou, TiO 2 nanoparticles embedded in hollow cube with highly exposed { 001 } facets : Facile synthesis and photovoltaic applications, J. Alloys Compd., 2016, 656, 863–870, DOI:10.1016/j.jallcom.2015.10.039.
- L. Ye, J. Mao, J. Liu, Z. Jiang, T. Peng and L. Zan, Synthesis of anatase TiO2 nanocrystals with {101}, {001} or {010} single facets of 90% level exposure and liquid-phase photocatalytic reduction and oxidation activity orders, J. Mater. Chem. A, 2013, 1(35), 10532–10537, 10.1039/c3ta11791j.
- X. Zhao, G. Wei, J. Liu, Z. Wang, C. An and J. Zhang, Synthesis of heterostructured Pd@TiO2/TiOF2 nanohybrids with enhanced photocatalytic performance, Mater. Res. Bull., 2016, 80, 337–343, DOI:10.1016/j.materresbull.2016.04.018.
- Y. Zeng, H. C. Liu, J. S. Wang, X. Y. Wu and S. L. Wang, Synergistic photocatalysis-Fenton reaction for selective conversion of methane to methanol at room temperature, Catal. Sci. Technol., 2020, 10(8), 2329–2332, 10.1039/d0cy00028k.
- M. A. Gondal, A. Hameed, Z. H. Yamani and A. Arfaj, Photocatalytic transformation of methane into methanol under UV laser irradiation over WO3, TiO2 and NiO catalysts, Chem. Phys. Lett., 2004, 392(4–6), 372–377, DOI:10.1016/j.cplett.2004.05.092.
- S. Murcia-López, K. Villa, T. Andreu and J. R. Morante, Partial oxidation of methane to methanol using bismuth-based photocatalysts, ACS Catal., 2014, 4(9), 3013–3019, DOI:10.1021/cs500821r.
- J. Low, J. Yu, M. Jaroniec, S. Wageh and A. A. Al-Ghamdi, Heterojunction Photocatalysts, Adv. Mater., 2017, 29(20), 1–20, DOI:10.1002/adma.201601694.
Footnote |
| † Electronic supplementary information (ESI) available. See DOI: https://doi.org/10.1039/d4ra00353e |
| This journal is © The Royal Society of Chemistry 2024 |

