 Open Access Article
Simultaneously improving the pore structure and electron conductive network of the anode catalyst layer via SnO2 doping for proton exchange membrane water electrolysis
Bang Lia,
Guangfu Li *b,
Qiqi Wan
 a,
Lei Yuana,
Yingying Liua,
Longxu Lia,
Xiaodong Zhuang
 c,
Junliang Zhang
 a and
Changchun Ke
 *a
*a
aInstitute of Fuel Cells, School of Mechanical Engineering, Shanghai Jiao Tong University, 800 Dongchuan Rd, Shanghai 200240, P. R. China. E-mail: kechangchun@sjtu.edu.cn
bFoshan Xianhu Laboratory of the Advanced Energy Science and Technology Guangdong Laboratory, Xianhu Hydrogen Valley, Foshan, 528200, P. R. China. E-mail: liguangfu@xhlab.cn
cSchool of Chemistry and Chemical Engineering, Shanghai Jiao Tong University, 800 Dongchuan Rd, Shanghai 200240, P. R. China
First published on 2nd April 2024
Abstract
Proton exchange membrane water electrolysis (PEMWE) is a promising technology for green hydrogen production. However, its large-scale commercial application is limited by its high precious metal loading, because low catalyst loading leads to reduced electron transport channels and decreased water transportation, etc. Herein, we study the electrode level strategy for reducing Ir loading by the optimization of the micro-structure of the anode catalyst layer via SnO2 doping. The pore structure and electron conductive network of the anode catalyst layer can be simultaneously improved by SnO2 doping, under appropriate conditions. Therefore, mass transfer polarization and ohmic polarization of the single cell are reduced. Moreover, the enhanced pore structure and improved electron conduction network collectively contribute to a decreased occurrence of charge transfer polarization. By this strategy, the performance of the single cell with the Ir loading of 1.5 mg cm−2 approaches the single cell with the higher Ir loading of 2.0 mg cm−2, which means that SnO2 doping saves about 25% loading of Ir. This paper provides a perspective at the electrode level to reduce the precious metal loading of the anode in PEMWE.
1. Introduction
Proton exchange membrane water electrolysis (PEMWE), which can produce high-purity hydrogen1 with high energy conversion efficiency, high current density,2 and minimal gas permeation between the anode and cathode, is considered a promising technology for large-scale green hydrogen production.3 In recent years, companies such as Air Liquide, Linde, Elogen, Nel ASA, Ørste, Amprion, and Open Grid Europe have proposed large-scale PEMWE projects.4However, the high cost of the PEMWE stack seriously hinders the widespread application and commercialization of this technology. The utilization of high-loading of platinum group metals, such as platinum (Pt), iridium (Ir), and ruthenium (Ru),5 in the anode catalyst layer for PEMWE is an important adverse factor to its high cost. In a common 1 MW PEMWE system, approximately 1 to 2 kg Ir is required, while the annual global production of Ir is only about 7000 to 8000 kg.6
According to Spori et al.,7 for large-scale applications of PEMWE, the Ir loading should be below 0.05 mg cm−2 and less than 0.01 g kW−1. Nevertheless, the current Ir loading in the anode catalyst layer of PEMWE systems is approximately 2 mg cm−2,8 much higher than the target of 0.05 mg cm−2.9–12 In a word, overcoming the excessively high anode Ir or precious metal loading is crucial for the large-scale commercial application of PEMWE.
Generally, low catalyst loading leads to various challenges, including a decline in the electrochemical active surface area,13 lower homogeneity of the catalyst layer,14 reduced electron transport channels,13,15 and decreased water transportation.16
So far, several strategies are adopted to reduce the anode catalyst loading for PEMWE. Considering the excellent OER performance of Ir- and Ru-based catalysts, many researchers have been devoted to designing novel Ir/Ru-based nanostructured catalysts,17 such as supported catalysts18–20 and core–shell structured catalysts.21–23
However, a few works focus on the new structure design and preparation techniques of the catalyst layer. Hegge et al.24 utilized electrospinning technology to fabricate high-conductivity IrOx nanofibers, improving electron conductivity in the catalyst layer. Dong et al.25 proposed a design that enhances mass transport and the three-phase interface in the catalyst layer by utilizing a gradient conical array in the anode catalyst layer. Lu et al.26 synthesized vertically arranged IrOx nanoarrays utilizing titanium nano-templates as substrates through electrodeposition technology, improving the ion transport capability. However, the complex preparation procedures involved in these methods may pose challenges for practical application.
Although non-noble metals, such as SnO2, have been studied to reduce the use of Ir, the research has mainly focused on the catalyst level but not on the catalyst layer structure at the electrode level. In this paper, we studied the electrode level strategy for reducing Ir loading by the optimization of the micro-structure of the catalyst layer via SnO2 doping. It is found that, under appropriate conditions, the pore structure and electron conductive network of the anode catalyst layer can be simultaneously improved by SnO2 doping, thus reducing the mass transfer polarization and ohmic polarization. Furthermore, the improved pore structure and enhanced electron conduction network collectively work to minimize the occurrence of charge transfer polarization. As a result, these contribute to a reduction in charge transfer polarization. This paper provides a perspective at the electrode level to reduce the precious metal loading of the anode for PEMWE.
2. Experimental
2.1 Materials
Nation 115 membrane (DuPont), isopropanol (AR, Sinopharm Chemical Reagent), 30 wt% H2O2 (AR, Sinopharm Chemical Reagent), 98 wt% H2SO4 (AR, Sinopharm Chemical Reagent), Ir black (10 nm, ZKJY), SnO2 (<50 nm, Aladdin), 70 wt% Pt/C (TANAKA), 5 wt% Nation solution (DuPont), carbon paper (T60), and titanium felt (ZJXY) are used as received.2.2 The fabrication of membrane electrode assemblies (MEAs)
Firstly, the Nafion 115 membrane was pre-treated by 5 wt% H2O2 solution (1 h, 80 °C) and 1 M H2SO4 solution (1 h, 80 °C), respectively, as the ref. 27. Before using, the membrane was dried in a vacuum oven for 4 hours at 60 °C.The anode catalyst ink was formulated by blending iridium black, a certain proportion of SnO2, 5 wt% Nafion solution, deionized water, and isopropanol. The cathode catalyst ink was formulated by blending Pt/C, 5 wt% Nafion solution, deionized water, and isopropanol. The ionomer content of anode and cathode accounted for 16 wt% and 23 wt%, respectively. The ball milling technique was employed to ensure uniformity of the ink. The anode and cathode ink were sprayed onto the Nafion 115 membrane and carbon paper, respectively. The anode is catalyst coated membrane (CCM), and the cathode is gas diffusion electrode (GDE).
The study involved five sets of CCMs samples, namely CCM-1.5Ir, CCM-2.0Ir, CCM-1.5Ir-0.25SnO2, CCM-1.5Ir-0.50SnO2, and CCM-1.5Ir-0.75SnO2, shown in Table 1.
| Sample | Anode catalyst layer |
|---|---|
| CCM-1.5Ir | Ir (1.5 mg cm−2) |
| CCM-2.0Ir | Ir (2.0 mg cm−2) |
| CCM-1.5Ir-0.25SnO2 | Ir (1.5 mg cm−2) + SnO2 (0.25 mg cm−2) |
| CCM-1.5Ir-0.50SnO2 | Ir (1.5 mg cm−2) + SnO2 (0.50 mg cm−2) |
| CCM-1.5Ir-0.75SnO2 | Ir (1.5 mg cm−2) + SnO2 (0.75 mg cm−2) |
2.3 Physical characterizations
The surface morphology of the CCMs were examined using scanning electron microscopy (SEM, VEGA 3). During the imaging process, the secondary electrons were accelerated using a voltage of 20 kV.Mercury intrusion porosimetry (MIP, MicroActive AutoPore V 9600 2.03.00) was utilized to assess the pore size distribution and porosity of the CCMs. The test pressure range was from 0.5 to 32![[thin space (1/6-em)]](https://www.rsc.org/images/entities/char_2009.gif) 990 psia.
990 psia.
2.4 Electrolysis cell test
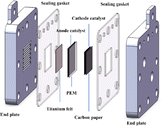
In the electrolysis cell (as shown in Fig. 1), titanium plates equipped with flow fields were utilized as the end-plates. Polytetrafluoroethylene (PTFE) sealing gaskets were employed for the cathode and anode. Deionized water at 80 °C was circulated through the anode.The electrochemical tests were conducted using the Gamry Interface 5000E system.
Polarization curve measurement was taken at different current densities. The current density increased by 10 mA cm−2 from 10 mA cm−2 to 100 mA cm−2, and by 100 mA cm−2 from 100 mA cm−2 to 1800 mA cm−2.
Electrochemical impedance spectroscopy (EIS) was performed on the electrolysis cell at a current density of 0.1 A cm−2. The amplitude of AC voltage disturbance was 10 mV rms. The frequency range spanned from 10![[thin space (1/6-em)]](https://www.rsc.org/images/entities/char_2009.gif) 000 Hz down to 0.2 Hz.
000 Hz down to 0.2 Hz.
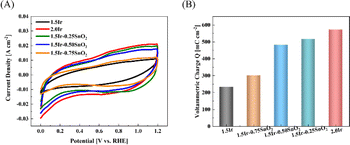
Cyclic voltammetry (CV) was performed on the electrolysis cell at a scanning speed of 50 mV s−1, the voltage range for scanning was set from 0 to 1.2 V.28 The working electrode (green) and working sense electrode (blue) were connected to the anode of the electrolysis cell, while the reference electrode (white) and counter electrode (red) were connected to the cathode.
The number of voltammetric charge in the electrolysis cell was calculated based on eqn (1).28
 | (1) |
2.5 Polarization distribution test and analysis
The whole polarization loss within the electrolysis cell can be calculated using eqn (2).29| E = Erev + ηohm + ηct + ηmt | (2) |
The ohmic polarization (ηohm) can be determined using eqn (3).
| ηohm = j × Rohm | (3) |
The Tafel slope of the electrolysis cell is analyzed based on the polarization curve.29 The charge transfer polarization (ηct) can be calculated using eqn (4)–(6).
 | (4) |
a = −b × log![[thin space (1/6-em)]](https://www.rsc.org/images/entities/char_2009.gif) j0 j0
| (5) |
ηct = a + b × log![[thin space (1/6-em)]](https://www.rsc.org/images/entities/char_2009.gif) j j
| (6) |
After subtracting Erev, ηohm, and ηct from the cell voltage (E), the remaining voltage represents the polarization loss of ηmt as determined by the eqn (2).
3. Results and discussions
3.1 Polarization distribution analysis of the common Ir based CCM
Analyzing the polarization distribution of various parts (ηmt, ηohm and ηct) of common Ir based CCM is beneficial for understanding the problem of low anode noble metal loading at the electrode level, and thus helping us find directions to reduce catalyst loading. The polarization distribution is derived from the Tafel slope and EIS. According to Fig. 2(A), intercept (a) is 0.414 V, Tafel slope (b) is 73.67 mV dec−1, ηct at different current densities can be calculated using eqn (6).29 According to Fig. 2(B), the ohmic resistance (Rohm) is 0.161 Ω cm2. Using eqn (3), ηohm is determined.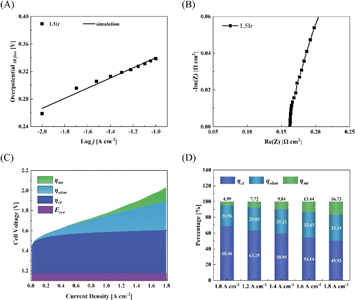 | ||
| Fig. 2 (A) Tafel fitting slope, (B) electrochemical impedance spectroscopy, (C) polarization distribution and (D) polarization ratio, of CCM-1.5Ir in the PEMWE single cell. | ||
Fig. 2(C) and (D) show the polarization distribution of the common Ir based CCM (CCM-1.5Ir) at different current densities. It reveals that, for the common Ir based CCM, as the current density increases, the mass transfer polarization increases rapidly, the ohmic polarization increases linearly, while the charge transfer polarization changes slowly. At 1 A cm−2, the ratio of the mass transfer polarization and ohmic polarization are 4.99% and 26.56%, respectively. When the current density reaches 1.8 A cm−2, the ratio of the mass transfer polarization and ohmic polarization reach 16.73% and 33.34%, respectively. It is believed that with the development of PEMWE, the current density would reach a much higher value than 1.8 A cm−2, which would lead to a much higher ratio of mass transfer polarization and ohmic polarization. Therefore, reducing mass transfer polarization and ohmic polarization are crucial in electrode preparation.
Herein, we propose a simple method, which can synchronously improve the pore structure and electron conductive network of the anode catalyst layer via SnO2 doping, which can effectively reduce the mass transfer polarization, ohmic polarization of the single cell. Interestingly, when the micro-structure of the anode catalyst layer is improved, the charge transfer polarization is also reduced.
3.2 The effect of SnO2 doping in the micro-structure of the catalyst layer
Fig. 3 depicts the SEM surface images of CCMs. Notably, the catalyst layer of CCM-1.5Ir exhibits relatively narrow and thin ridges on its surface, leading to the lowest surface smoothness among the five samples, as illustrated in Fig. 3(A). This reduces the contact area between the catalyst layer and the proton exchange membrane. In Fig. 3(B), with increasing loading (CCM-2.0Ir), the narrow and thin ridges within the catalyst layer become thicker, while the transition between ridges and pores becomes smoother. Consequently, the contact with the proton exchange membrane improves. Furthermore, upon doping with SnO2, compared to CCM-1.5Ir, the contact area increases in CCM-1.5Ir-0.25SnO2 (Fig. 3(C)). However, some of the pores on the surface of the catalyst layer are covered, leading to a decrease in the uniform distribution of the pores. Among the five samples, the morphology of CCM-1.5Ir-0.50SnO2 and CCM-1.5Ir-0.75SnO2 is most similar (Fig. 3(D) and (E)). However, CCM-1.5Ir-0.75SnO2 exhibits excessively high ridges, along with some large pores on its catalyst layer surface. In contrast, the surface pore distribution of CCM-1.5Ir-0.50SnO2 and CCM-2.0Ir is more akin, and the area of the ridges is also more similar among the five samples.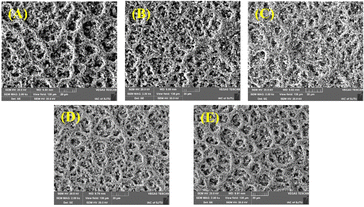 | ||
| Fig. 3 SEM images of (A) CCM-1.5Ir, (B) CCM-2.0Ir, (C) CCM-1.5Ir-0.25SnO2, (D) CCM-1.5Ir-0.50SnO2 and (E) CCM-1.5Ir-0.75SnO2. | ||
Fig. 4(A) shows the effect of SnO2 doping on the porosity of the CCM. It suggests that SnO2 doping could significantly change the porosity and the pore size distributions of the CCM. It is observed, for Ir based CCM, the higher Ir loading of CCM-2.0Ir obtains lower porosity is 8.02%, while the porosity of CCM-1.5Ir is 15.17%. The low porosity of CCM-2.0Ir could result in a reduced specific surface area in the catalyst layer, making it challenging for the active sites to efficiently interact with the reactants, thus hindering the effective participation of certain catalytic active sites in the reaction process. Appropriate content of SnO2 is beneficial to improving of the porosity of the CCM, the porosity of CCM-1.5Ir-0.25SnO2 is 18.34%, and the porosity of CCM-1.5Ir-0.50SnO2 is 18.40%, both higher than CCM-1.5Ir. Higher content of SnO2 may make the original pores blocked, resulting in a higher number of dead pores within the catalyst layer.
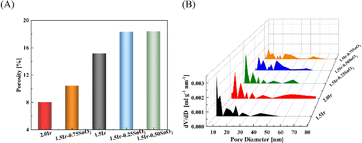 | ||
| Fig. 4 (A) Porosity and (B) pore size distribution measured by MIP of CCM with different anode catalyst layers. | ||
The pore size distributions of the CCMs can also be altered by the SnO2 doping (Fig. 4(B)). For example, the pore size distribution of CCM-1.5Ir is mainly below 25 nm, while the pore size distribution of CCM-1.5Ir-0.50SnO2 is mainly between 10–40 nm.
CCM-1.5Ir-0.50SnO2 and CCM-1.5Ir-0.25SnO2 have similar porosity, with values of 18.40% and 18.34% respectively, but their pore size distributions are different. CCM-1.5Ir-0.50SnO2 has a larger pore size distribution. CCM-1.5Ir-0.50SnO2 and CCM-1.5Ir-0.75SnO2 have similar pore size distributions (10–40 nm), but their porosity values are different. CCM-1.5Ir-0.75SnO2 has a porosity of only 10.44%.
3.3 Electrochemical performance of different CCMs
It can be observed from Fig. 5(A), at 1 A cm−2, the cell voltages of CCM-1.5Ir, CCM-2.0Ir and CCM-1.5Ir-0.50SnO2 are 1.772 V, 1.703 V and 1.706 V respectively. The performance of CCM-1.5Ir-0.50SnO2 surpasses CCM-1.5Ir, and is close to that of CCM-2.0Ir, in spite of lower Ir loading. Fig. 5(B) shows the single cell performance of the CCM with different content of SnO2. The cell voltage of CCM-1.5Ir-0.25SnO2 and CCM-1.5Ir-0.75SnO2 at a current density of 1 A cm−2 is 1.723 V and 1.756 V, respectively, and it was observed that CCM-1.5Ir-0.50SnO2 exhibits the best performance.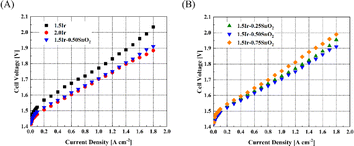 | ||
| Fig. 5 Polarization curves of the PEMWE single cell. (A) Comparison of with and without SnO2 doping, and (B) comparison with different quantities of SnO2 doping. | ||
Fig. 6 and Table 2 show the ohmic resistance of the single cell with different CCMs. The CCM-1.5Ir demonstrates high ohmic resistance, which is 0.161 Ω cm2. As the catalyst loading increases, the ohmic resistance decreases. The CCM-2.0Ir sample exhibits an ohmic resistance of 0.146 Ω cm2. According to the morphological analysis, it can be attributed to the fact that CCM-2.0Ir exhibits a better interface contact. And the electron conductive network within CCM-2.0Ir is expected to be superior to that of CCM-1.5Ir. According to Fig. 6(A), it can be observed that when the catalyst loading is low, the electrolysis cell exhibits a high ohmic resistance. This is because as the catalyst loading increases, the catalyst layer has a flatter surface and better conductive electron network. According to Fig. 6(B), when the same catalyst loading is employed, the ohmic resistance of the single cell decreases after the anode is doped with appropriate proportion of SnO2. Especially, CCM-1.5Ir-0.50SnO2 exhibits the lowest ohmic resistance of 0.145 Ω cm2.
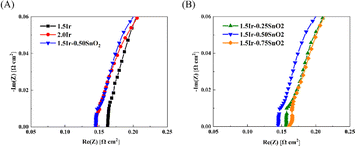 | ||
| Fig. 6 EIS of the PEMWE single cell. (A) Comparison of with and without SnO2 doping, (B) comparison with different content of SnO2 doping. | ||
| CCM | Rohm (Ω cm2) |
|---|---|
| CCM-1.5Ir | 0.161 |
| CCM-2.0Ir | 0.146 |
| CCM-1.5Ir-0.25SnO2 | 0.156 |
| CCM-1.5Ir-0.50SnO2 | 0.145 |
| CCM-1.5Ir-0.75SnO2 | 0.162 |
However, when the SnO2 content is too high, the ohmic resistance of the electrolysis cell does not continue to decrease. CCM-1.5Ir-0.75SnO2 exhibits the highest ohmic resistance of 0.162 Ω cm2, even exceeding CCM-1.5Ir. SnO2 exhibits a relatively high electron mobility (240 cm2 V−1 s−1),30 but as a noble metal, the electron mobility of Ir catalyst is even higher (1370 cm2 V−1 s−1).31 Consequently, excessive doping of SnO2 leads to an increase in the ohmic resistance, such as CCM-1.5Ir-0.75SnO2. However, the lower ohmic resistance of CCM-1.5Ir-0.50SnO2 is attributed to the optimization of its catalyst layer structure through SnO2 doping. Excessive doping of SnO2 leads to the unfavorable changes in the internal structure of the anode catalyst layer. This hinders electron conduction.
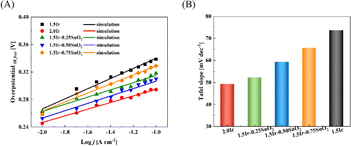
According to Fig. 7(A), the Tafel slopes of different samples can be fitted. The Tafel slope of CCM-1.5Ir, CCM-2.0Ir, CCM-1.5Ir-0.25SnO2, CCM-1.5Ir-0.50SnO2, and CCM-1.5Ir-0.75SnO2 are 73.67 mV dec−1, 49.25 mV dec−1, 52.22 mV dec−1, 59.27 mV dec−1, and 65.68 mV dec−1, respectively. CCM-2.0Ir exhibits the lowest Tafel slope due to its highest anode Ir loading. And intercept of Tafel line for MEA-1.5Ir, MEA-2.0Ir, MEA-1.5Ir-0.25SnO2, MEA-1.5Ir-0.50SnO2, and MEA-1.5Ir-0.75SnO2 are 0.414 V, 0.345 V, 0.367 V, 0.369 V, and 0.395 V, respectively. The Tafel slopes and intercept of CCM-1.5Ir-0.25SnO2, CCM-1.5Ir-0.50SnO2, and CCM-1.5Ir-0.75SnO2 are lower than that of CCM-1.5Ir. When SnO2 is doped, the Tafel slope and intercept decreases. This indicates an improvement in the electrochemical reaction capability of the single cell, which may be related to the voltammetric charge of the electrolysis cell.
The calculation of voltammetric charge originates from Fig. 8(A). As shown in Fig. 8(B), the voltammetric charge of CCM-1.5Ir, CCM-2.0Ir, CCM-1.5Ir-0.25SnO2, CCM-1.5Ir-0.50SnO2, and CCM-1.5Ir-0.75SnO2 is 233 mC cm−2, 573 mC cm−2, 516 mC cm−2, 482 mC cm−2 and 301 mC cm−2, respectively. It is observed that CCM-2.0Ir has the largest voltammetric charge, due to the higher anode Ir loading in CCM-2.0Ir. The voltammetric charge of CCM-1.5Ir-0.25SnO2, CCM-1.5Ir-0.50SnO2, and CCM-1.5Ir-0.75SnO2 are slightly higher than CCM-1.5Ir, despite of the same anode Ir loading. It suggests that the doping of SnO2 is beneficial to improving the voltammetric charge of the anode electrode. When the catalyst is not doped with SnO2, the imperfect micro-structure of the catalyst layer limits the transport of reactants and products. Consequently, some Ir particles are not efficiently functional. Therefore, it has a lower number of voltammetric charge, resulting in a poor electrochemical reaction capability.
Nevertheless, it is observed that the voltammetric charge decreases with increased amount of SnO2 doping. This suggests that excessive SnO2 doping may result in the blockage of some Ir catalyst active sites, thereby negatively impacting the electrochemical performance.
Fig. 9(A) and (B) show the polarization distribution at different current densities of CCM-1.5Ir-0.50SnO2. After doping SnO2 in the anode catalyst layer, the mass transfer polarization, ohmic polarization and charge transfer polarization of the electrolysis cell were reduced compared to the CCM-1.5Ir. The CCM-1.5Ir-0.50SnO2 has the largest porosity (18.40%) and a larger pore size distribution (10–40 nm). Therefore, the decrease in mass transfer polarization from 0.143 V to 0.098 V at 1.8 A cm−2. Especially, with the proportion of mass transfer polarization decreasing from 16.73% to 13.78% at 1.8 A cm−2 is most significant. This indicates that the doping of SnO2 has a positive effect on suppressing mass transfer polarization, since the doping of SnO2 improving the pore structure of the CCM. Due to the flatness of the interface and the improvement of electron conduction pathways in the catalyst layer, it decreased ohmic polarization from 0.291 V to 0.260 V at 1.8 A cm−2. Moreover, its charge transfer polarization has decreased from 0.433 V to 0.384 V at 1.8 A cm−2, due to the structure improved in the catalyst layer. This structure facilitates the access of reactants to the catalytic active sites and the release of products from the catalytic active sites.
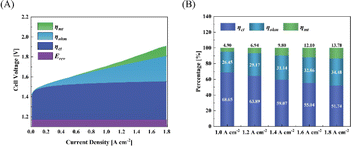 | ||
| Fig. 9 (A) Polarization distribution, (B) polarization ratio under different current densities of CCM-1.5Ir-0.50SnO2. | ||
4. Conclusions
This paper focuses on the electrode level strategy for reducing Ir loading by the optimization of the micro-structure of the catalyst layer via SnO2 doping. It is found, SnO2 doping could effectively change the micro-structure of the anode catalyst layer. Under appropriate conditions, the pore structure and electron conductive network of the anode catalyst layer could be synchronously improved by SnO2 doping, thus reduce the mass transfer polarization and ohmic polarization of the anode catalyst layer. Furthermore, the combination of an improved pore structure and an enhanced electron conduction network collaboratively contributes to the reduction of charge transfer polarization. Consequently, these factors contribute to a decrease in charge transfer polarization. This strategy reveals that CCM-1.5Ir-0.50SnO2 exhibits superior electrochemical performance compared to CCM-1.5Ir, as observed from the polarization curve. Additionally, the performance of CCM-1.5Ir-0.50SnO2 at a loading of only 1.5 mg cm−2 is similar to the CCM-2.0Ir with a loading of 2.0 mg cm−2, which means that SnO2 doping saves about 25% loading of Ir. This paper provides a perspective and understanding at the electrode level to reduce the precious metal loading of the anode in PEMWE.Conflicts of interest
The authors declare no conflict of interest.Acknowledgements
Thanks to Key-area R&D Programme of Guangdong Province, China (2021B0707040001). National Natural Science Foundation of China (Project number: 21406220) for supporting this research.Notes and references
- Z. Kang, J. Mo, G. Yang, S. T. Retterer, D. A. Cullen, T. J. Toops, J. B. Green Jr, M. M. Mench and F.-Y. Zhang, Energy Environ. Sci., 2017, 10, 166–175 RSC.
- Z. Kang, T. Schuler, Y. Chen, M. Wang, F.-Y. Zhang and G. Bender, Electrochim. Acta, 2022, 429, 140942 CrossRef CAS.
- J. O. Majasan, J. I. S. Cho, I. Dedigama, D. Tsaoulidis, P. Shearing and D. J. L. Brett, Int. J. Hydrogen Energy, 2018, 43, 15659–15672 CrossRef CAS.
- R.-T. Liu, Z.-L. Xu, F.-M. Li, F.-Y. Chen, J.-Y. Yu, Y. Yan, Y. Chen and B. Y. Xia, Chem. Soc. Rev., 2023, 52, 5652–5683 RSC.
- Z. Kang, M. Pak and G. Bender, Int. J. Hydrogen Energy, 2021, 46, 15161–15167 CrossRef CAS.
- N. Yoshinaga, Y. Kanai, T. Fukazawa, Y. Nakano and W. Mei, ECS Meeting Abstracts, 2019, vol. MA2019-02, pp. 1712–1712 Search PubMed.
- C. Spori, L. J. Falling, M. Kroschel, C. Brand, A. Bonakdarpour, S. Kuhl, D. Berger, M. Gliech, T. E. Jones, D. P. Wilkinson and P. Strasser, ACS Appl. Mater. Interfaces, 2021, 13, 3748–3761 CrossRef PubMed.
- K. Ayers, N. Danilovic, R. Ouimet, M. Carmo, B. Pivovar and M. Bornstein, Annu. Rev. Chem. Biomol. Eng., 2019, 10, 219–239 CrossRef CAS PubMed.
- T. L. Doan, H. E. Lee, M. Kim, W. C. Cho, H. S. Cho and T. Kim, J. Power Sources, 2022, 533, 231370 CrossRef CAS.
- C. J. Lee, J. Song, K. S. Yoon, Y. Rho, D. M. Yu, K.-H. Oh, J. Y. Lee, T.-H. Kim, Y. T. Hong, H.-J. Kim, S. J. Yoon and S. So, J. Power Sources, 2022, 518, 230772 CrossRef CAS.
- C. Liu, M. Shviro, A. S. Gago, S. F. Zaccarine, G. Bender, P. Gazdzicki, T. Morawietz, I. Biswas, M. Rasinski, A. Everwand, R. Schierholz, J. Pfeilsticker, M. Müller, P. P. Lopes, R.-A. Eichel, B. Pivovar, S. Pylypenko, K. A. Friedrich, W. Lehnert and M. Carmo, Adv. Energy Mater., 2021, 11, 2002926 CrossRef CAS.
- A. S. Pushkarev, I. V. Pushkareva, M. A. Solovyev, M. Prokop, T. Bystron, S. K. Rajagopalan, K. Bouzek and S. A. Grigoriev, Electrochim. Acta, 2021, 399, 139436 CrossRef CAS.
- C. Rozain, E. Mayousse, N. Guillet and P. Millet, Appl. Catal., B, 2016, 182, 153–160 CrossRef CAS.
- M. Bernt, A. Siebel and H. A. Gasteiger, J. Electrochem. Soc., 2018, 165, F305–F314 CrossRef CAS.
- Q. Feng, X. Z. Yuan, G. Liu, B. Wei, Z. Zhang, H. Li and H. Wang, J. Power Sources, 2017, 366, 33–55 CrossRef CAS.
- J. Lopata, Z. Kang, J. Young, G. Bender, J. W. Weidner and S. Shimpalee, J. Electrochem. Soc., 2020, 167(6), 064507 CrossRef CAS.
- Y. Chen, C. Liu, J. Xu, C. Xia, P. Wang, B. Y. Xia, Y. Yan and X. Wang, Small Struct., 2022, 4, 2200130 CrossRef.
- M. Möckl, M. F. Ernst, M. Kornherr, F. Allebrod, M. Bernt, J. Byrknes, C. Eickes, C. Gebauer, A. Moskovtseva and H. A. Gasteiger, J. Electrochem. Soc., 2022, 169, 064505 CrossRef.
- V. K. Puthiyapura, M. Mamlouk, S. Pasupathi, B. G. Pollet and K. Scott, J. Power Sources, 2014, 269, 451–460 CrossRef CAS.
- W. Sun, Z. Wang, X. Tian, H. Deng, J. Liao, C. Ma, J. Yang, X. Gong, W. Huang and C. Ge, Nanoscale, 2021, 13, 13845–13857 RSC.
- J. Shan, C. Guo, Y. Zhu, S. Chen, L. Song, M. Jaroniec, Y. Zheng and S.-Z. Qiao, Chem, 2019, 5, 445–459 CAS.
- C. V. Pham, M. Bühler, J. Knöppel, M. Bierling, D. Seeberger, D. Escalera-López, K. J. J. Mayrhofer, S. Cherevko and S. Thiele, Appl. Catal., B, 2020, 269, 118762 CrossRef CAS.
- H. N. Nong, T. Reier, H.-S. Oh, M. Gliech, P. Paciok, T. H. T. Vu, D. Teschner, M. Heggen, V. Petkov, R. Schlögl, T. Jones and P. Strasser, Nat. Catal., 2018, 1, 841–851 CrossRef CAS.
- F. Hegge, F. Lombeck, E. Cruz Ortiz, L. Bohn, M. von Holst, M. Kroschel, J. Hübner, M. Breitwieser, P. Strasser and S. Vierrath, ACS Appl. Energy Mater., 2020, 3, 8276–8284 CrossRef CAS.
- S. Dong, C. Zhang, Z. Yue, F. Zhang, H. Zhao, Q. Cheng, G. Wang, J. Xu, C. Chen, Z. Zou, Z. Dou and H. Yang, Nano Lett., 2022, 22, 9434–9440 CrossRef CAS PubMed.
- Z.-X. Lu, Y. Shi, P. Gupta, X.-p. Min, H.-y. Tan, Z.-D. Wang, C.-q. Guo, Z.-q. Zou, H. Yang, S. Mukerjee and C.-F. Yan, Electrochim. Acta, 2020, 348, 136302 CrossRef CAS.
- H. Lv, G. Zhang, C. Hao, C. Mi, W. Zhou, D. Yang, B. Li and C. Zhang, RSC Adv., 2017, 7, 40427–40436 RSC.
- G. Jiang, H. Yu, J. Hao, J. Chi, Z. Fan, D. Yao, B. Qin and Z. Shao, J. Energy Chem., 2019, 39, 23–28 CrossRef.
- H. Lv, S. Wang, Y. Sun, J. Chen, W. Zhou and C. Zhang, J. Power Sources, 2023, 564, 232878 CrossRef CAS.
- Y. Zhao, L. Gao, Q. Wang, Q. Zhang, X. Yang, J. Zhu, H. Huang, J. Duan and Q. Tang, Carbon Energy, 2024, e468 CrossRef.
- M. A. Basyooni, M. Tihtih, I. Boukhoubza, J. E. F. M. Ibrahim, R. En-nadir, A. M. Abdelbar, K. Rahmani, S. E. Zaki, Ş. Ateş and Y. R. Eker, Phys. Status Solidi RRL, 2023, 18, 2300257 CrossRef.
| This journal is © The Royal Society of Chemistry 2024 |

