
 Open Access Article
 This Open Access Article is licensed under a Creative Commons Attribution-Non Commercial 3.0 Unported Licence
Influence of potassium doping on the structural, conduction mechanism, and dielectric properties of CaFe2O4
Mohamed Mounir Bouzayani a,
Manel Ben Abdessalem*a,
Ibtihel Soudania,
Abderrazek Oueslatib and
Abdelhedi Aydia
a,
Manel Ben Abdessalem*a,
Ibtihel Soudania,
Abderrazek Oueslatib and
Abdelhedi Aydia
aLaboratory of Multifunctional Materials and Applications (LaMMA), LR16ES18, Faculty of Sciences, University of Sfax, B. P. 1171, 3000 Sfax, Tunisia. E-mail: medmounirbz16@gmail.com
bLaboratory of Spectroscopic Characterization and Optical Materials (laSCOM), Faculty of Sciences, University of Sfax, B. P. 1171, 3000 Sfax, Tunisia
First published on 17th April 2024
Abstract
The frequency and temperature-related dielectric relaxation and electrical conduction mechanisms in potassium-doped CaFe2O4 oxide ceramic were investigated in this study throughout a temperature range of 313–673 K. The synthesis of the KCaFe2O4 compound was accomplished through a solid-state reaction route. The X-ray diffraction pattern at room temperature confirmed that the ceramic KCaFe2O4 crystallizes in the orthorhombic system with the Pbnm space group. The EDX analysis proved the absence of external elements. The surface morphology of the samples was examined using scanning electron microscopy. The conduction mechanism, validated as CBH conduction, was examined using the temperature-dependent variation of Jonscher's power law exponent. Using Nyquist plots, we have effectively constructed a relevant equivalent circuit that encompasses the influences originating from both the grains and the grain boundaries. Furthermore, in KCaFe2O4, the induced dielectric relaxation from the non-Debye to Debye type model is demonstrated by the thermal analysis of M′′ (ω) and −Z′′ (ω) as a function of frequency.
1. Introduction
Since the publication of its crystal structure, extensive research has been dedicated to calcium ferrite (CaFe2O4 or CFO) due to its captivating structural, electrical, magnetic, and chemical properties.1 Its multifaceted applications include its incorporation into electronic devices,2 its role as a catalyst in diverse reactions,3,4 its function as a photocathode facilitating the hydrogen evolution reaction in water splitting,5,6 its use as a ceramic pigment and coating,7 and its application as electrodes in solid oxide fuel cells.8 The unique crystal structure of CFO differs from the majority of recognized ferrites.Unlike the typical cubic spinel shape found in many ferrites, CFO exhibits a unit cell deviation, leading to an orthorhombic crystal structure. This difference is attributed to the ionic radius of Ca2+ (Ca2+ = 1.35 Å), which is larger than that of Fe3+ (Fe3+ = 0.645 Å).This difference prevents it from incorporating into the tetrahedral sites of a cubic oxygen lattice at the central characteristic faces of a spinel.9 The characteristics of the lattice can be tailored to meet specific needs by introducing divalent and trivalent metal ions. By substituting atoms in the A and B sites, the cationic distribution of ferrites undergoes modification. Transition metal cations, including Zn10 and Ti,11 can be integrated across a wide range of applications.
Owing to its distinctive structure, CFO serves as a prototype for other crystals. Bulk CFO has been employed as anode electrodes in Li-ion batteries,12 pigments,13 and photocathode materials.14 Intensive investigation has been carried out regarding bulk CFO structure, thermodynamic properties, and magnetic characteristics.15 Electronic structure simulations were performed to gain insights into its optical properties.16 Mössbauer spectra and neutron diffraction profiles of CFO indicate the antiferromagnetic ordering of Fe atoms in two octahedral sites, Fe1 and Fe2, occurring below the Néel temperature of 180 K.17
Consequently, the CFO readily adopts an off-spinel structure during formation and crystallization. Hence, exploring the dielectric properties of CFO becomes intriguing, offering insights into its suitability for diverse applications.18,19
Potassium ions (K+) were introduced into the base structure of ferrite owing to their high reactivity and distinctive physicochemical characteristics, facilitating their seamless integration. Alkaline metals are very reactive, releasing a single electron on the last layer to other metals in the ferrite composition.20 Incorporating metal cations into the ferrite structure can notably enhance the conduction mechanism, optical characteristics, or magnetic properties of semiconductors.21–23
In the current investigation, the focus was on exploring the characteristics of K-doped CaFe2O4 (KCaFe2O4) mixed ferrite. On the octahedral B site, K+ (r (k+) = 1.60 Å) has a significantly higher ionic radius compared with that of Ca2+ (r (Ca2+) = 1.35 Å).24 The substitution of the K+ ion in place of the Ca2+ ion can lead to alterations in the geometry of the crystals, thus influencing the dielectric properties of these materials, which are due to the difference in the ionic radii. Recently, several research teams have made significant efforts in the synthesis and characterization of various ferrite materials CaFe2O4,25,26 Ni0.6Zn0.4Al0.5Fe1.5O4,27 LiMnFe2O4 (ref. 28 and 29) and KxMg1−xFe2O4.30 Despite the extensive research conducted on calcium ferrites, there is a notable lack of attention to the impact of potassium doping on the properties of these materials.
As part of this effort, we synthesized KCaFe2O4 (KCFO) ferrite samples using the solid-state method and investigated their structural and dielectric characteristics. The structural analysis was performed under (RT) conditions, while the investigation into the dielectric properties involved employing impedance spectroscopy at different frequencies and temperatures. To maintain brevity, the synthesized KCFO sample is consistently denoted as KCFO throughout this manuscript.
2. Material and method
We used a conventional solid-state reaction to synthesize the KCFO compound. K2CO3 (Sigma-Aldrich, 99%), CaCO3 (Sigma-Aldrich, 99%), and Fe2O3 (Sigma-Aldrich, 99%) were mixed in proportional ratios. The obtained powder was submitted to a first thermal treatment at 700 K for 10 hours (h) to release the CO2 gas. Then, we verified the gas emissions by checking the weight. Finally, the sintering process was at 950 K for 6 h.The purity of the sample was determined by X-ray diffraction on powder by “D8 ADVANCE, Bruker” at room temperature (RT) with Cu Kα (λ = 1.5406 Å) radiation in the angle range of 5° < 2θ < 80° and a speed of scan of 20 min−1 counting time for each 0.02° in step.
Furthermore, the morphological characterization was performed using a scanning electron microscope (SEM) (Bruker Nano GmbH Berlin, Germany), to estimate the particle sizes.
Additionally, Raman spectra were obtained at RT, in the range of 100–1100 cm−1, using a SENTERRA spectrometer (Bruker), with excitation at 540 nm. FTIR spectra were acquired using a Bruker Tensor 27 spectrophotometer.
Electric measurements were conducted on a pellet measuring 8 mm in diameter and 1 mm in thickness. Complex impedance spectroscopy was employed using the “Solartron 1260” over a frequency range of 10–106 Hz at different temperatures. The pellets, featuring a thin layer of silver coating on opposite surfaces, were placed between two copper electrodes in a specially designed holder to ensure optimal contact.
3. Results and discussion
3.1. Structural and morphological studies
X-ray diffraction (XRD) is applicable for assessing the purity of a synthesized substance. Fig. 1 shows the XRD pattern of KCFO. Lattice parameters were determined using a global profile-matching method with Fullprof software.31 This indicates that the KCFO sample crystallizes in an orthorhombic system with a Pbnm space group.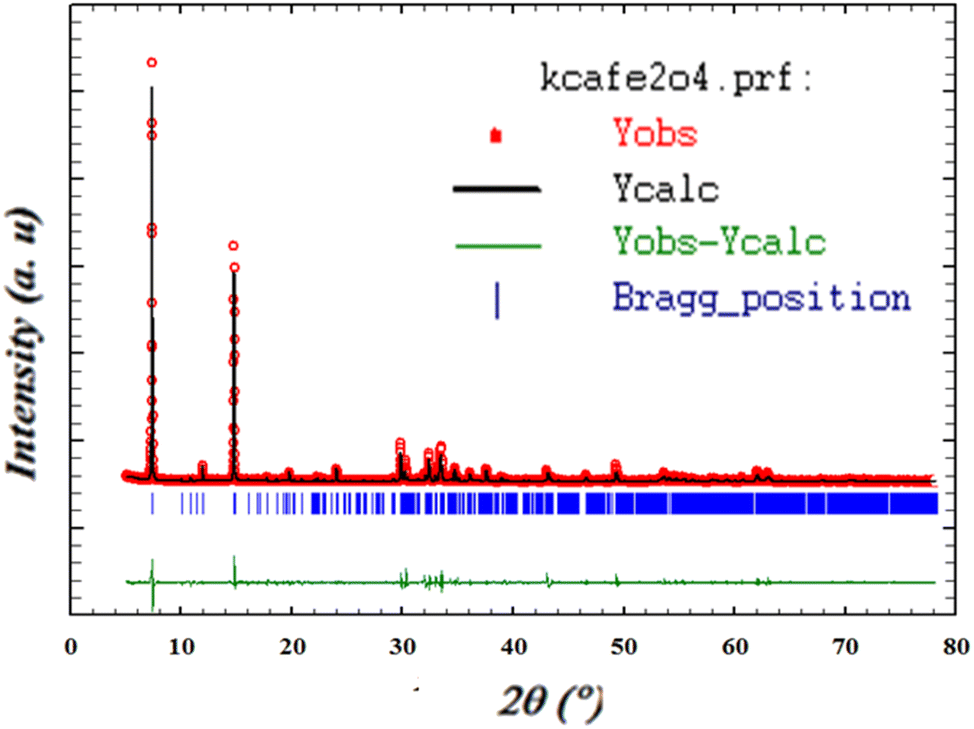 | ||
| Fig. 1 The Rietveld refinement XRD of synthesized of KCFO at room temperature. | ||
The unit cell parameters are gathered in Table 1. These values are higher than those given in the literature, which is attributed to the larger K+ ionic radius compared to Ca2+.32–34
| Compounds | KCa0.5Fe2O4 (room temperature) |
|---|---|
| System | Orthorhombic |
| Space group | Pbnm |
![[thin space (1/6-em)]](https://www.rsc.org/images/entities/char_2009.gif) |
|
| Lattice parameters | |
| a | 17.609 Å |
| b | 16.287 Å |
| c | 5.499 Å |
| α = β = γ | 90° |
| Z | 4 |
|
|
| Reliability factors | |
| RP/RwP/Rexp | 35.8%/36.9%/19.89% |
| χ2 | 3.44 |
The average size of crystallites (DSC = 140.07 nm) is calculated through the classical Debye–Scherrer equation,28 employing the full width at half maximum.
|
βcosθDsc = kλ
| (1) |
3.2. SEM and EDX analysis
To evaluate the sample morphology and particle size, a scanning electron microscope (SEM) is used. The SEM image of the examined material is summarized in Fig. 2(a). The micrograph shows the aggregation of the main particles and a Lorentzian fit using the image analyzer software Image J, which predicts an average particle size of 3.60 μm (Fig. 2(b)).This indicates that the grains possess a polycrystalline structure, as evidenced by the relatively small crystallite size determined from the XRD analysis.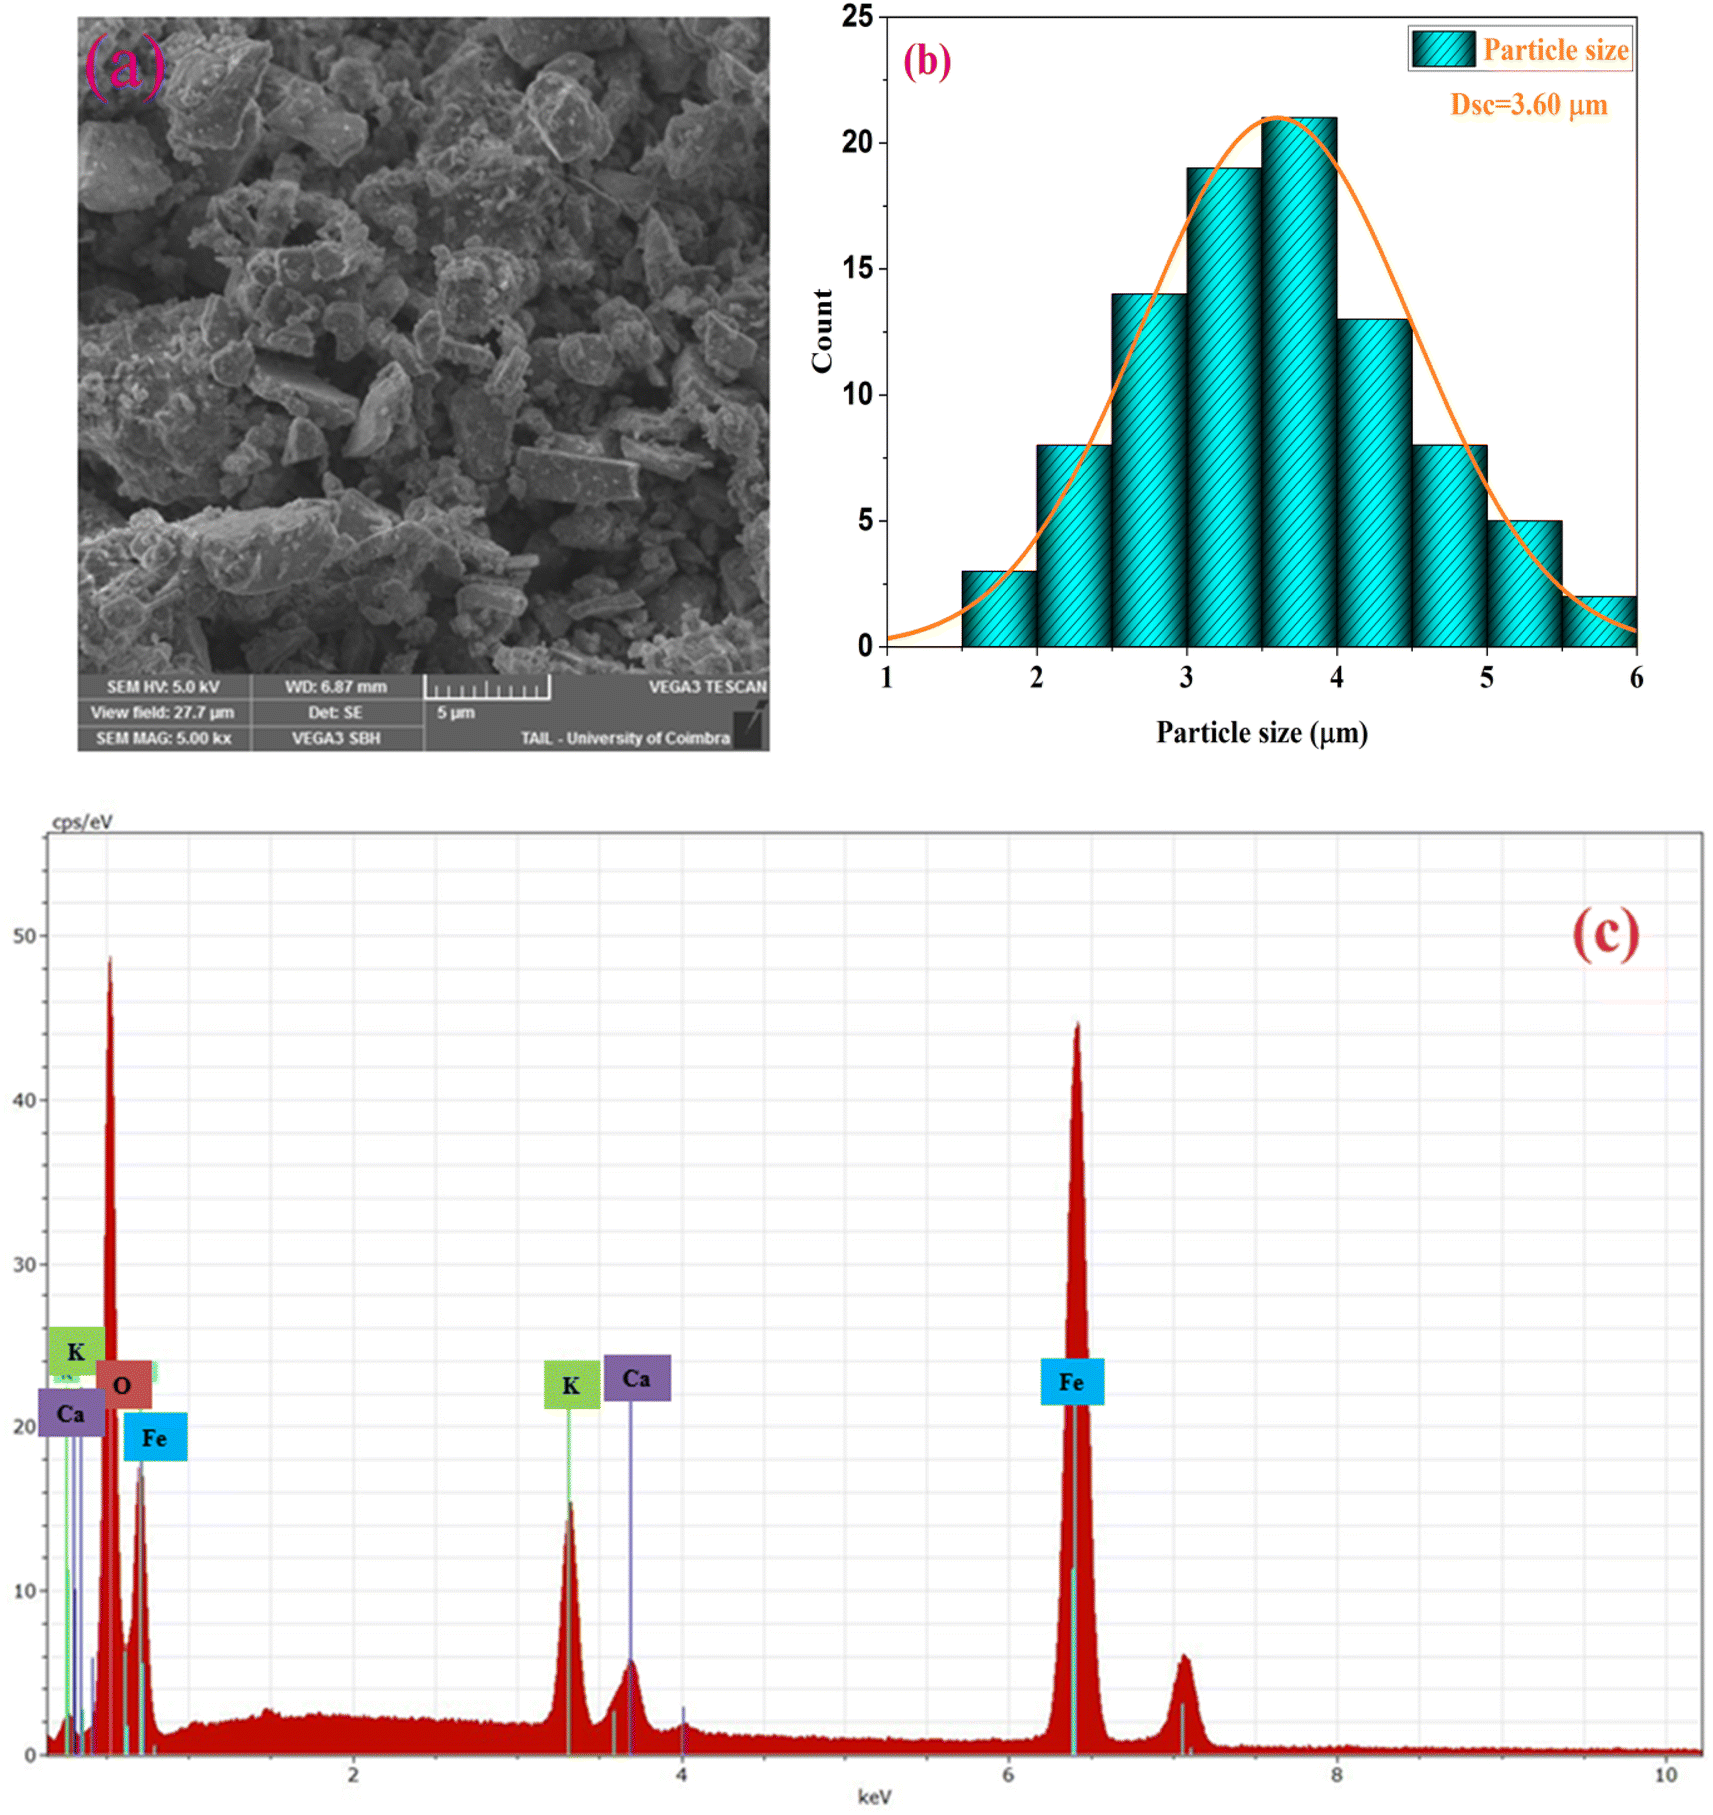 | ||
| Fig. 2 (a) scanning electron microscopy images, (b) distribution histogram of grains and (c) EDX spectrum of the compound KCFO. | ||
The chemical properties of the synthesized compound were examined by energy-dispersive X-ray spectroscopy (EDX). The elemental analysis of the KCFO sample at RT using EDX is shown in Fig. 2(c), and the spectra support the existence of all the constituent elements of KCFO, such as K, Ca, Fe, and O. This provides proof that no embedded parts have been lost or contaminated.
3.3. Raman and infrared spectroscopy analysis
The FTIR spectroscopy technique is useful for determining chemical absorption. The ferrite spinel's metal oxygen is assigned to two broad bands in the spectrum (Fig. 3). The highest v1 band in the range 800–600 cm−1 corresponds to tetrahedral metal stretching vibrations (Td), while the lowest two bands in the range 550–400 cm−1 are assigned to the octahedral stretching of the metal (Oh).35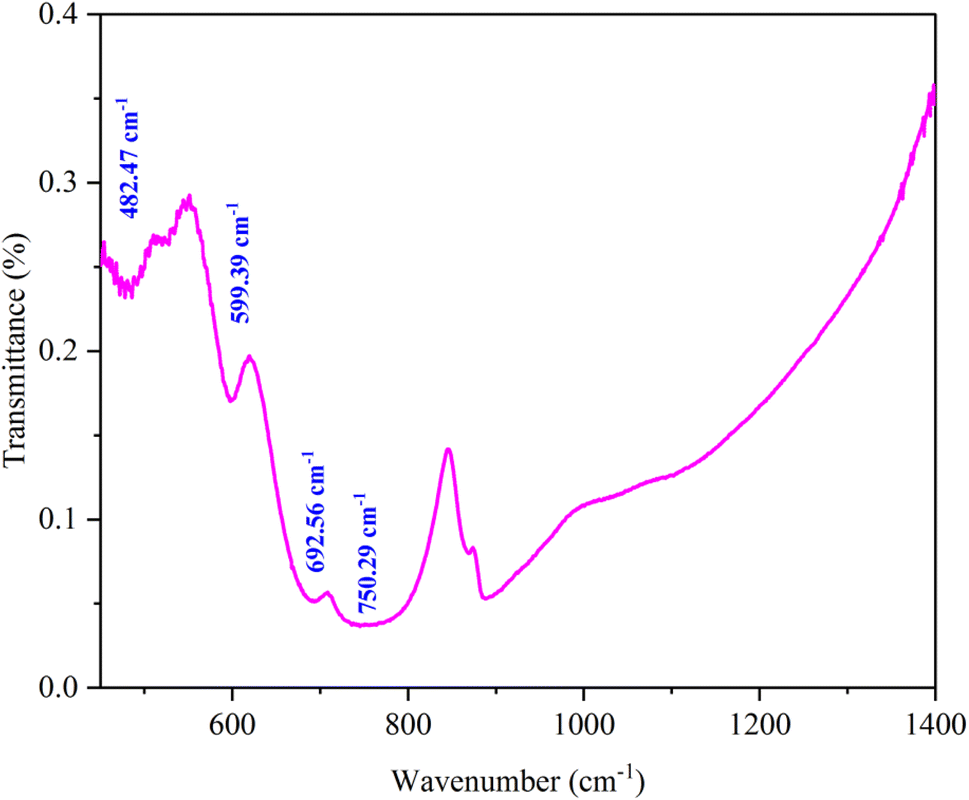 | ||
| Fig. 3 FTIR spectrum of KCFO. | ||
Fig. 4 shows the Raman spectra of KCFO ceramic measured at RT. Deconvolution of the raman spectrum of KCFO using LabSpec5 software using the pseudo-Voigt function shows the presence of twelve vibration modes. These modes were observed at 116.8, 158.7, 178.0, 279.9, 329.0, 370.2, 472.5, 499.7, 528.9, 609.6, 675.4, and 721.8 cm−1. Using irreducible representations, the Raman active modes in the orthorhombic phase with the Pbnm space group can be written as follows:Γ = 3Ag + 3B1g + 3B2g + 3B3g.36
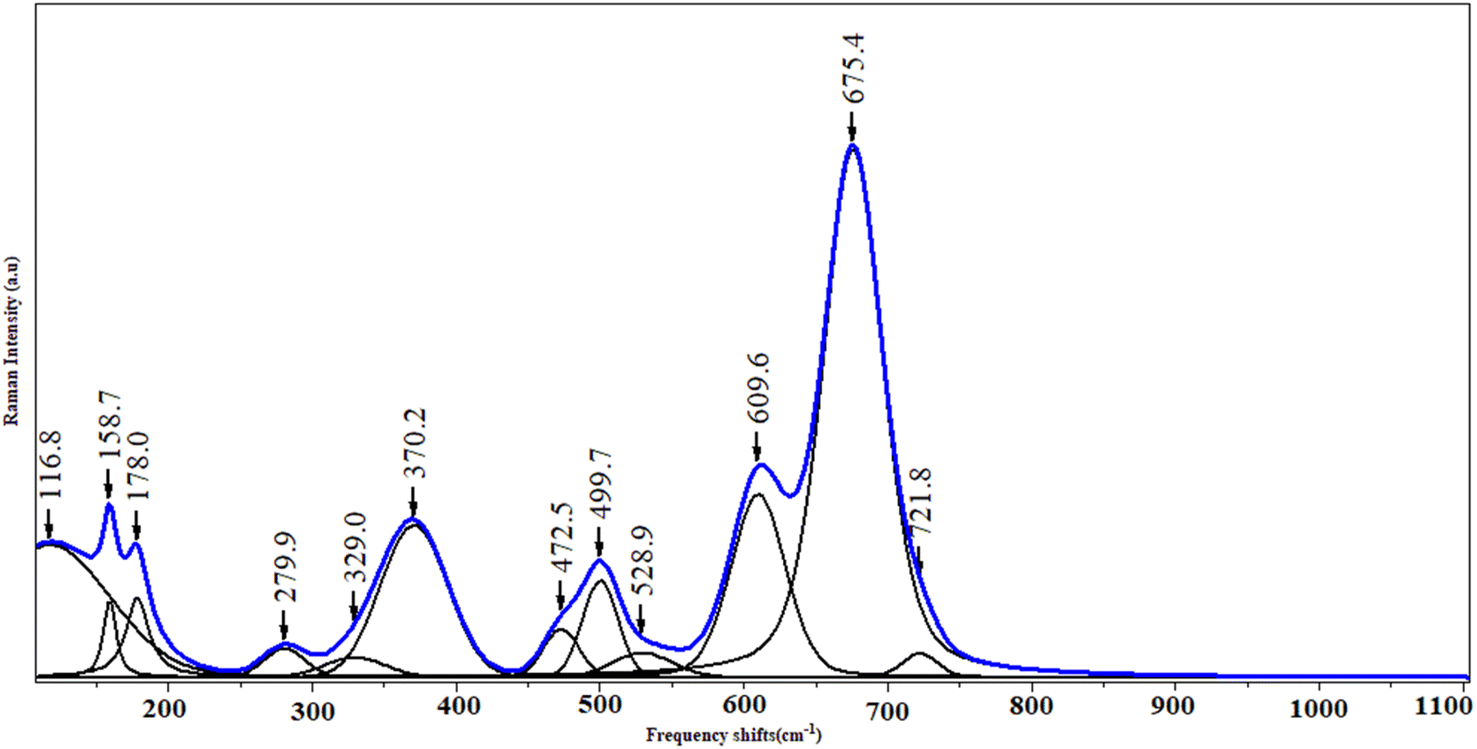 | ||
| Fig. 4 Raman spectra of the KCFO ceramic at room temperature. | ||
The peaks at 116.8, 158.7, 178.0, 279.9, and 472.5 cm−1 were attributed to the Fe–O–Ca bonds; which correspond to the Ag, B2g, Ag, Ag, and B2g optical modes, respectively. Hence, oxygen octahedral modes were between 329 and 370.2 cm−1, oxygen octahedral bending vibration (B. V.) ranged between 472.5 and 499.7 (B2g) cm−1, and oxygen stretching vibrations were above 528.9 cm−1 (S. V.).37 Raman peaks at 499.7, 528.9, 609.6, 675.4, and 721.8 cm−1 may be due to the stretching and bending of O–Fe–O.38
4. Impedance spectroscopy
4.1. Dielectric measurements
The dielectric permittivity offers crucial insights into the characteristics of the material being produced. It signifies the material's capacity to polarize when subjected to an applied electric field.39 The dielectric response of any material is given by the complex dielectric constant:
 | (2) |
ε′ denotes the real component of the dielectric permittivity, reflecting the stored energy, while ε′′ represents the imaginary component, which characterizes the dissipation energy within the material. C0 denotes the vacuum capacitance and ω is the angular frequency (ω =2πf).
Furthermore, the dielectric loss factor is defined as the ratio of the imaginary part (ε′′) and real part (ε′) of the complex permittivity (ε*)
 | (3) |
The investigation involves analyzing the variation of ε′ (ω) and tanδ with frequency across the temperature range of 313–673 K.
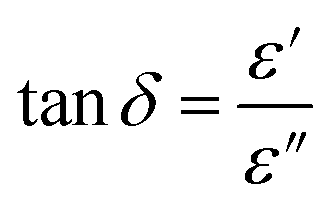
In Fig. 5(a), the frequency-dependent ε′ values are depicted across various temperatures.
 | ||
| Fig. 5 (a) Dielectric constants (ε′) of KCFO nanoparticles pellet at different Temperature. (b) Frequency-dependent dielectric loss of KCFO ceramic measured at various temperatures. | ||
The generated materials showed higher ε′ values at low frequencies, suggesting that they could be viable options for low-frequency energy storage.40 Similarly, the ε′ values fall as the frequency rises, which leads to a decrease in energy storage capacity.41 Furthermore, the dielectric constant values rise as the temperature increases at a certain frequency. The thermal activation of charge carriers, which affects polarization, is specified by this nature. Ionic, electronic, orientational, and interfacial polarization are the four primary categories. The relaxation components of polarizability in the system involve orientation and interfacial polarizations, while the resonance components encompass ionic and electronic polarizations.42
Conversely, it was imperative to explore the materials intended for optoelectronic applications concerning the “dissipation factor,” illustrated as tan(δ) in Fig. 5(b). Here, δ is defined mathematically as the angle between the voltage and charging current, commonly referred to as the “loss angle”.43 The primary cause of dielectric loss stems from various physical phenomena, including the conduction process, dielectric relaxation, molecular dipole moment, and interfacial polarization.44 At lower frequencies, additional energy is needed to induce the movement of charge carriers. Consequently, tan(δ) values tend to be higher within this frequency range.45 As the frequency increases, the resistivity of the material decreases, resulting in a more efficient movement of charge carriers that necessitates less energy. As a result, the dielectric loss diminishes in the high-frequency range. This presents opportunities for exploring these materials for potential applications in electrical devices.46
It also indicates that increased temperatures and reduced frequencies lead to greater dielectric loss, clearly indicating a rise in the material's conductivity.47
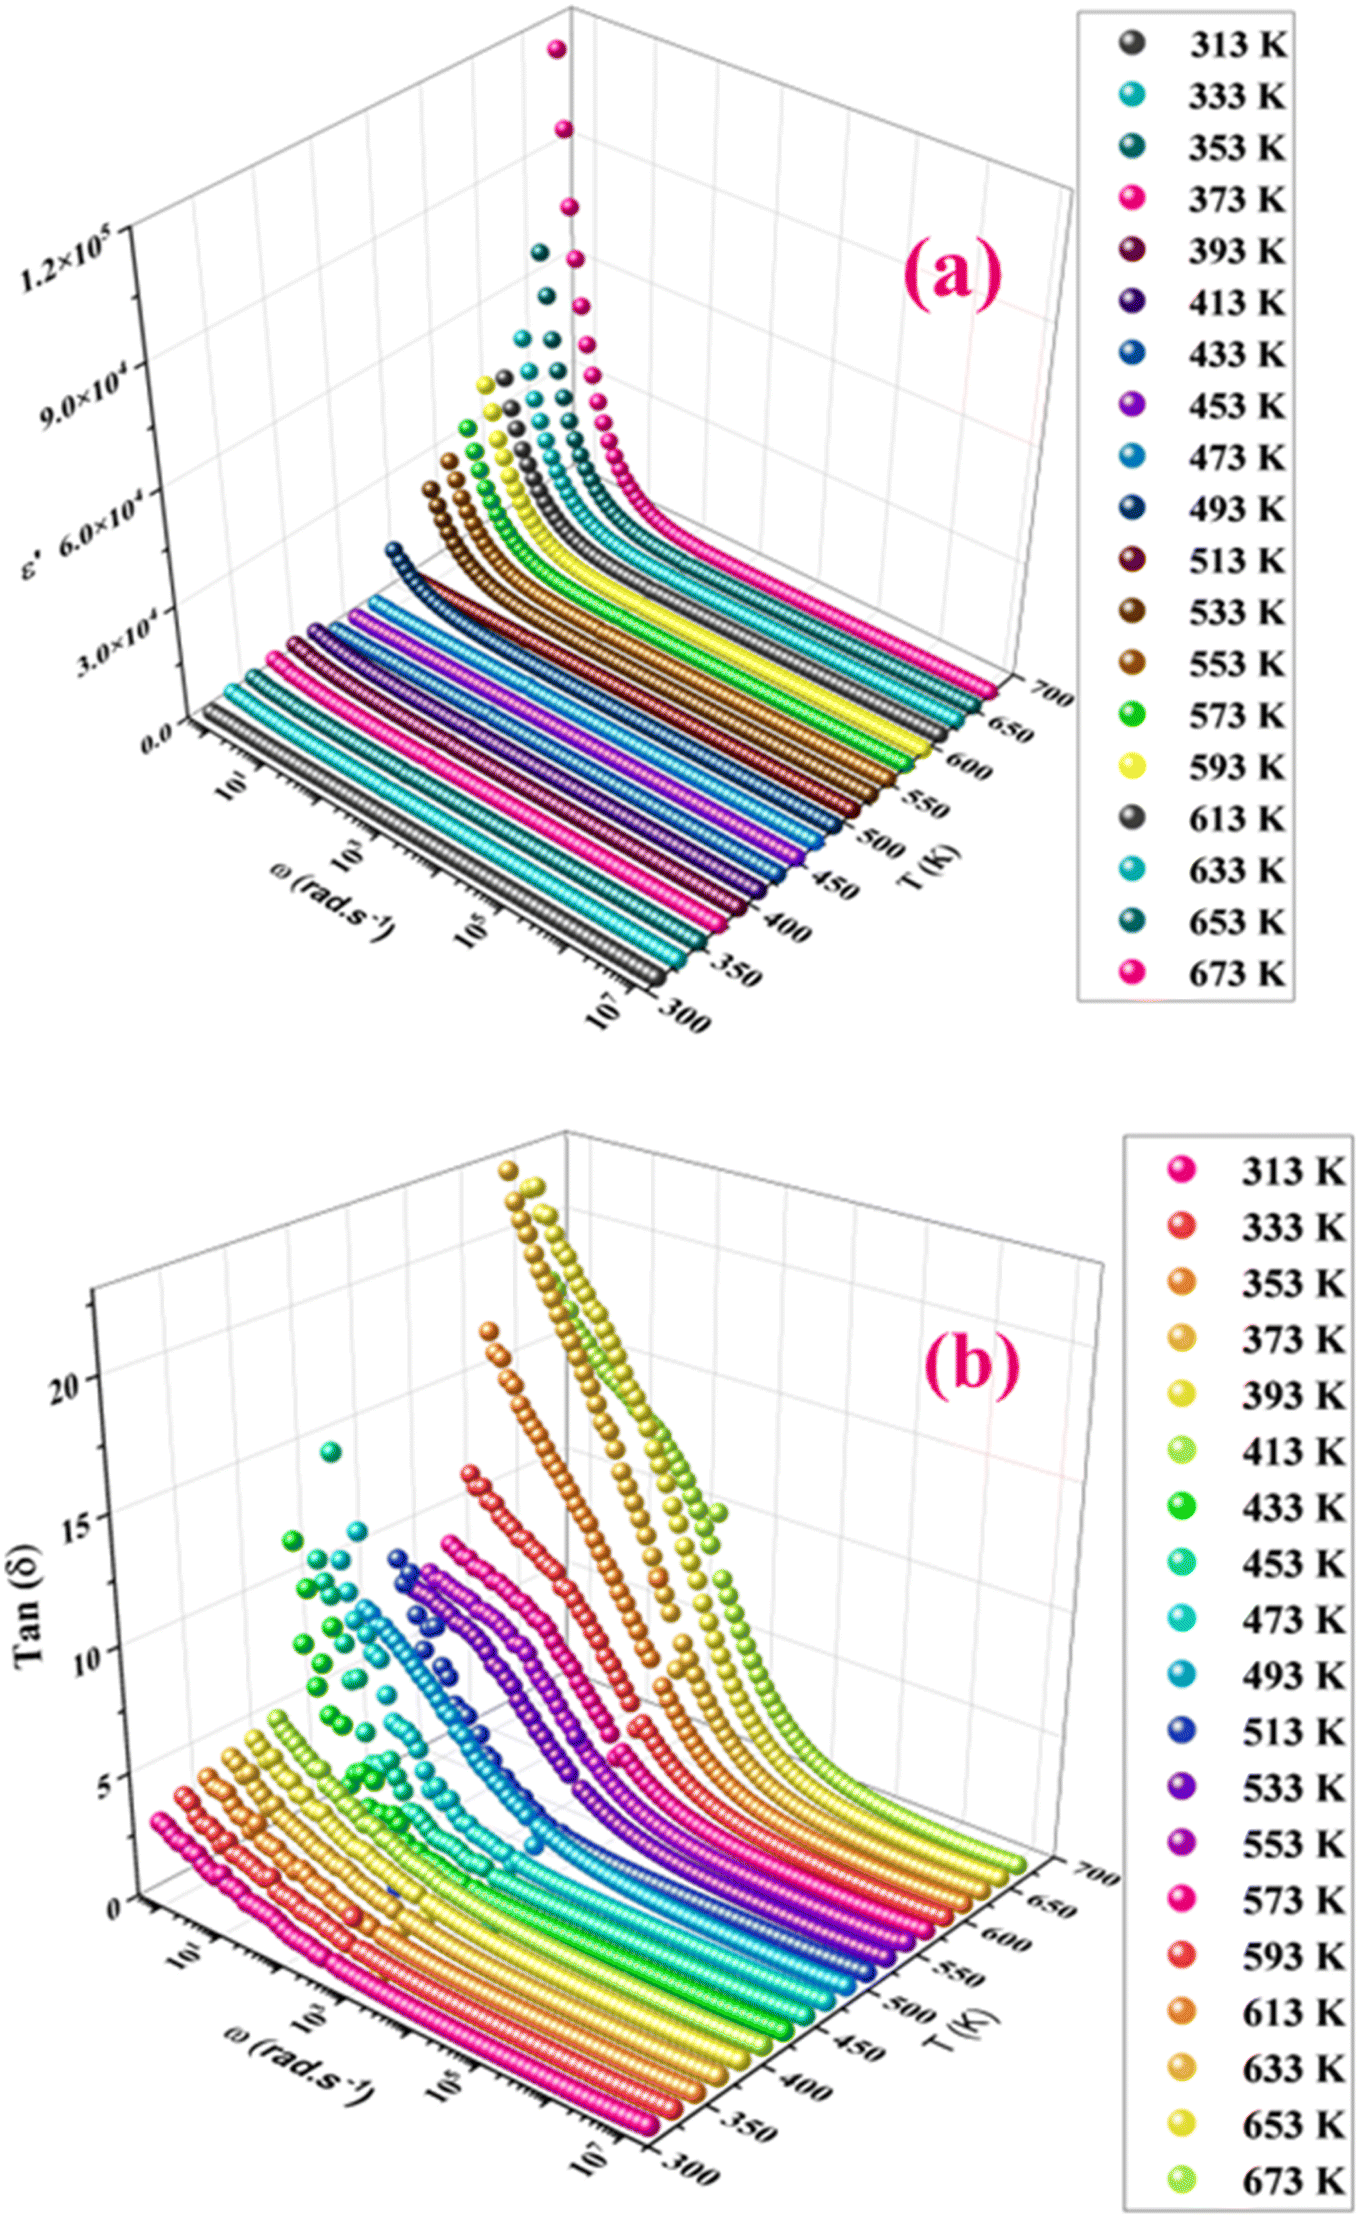
Fig. 6(a) illustrates the temperature dependency of the real component (ε′) of the complex electric permittivity across various frequencies. The ε′ shows a significant dielectric peak of about 413 K, which can be the Ferro-Paraelectric (FP) type phase transition. Since KCFO has been identified as a ferroelectric material in prior studies, this prompts the necessity to investigate whether it exhibits classic ferroelectric behavior or relaxor characteristics. Fig. 6(a) shows that the FP transition temperature (TC = 413 K) is frequency independent, which proves that KCFO is a classic ferroelectric.48,49
 | ||
Fig. 6 (a) Shows the temperature dependence of the real ε′ parts vs. temperature at selected frequencies. (b) The inverse of dielectric constant ( ) as a function of temperature of the compound KCFO. ) as a function of temperature of the compound KCFO. | ||
Fig. 6(b) depicts the plot of Curie–Weiss ( ) as a function of temperature at a constant frequency of 500 Hz. The plot exhibits a straight line just above the temperature of the phase transition.
To further study the phase transition behavior of the KCFO sample, we estimated the diffusion parameter using an empirical formula developed by Uchino et al.:50,51
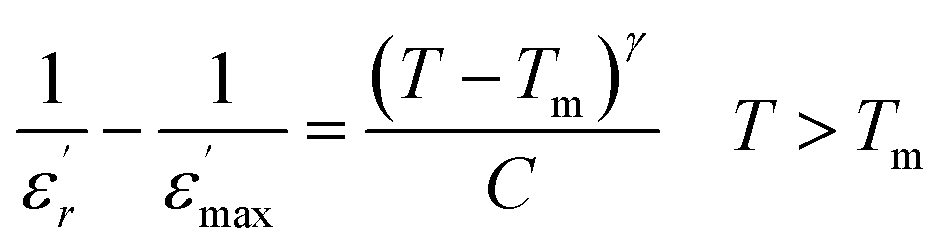 | (4) |
 is the dielectric constant C is the Curie constant and γ is the degree of diffuseness.
In general, the value of γ between these limits (1 < γ < 2) provide an incomplete diffuse phase transition. According Uchino et al., for a classical transition γ approximate to 1, while an ideal relaxor ferroelectric ones approximate to 2.52 In our study, the γ values determined for different frequencies were found to be close to unity. Consequently, we can infer that the KCFO compound exhibits classical ferroelectric behavior.
4.2. AC conductivity
In Fig. 7(a), we observe the changes in AC conductivity with respect to frequency over a temperature range spanning from 313 K to 673 K. The DC conductivity is ascribed to the conductivity measured in the low-frequency region, which remains largely unaffected by changes in frequency. At high frequencies, however, the conductivity exhibits a frequency dispersion that is mostly due to AC conductivity. At low frequencies, activated hopping causes random diffusion of charge carriers, resulting in dc conductivity (σdc). Ions exhibit a coordinated back-and-forth motion in the frequency dispersive region. The jump relaxation model suggested by Funke and Hoppe52 can explain this frequency-independent DC and frequency-dependent alternating conductivity. At low frequencies, conductivity primarily arises from successful hops, facilitating long-distance ionic translational motion. The ratio of successful hopping to failed hopping governs the dispersion observed in the conductivity spectra. In the high-frequency regime, there are more failed hops, leading to increased dispersion.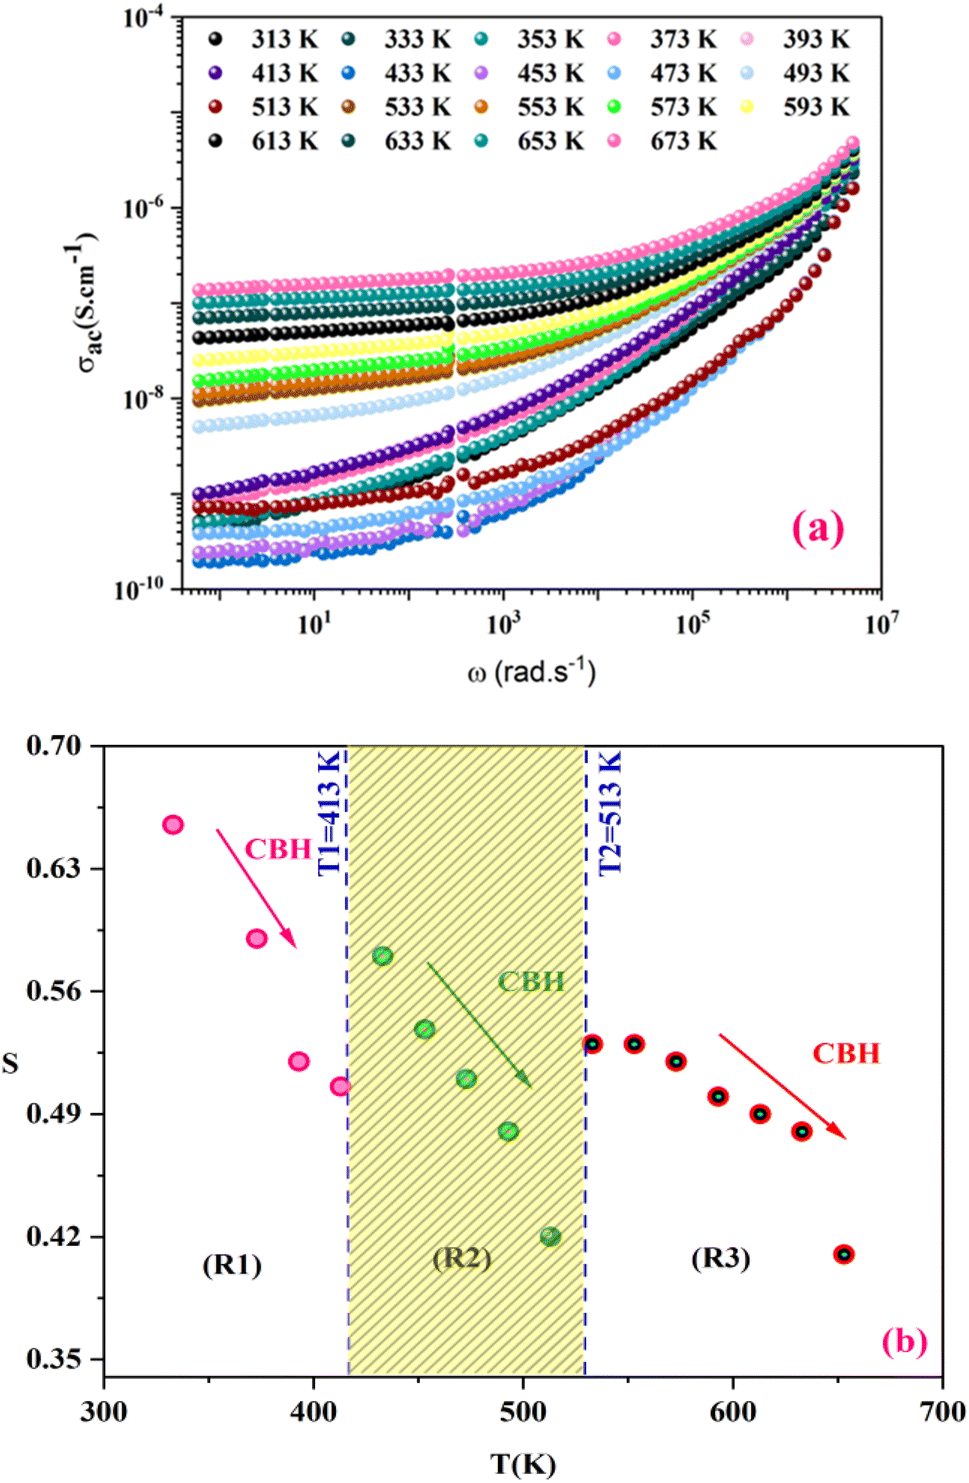 | ||
| Fig. 7 (a) Frequency dependency of conductivity, (b) temperature dependence of the exponent “s” of KCFO sample prepared with the solid–states method. | ||
The AC conductivity curve is fitted using the Jonscher power law:53,54
| σac(ω) = σdc + σ(ω) = σdc + Aωs | (5) |
σdc is determined from fitting the Jonscher power law across all temperatures and is observed to adhere to the Arrhenius relationship:
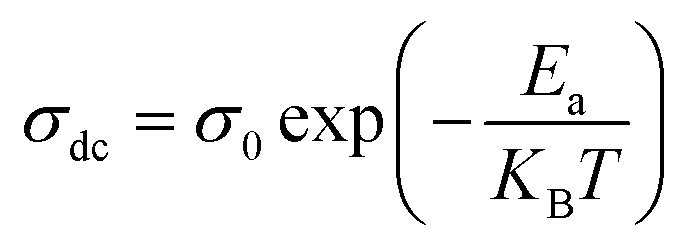 | (6) |
To determine the activation energy of the conduction process, we plot σdc versus 1000/T, as depicted in Fig. 8(a). By performing straight-line fits, we obtain three activation energies corresponding to 0.12, 0.32, and 0.68 eV, which fall within the typical range of values characteristic of semiconductors.60
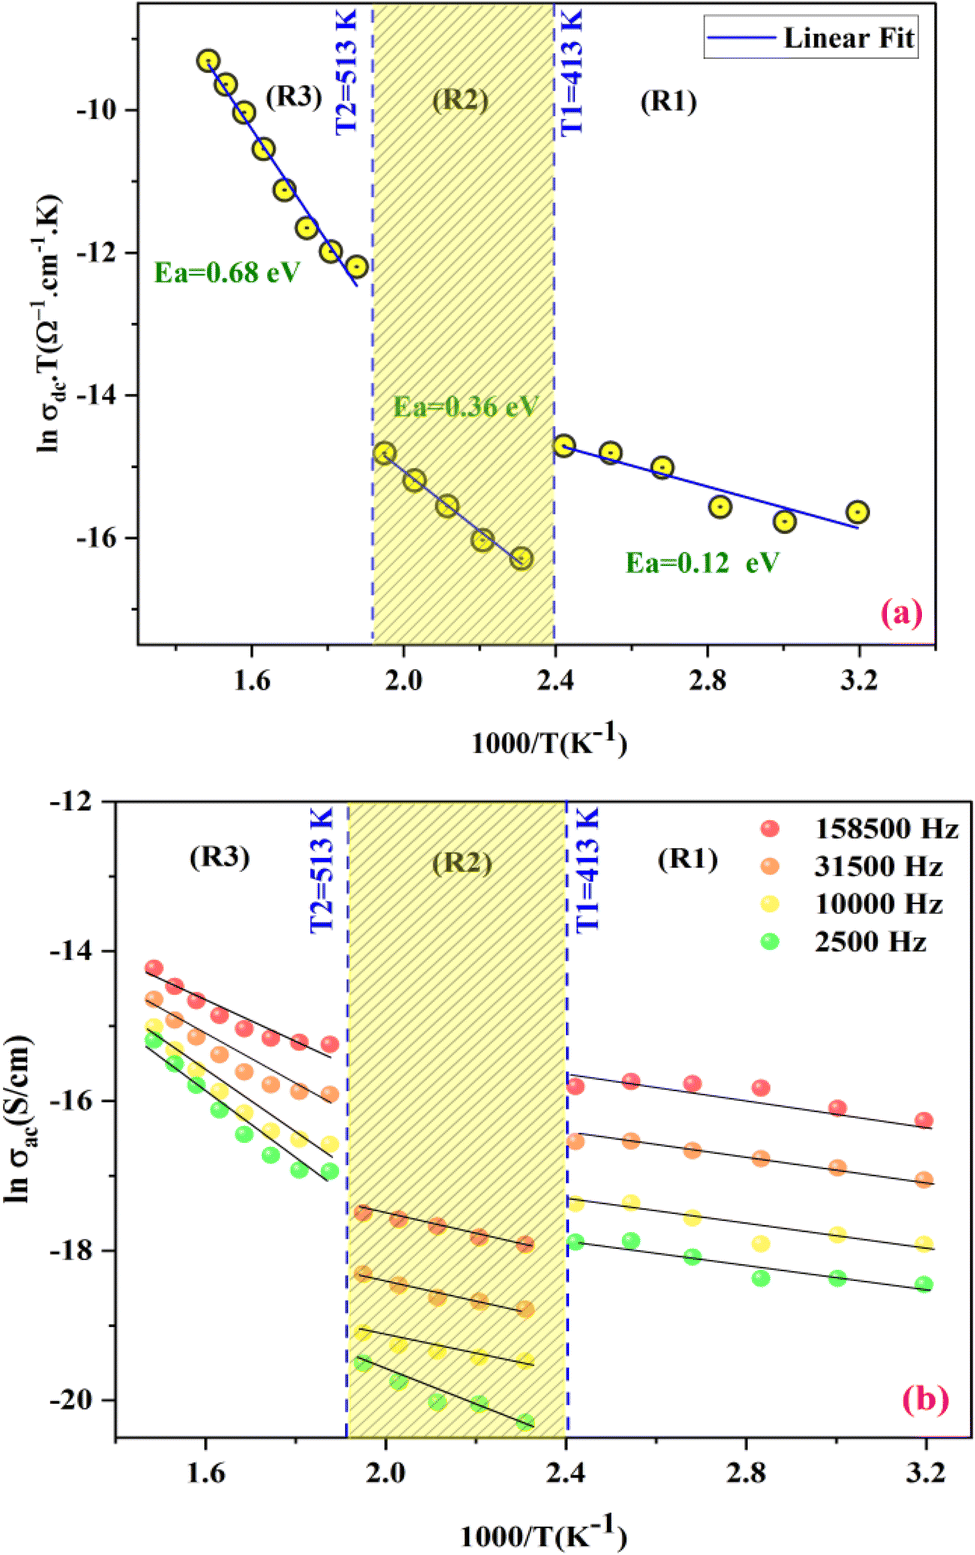 | ||
| Fig. 8 (a) Arrhenius fits of σdc (b) evolution of ln (σacT) as a function of (1000/T). | ||
Fig. 8(b) depicts the temperature dependency of AC conductivity at various frequencies. As the temperature inversion increases for each constant frequency, ln(σac) decreases, displaying three linear straight lines with distinct inclinations (regions 1, 2, and 3).
The activation energies extracted from the data fit in the figure are compiled in Table 2. The trend clearly shows that Ea decreases as the frequencies increase across different temperature ranges. This phenomenon can be attributed to the rise in the applied field frequency, which amplifies the electronic transition between localized states.61 In essence, we can assert that the mobility of charge carriers within the compound is facilitated by the hopping conduction mechanism.62
| Frequency (Hz) | 2500 | 10000 |
31500 |
158500 |
|
|---|---|---|---|---|---|
| Ea (meV) | Region (I) | 71 meV | 66 meV | 58 meV | 51 meV |
| Region (II) | 175 meV | 108 meV | 105 meV | 101 meV | |
| Region (III) | 461 meV | 350 meV | 283 meV | 224 mev | |
4.3. Impedance analysis
Fig. 9(a–c) display the impedance plot (−Z′′ vs. Z′) at different temperatures in the temperature ranges 313–413 K, 433–493 K and 513–673 K respectively. In all spectra, two semicircle arcs are observed. These semi-circles have a deformed shape and their centers are located below the Z′ axis, which reveals that the conduction mechanism is of the non-Debye (Cole–Cole) type.63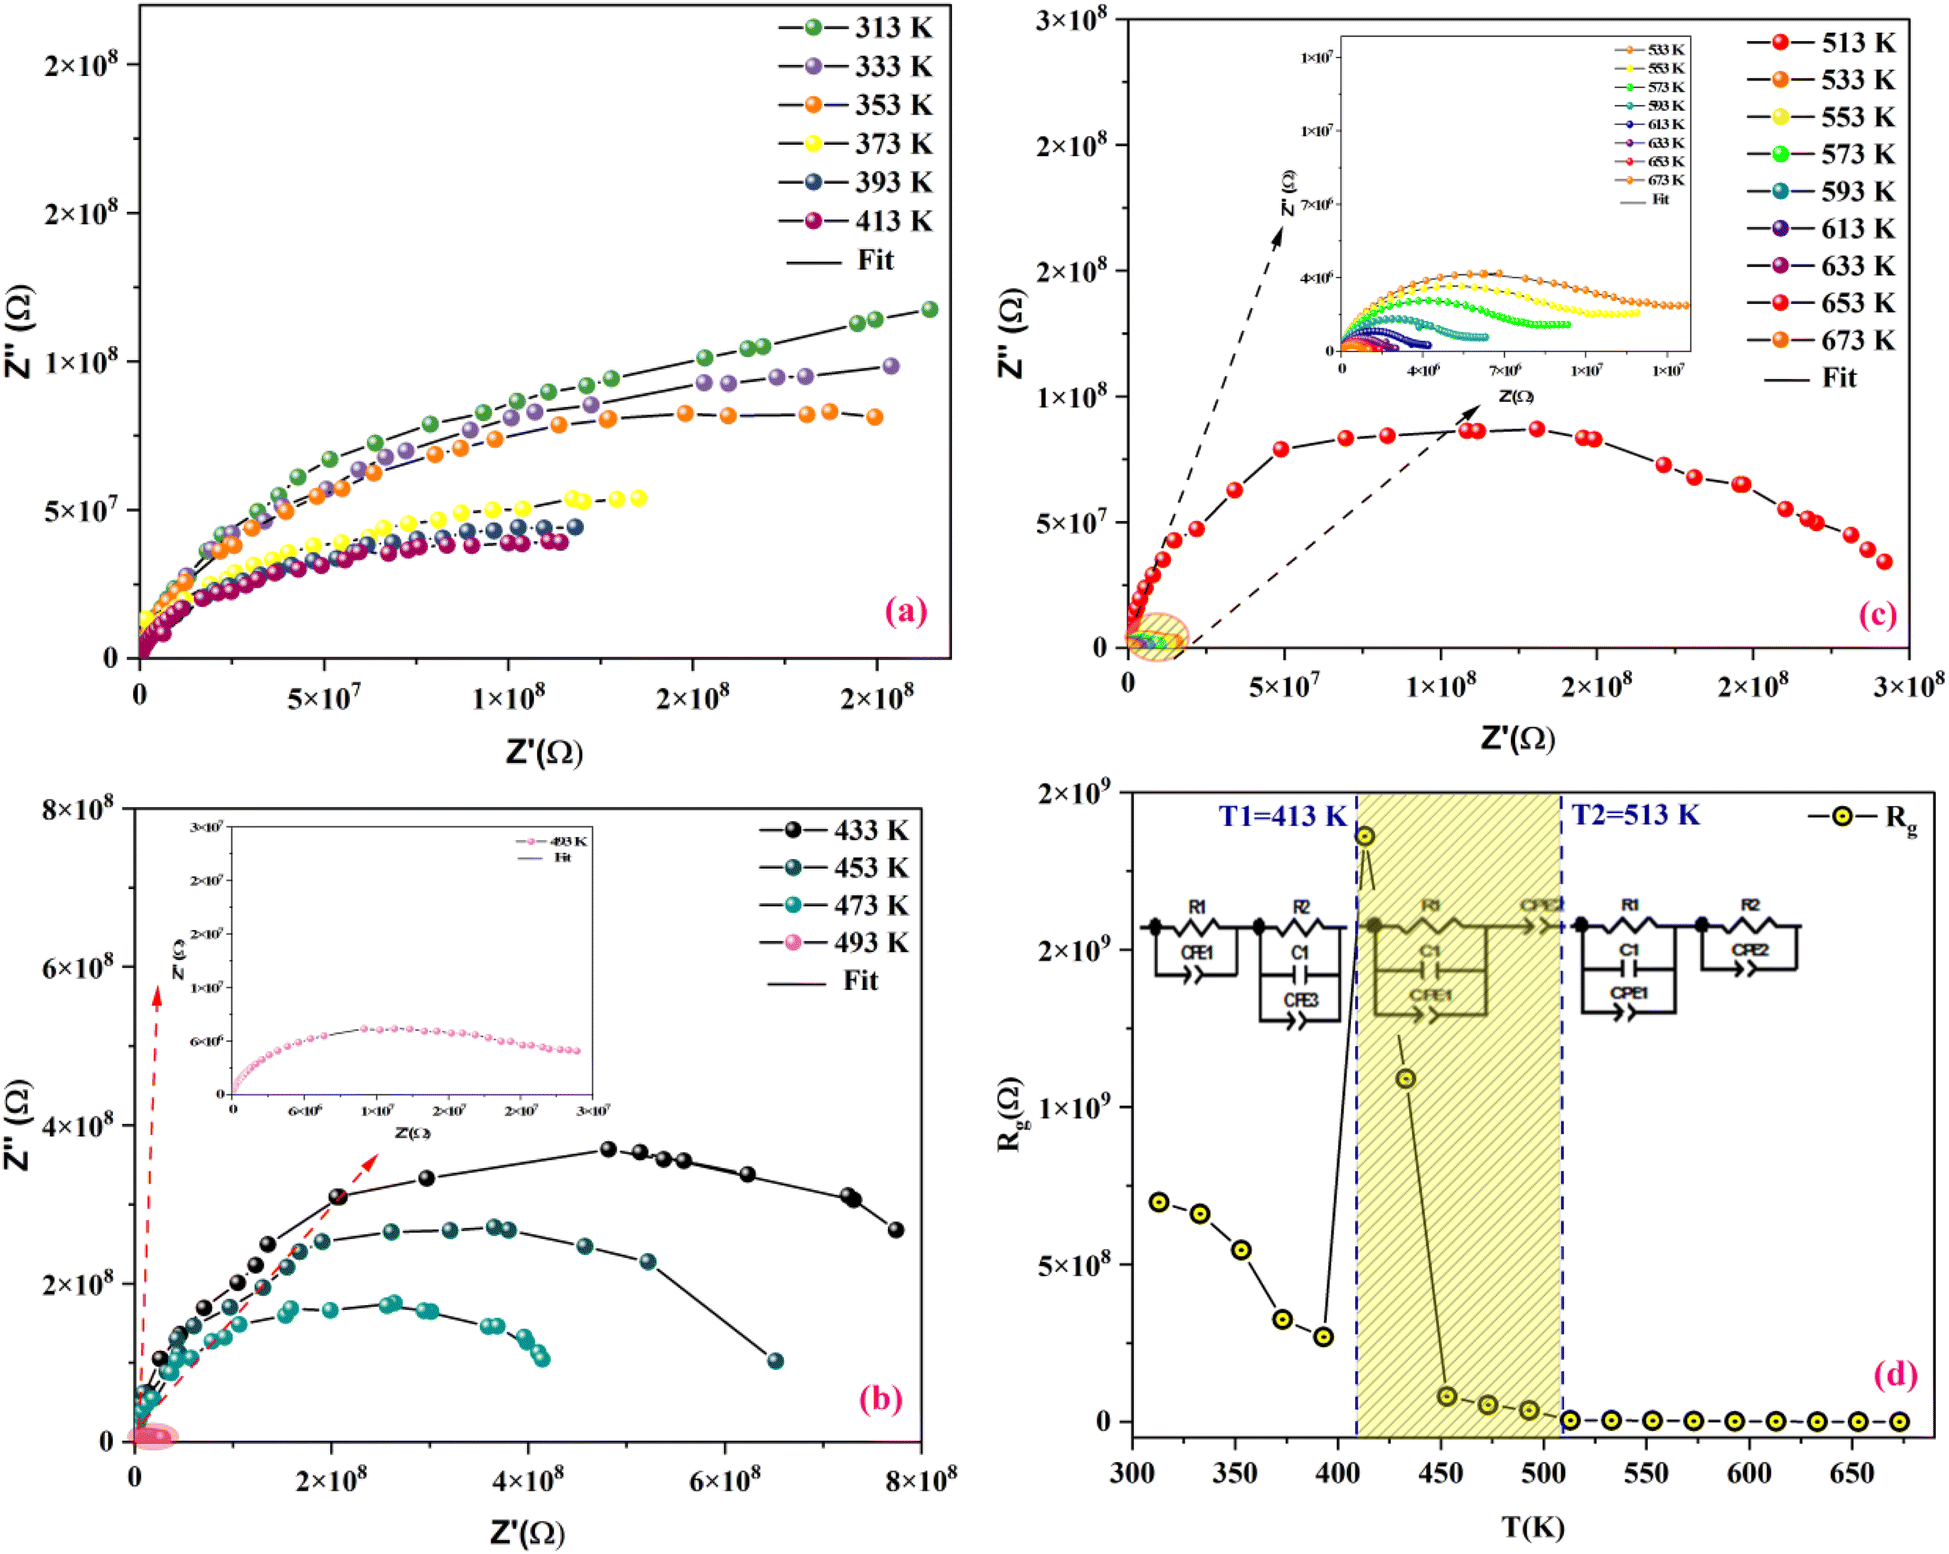 | ||
| Fig. 9 Nyquist plot of MATM compound, at different temperatures, (a–c) and variation of resistance as a function of temperature (d). | ||
The plot of the two arcs in the Nyquist diagram of KCFO, in the temperature range 313–393 K and 513–673 K, can be characterized by the response of grain boundaries and grains at low and high temperatures, respectively. The arc resulting from the impedance plot in the temperature range between 433 and 493 K described may be the effect of the grain and polarization of the electrode.
The Maxwell–Wagner equivalent circuit model is employed to fit the depressed semicircles.64 For the three temperature regions mentioned previously, three equivalent circuit models are employed to describe the impedance spectra; two semicircular arcs are observed in Fig. 9(a) for the temperature range of 313–393 K and 513–673 K, this phenomenon is associated with grain and grain boundary effects. To derive the different electrical parameters, the experimental data are structured into an equivalent circuit comprising a series of two parallel combinations. The first combination includes a resistance (R) and a constant phase element (CPE), while the second combination comprises a parallel arrangement of resistance (R), capacitance (C), and another constant phase element (CPE).65 Give the capacitive impedance of the CPE fractal interface (ZCPE):
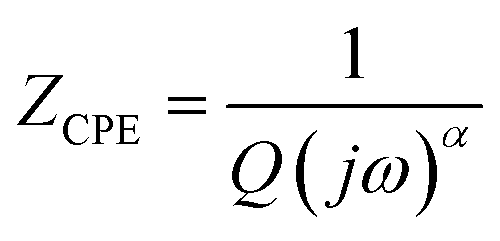 | (7) |
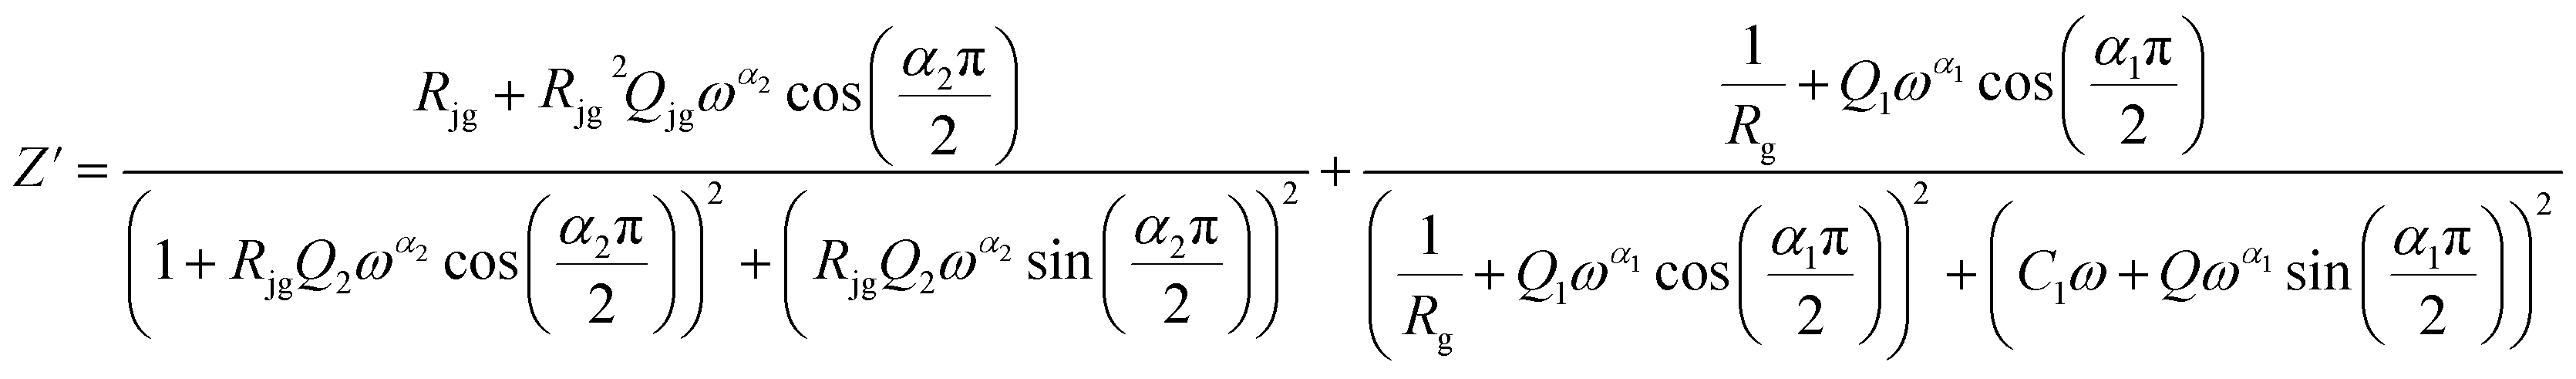 | (8) |
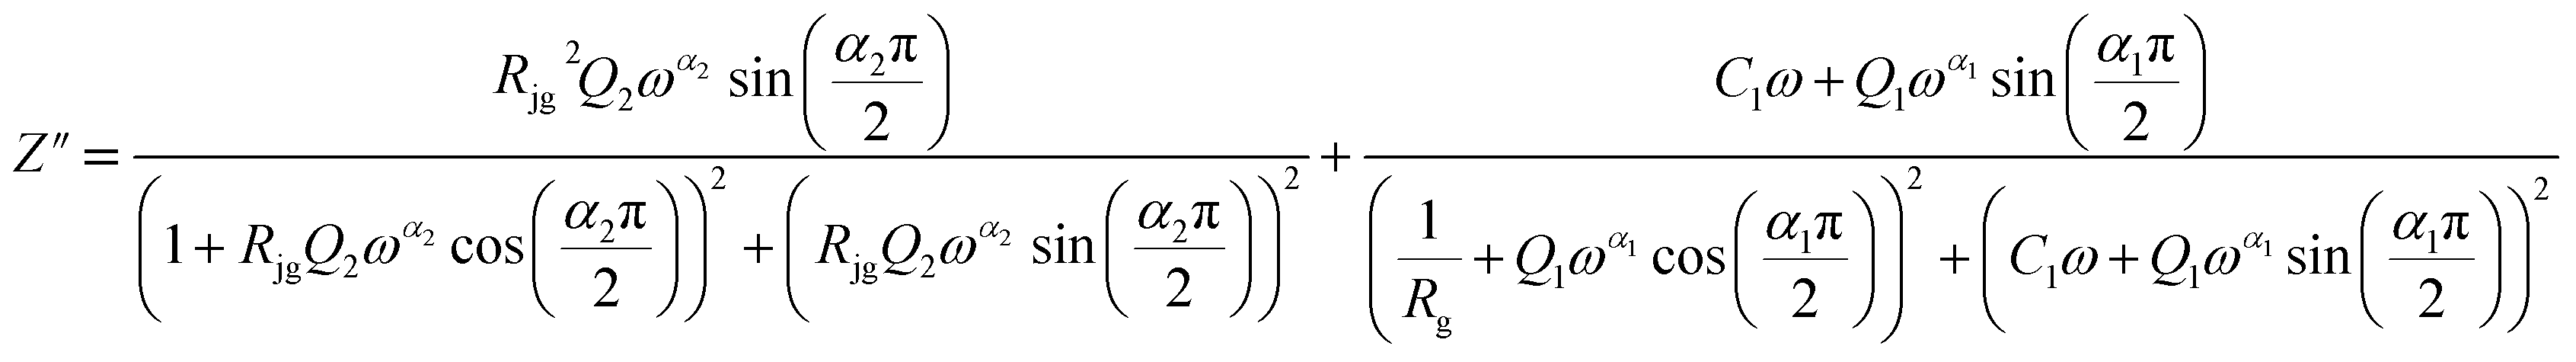 | (9) |
From 413 K to 493 K, an equivalent circuit model can model the compound. It implies a serial association of grain resistance (Rg) associated in parallel with (CPE) and (CPE) associated in series. The corresponding circuit is deposited, as the inset Fig. 9(b) illustrates. Based on this model, we can obtain the subsequent expressions:
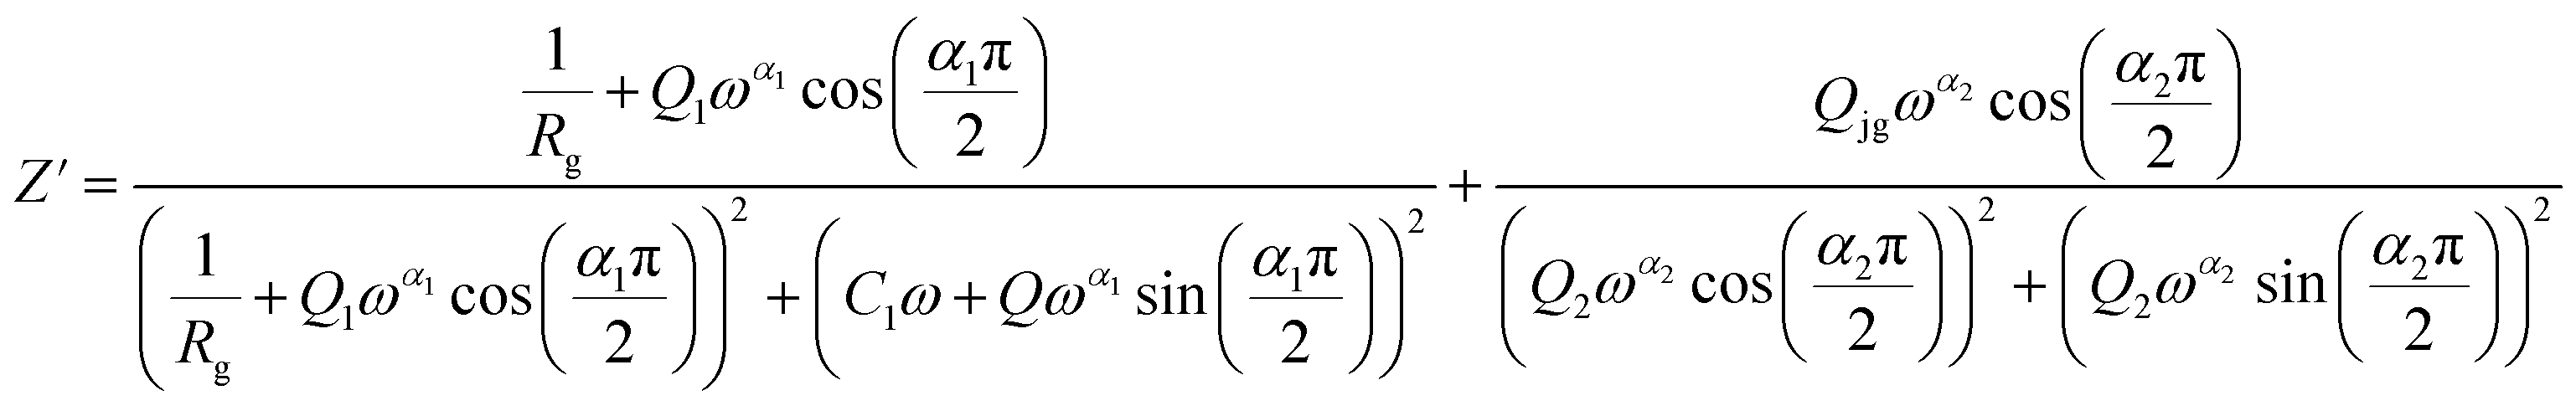 | (10) |
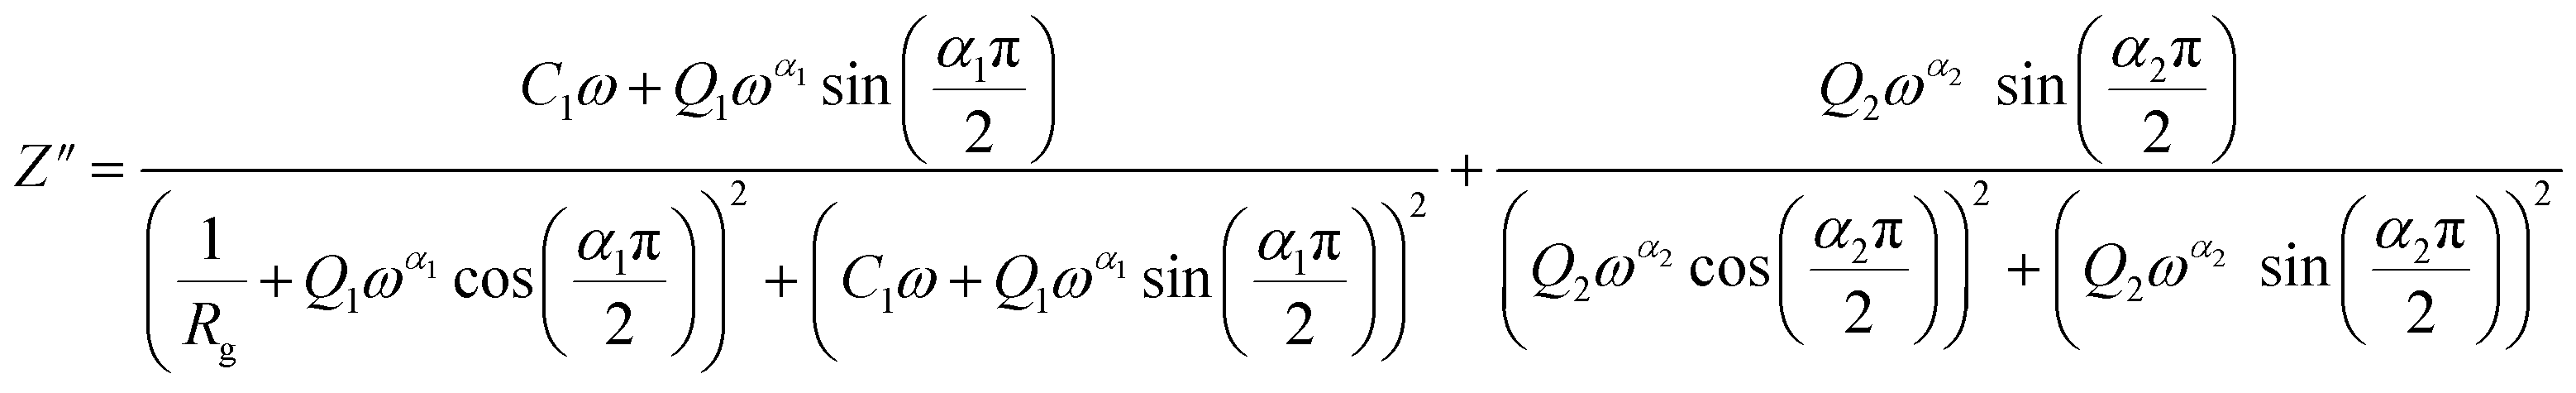 | (11) |
To examine how resistances (Rg) vary with temperature, we plotted those resistances against temperature in Fig. 9(d), where it is evident that for all three temperature ranges and the temperature increase at 413 K, each resistance lowers as temperature rises. After that, the temperature drops once again; the phase transition area can account for the rise at 413 K. We notice that the values of Rg decrease if the temperature increases from 313 K to 413 K and 513 K to 673 K, which implies the semiconductor behavior. From 433 K to 493 K, the Rg values increase gradually if the temperature increases, which indicates the behavior of the metal. These values are higher than those reported in the literature, which can be explained by the potassium doping effect.17 During this transition, depicted in Fig. 4, the KCFO undergoes a shift from the ferroelectric phase to the para-electric phase.
The analysis of M′ (ω) and −Z′′ (ω) plots allows for the determination of the movement of charge carriers and the nature of relaxation in a material, whether it is non-Debye/localized or Debye/delocalized. When impedance and modulus peaks ( and
and  ) coincide at the same frequency, it indicates long-range motion. Conversely, the gap indicates a short-range motion in the conduction process. In Fig. 10, a significant mismatch between
  and
and  peaks is observed at temperatures of 373 K and 573 K. This discrepancy suggests a short-range motion of polarons within KCFO, deviating from the ideal Debye response. Notably, as the temperature rises, the shift between the peaks diminishes, leading to the deduction that the temperature increase induces the relaxation of polarons toward a delocalized state, resembling a Debye-type response within KCFO.64
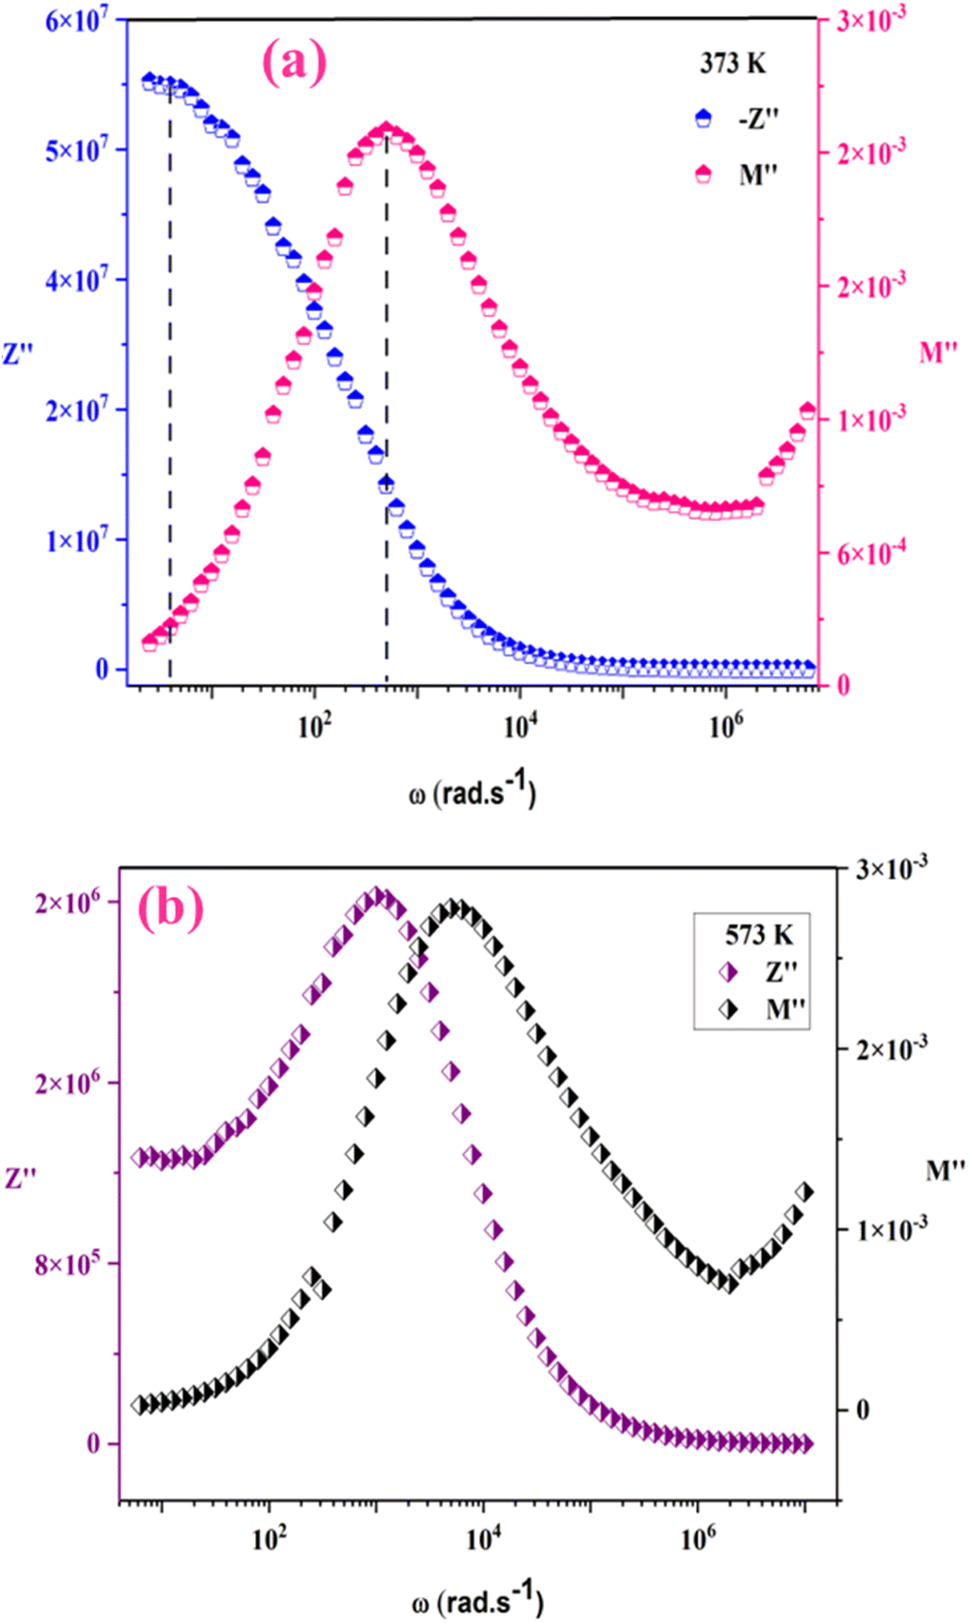 | ||
| Fig. 10 −Z′′ & M′′ variation with frequency at 373 K (a) and 573 K (b). | ||
The variation of capacitance versus angular frequency at different temperatures is illustrated in Fig. 11. The association between frequency and capacitance is obvious as the frequency increases, resulting in a decrease in the capacitance curve. At lower frequencies, the largest capacitance values are recorded, showing the presence of inhomogeneous barrier development at the interface induced by interface states. These interface states are capable of generating an interfacial space charge at the interface.66,67 As previously seen in permittivity studies, the capacitance of materials decreased followed by stabilization. Furthermore, the materials predicted capacitance values at 553 K were magnitudes about 10−6 F. As a result, increased capacitance may improve the overall efficiency of field-effect transistor (FET) devices.
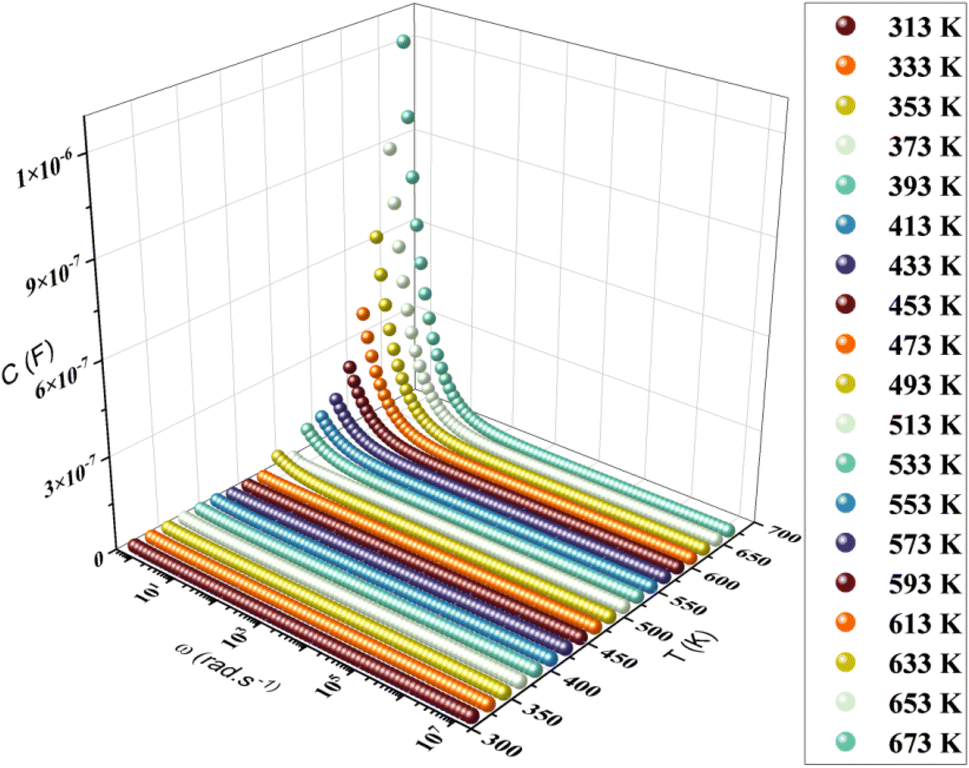 | ||
| Fig. 11 Frequency dependence of capacitance spectra of KCFO. | ||
5. Conclusion
We have explored the morphology, conduction behavior, and electrical properties of the KCFO sample synthesized using the solid-state route.XRD measurements indicate that the compound is in the orthorhombic phase of the Pbnm space group. Raman spectra were utilized for further examination of vibrational modes, providing confirmation of the bonding between oxygen and cations within both octahedral and tetrahedral sites. EDX analysis demonstrates the uniform distribution of iron and calcium cations. The dielectric properties confirm a phase transition from ferroelectric to paraelectric, possibly accounting for the observed anomaly in DC conductivity. The significant dielectric permittivity, robust capacitance, elevated conductivity, and minimal dielectric loss exhibited by this material underscore the potential of ferrites as valuable substances for electronic devices. A comprehensive study has been carried out on AC conductivity, complex impedance, and complex modulus across the frequency range of 10–106 Hz at various temperatures. The frequency-dependent AC conductivity, elucidated by Double Jonscher's law, has been investigated as a function of temperature. The conduction mechanism was analyzed employing the (CBH) model. A comprehensive analysis of the impedance data unveils the distinct contributions from both the grain and the grain boundary. In the temperature intervals 313–413 K and 513–673 K the values of the resistances R decrease if the temperature increases, which implies semiconductor behavior, and increase if the temperature increases from 433 to 493 K, which indicates semiconductor behavior metal.
The semiconductor nature of the material under examination suggests potential applications in optoelectronics, photo-detectors, and photovoltaic. A detailed analysis of impedance data reveals contributions from both grain and grain boundaries. However, a thorough investigation into the magnetic, optical, and dielectric properties of KCFO as a function of temperature.
Conflicts of interest
The authors declare that they have no conflict of interest.References
- B. F. Decker and J. S. Kasper, Acta Crystallogr., 1957, 10(4), 32–337 CrossRef.
- J. Cao, et al., Langmuir, 2013, 29(9), 3116–3124 CrossRef CAS PubMed.
- H. R. Ong, M. M. Rahman Khan, A. Yousuf, N. A. Hussain and C. K. Cheng, RSC Adv., 2015, 5(121), 100362–100368 RSC.
- D. Hirabayashi, T. Yoshikawa, Y. Kawamoto, K. Mochizuki, and K. Suzuki, 11th International Ceramics Congress, 2006, DOI:10.4028/www.scientific.net/ast.45.2169.
- Y. Matsumoto, M. Omae, K. Sugiyama and E. Sato, J. Phys. Chem., 1987, 91(3), 577–581 CrossRef CAS.
- S. Ida, K. Yamada, T. Matsunaga, H. Hagiwara, Y. Matsumoto and T. Ishihara, Am. Chem. Soc., 132(49), 17343–17345 CrossRef CAS PubMed.
- R. A. Candeia, M. I. B. Bernardi, E. Longo, I. M. G. Santos and A. G. Souza, Mater. Lett., 2004, 58(5), 569–572 CrossRef CAS.
- A. Lashtabeg and S. J. Skinner, Mater. Chem., 2006, 16(31), 3161–3170 RSC.
- T. Hidayat, D. Shishin, S. A. Decterov and E. Jak, Metall. Mater. Trans. B, 2015, 47(1), 256–281 CrossRef.
- M. C. Robert, M. Thavarani, N. Pavithra, S. B. Prasath, R. Saravanan and Y. B. Kannan, J. Supercond. Nov. Magnetism, 2022, 35(5), 1281–1298 CrossRef CAS.
- A. Doi, et al., J. Ceram. Soc. Jpn., 2014, 122(1422), 175–178 CrossRef.
- N. Sharma, K. M. Shaju, G. V. Subba Rao and B. V. R. Chowdari, Power Sources, 2003, 124(1), 204–212 CrossRef CAS.
- R. A. Candeia, M. I. B. Bernardi, E. Longo, I. M. G. Santos and A. G. Souza, Mater. Lett., 2004, 58(5), 569–572 CrossRef CAS.
- Y. Matsumoto, M. Omae, K. Sugiyama and E. Sato, Phys. Chem., 1987, 91(3), 577–581 CrossRef CAS.
- S. Zouari, et al., J. Alloys Compd., 2008, 452(2), 234–240 CrossRef CAS.
- K. Obata, Y. Obukuro, S. Matsushima, H. Nakamura, M. Arai and K. Kobayashi, J. Ceram. Soc. Jpn., 2013, 121(1417), 766–769 CrossRef CAS.
- L. M. Corliss, J. M. Hastings and W. Kunnmann, Phys. Rev., 1967, 160(2), 408–413 CrossRef CAS.
- H. C. Gomes, S. S. Teixeira and M. P. F. Graça, J. Alloys Compd., 2022, 921, 166026 CrossRef CAS.
- A. Manohar and C. Krishnamoorthi, J. Alloys Compd., 2017, 722, 818–827 CrossRef CAS.
- I. Petrila and F. Tudorache, Materials, 2021, 14, 4916 CrossRef CAS PubMed.
- M. A. Rahman, M. T. Islam, M. S. J. Singh, M. E. H. Chowdhury and M. Samsuzzaman, Chin. J. Phys., 2021, 71, 351–364 CrossRef CAS.
- M. Sajjad, et al., Mater. Sci.: Mater. Electron., 2020, 31, 21779–21791 CAS.
- T. Tatarchuk, et al., Chemosphere, 2021, 270, 129414 CrossRef CAS PubMed.
- R. D. Shannon, Acta Crystallogr., Sect. A, 1976, 32(5), 751–767 CrossRef.
- A. Manohar and C. Krishnamoorthi, J. Alloys Compd., 2017, 722, 818–827 CrossRef CAS.
- H. C. Gomes, S. S. Teixeira and M. P. F. Graça, J. Alloys Compd., 2022, 921, 166026 CrossRef CAS.
- J. Massoudi, et al., J. Phys. Chem. C, 2022, 126, 2857–2867 CrossRef CAS.
- I. Soudani, K. Ben Brahim, A. Oueslati, H. Slimi, A. Aydi and K. Khirouni, RSC Adv., 2022, 12, 18697–18708 RSC.
- I. Soudani, et al., RSC Adv., 2023, 13, 9260–9272 RSC.
- N. Singh, et al., Mater. Today: Proc., 2022, 65, 2676–2682 CAS.
- V. V. Kharton, et al., J. Electrochem. Soc., 2008, 155(3), 13 CrossRef.
- E. E. Ateia, S. Hussien and A. T. Mohamed, J. Inorg. Organomet. Polym. Mater., 2022, 33(1), 216–227 CrossRef.
- H. Yang, S. Zhang, H. Yang, Y. Yuan and E. Li, Ceram. Int., 2019, 45(14), 16940–16947 CrossRef CAS.
- S. Attia, N. Helaili, G. Rekhila, Y. Bessekhouad and M. Trari, Mater. Sci.: Mater. Electron., 2022, 33(13), 9976–9987 CAS.
- C. Van Caillie and R. D. Amos, Chem. Phys. Lett., 2000, 328, 446–452 CrossRef CAS.
- D. D. Miller and R. Siriwardane, Appl. Energy, 2018, 224, 708 CrossRef CAS.
- N. Koleva, M. N. Ilieva, V. N. Popovb and M. Gospodinov, Solid State Commun., 2003, 128, 153–155 CrossRef.
- G. Sahu, M. Das, M. Yadav, B. P. Sahoo and J. Tripathy, Polymers, 2020, 12(2), 374 CrossRef CAS PubMed.
- T. Dabbebi, et al., Mater. Sci.: Mater. Electron., 2021, 33(1), 490–504 Search PubMed.
- F. Hcini, S. Hcini, B. Alzahrani, S. Zemni and M. L. Bouazizi, Appl. Phys. A:, 2020, 126, 362 CrossRef CAS.
- A. Sahoo, T. Paul, S. Maiti and R. Banerjee, Nanotechnology, 2022, 33(19), 195703 CrossRef PubMed.
- P. Bhuyan, D. Cho, M. Choe, S. Lee and S. Park, Polymers, 2022, 14(4), 710 CrossRef CAS PubMed.
- K. C. Kao, Dielectric Phenomena in Solids, 2004, pp. 283–326 Search PubMed.
- F. Gaâbel, M. Khlifi, N. Hamdaoui, L. Beji, K. Taibi and J. Dhahri, Mater. Sci.: Mater. Electron., 2019, 30(16), 14823–14833 Search PubMed.
- S. Singh, G. Banappanavar and D. Kabra, ACS Energy Lett., 2020, 5(3), 728–735 CrossRef CAS.
- W. Wan, et al., Ceram. Int., 2018, 44(5), 5086–5092 CrossRef CAS.
- S. Aydi, A. Amouri, S. Chkoundali and A. Aydi, Ceram. Int., 2017, 43(15), 12179–12185 CrossRef CAS.
- M. ben Abdessalem, I. Kriaa, A. Aydi and N. Abdelmoula, Ceram. Int., 2018, 44(12), 13595–13601 CrossRef CAS.
- K. Uchino and S. Nomura, Ferroelectrics, 1982, 44(1), 55–61 CrossRef CAS.
- M. Smari, H. Rahmouni, N. Elghoul, I. Walha, E. Dhahri and K. Khirouni, RSC Adv., 2015, 5(3), 2177–2184 RSC.
- K. Funke, Solid State Ionics, 1990, 40–41, 200–204 CrossRef.
- A. K. Jonscher, Nature, 1977, 267(5613), 673–679 CrossRef CAS.
- M. Ben Bechir and A. Ben Rhaiem, Solid State Chem., 2021, 296, 122021 CrossRef CAS.
- L. Murawski, C. H. Chung and J. D. Mackenzie, Non-Cryst. Solids, 1979, 32(1–3), 91–104 CrossRef CAS.
- A. A. Dakhel, Solid-State Electron., 2005, 49(12), 1996–2001 CrossRef CAS.
- R. H. Chen, R. Y. Chang and S. C. Shern, Phys. Chem. Solids, 2002, 63(11), 2069–2077 CrossRef CAS.
- S. R. Elliott, Adv. Phys., 1987, 36(2), 135–217 CrossRef CAS.
- R. Punia, R. S. Kundu, M. Dult, S. Murugavel and N. Kishore, Appl. Phys., 2012, 112(8), 083701 Search PubMed.
- A. R. Long, Adv. Phys., 1982, 31(5), 553–637 CrossRef CAS.
- M. Ajili, A. Oueslati, M. B. Gzaiel and M. Gargouri, Investigation of optical and transport properties of the semiconducting α-KYP2O7 compound, Opt. Quantum Electron., 2021, 53, 209 CrossRef CAS.
- M. Okutan, E. Basaran, H. I. Bakan and F. Yakuphanoglu, Phys. B Condens. Matter, 2005, 364, 300–305 CrossRef CAS.
- H. Zhang, A. Chang and C. Peng, Microelectron. Eng., 2011, 88(9), 2934–2940 CrossRef CAS.
- A. Singh, R. Chatterjee, S. K. Mishra, P. S. R. Krishna and S. L. Chaplot, Appl. Phys., 2012, 111(1), 014113 Search PubMed.
- P. Córdoba-Torres, T. J. Mesquita, O. Devos, B. Tribollet, V. Roche and R. P. Nogueira, Electrochim. Acta, 2012, 72, 172–178 CrossRef.
- R. Bergman, J. Appl. Phys., 2000, 88(3), 1356–1365 CrossRef CAS.
- G. R. Neupane, M. Bamidele, V. Yeddu, D. Y. Kim and P. Hari, Mater. Res., 2022, 37(7), 1357–1372 CrossRef CAS.
- H. H. Gullu and D. E. Yildiz, Mater. Sci.: Mater. Electron., 2021, 32(10), 13549–13567 CAS.
| This journal is © The Royal Society of Chemistry 2024 |