
 Open Access Article
 This Open Access Article is licensed under a
 Creative Commons Attribution 3.0 Unported Licence
Band gap engineering in lead free halide cubic perovskites GaGeX3 (X = Cl, Br, and I) based on first-principles calculations
Md. Amran Sarker ab,
Md Mehedi Hasanb,
Md. Al Mominb,
Ahmad Irfanc,
Md. Rasidul Islamd and
Ahmed Sharif*a
ab,
Md Mehedi Hasanb,
Md. Al Mominb,
Ahmad Irfanc,
Md. Rasidul Islamd and
Ahmed Sharif*a
aDepartment of Materials and Metallurgical Engineering, Bangladesh University of Engineering & Technology (BUET), Dhaka, Bangladesh. E-mail: asharif@mme.buet.ac.bd
bDepartment of Materials Science and Engineering, Khulna University of Engineering & Technology (KUET), Khulna 9203, Bangladesh
cDepartment of Chemistry, College of Science, King Khalid University, PO. Box 9004, Abha 61413, Saudi Arabia
dDepartment of Electrical and Electronic Engineering, Bangamata Sheikh Fojilatunnesa Mujib Science & Technology University, Jamalpur 2012, Bangladesh
First published on 25th March 2024
Abstract
Lead-free inorganic Ge-based perovskites GaGeX3 (X = Cl, Br, and I) are promising candidates for solar cell applications due to their structural, mechanical, electrical, and optical properties. In this work, we performed density functional theory (DFT) calculations using the CASTEP module to investigate these properties in detail. We found that the lattice parameters and cell volumes increase with the size of the halogen atoms, and that all the compounds are stable and ductile. GaGeBr3 has the highest ductility, machinability, and lowest hardness, while GaGeCl3 has the highest anisotropy. The band gap values, calculated using the GGA-PBE and HSE06 functionals, show a direct band gap at the R–R point, ranging from 0.779 eV and 1.632 eV for GaGeCl3 to 0.330 eV and 1.140 eV for GaGeI3. The optical properties, such as absorption coefficient, conductivity, reflectivity, refractive index, extinction coefficient, and dielectric function, are also computed and discussed. We observed that the optical properties improve with the redshift of the band gap as Cl is replaced by Br and I. GaGeI3 has the highest dielectric constant, indicating the lowest recombination rate of electron–hole pairs. Our results suggest that GaGeX3 (X = Cl, Br, and I) can be used as effective and non-toxic materials for multijunction solar cells and other semiconductor devices.
1. Introduction
The need for energy increases along with the world's population. It's no exaggeration to argue that inexpensive, abundant energy is essential to the operation of our modern, industrialized society. The majority of the energy used around the globe is non-renewable, such as coal, gas, oil, etc. Unfortunately, with time, nonrenewable energy sources will run out. The majority of the world's energy output comes from burning fossil fuels, which releases greenhouse gases that contribute to climate change. This is one of the main drawbacks of using non-renewable energy. The most important decision for the environment may be to rely on renewable energy sources, such as solar energy, as doing so would help reduce greenhouse gas emissions to a tolerable level and lessen the negative consequences of global warming. Because of the capability to convert light into electricity in an unconventional manner,1–8 modern solar cell technologies are widely recognized in both practical engineering and fundamental scientific studies9–15 as a means of producing clean, renewable power. In its most typical configuration, a solar cell consists of three layers. The layers are as follows: a hole transport layer at the bottom, an absorber layer above, and an electron transport layer below. Because of the creation of electron–hole pairs and the absorption of electromagnetic radiation, the absorbent layer is indispensable. The geometrical, optical, and electrical characteristics of the three layers above have a significant impact on the efficiency of light-generated currents and the configuration of the core parts.Perovskite compounds (ABX3) have been considered reliable options for light-absorbing materials for renewable energy supply throughout the past ten years due to their progressively increasing power conversion efficiency (PCE) and lower production cost.16–18 In recent years, perovskite solar cells (MAPbI3 where MA = CH3NH3) have achieved record highs in PCE >25%.19,20 However, the compound becomes unstable in various kinds of environmental circumstances due to the presence of organic molecules (MA), which narrows the range of potential uses.21,22 Furthermore, the toxicity of the heavy hazardous element Pb endangers the environment and hinders its extensive commercialization.23–25 Substituting inorganic alkali cations (Cs+, Rb+) for the organic ones may stabilize the system26 while replacing lead with a non-toxic member of group 14, like Sn or Ge, can get rid of the toxicity.27,28 Lead-free germanium-based lead-free perovskite solar cells synthesized with CsGeX3 (X = halogen) have been reported to have a power conversion efficiency (PCE) of about 4.92%.29,30 However, doping it with tin (CsSn0.5Ge0.5I3) caused an increase of 7.11%. Furthermore, PCEs higher than 10% have been attained using CsSnI3-based perovskite solar cells.31
The previous discussion indicates that organic-inorganic halide perovskites (MAPbI3) have a higher PCE than Pb-free perovskite solar cells. Thus, to create high PCE (%) absorber layers for solar cells, researchers are always looking for novel Pb-free perovskite materials. The factors that affect power conversion efficiency (PCE) are bandgap, stability, high carrier mobility, low excitation binding energy, and high absorption. Therefore, more research is needed to develop inorganic lead-free perovskite solar cells. However, a lot of study has been done on Ge-based halide perovskites, much like other perovskite materials. Furthermore, GaGeX3 (X = Cl, Br, and I) is a non-toxic material with promising physical features that have not yet been studied.
In this study, we investigate the properties of inexpensive and non-toxic lead-free gallium (Ga) based cubic halide perovskite GaGeX3 (X = Cl, Br, and I), which have been reported to exhibit high stability and can be applicable in multijunction solar cells. We use density functional theory (DFT) calculations to study the lattice parameter, mechanical stability, thermodynamically stability, structural stability, ductile and brittle behavior, anisotropy, bandstructure, density of states and optical properties (complex dielectric function and refractive index, absorption coefficient, conductivity, reflectivity and loss function) of these compounds. We aim to understand the effects of the halogen atoms on the properties of GaGeX3 and to identify the most suitable compound for photovoltaic applications. This research may offer a way to discover an effective and lead-free photovoltaic material that can overcome the limitations of the lead-based perovskites.
2. Computational methodology
The Cambridge Serial Total Energy Package (CASTEP)32 has been used to do the first-principles calculations inside the framework of DFT.33,34 CASTEP mainly uses the plane-wave pseudopotential total energy technique to study the physical features.35 The general gradient approximation (GGA) using the Perdew–Berke–Emzerhof (PBE) functional is used to calculate the electronic exchange-correlation energy.36 The Vanderbilt-type ultrasoft pseudopotential is intended to exist to regulate the electron–ion interactions.37 The optimal crystal structure has been assured by using the Broyden–Fletcher–Goldfarb–Shanno (BFGS) approach.38 The plane wave energy cutoff was set at 600 eV with k-points 7 × 7 × 7 to achieve the optimal structure and the characteristics calculations. The k-point's Brillouin zone sampling was done using the Monkhorst–Pack approach.39 We performed spin-polarized DFT + U calculations to determine whether GaGeX3 (where X = Cl, Br, and I) exhibits magnetic properties. It was considered that the value of U for both Ga and Ge is 4 eV. Since the total density of states for spin up and spin down electrons is symmetrical, as depicted in Fig. 1, there is no net magnetic moment. The cancelation of magnetic moments between spins leads to this conclusion. Hence, GaGeX3 (where X = Cl, Br, and I) is considered non-magnetic. Consequently, we set the spin polarization to be non-polarized in all calculations, also known as ‘spin-restricted’ calculations, where the same orbitals are used for both alpha and beta spins. Higher k-points are employed in the optical property calculation process. To calculate the bandgap more accurately, we used the HSE06 functional with Quantum ESPRESSO. Under typical conditions, the stress–strain technique has been used to derive the elastic stiffness constants of the studied model.40 The strain magnitude was set at 0.003 in order to attain the optimal results. The following levels of convergence were established: 5 × 10⁻⁶ eV per atom for total energy; 5 × 10⁻⁴ Å for maximum displacements; 0.01 eV Å−1 for maximum force; and 0.02 GPa for maximum stress.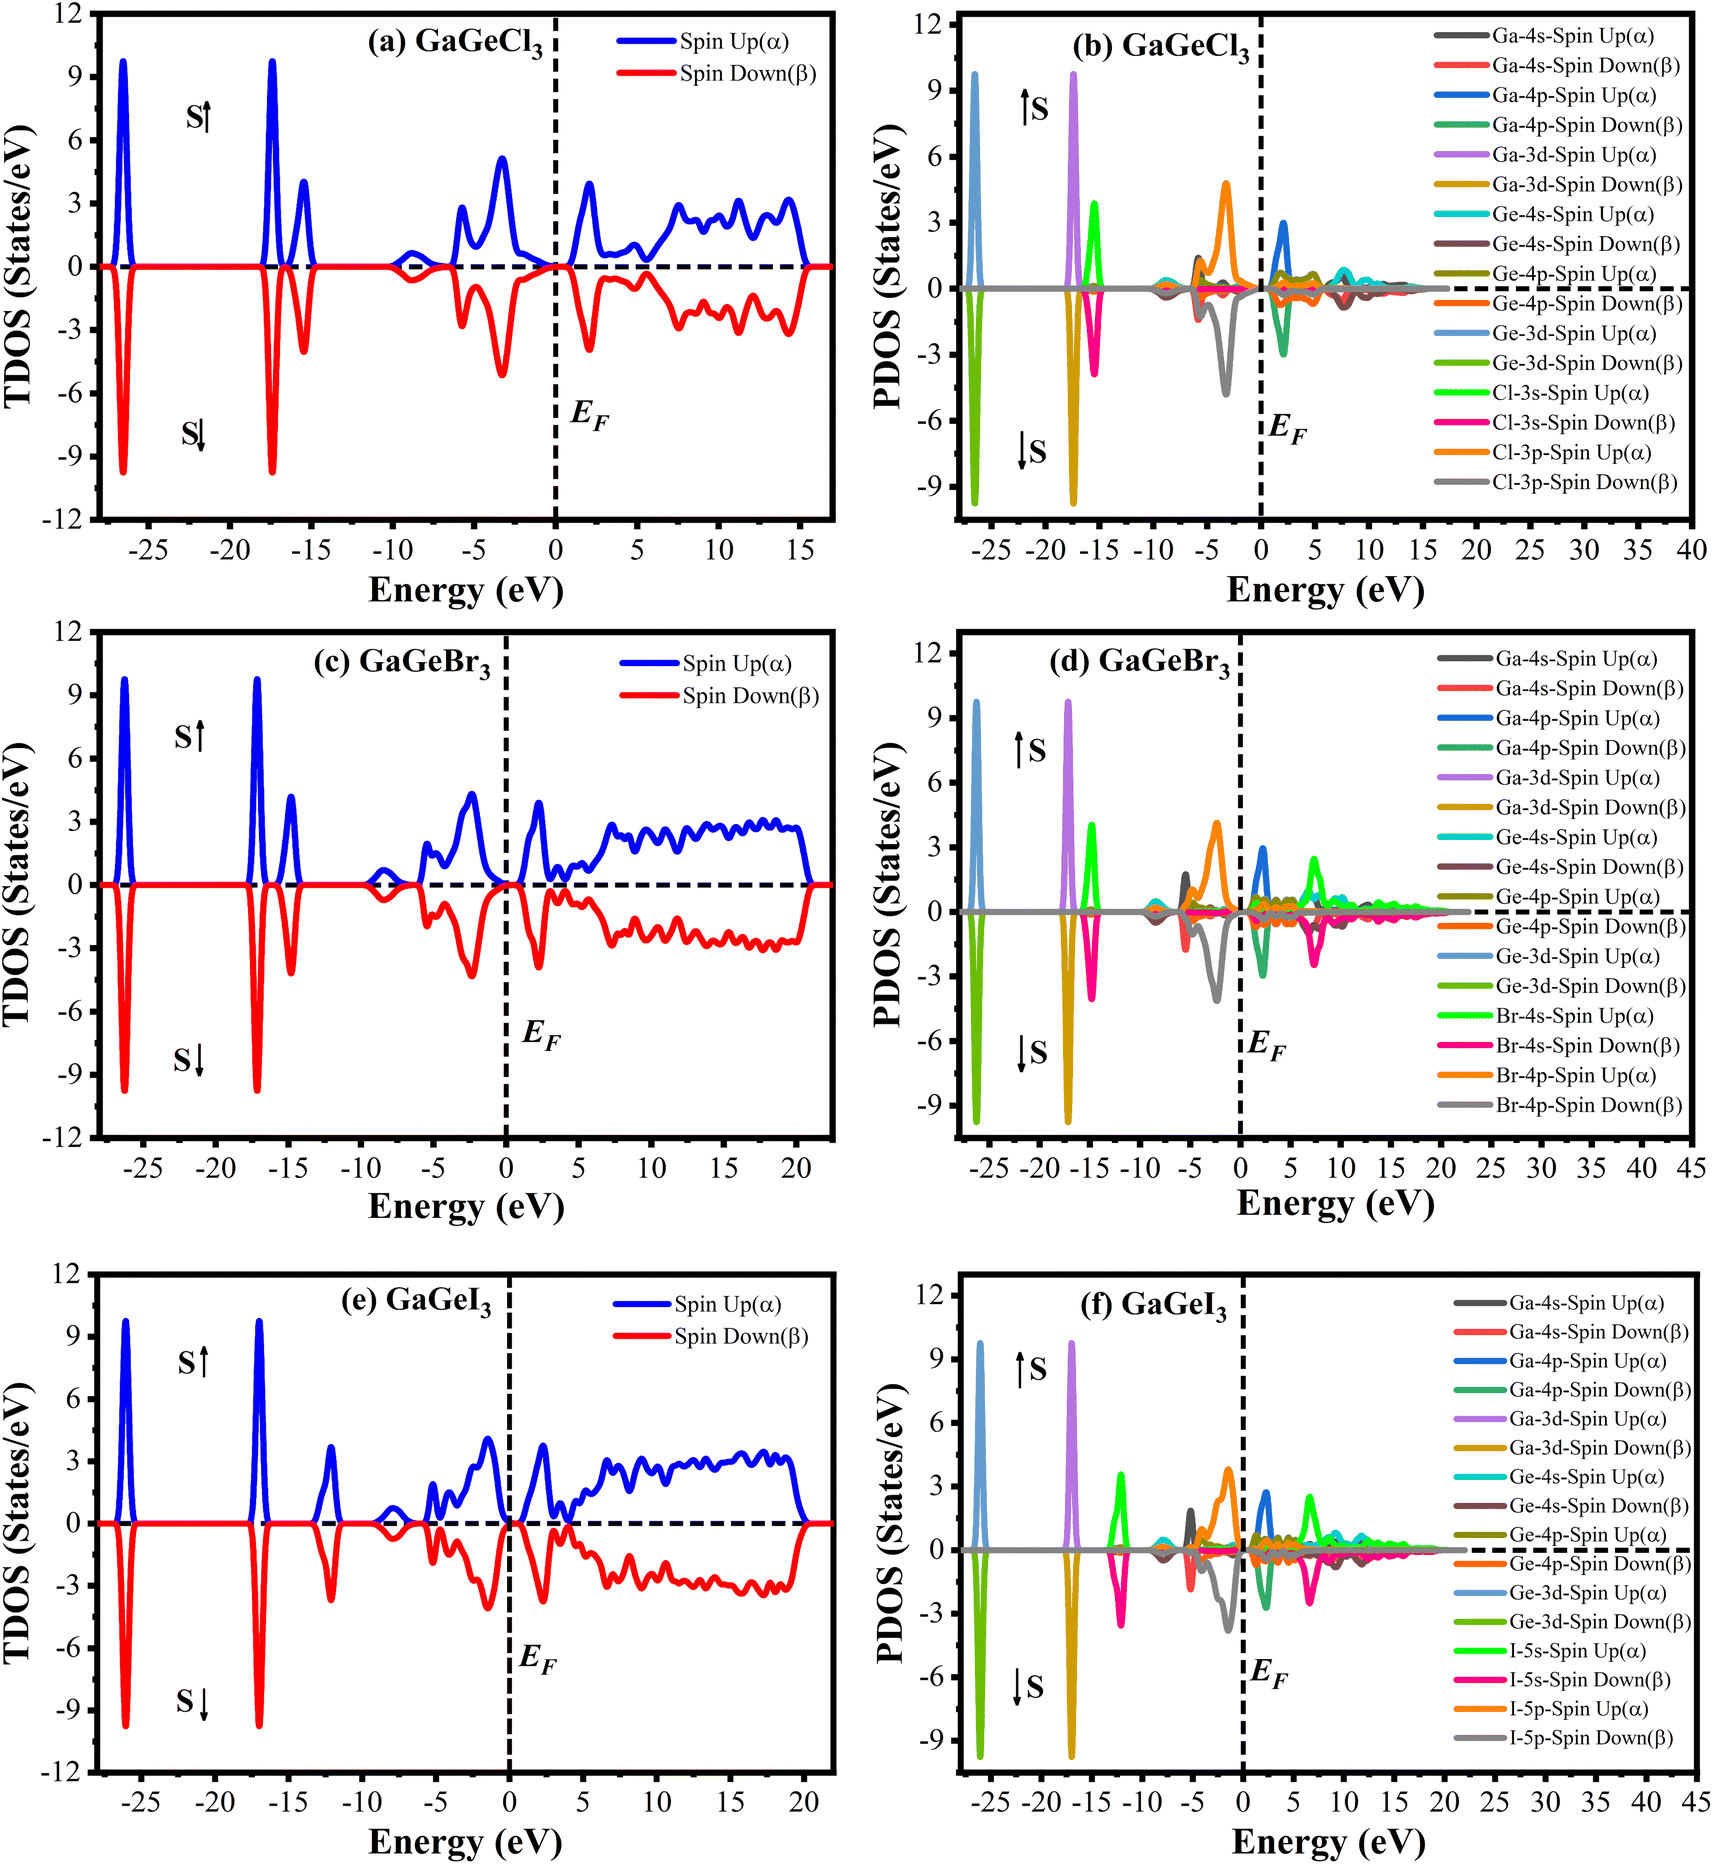 | ||
| Fig. 1 Density of state of spin up and spin down of GaGeX3 (X = Cl, Br, and I). [a, c and e] indicate total density of state (TDOS) and [b, d and f] indicate partial density of state (PDOS) calculated by using spin polarized DFT + U. | ||
3. Results & discussion
3.1 Structural properties
Ge-based halide perovskite GaGeX3(X = Cl, Br, and I), belongs to space group Pm![[3 with combining macron]](https://www.rsc.org/images/entities/char_0033_0304.gif) m (#221) and crystallizes as a cubic structure. The VESTA software illustrates the crystal structure of GaGeX3, which is displayed in Fig. 2. GaGeX3 is a crystal lattice composed of five atoms, where X represents the halogens (Cl, Br, and I). Wyckoff position 1a is occupied by the Ga atom, which is positioned at coordinates A (0, 0, 0), while Wyckoff position 1b is occupied by the Ge atom, which is placed at coordinates B (0.5, 0.5, 0.5). Wyckoff position 3c is occupied by the X (X = Cl, Br, and I) atoms at positions X (0.5, 0.5, 0). The desire for site occupation in ABX3 perovskite materials depends on several variables, including ionic radii, electronegativity, and crystallization energy.41 GaGeCl3 is likely to be more stable than GeGaCl3 because of the better size fit between Ga and Cl and the negligible effect of electronegativity differences. Recently some research papers have been published on GaGeF3, where aurhors have proved that the preference site of Ga is A (0, 0, 0) site.42,43 The Simulated structural parameters are tabulated in Table 1 along with formation energy and band gap. For GaGeCl3, our computed lattice constant is 5.220 Å. However, when the atomic number of halides (X) increases, the lattice parameter also rises and it becomes 5.482 Å, and 5.854 Å for GaGeBr3, and GaGeI3 respectively. Due to the atomic size is proportional to the atomic number. Similar to the lattice parameter, cell volume also increases with the atomic number of halogens (X), and these are 142.277 Å3, 164.729 Å3, and 200.568 Å3 respectively for GaGeCl3, GaGeBr3, and GaGeI3.
m (#221) and crystallizes as a cubic structure. The VESTA software illustrates the crystal structure of GaGeX3, which is displayed in Fig. 2. GaGeX3 is a crystal lattice composed of five atoms, where X represents the halogens (Cl, Br, and I). Wyckoff position 1a is occupied by the Ga atom, which is positioned at coordinates A (0, 0, 0), while Wyckoff position 1b is occupied by the Ge atom, which is placed at coordinates B (0.5, 0.5, 0.5). Wyckoff position 3c is occupied by the X (X = Cl, Br, and I) atoms at positions X (0.5, 0.5, 0). The desire for site occupation in ABX3 perovskite materials depends on several variables, including ionic radii, electronegativity, and crystallization energy.41 GaGeCl3 is likely to be more stable than GeGaCl3 because of the better size fit between Ga and Cl and the negligible effect of electronegativity differences. Recently some research papers have been published on GaGeF3, where aurhors have proved that the preference site of Ga is A (0, 0, 0) site.42,43 The Simulated structural parameters are tabulated in Table 1 along with formation energy and band gap. For GaGeCl3, our computed lattice constant is 5.220 Å. However, when the atomic number of halides (X) increases, the lattice parameter also rises and it becomes 5.482 Å, and 5.854 Å for GaGeBr3, and GaGeI3 respectively. Due to the atomic size is proportional to the atomic number. Similar to the lattice parameter, cell volume also increases with the atomic number of halogens (X), and these are 142.277 Å3, 164.729 Å3, and 200.568 Å3 respectively for GaGeCl3, GaGeBr3, and GaGeI3.
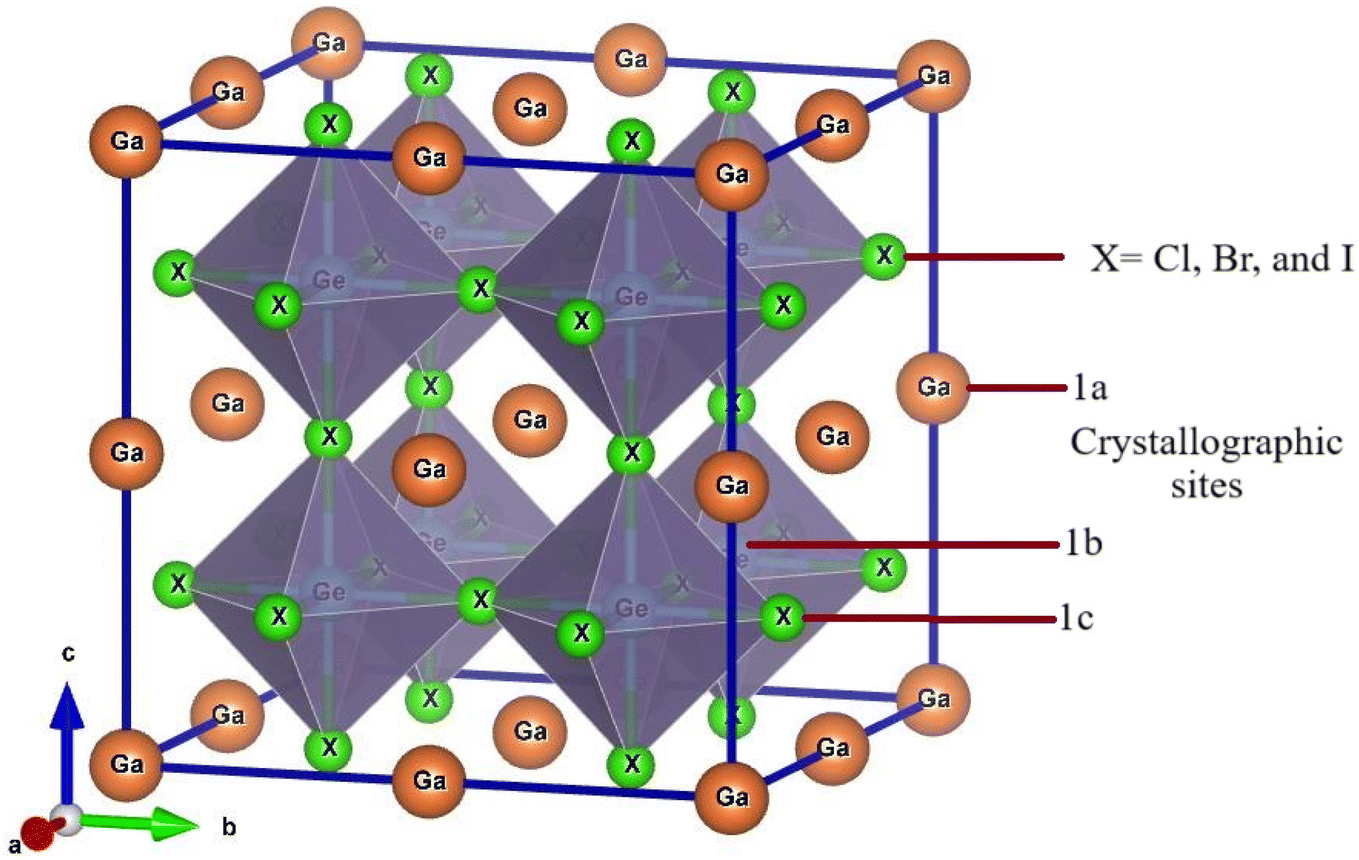 | ||
| Fig. 2 Optimized crystal structure of GaGeX3 (X = Cl, Br, and I). | ||
| Compound | a (Å) | V (Å3) | ΔEf (eV per atom) | Etotal (GaGeX3) (eV) | Eg (eV) (PBE) | Eg (eV) (HSE06) |
|---|---|---|---|---|---|---|
| GaGeCl3 | 5.220 | 142.277 | −3.434 | −5.9568 × 10³ | 0.779 | 1.632 |
| GaGeBr3 | 5.482 | 164.729 | −3.106 | −6.0788 × 10³ | 0.462 | 1.284 |
| GaGeI3 | 5.854 | 200.568 | −2.750 | −7.0753 × 10³ | 0.330 | 1.140 |
During the synthesis of a material, phase separation can occur, which is a general phenomenon. For example, GaX and GeX2 phases can separate during synthesis of GaGeX3. The stability of GaGeX3 is confirmed by the Born stability criteria, the formation energy, final enthalpy and phonon analysis. The Born stability calculation is discussed briefly in the mechanical properties section. The compounds are more stable when their final enthalpy is negative since it shows that their enthalpy of formation is less than that of the reactants. Formation energy can be used to predict the phase stability and the tendency of a compound to decompose. A negative formation energy means that the compound has a lower energy than its constituent elements, and therefore it is more stable.44,45 Since all of our interested compounds have high negative values of formation energy and final enthalpy, it is considered that there is no phase separation during the synthesis of those compounds.
Formation energy (ΔEf) is one of the most significant variables in estimating the crystal stability of a structure. The formation energy of GaGeX3 (X = Cl, Br, and I) is calculated by using the following formula, and tabulated in Table 1:46
Analyzing the phonon dispersion curve is crucial for assessing dynamic stability in crystalline materials. These curves depict the relationship between the frequency of lattice vibrations (phonons) and their corresponding wave vectors. The phonon dispersion relation describes how the phonon frequency varies with wave vector. Phonons are essential for determining thermal conductivity, specific heat, and mechanical stability of materials. Negative frequencies in the dispersion curve indicate instability. If a material exhibits negative frequencies, it implies that certain vibrational modes are energetically unfavorable, leading to potential lattice distortions or even collapse. The phonon dispersion curves for GaGeX3 were analyzed and visualized in Fig. 3. It indicates that all vibrational modes within GaGeX3 are energetically stable as there are no negative frequencies. Based on this analysis, it can be concluded confidently that GaGeX3 is dynamically stable. Its crystal lattice remains intact, and there are no indications of instability.
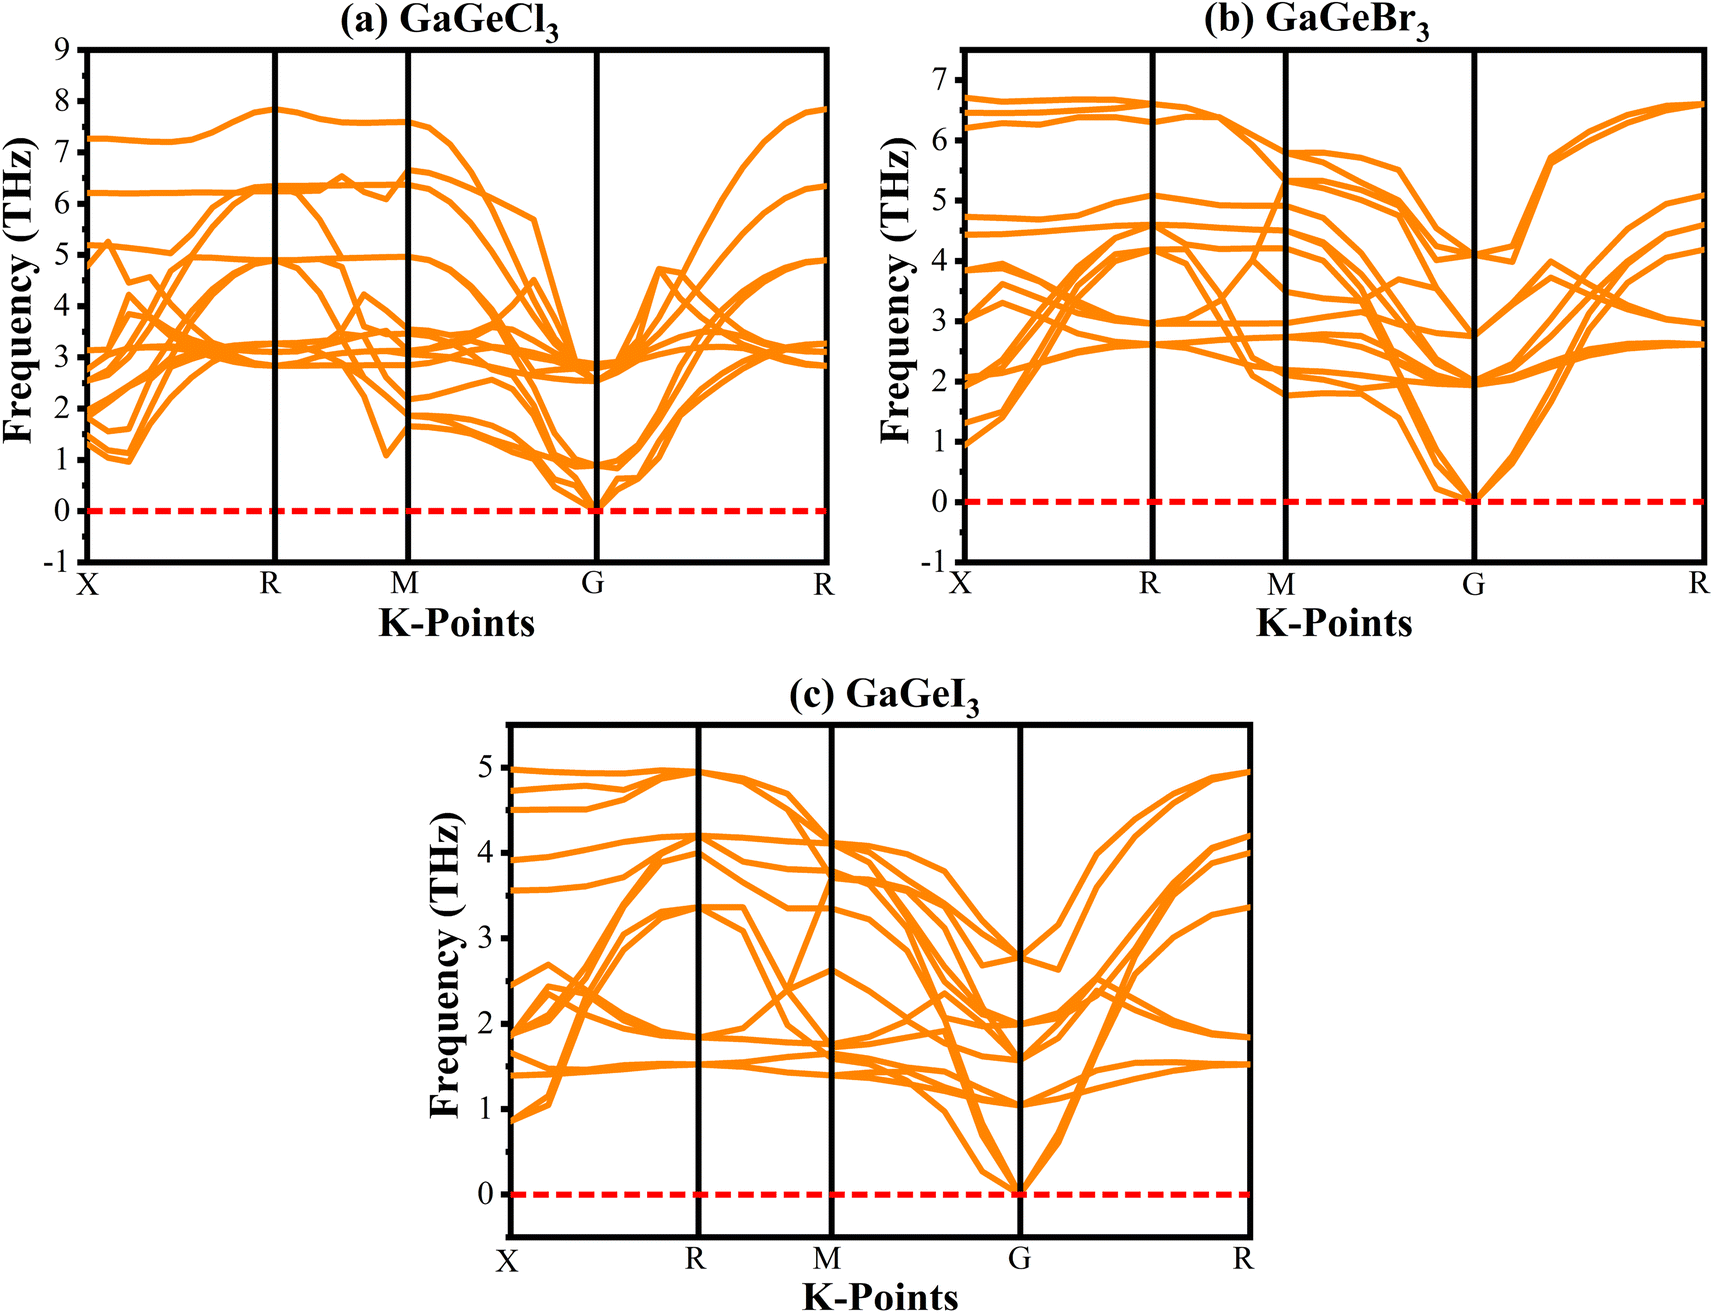 | ||
| Fig. 3 Phonon dispersion curve of (a) GaGeCl3, (b) GaGeBr3, and (c) GaGeI3. | ||
3.2 Mechanical properties
Material's elastic and mechanical features are essential for their implementation in devices. Elastic constants are very crucial for predicting the physical properties of a crystal under equilibrium circumstances. This helps determine the solid's hardness, ductile-brittle behaviour, bonding nature, and other properties, as well as the solid's mechanical stability.47,48 Table 2 lists the elastic constants of GaGeX3 (X = Cl, Br, and I), which are calculated using the “stress–strain” principle. To evaluate the mechanical stability of a cubic structure, the well-known Born stability criteria are utilized,49 which is C11 > 0, C11 + 2C12 > 0, C11 − C12 > 0, and C44 > 0. To maintain mechanical stability, this equation states that C11, C12, and C44 must be larger than zero. Our simulated elastic constants which are tabulated in Table 2 confirm that GaGeX3 (X = Cl, Br, and I) is mechanically stable. Additionally, greater incompressibility in the x-direction is indicated by a larger value of C11. Among these three minerals, GaGeCl3 has the greatest value of C11, as Table 2 demonstrates. Therefore, in the x-direction, GaGeCl3 has the maximum incompressibility. Moreover, The stiffness and resistance to deformation of the crystal are indicated by greater values of the elastic constants (C11, C12, and C44). Given those three compounds, GaGeCl3 exhibits the best degree of stiffness and deformation resistance. Normally, elastic constant C12 along the (100) plane depends on the atomic arrangement in the crystal lattice as well as the interatomic forces. Elastic constants are often lower at larger interatomic distances since the intensity of interatomic forces decreases with such distance. Here we see when halogen Cl is replaced by Br, the elastic constant C12 is higher compared to Cl-containing material. This contradiction may occur because of its crystal structure and bonding properties, GaGeBr3 may be more resistant to shear deformation along the (100) plane than GaGeCl3, even though it has larger interatomic distances. And because of increasing elastic constant of C12 for GaGeBr3 that changing the other mechanical properties those are related to C12 such as Bulk modulus (B), Pugh's ratio (B/G), Poisson's ratio (ν), Hardness (Hv), and Machinability index (μM).| Compound | C11 | C12 | C44 | C12–C44 | B (GPa) | G (GPa) | Y | B/G | υ | Hv | μM |
|---|---|---|---|---|---|---|---|---|---|---|---|
| GaGeCl3 | 59.76 | 11.38 | 6.24 | 5.14 | 27.51 | 11.15 | 29.46 | 2.47 | 0.32 | 1.82 | 4.41 |
| GaGeBr3 | 58.64 | 15.59 | 5.61 | 9.97 | 29.94 | 9.98 | 26.93 | 3.00 | 0.35 | 1.34 | 5.33 |
| GaGeI3 | 43.88 | 6.24 | 5.53 | 0.71 | 18.79 | 9.27 | 23.89 | 2.03 | 0.29 | 1.99 | 3.40 |
The Vigot–Reuss–Hill (VRH) assumption may be utilized to compute a solid's mechanical behaviour by applying elastic constants. Young's modulus (Y), shear modulus (G), and bulk modulus (B) can be used to express resistance to longitudinal, shear, and volume deformation, respectively. We computed Y, G, and B of GaGeX3 (X = Cl, Br, and I) in this work, and Table 2 lists them.
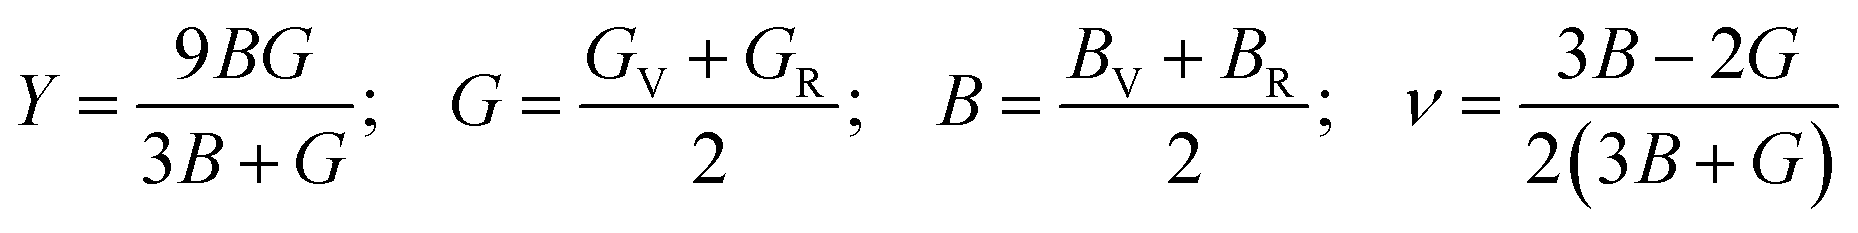
To determine the ductile-brittle nature of a material Poission's ratio(ν), Pugh's ratio (B/G), and Cauchy pressure C12–C44is utilized.50 Regarding any material, the critical values of ν and B/G are respectively 0.26 and 1.75. The ductile character of materials is demonstrated by values larger than 1.75 and 0.26 for Pugh's and Poission's ratios, respectively. Moreover, as the value increases the degree of ductility also increases. Table 2 elucidates that, our interested all three materials are ductile, but GaGeBr3 exhibits the highest degree of ductility as it shows the highest value of Pugh's and Poission's ratio, whilst GaGeI3 exhibits minimal ductility among them because of the lowest value of Pugh's and Poission's ratio. Similar to ν, and B/G, Cauchy pressure is also a crucial parameter to identify the ductile-brittle nature of a material. The brittle character of the material is shown by the negative Cauchy pressure (C12–C44) value, whereas a positive reading of Cauchy pressure reflects its ductile behaviour.51 Table 2 elicits that the Cauchy pressure of GaGeX3 (X = Cl, Br, and I) is positive, which reconfirms that all three materials are ductile, and GaGeBr3 is the most ductile material because of the highest value of Cauchy pressure.
A material's capacity to withstand plastic deformation is defined by its hardness. The following formula is used to calculate hardness:52
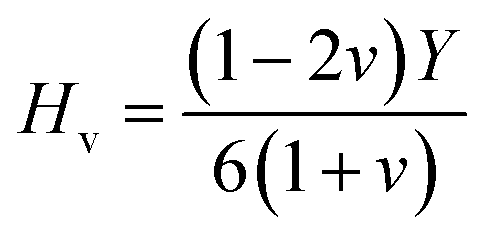
As seen in Table 2, GaGeI3 has a hardness of 1.99, which is the maximum among all three materials, and when I is replaced by Cl and Br, hardness is decreased by about 1.09 and 1.49 respectively. The manufacturing sector is significantly impacted by the machinability index μM, which determined a substance's cutting power, the most efficient way to use a machine and plastic strain. Table 2 shows that, The μM value of GaGeCl3 is 4.41 which is 1.21 times lower than GaGeBr3 and 1.30 times higher than GaGeI3. GaGeBr3 exhibits the highest μM, which states that it is considerably more lubricating, has less friction, and has maximum machinability among all three materials, which significantly affects the production process. The following formula can be utilized to determine the machinability index:53
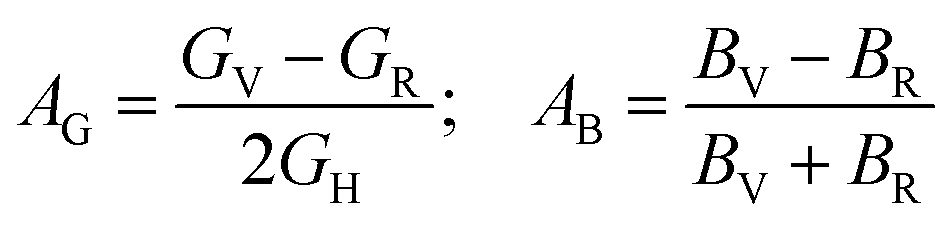
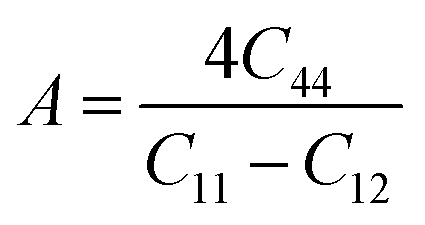
Understanding the microscopic behaviour in single and multi-crystalline materials requires an understanding of elastic anisotropy. Anisotropy in a material was primarily driven by C11. Therefore, it is crucial to look for the directionality of the elastic tensor. By studying elastic anisotropy, mechanical resilience and adaptability of solid materials can be determined under stress. The mathematical representation of elastic anisotropy is:
A material's isotropic state may be determined by studying its universal anisotropy (AU) value. The extent of anisotropy is expressed by the departure from the value of AU, which indicates isotropic material if it is zero. From Table 3. We observe that GaGeCl3 has the highest degree of anisotropy among our studied materials, as it deviates most from zero. The degree of anisotropy's order:
| GaGeCl3 > GaGeBr3 > GaGeI3 |
| Compound | A1 | A2 | A3 | A | AG | AB | AU | Aeq. |
|---|---|---|---|---|---|---|---|---|
| GaGeCl3 | 0.2580 | 0.2580 | 0.2580 | 0.2580 | 0.4077 | 0 | 2.5606 | 3.8758 |
| GaGeBr3 | 0.2608 | 0.2608 | 0.2608 | 0.2608 | 0.4017 | 0 | 2.5137 | 3.8339 |
| GaGeI3 | 0.2936 | 0.2936 | 0.2936 | 0.2936 | 0.3388 | 0 | 2.0393 | 3.4058 |
The following formulas are used to calculate the percentage of anisotropy under shear (AG) and in bulk (AB) condition:
For (100) planes,
For (001) planes,

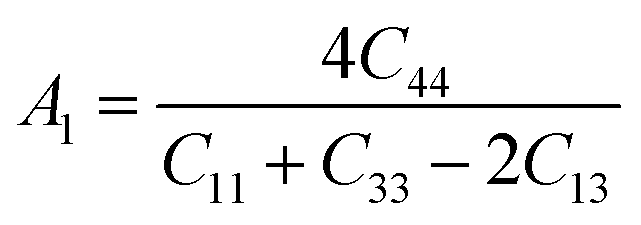
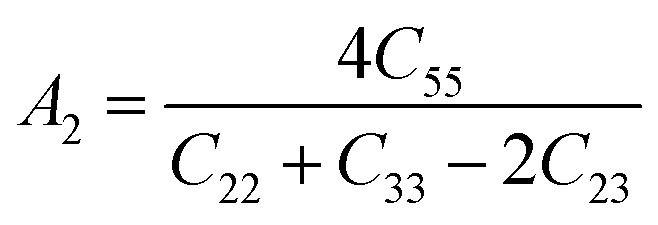
To acquire precise anisotropy, we need to determine the Zener anisotropy index (A) and the equivalent Zener anisotropy (Aeq.). They can be evaluated by using the following formula:56
In cubic structure, A1 = A2 = A3 = A, and if the value of A = 1, it shows isotropic nature. Additionally, the degree of anisotropy is indicated by the deviation from this value. Table 3 demonstrates that all three materials are anisotropic, with GaGeCl3 showing the highest deviation, signifying the most pronounced anisotropic behaviour. This nature is further confirmed the Aeq.. GaGeCl3 possesses the highest value of Aeq., which affirms that it exhibits the most anisotropic behaviour compared to the other materials.
To visualize the anisotropy, a three-dimensional (3D) contour plot of Young modulus (E), shear modulus (G), and Poisson's ratio are shown in Fig. 4. For isotropic material, a 3D contour plot should be a spherical shape. Higher deviation from the spherical shape represents a higher degree of anisotropy. From Fig. 4, we can find a high deviation from the spherical shape of Young's modulus (E), shear modulus (G), and Poisson's ratio for GaGeX3 (Cl, Br, and I). For GaGeCl3, deviation from spherical shape is the highest among those three compounds, which proves that GaGeCl3 provides the highest anisotropic nature and GaGeI3 shows the lowest anisotropic nature among those three compounds.
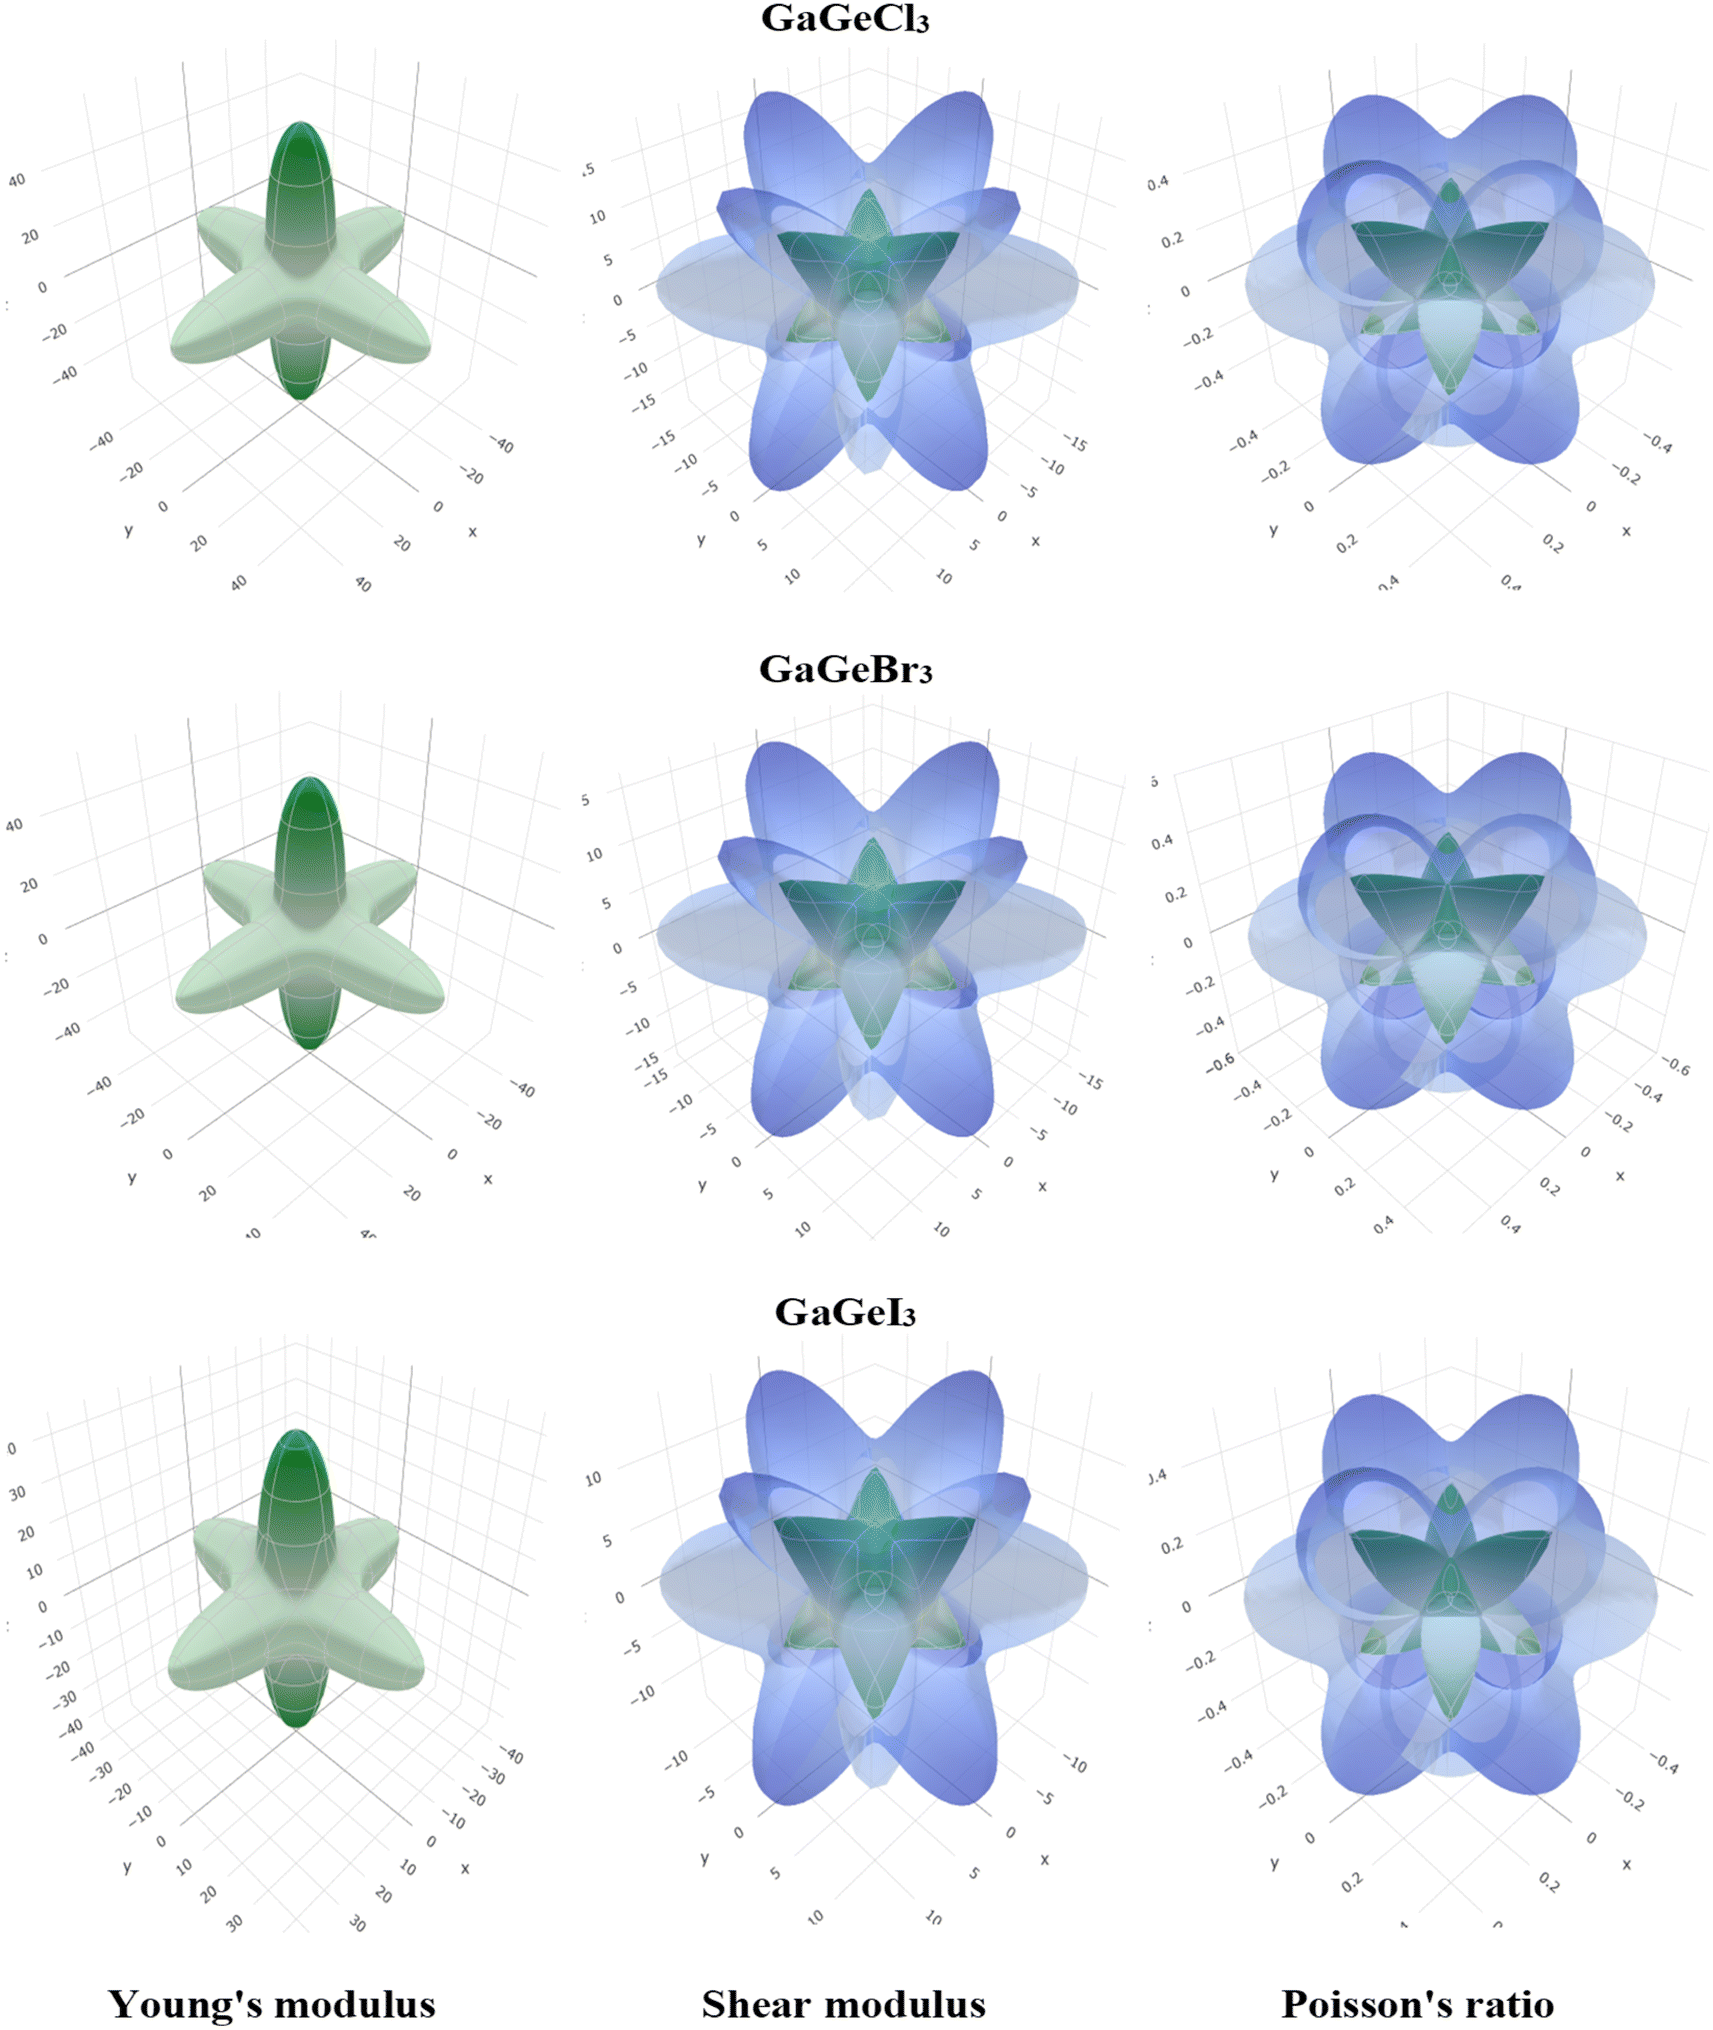 | ||
| Fig. 4 3D anisotropy contour plots of young modulus (E), shear modulus (G), and Poisson's ratio for GaGeX3 (X = Cl, Br and I) compounds respectively. | ||
3.3 Electronic properties
A material's band structure and density of states (DOS) have to be studied to assess its electrical nature. The electronic band dispersion profile of GaGeX3 (X = Cl, Br, and I) is therefore predicted using the PBE and HSE06 functionals, and it is depicted in Fig. 5 as well as listed in Table 1. Since GaGeX3 (X = Cl, Br, and I) lacks theoretical and experimental data, we have only compared the data among our investigated materials. The Fermi level in the illustration is marked by the red dashed line at 0 eV (EF). In addition, the valence band (VB) and conduction band (CB) are indicated by the blue lines below the Fermi level and the yellow lines above it, respectively. The energy dispersion profile elucidates that studied all compounds show a direct bandgap at the R–R point. GaGeCl3, GaGeBr3, and GaGeI3 have band gaps of 0.779 eV, 0.462 eV, and 0.330 eV, respectively, when calculated with the PBE functional, and 1.632 eV, 1.284 eV, and 1.140 eV, respectively, when calculated with the HSE06 functional. When Cl is substituted with halogen X (Br, and I), the conduction band is migrated toward the Fermi level and eventually energy gap is reduced. Reduced energy gap results from increased free electron intensity in the VB and CB, which is caused by the replacement of smaller halogens with bigger ones. Therefore, adjusting the halogen (X) concentration in GaGeX3 enables a tunable bandgap, a crucial feature for applications involving solar cells. To comprehensively assess the electronic properties, we computed and illustrated the density of states (DOS) for GaGeX3 (X = Cl, Br, and I) in Fig. 6. In this figure. The Fermi level is marked by the vertical dashed black line at 0 eV. To comprehend a material's semiconducting nature, the TDOS is essential. The figure confirms that all three of these materials are semiconductors under normal conditions since the TDOS of each material exhibits zero value close to the Fermi threshold. However, the PDOS is extremely important for understanding the contributions of the various atomic states in the band structure. Fig. 6 elicits that the VB of GaGeCl3 is mostly composed of Cl-3p orbitals, with little contribution from Ga-4s and Ge-4p orbitals, while the CB is primarily composed of Ga-4p and Ge-4p orbitals. As the bigger halogens X (Br and I) replace Cl, the energy gap is reduced as both the VB and CB peaks approach the Fermi level. In this instance, the VB comes primarily from Br-4p and I-5p, with a little Ge-4p contribution. Ga-4p is the most significant contributor to the formation of the CB, with minor contributions coming from Ge-4p, Br-4p/I-5p, and F–Br-4s/I-5s states. Here, the main responsibility for lowering the band gap Eg for all components lies in Ge-4p orbital. The band gap in GaGeX3 is a result of the hybridization of the orbitals of the atoms in the crystal structure. The origin of the band gap mainly come from hybridization of Cl-3p and Ga-4p, Ge-4p for GaGeCl3, Br-4p and Ge-4p for GaGeBr3, I-5p and Ge-4p for GaGeCl3 The band gap can be tuned by changing the halogen atom, as different halogens have different electronegativities and bond lengths, which affect the orbital overlap and the crystal field splitting.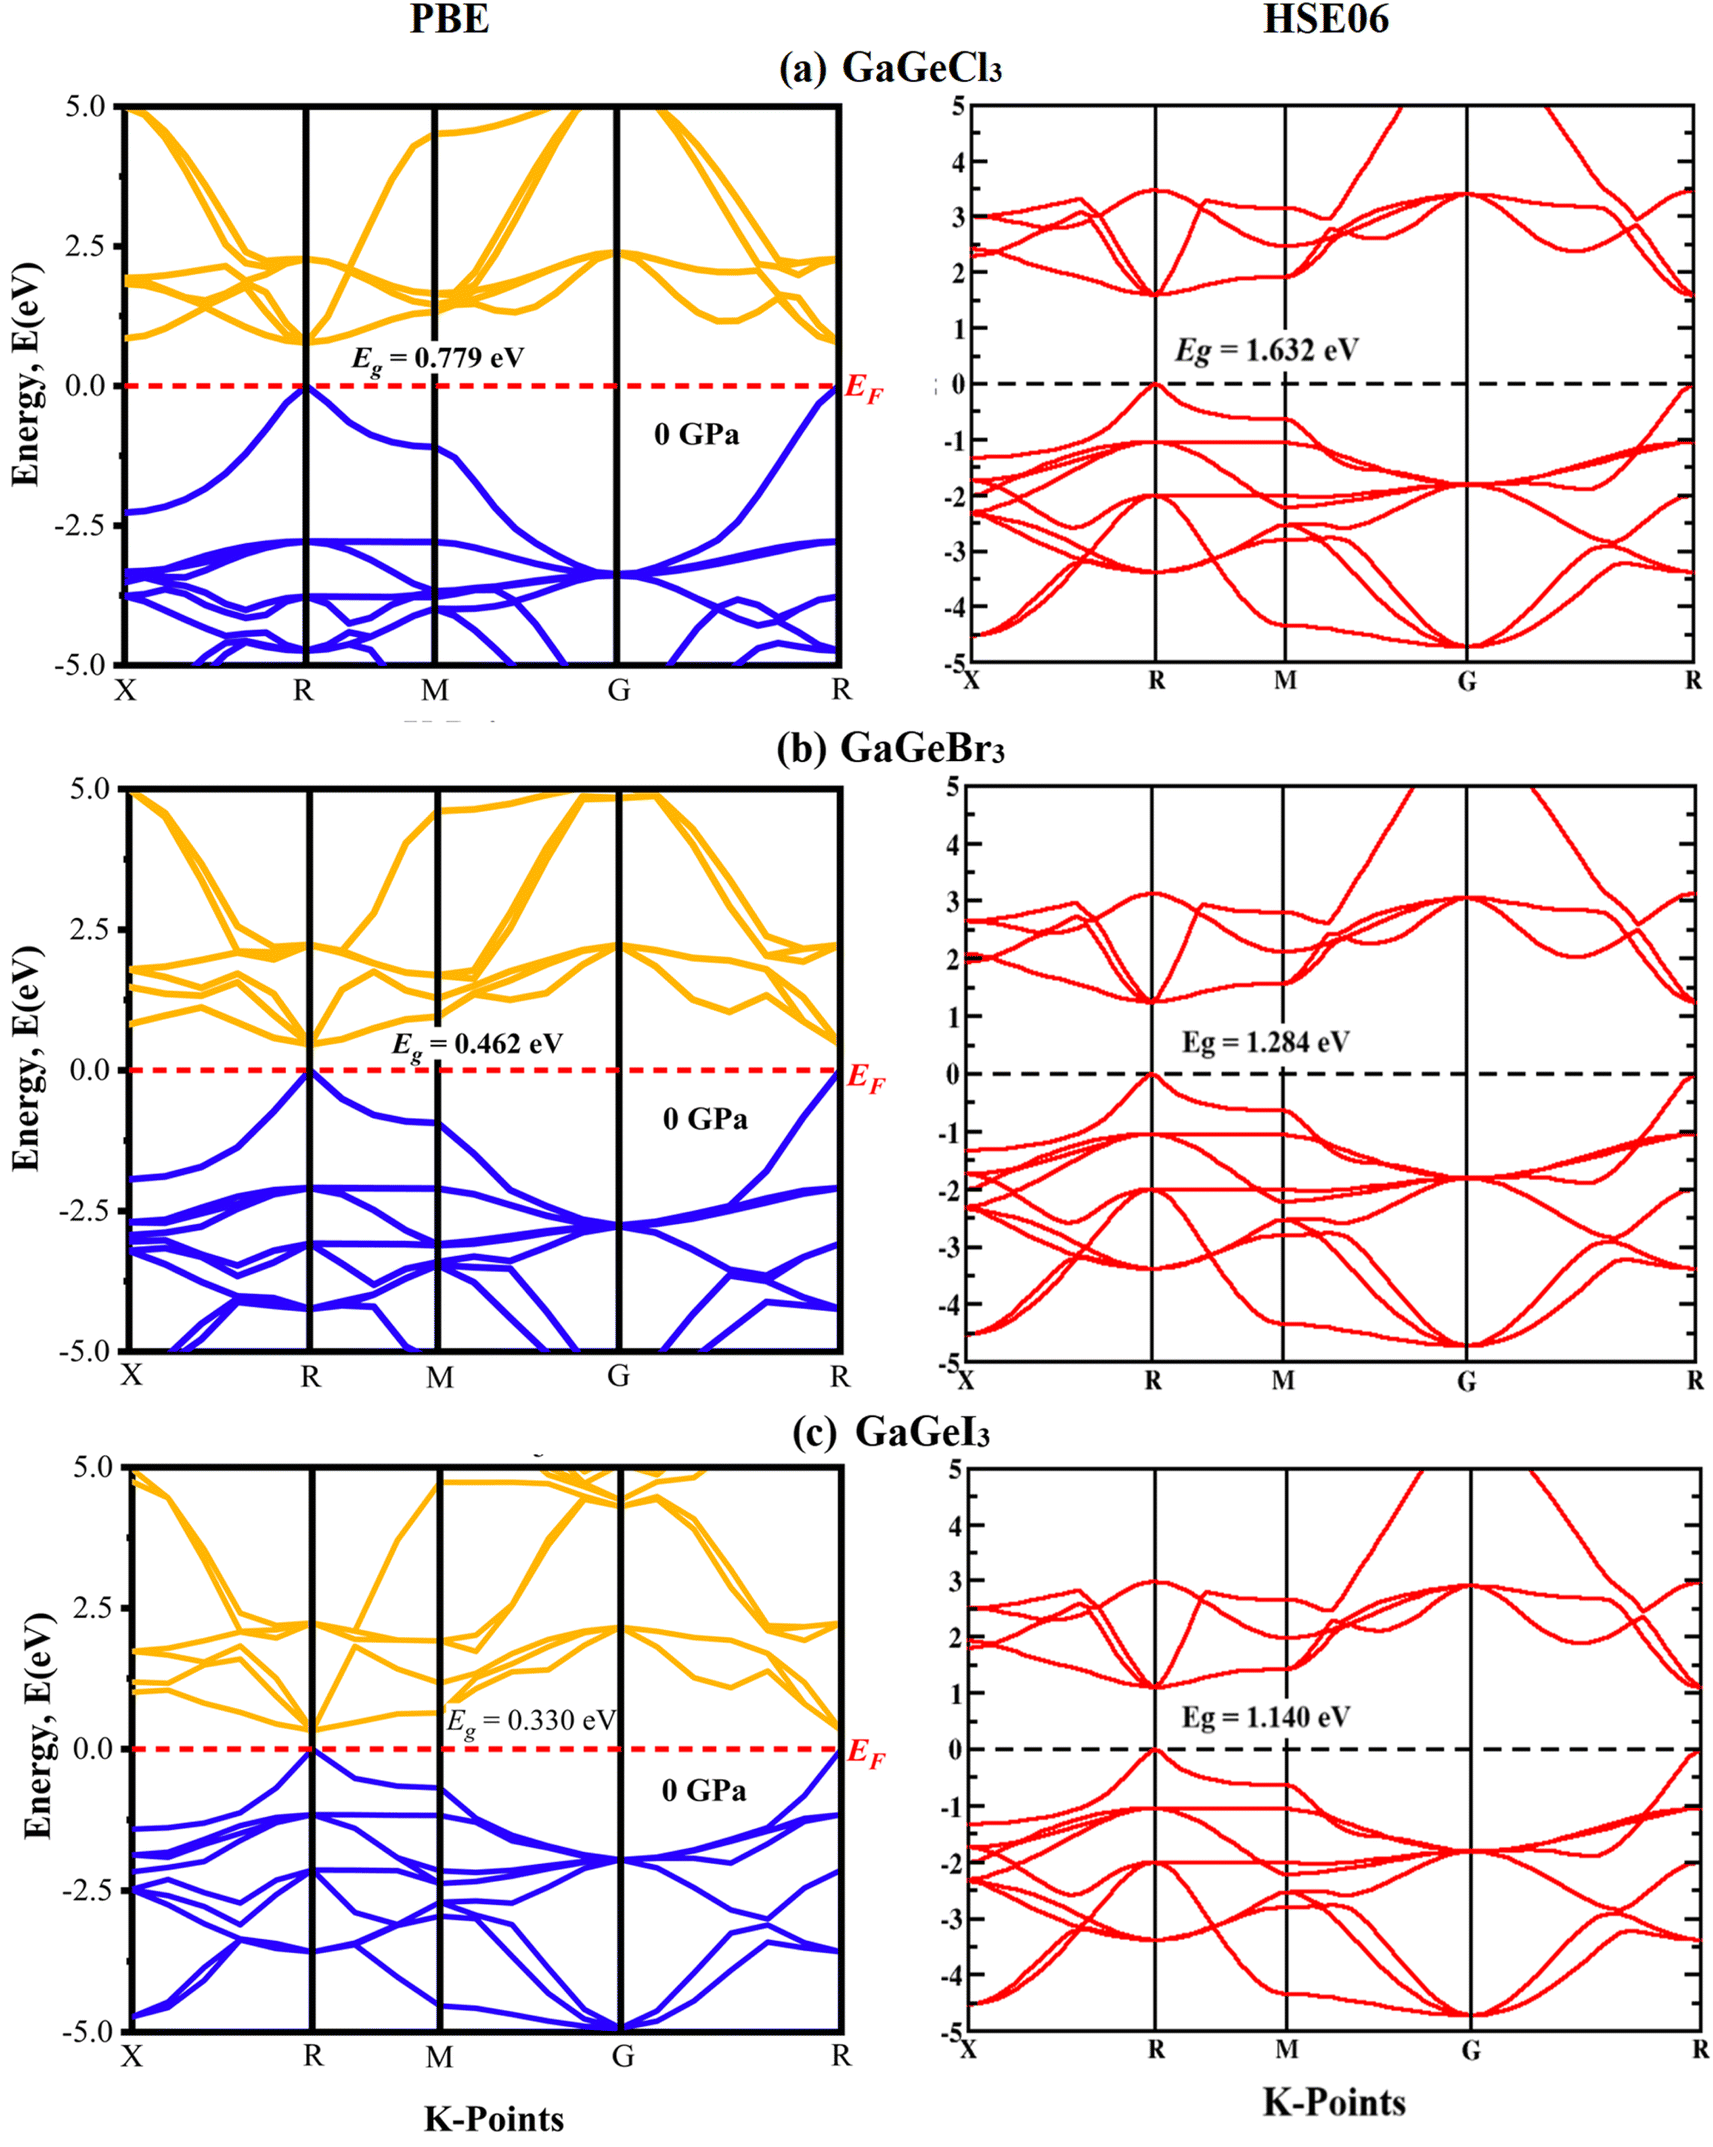 | ||
| Fig. 5 Calculated band dispersion diagram of (a) GaGeCl3 (b) GaGeBr3 and (c) GaGeI3 calculated by PBE and HSE06 functional. | ||
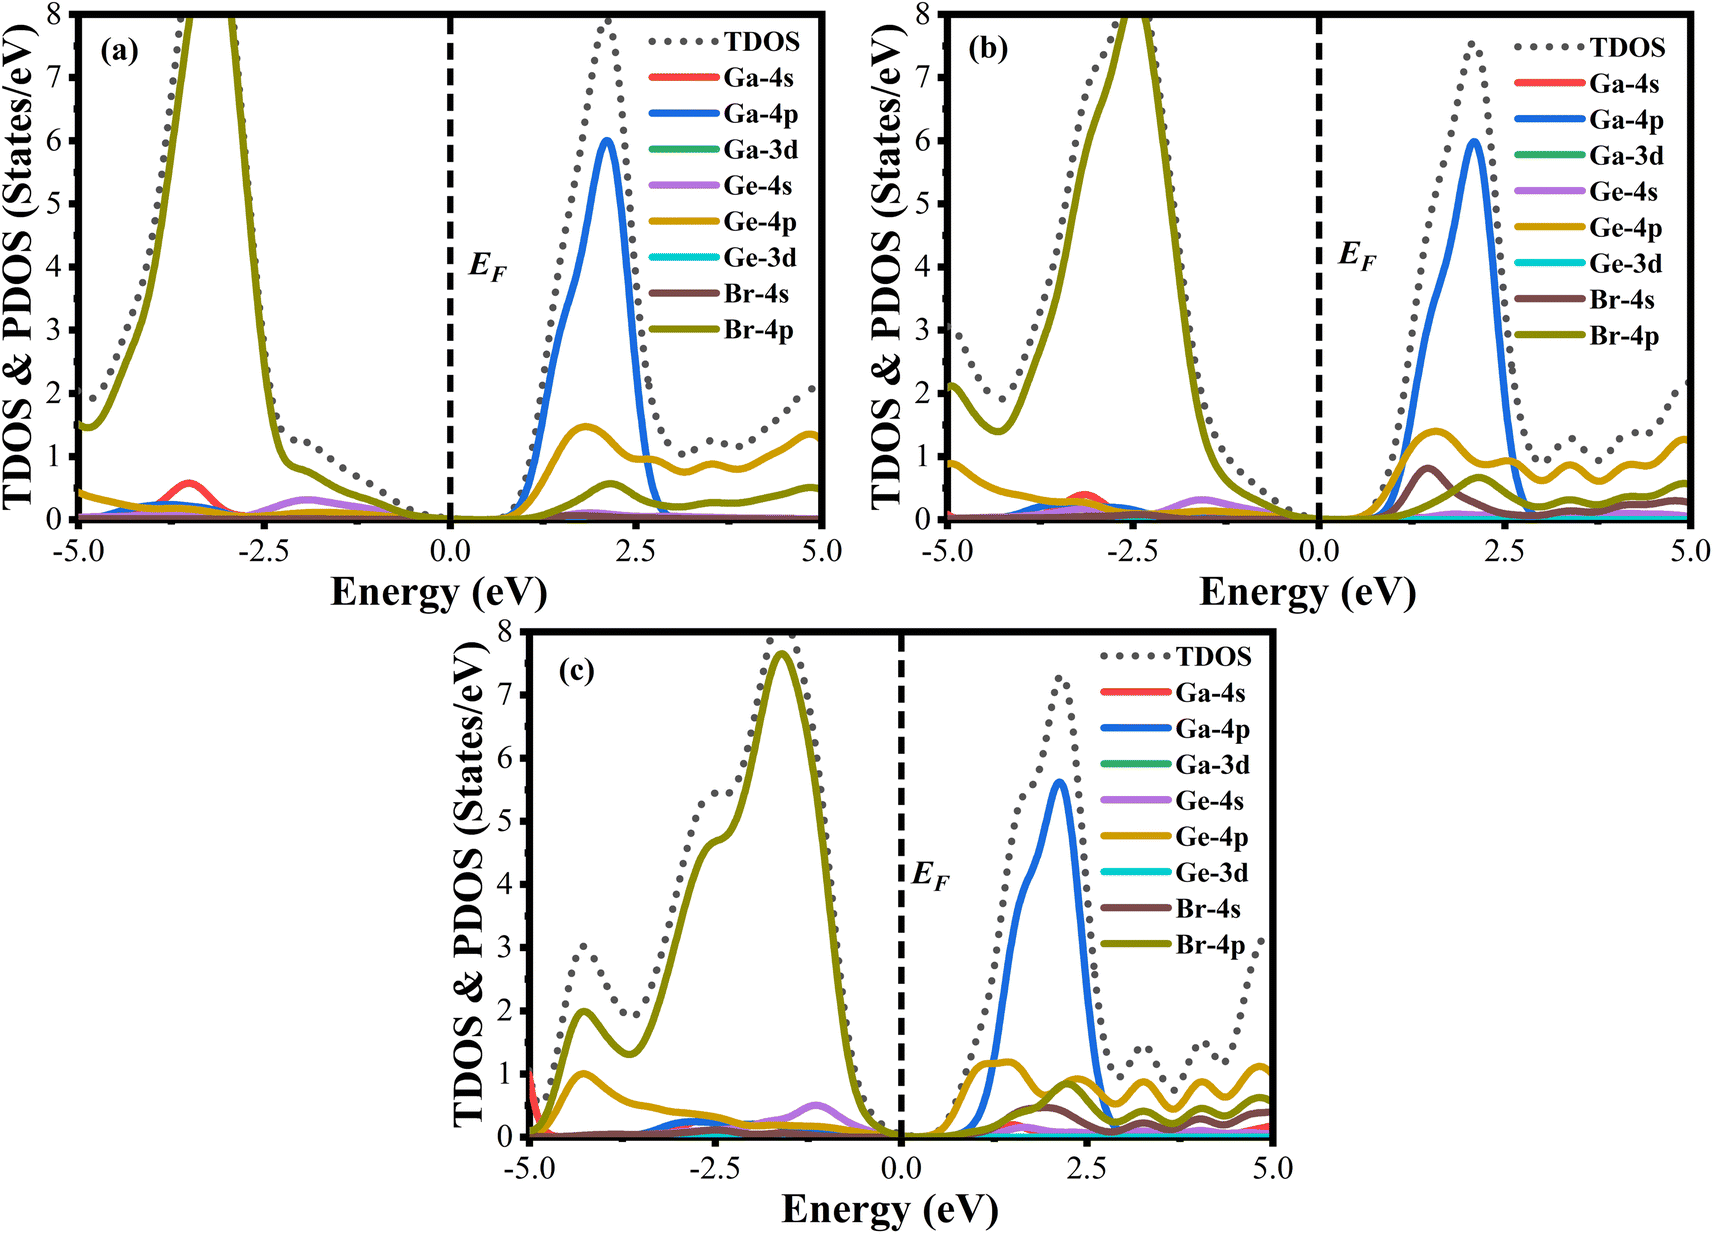 | ||
| Fig. 6 Total density of states (TDOS) and partial density of states (PDOS) of (a) GaGeCl3, (b) GaGeBr3, and (c) GaGeI3. | ||
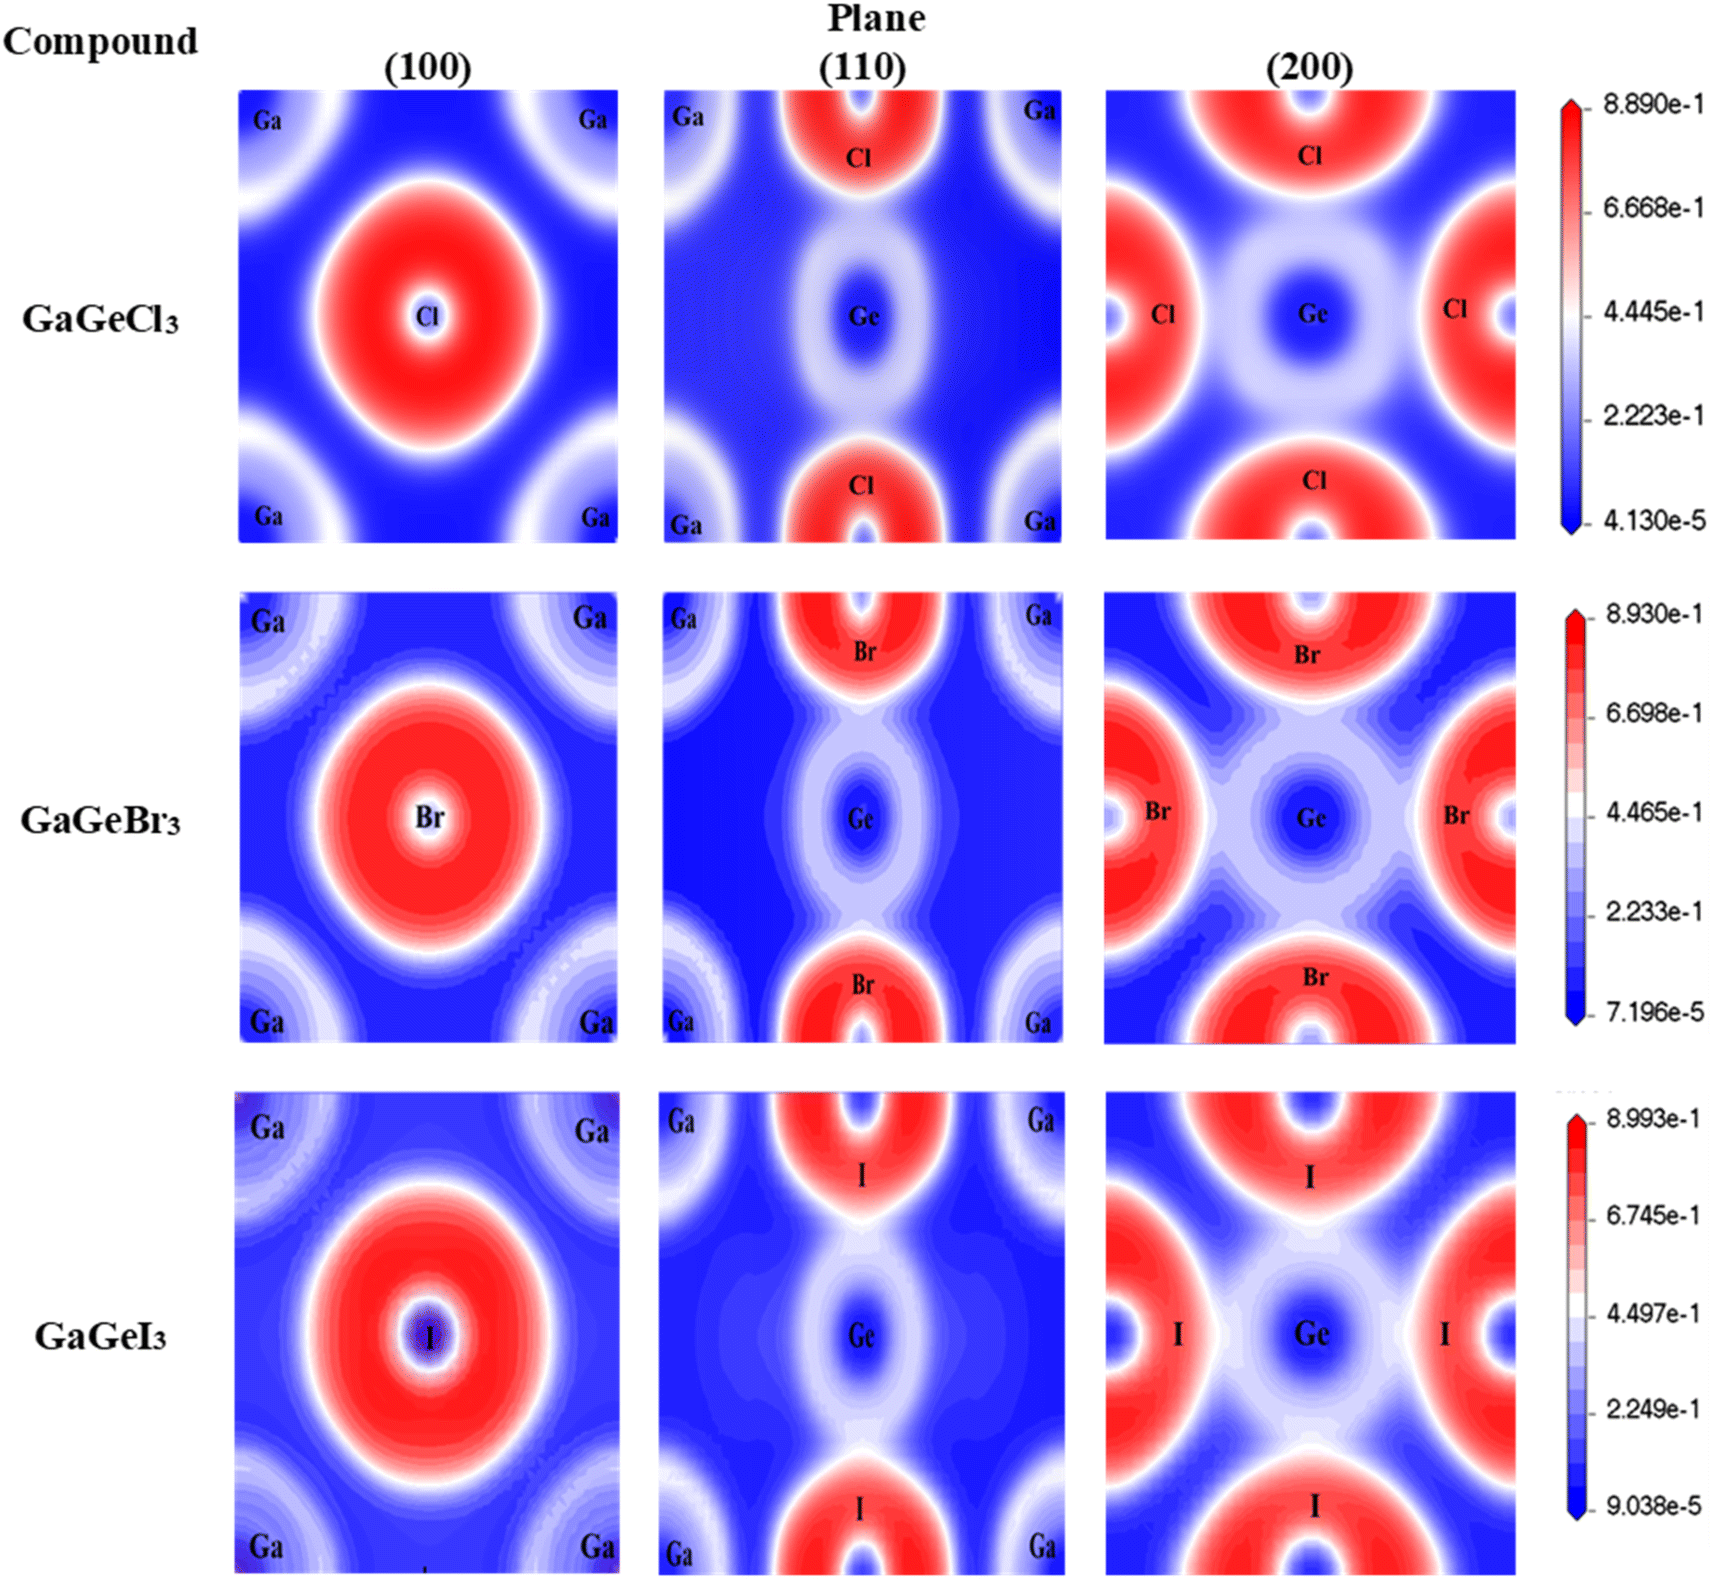 | ||
| Fig. 7 Mapping of Electron Localization Function (ELF) of GaGeX3 (X = CL, Br, and I) along (100), (110), and (200) planes. | ||
3.4 Optical properties
Because of their exceptional optical properties, metal halide perovskites have attracted a lot of attention from scientists, especially in the field of photovoltaic cells and optoelectronic devices. The assessment of materials' performance in solar cells and optoelectronic devices is mostly dependent on critical factors, one of which is their optical properties. This section addresses the optical characteristics of GaGeX3 (X = Cl, Br, I), including the extinction coefficient, conductivity, reflectivity, real and imaginary portions of the dielectric function, absorption coefficient, and refractive index for different applications.Of all the optical characteristics, the dielectric function is the most important one for a given material. Also, the dielectric function strongly connected with electronic band structure since contributions of the optical transitions to the dielectric function involve electron movements across different energy bands. For example, if the incoming photon energy matches the band gap energy, photon can excite electron from the VB to the CB.58 It is necessary to determine the dielectric function first to examine other optical characteristics. The dielectric function is commonly expressed as ε(ω) = ε1(ω) + ε2(ω), where ε1(ω), and ε2(ω) stand for the dielectric function's real and imaginary components, respectively. The Kramer–Kronig connection is used to determine the real component of the dielectric function, which has the following expression:59
The value of ε1(ω) at 0 eV is referred to as the static dielectric function. It is an important metric for optoelectronic device efficiency. A material's low Eb (exciton binding energy) and decreased charge carrier recombination rate are indicated by a high static dielectric constant in that material. The real part of dielectric function of GaGeX3 (X = Cl, Br, and I) is shown in Fig. 8(a). The static dielectric constant of GaGeCl3 is 7.34, as can be shown in Fig. 8(a). On the other hand, the static dielectric constant value steadily rises when Cl is substituted by Br, or I. In particular, 9.86, and 14 are the static dielectric constants for NaGeBr3, and NaGeI3, respectively. Among the three compounds, GaGeI3 has the largest static dielectric constant value, which lowers the Eb and the rate of charge carrier recombination. For this reason, GaGeI3 performs better in solar cell applications in the photovoltaic industry. Fig. 8(a) also shows that GaGeCl3, GaGeBr3, and GaGeI3 exhibits negative value in the energy range of 12.6–19.7 eV, 10.4–15.9 eV, and 7.65–15.2 eV respectively, where they behave like metallic material and exhibit high reflectivity.
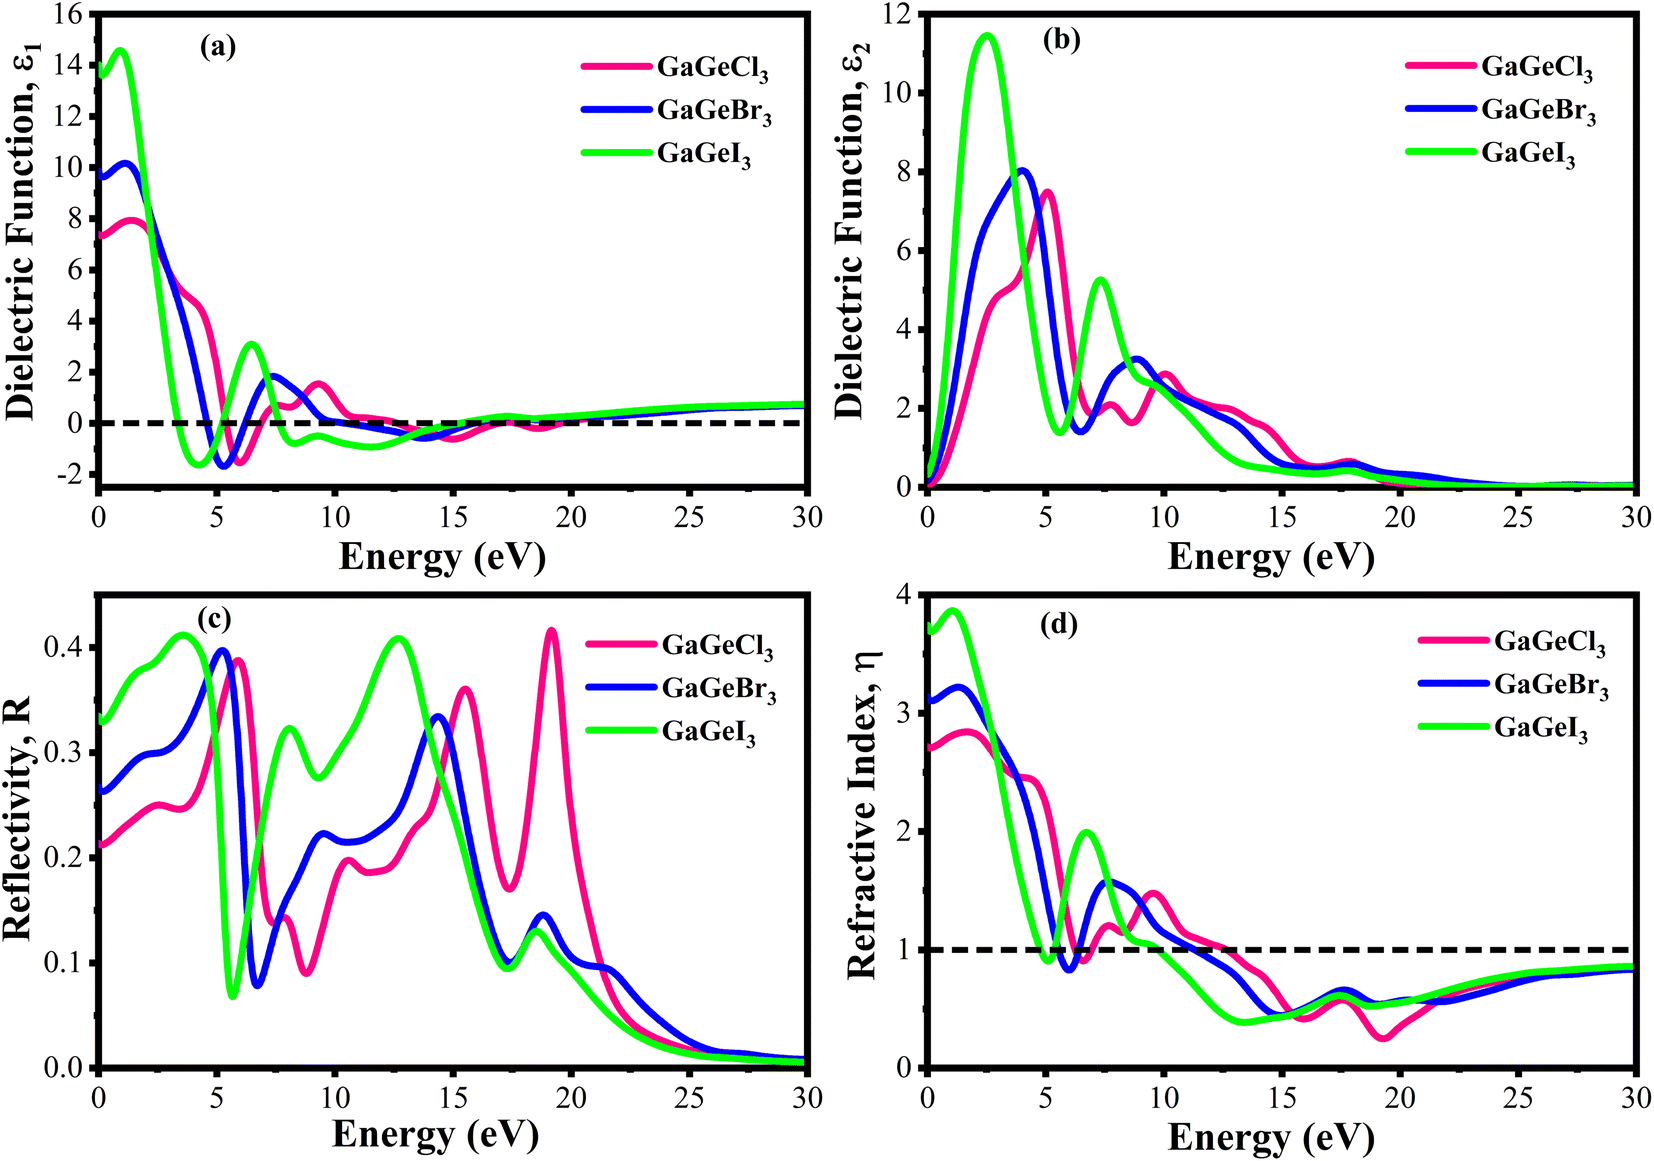 | ||
| Fig. 8 Calculated dielectric function (a) real part, (b) imaginary part, (c) reflectivity, and (d) refractive index of GaGeX3 (X = Cl ,Br, and I). | ||
The real transition between the occupied and unoccupied electronic states may be used to calculate the imaginary dielectric constant (ε2), and it can be expressed as:
The ε2(ω) is a crucial parameter, as the absorption characteristics of a material are contingent upon it. It is significantly influenced by the band structure of the material. Fig. 8(b) displays the fluctuations of ε2(ω) in the energy range of 0 eV and 3 eV. It is clear from Fig. 8(b) that GaGeCl3 exhibits two prominent peaks, the largest of which is at 5.13 eV and the other at 10.1 eV. On the other hand, the peaks move into lower energy areas and become more intense when a more electronegative halogen X (Br and I) replaces Cl. In particular, for GaGeBr3 and GaGeI3, the largest peaks are seen at 4.01 eV and 2.61 eV, respectively. The illustration is further evident that the dielectric function spectra edge shifts towards the lower energy region from Cl to I, reaffirming that the band gap diminishes with increasing electronegativity of halogen X (Cl, Br, and I).
The optical characteristic of reflectance plays a crucial role in photovoltaic applications. An increased reflection in the visible spectrum adversely influences solar efficiency. The energy band gap and reflectivity are related properties that depend on how light interacts with a substance. Metals, for instance, exhibit high reflectivity because their electrons can readily absorb and re-emit light due to their zero band gap. Since insulators have wide band gaps and electrons find it difficult to move to higher energy levels, they have low reflectivity.58 Fig. 8(c) demonstrates the reflectivity (R) spectrum of GaGeX3(X = Cl, Br, and I). As can be seen in Fig. 8(c), GaGeCl3 exhibits a very low reflectance of around 0.22 at 0 eV. However, the reflectance rises to 0.27 and 0.34 for GaGeBr3 and GaGeI3, respectively, when Cl is replaced with Br and I. Moreover, Fig. 8(c) shows that GaGeX3 (X = Cl, Br, and I) has higher reflectivity in the visible range, and GaGeI3 has the greatest level. The increased visual reflectance of GaGeI3 reduces its usefulness as a solar material. Therefore, more investigation is needed to reduce the reflectivity of GaGeI3 and improve its photovoltaic efficiency. Furthermore, GaGeX3 (X = Cl, Br, and I) has favorable reflectivity in the UV range, as shown in Fig. 8(c), indicating their possible application as coating materials to reduce solar heating in the UV range. Alongside this, GaGeI3 is predicted as a good material for applications involving UV shielding due to its wider reflectance spectrum in the UV area.
Fig. 8(d) shows the spectrum of refractive index. Notably, a gradual decline with increasing photon energy is demonstrated in Fig. 8(d), and the largest peak is recorded at 0 eV. Furthermore, the static refractive index of GaGeCl3 is 2.72, which is shown in Fig. 8(d). The trend shows a gradual rise from Cl to I, with GaGeBr3 and GaGeI3 reaching values of 3.11 and 3.7, respectively. It is clear by looking at CsCdX3 (X = Cl, Br, and I) that these compounds have the highest refractive index in the infrared area and the lowest in the ultraviolet. When refractive index goes below unity, the group velocity of the incident photon becomes higher than light velocity, and this characteristic is familiar as superluminal. Among the compounds, CsCdI3 has the greatest refractive index at 0 eV, which makes it suitable for use in waveguide applications.60
The efficiency of solar cells and other optoelectronic devices is significantly influenced by the absorption coefficient (α), as it conveys important details regarding the absorbing capability of a certain material. It is one of the numerous optical characteristics whose performance is significantly affected by it. For effective absorption, the incoming photons energy must meet or greater than the band gap energy. Besides, the probability of absorption is higher when there is a large density of states present at any given energy level.58 Fig. 9(a and b) shows the fluctuation of α as a function of photon energy. Four prominent peaks within the energy range of 0–30 eV are displayed for each compound. In Fig. 9(a), it is observed that GaGeCl3 reaches its maximum peak at 14.7 eV. Conversely, when Cl is substituted with Br and I, a redshift occurs, and the highest peaks are observed at 13.5 eV and 11.4 eV, respectively, for GaGeBr3 and GaGeI3. Additionally, GaGeI3 is the most absorption-efficient material among the three materials in the visible region, as seen in Fig. 9(b). It suggests that GaGeI3 is a better candidate than the other two for use as a solar cell material. Overall, all compounds can be used in multijunction solar cell due to their high absorbtion coefficient.
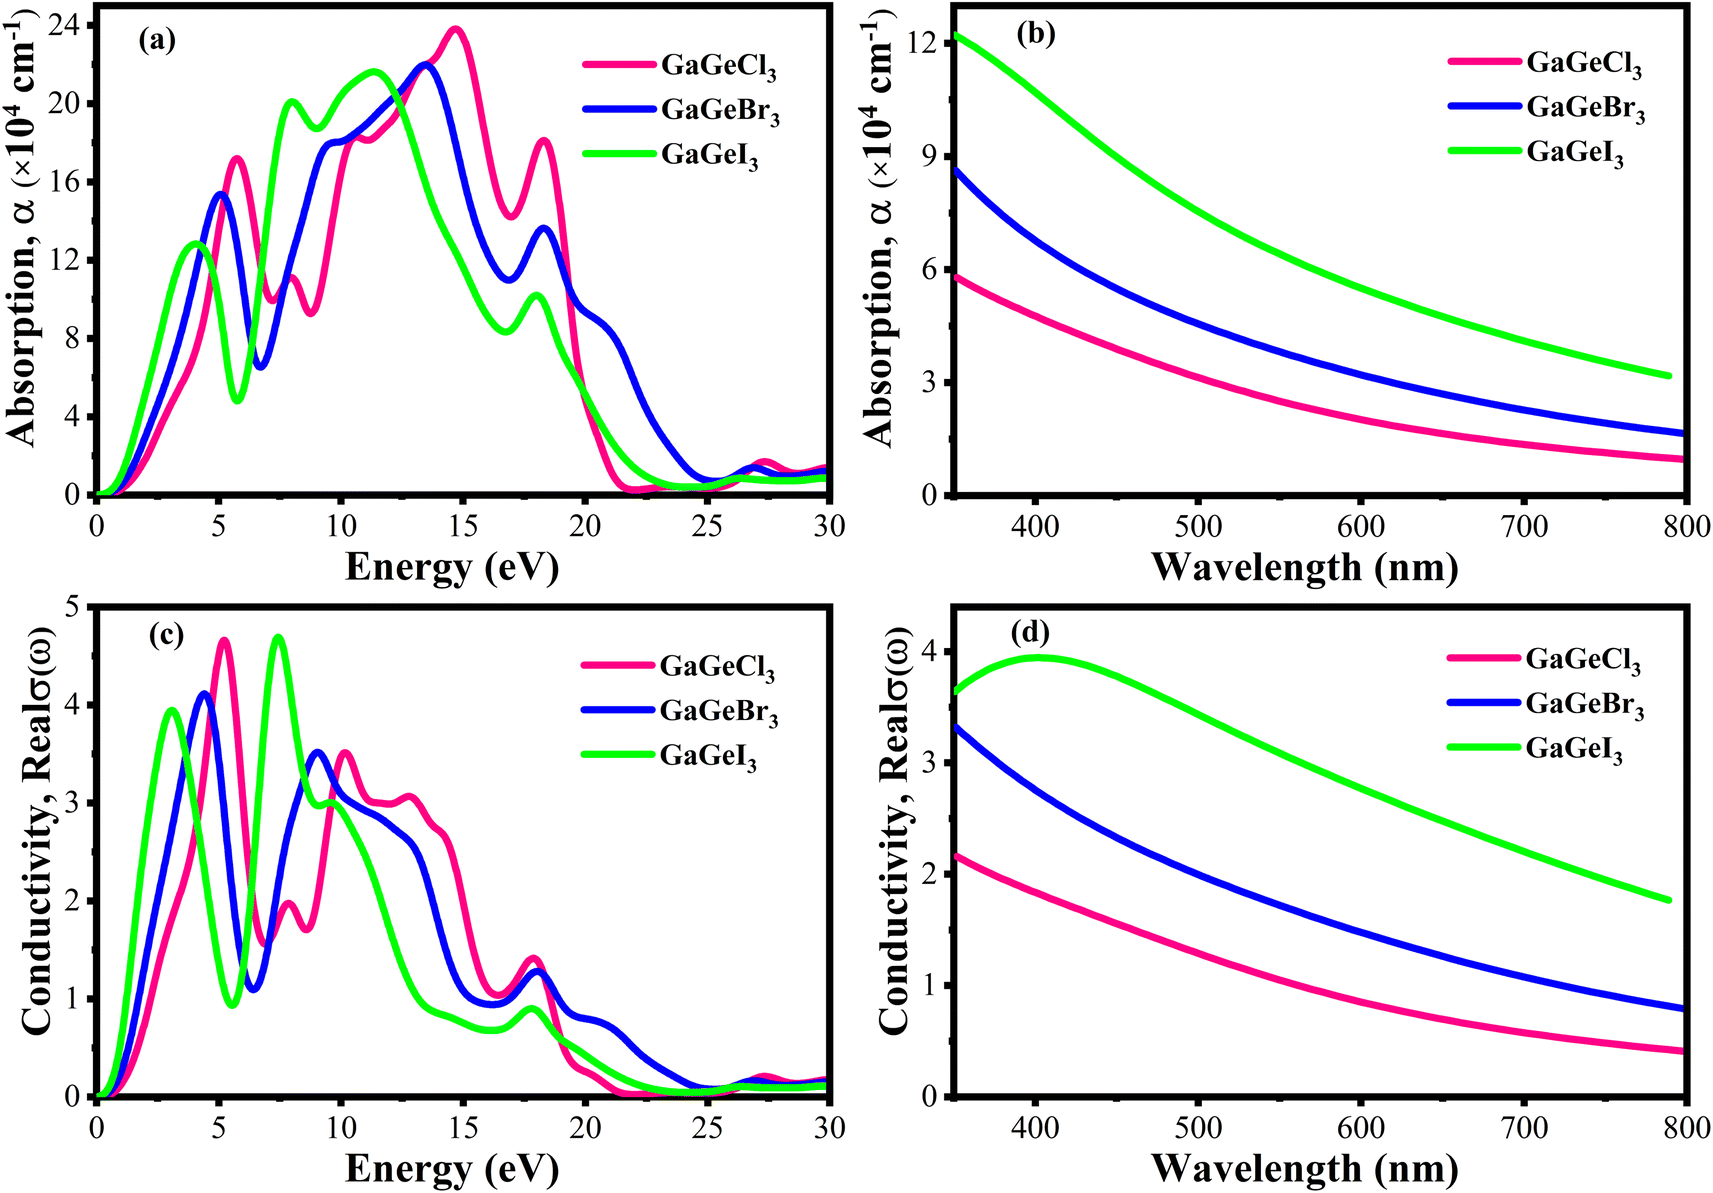 | ||
| Fig. 9 (a) Absorption coefficient vs. energy (b) absorption coefficient vs. wavelength (c) conductivity vs. energy, and (d) conductivity vs. wavelength, of GaGeX3 (X = Cl, Br, and I). | ||
A material's photoconductivity (σ) is used to measure how many photons are able to pass through it. Also, conductivity is directly related with electronic band structure such as energy gap between VB and CB, presence of free charge carrier of these bands. Therefore, large band gap shows lower conductivity and overlapping or tightly binded band shows higher conductivity.58 Fig. 9(c and d) shows the conductivity spectra of GaGeX3 (X = Cl, Br, and I), which are comparable to the absorption spectrum of GaGeX3(X = Cl, Br, and I), as they are obtained from the absorption spectra. Fig. 9(d) illustrates that GaGeI3 has a higher photoconductivity in the visible spectrum at almost 3.95 fs−1, while GaGeBr3 and GaGeCl3 have 3.44 fs−1 and 2.21 fs−1, respectively. The conductivity spectra of GaGeX3 (X = Cl, Br, and I) with two notable peaks in the 0–30 eV energy region are shown in Fig. 9(c). GaGeCl3 exhibits these peaks at 5–5.5 eV and 9.5–10.5 eV, having the largest peak at 5.26 eV. A redshift happens when the higher electronegativity halogens X (Br and I) are substituted for Cl. Therefore, GaGeBr3 shows prominent peaks at 4–5 eV and 8.5–9.5 eV respectively, with the highest peak occurring at 4.47 eV. Conversely, GaGeI3 has two major peaks at 2.5–3.5 eV and 7–8 eV respectively, with the most intense peak taking place at 7.44 eV.
Fig. 10(a) displays the loss functions of our studied compounds. Energy regions in an atom where electrons are usually not restricted to their lattice locations and exhibit a plasma frequency when illuminated are described by the loss function of energy. It is evident from Fig. 8(c) and 10(a) that the reflectivity of GaGeX3 (X = Cl, Br, and I) abruptly decreases at the locations where the loss function peaks. Additionally, Fig. 10(b) displays the extinction coefficient K(ω) of GaGeX3 (X = Cl, Br, and I). The illustrations (Fig. 8(b), and 10(b)) show that the extinction coefficient spectrum and ε2(ω) have similar patterns. In particular, GaGeCl3 has the lowest value for K(ω), and this value rises when Br and I are substituted for Cl. Additionally, when bigger halogens, X (Br and I), replace Cl, the peaks in the spectrum move towards the lower energy region.
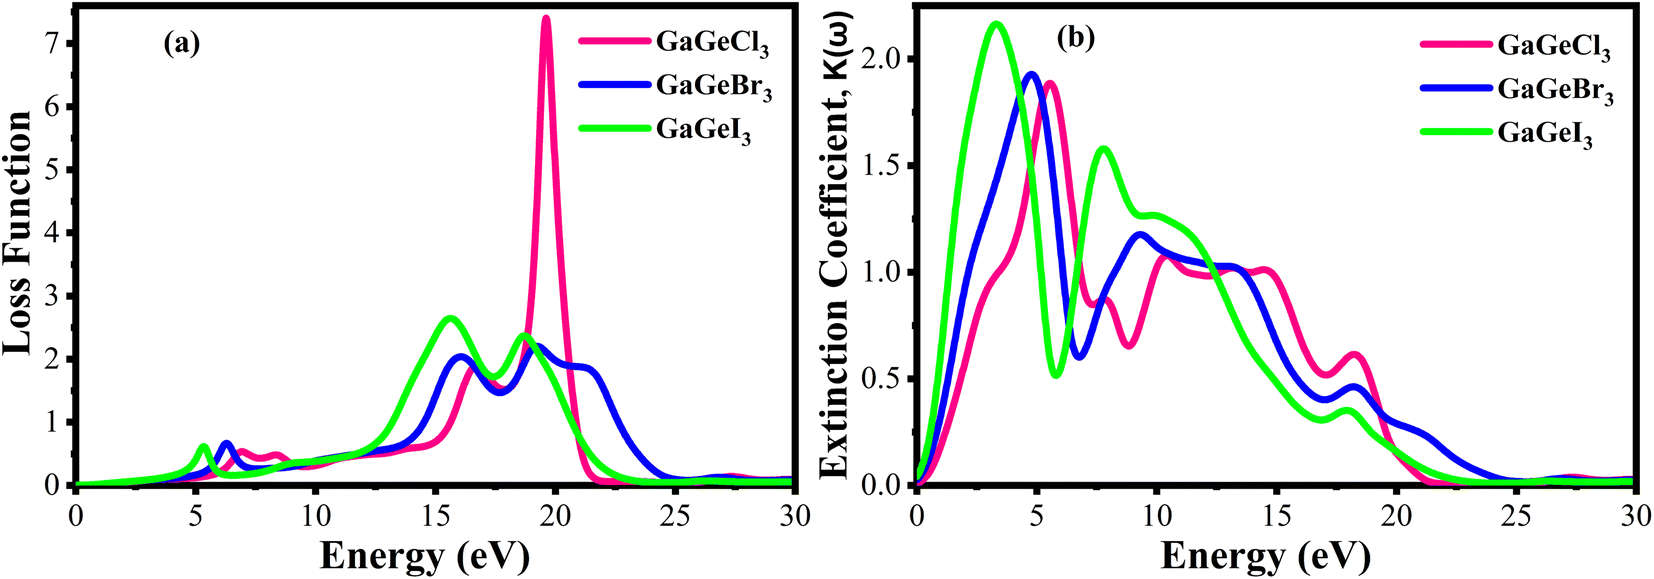 | ||
| Fig. 10 Calculated (a) loss function vs. energy, and (b) extinction coefficient vs. energy of GaGeX3 (X = Cl, Br, and I). | ||
4. Conclusion
The current study used the DFT-based FP-LAPW approach to thoroughly examine the structural, elastic, and optical characteristics of cubic lead-free halide perovskites GaGeX3 (Cl, Br, and I). According to formation energy, Born stability criteria, and phonon analysis, all of our interested compounds are stable. GaGeI3 has the greatest cell volume and lattice parameter among these three compounds, whereas GaGeCl3 has the lowest. Moreover, GaGeX3 (X = Cl, Br, and I) are ductile, and GaGeBr3 shows the highest level of ductility, which is supported by Cauchy pressure, Poisson's and Pugh's ratios. In addition to higher ductility, GaGeBr3 shows superior machinability. Furthermore, the band structure reveals that all three compounds are direct bandgaps along the R–R direction, and GaGeCl3 shows the highest bandgap among them. However, by simply adjusting the halogen levels, these material's band gaps can be modified, which makes them appropriate for multijunction solar cell applications. Compared to the other compounds, GaGeI3 has greater light absorption, stronger conductivity in visible areas, a higher dielectric constant, which denotes a lower exciton binding energy, Eb, and a lower recombination rate. The comprehensive optical, electronic, and mechanical properties of these materials render them suitable for photovoltaic applications, marking a significant contribution to the field of renewable energy technologies. The study not only advances our understanding of halide perovskites but also demonstrates their practical potential in the development of next-generation electronic devices.Data availability
The datasets and computer codes are available upon request from the authors.Author contributions
Md. Amran Sarker: investigation, methodology, data curation and analysis and interpretation, writing the original draft. Md Mehedi Hasan: investigation, methodology, data curation, graph ploting. Md. Al Momin: investigation, methodology, writing the original draft. Ahmad Irfan: review & editing. Md. Rasidul Islam: bandgap calculation by HSE06 functional, phonon analysis. Ahmed Sharif: resources allocation, Supervision, writing – review & editing.Conflicts of interest
The authors declare no conflict of interest.Acknowledgements
The authors express their sincere gratitude to the Central Computer Center, KUET, Bangladesh for providing the high-performance computing resources used in this research. The authors would like to express their gratitude to the Research and Innovation Centre for Science and Engineering (RISE), Bangladesh University of Engineering and Technology (BUET), Dhaka-1000, Bangladesh for funding through the RISE Internal Research Grant (2022-01-001). A. Irfan extends his appreciation to the Deanship of Scientific Research at King Khalid University for funding through the Small Groups Research Project under grant number (RGP1/38/44).References
- H. S. Jung and N. G. Park, Small, 2015, 11, 10–25 CrossRef CAS PubMed.
- S. Yun, Y. Qin, A. R. Uhl, N. Vlachopoulos, M. Yin, D. Li, X. Han and A. Hagfeldt, Energy Environ. Sci., 2018, 11, 476–526 RSC.
- P. P. Boix, K. Nonomura, N. Mathews and S. G. Mhaisalkar, Mater. Today, 2014, 17, 16–23 CrossRef CAS.
- M. K. Assadi, S. Bakhoda, R. Saidur and H. Hanaei, Renewable Sustainable Energy Rev., 2018, 81, 2812–2822 CrossRef CAS.
- J. P. Correa-Baena, M. Saliba, T. Buonassisi, M. Grätzel, A. Abate, W. Tress and A. Hagfeldt, Science, 2017, 358, 739–744 CrossRef CAS PubMed.
- I. Hussain, H. P. Tran, J. Jaksik, J. Moore, N. Islam and M. J. Uddin, Emergent Mater., 2018, 1, 133–154 CrossRef CAS.
- H. S. Kim, J. Y. Seo and N. G. Park, ChemSusChem, 2016, 9, 2528–2540 CrossRef CAS PubMed.
- M. A. Green, A. Ho-Baillie and H. J. Snaith, Nat. Photonics, 2014, 8, 506–514 CrossRef CAS.
- Y. Sun, W. Zhang, H. Chi, Y. Liu, C. L. Hou and D. Fang, Renewable Sustainable Energy Rev., 2015, 43, 973–980 CrossRef CAS.
- A. M. Humada, M. Hojabri, S. Mekhilef and H. M. Hamada, Renewable Sustainable Energy Rev., 2016, 56, 494–509 CrossRef.
- T. D. Lee and A. U. Ebong, Renewable Sustainable Energy Rev., 2017, 70, 1286–1297 CrossRef CAS.
- P. K. Nayak, S. Mahesh, H. J. Snaith and D. Cahen, Nat. Rev. Mater., 2019, 4, 269–285 CrossRef CAS.
- M. K. Hossain, M. S. Uddin, G. F. I. Toki, M. K. A. Mohammed, R. Pandey, J. Madan, M. F. Rahman, M. R. Islam, S. Bhattarai, H. Bencherif, D. P. Samajdar, M. Amami and D. K. Dwivedi, RSC Adv., 2023, 13, 23514–23537 RSC.
- M. K. Hossain, S. Bhattarai, A. A. Arnab, M. K. A. Mohammed, R. Pandey, M. H. Ali, M. F. Rahman, M. R. Islam, D. P. Samajdar, J. Madan, H. Bencherif, D. K. Dwivedi and M. Amami, RSC Adv., 2023, 13, 21044–21062 RSC.
- M. R. Islam, Y. Wu, K. Liu, Z. Wang, S. Qu and Z. Wang, Adv. Mater. Interfaces, 2022, 9, 2101144 CrossRef CAS.
- P. Roy, N. Kumar Sinha, S. Tiwari and A. Khare, Sol. Energy, 2020, 198, 665–688 CrossRef CAS.
- J. Y. Kim, J. W. Lee, H. S. Jung, H. Shin and N. G. Park, Chem. Rev., 2020, 120, 7867–7918 CrossRef CAS PubMed.
- M. K. Hossain, G. F. I. Toki, I. Alam, R. Pandey, D. P. Samajdar, M. F. Rahman, M. R. Islam, M. H. K. Rubel, H. Bencherif, J. Madan and M. K. A. Mohammed, New J. Chem., 2023, 47, 4801–4817 RSC.
- H. Min, D. Y. Lee, J. Kim, G. Kim, K. S. Lee, J. Kim, M. J. Paik, Y. K. Kim, K. S. Kim, M. G. Kim, T. J. Shin and S. Il Seok, Nature, 2021, 598, 444–450 CrossRef CAS PubMed.
- M. R. Islam, A. S. M. J. Islam, S. K. Mitro, M. R. Hasan Mojumder, B. K. Moghal, S. Ahmad, S. Roy and M. Z. Islam, J. Phys. Chem. Solids, 2022, 170, 110919 CrossRef CAS.
- J. S. Manser, M. I. Saidaminov, J. A. Christians, O. M. Bakr and P. V. Kamat, Acc. Chem. Res., 2016, 49, 330–338 CrossRef CAS PubMed.
- U. G. Jong, C. J. Yu, G. C. Ri, A. P. McMahon, N. M. Harrison, P. R. F. Barnes and A. Walsh, J. Mater. Chem. A, 2018, 6, 1067–1074 RSC.
- S. Chatterjee and A. J. Pal, J. Mater. Chem. A, 2018, 6, 3793–3823 RSC.
- R. Ali, Z. G. Zhu, Q. B. Yan, Q. R. Zheng, G. Su, A. Laref, C. S. Saraj and C. Guo, ACS Appl. Mater. Interfaces, 2020, 12, 49636–49647 CrossRef CAS PubMed.
- M. K. Hossain, G. F. I. Toki, A. Kuddus, M. H. K. Rubel, M. M. Hossain, H. Bencherif, M. F. Rahman, M. R. Islam and M. Mushtaq, Sci. Rep., 2023, 13, 1–24 CrossRef PubMed.
- W. S. Yang, J. H. Noh, N. J. Jeon, Y. C. Kim, S. Ryu, J. Seo and S. Il Seok, Science, 2015, 348, 1234–1237 CrossRef CAS PubMed.
- S. Bouhmaidi, A. Marjaoui, A. Talbi, M. Zanouni, K. Nouneh and L. Setti, Comput. Condens. Matter., 2022, 31, e00663 CrossRef.
- M. K. Hossain, G. F. I. Toki, D. P. Samajdar, M. Mushtaq, M. H. K. Rubel, R. Pandey, J. Madan, M. K. A. Mohammed, M. R. Islam, M. F. Rahman and H. Bencherif, ACS Omega, 2023, 8, 22466–22485 CrossRef CAS PubMed.
- L. J. Chen, RSC Adv., 2019, 9, 33847 RSC.
- M. R. Islam, M. R. H. Mojumder, R. Moshwan, A. S. M. J. Islam, M. A. Islam, M. S. Rahman and M. H. Kabir, ECS J. Solid State Sci. Technol., 2022, 11, 033001 CrossRef CAS.
- T. Ye, X. Wang, K. Wang, S. Ma, D. Yang, Y. Hou, J. Yoon, K. Wang and S. Priya, ACS Energy Lett., 2021, 6, 1480–1489 CrossRef CAS.
- S. J. Clark, M. D. Segall, C. J. Pickard, P. J. Hasnip, M. I. J. Probert, K. Refson and M. C. Payne, Z. Kristallog., 2005, 220, 567–570 CAS.
- M. S. Daw and M. I. Baskes, Phys. Rev. Lett., 1983, 50, 1285 CrossRef CAS.
- W. Kohn, Phys. Rev. Lett., 1996, 76, 3168 CrossRef CAS PubMed.
- M. D. Segall, P. J. D. Lindan, M. J. Probert, C. J. Pickard, P. J. Hasnip, S. J. Clark and M. C. Payne, J. Phys.: Condens. Matter, 2002, 14, 2717 CrossRef CAS.
- J. P. Perdew, K. Burke and M. Ernzerhof, Phys. Rev. Lett., 1996, 77, 3865–3868 CrossRef CAS PubMed.
- D. Vanderbilt, Phys. Rev. B: Condens. Matter Mater. Phys., 1990, 41, 7892 CrossRef PubMed.
- T. H. Fischer and J. Almlöf, J. Phys. Chem., 1992, 96, 9768–9774 CrossRef CAS.
- H. J. Monkhorst and J. D. Pack, Phys. Rev. B: Solid State, 1976, 13, 5188–5192 CrossRef.
- J. Kang, E. C. Lee and J. Chang, Phys. Rev. B: Condens. Matter Mater. Phys., 2003, 68, 054106 CrossRef.
- J. R. Liu, X. P. Wei, W. L. Chang and X. Tao, J. Phys. Chem. Solids, 2022, 163, 110600 CrossRef CAS.
- M. Husain, N. Rahman, M. Amami, T. Zaman, M. Sohail, R. Khan, A. A. Khan, S. A. Shah, Saeedullah, A. Khan, A. H. Reshak, N. H. Al-Shaalan, S. Alharthi, S. A. Alharthy, M. A. Amin and V. Tirth, Opt. Quantum Electron., 2023, 55, 1–16 CrossRef.
- H. Khan, M. Sohail, N. Rahman, R. Khan, M. Hussain, A. Ullah, A. Khan, A. Alataway, A. Z. Dewidar, H. O. Elansary and K. Yessoufou, Molecules, 2022, 27, 5264 CrossRef CAS PubMed.
- X. Zhang, X. P. Wei, J. Shen, Z. Y. Mei, L. L. Du and X. Tao, Mater. Today Commun., 2022, 33, 104650 CrossRef CAS.
- X. P. Wei, X. Zhang, J. Shen, W. L. Chang and X. Tao, Comput. Mater. Sci., 2022, 210, 111453 CrossRef CAS.
- Y. Pan and S. Chen, Vacuum, 2022, 198, 110898 CrossRef CAS.
- N. A. Teli and M. Mohamed Sheik Sirajuddeen, Phys. Lett. A, 2020, 384, 126793 CrossRef CAS.
- K. M. Hossain, M. Zahid Hasan and M. Lokman Ali, Results Phys., 2020, 19, 103337 CrossRef.
- F. Mouhat and F. X. Coudert, Phys. Rev. B: Condens. Matter Mater. Phys., 2014, 90, 224104 CrossRef.
- R. K. Sharme, M. R. Islam, M. A. Sarker, M. Solayman, M. Al Momin and M. R. Islam, Phys. B, 2024, 415785 CrossRef CAS.
- D. G. Pettifor, Mater. Sci. Technol., 1992, 8, 345–349 CrossRef CAS.
- P. Ravindran, L. Fast, P. A. Korzhavyi, B. Johansson, J. Wills and O. Eriksson, J. Appl. Phys., 1998, 84, 4891–4904 CrossRef CAS.
- Z. Sun, D. Music, R. Ahuja and J. M. Schneider, Phys. Rev. B: Condens. Matter Mater. Phys., 2005, 71, 193402 CrossRef.
- M. Solayman, M. R. Islam, M. A. Sarker, R. K. Sharme, M. Al Momin, M. R. Islam and A. A. Khan, Phys. Scr., 2023, 98, 125944 CrossRef.
- T. Ahmed, M. Roknuzzaman, A. Sultana, A. Biswas, M. S. Alam, M. Saiduzzaman and K. M. Hossain, Mater. Today Commun., 2021, 29, 102973 CrossRef CAS.
- Z. Sun, S. Li, R. Ahuja and J. M. Schneider, Solid State Commun., 2004, 129, 589–592 CrossRef CAS.
- X. P. Wei, L. L. Du, J. Shen, Z. Q. Sun, Z. M. Zhang, W. L. Chang and X. Tao, Mater. Sci. Semicond. Process., 2024, 169, 107856 CrossRef CAS.
- X. P. Wei, W. Sun, Y. L. Zhang, X. W. Sun, T. Song, T. Wang, J. L. Zhang, H. Su, J. B. Deng and X. F. Zhu, J. Solid State Chem., 2017, 247, 97–104 CrossRef CAS.
- S. Franzen, J. Phys. Chem. C, 2008, 112, 6027–6032 CrossRef CAS.
- M. Solayman, M. A. Sarker, M. Muntasir, R. K. Sharme and M. R. Islam, Opt. Mater., 2024, 148, 114699 CrossRef CAS.
| This journal is © The Royal Society of Chemistry 2024 |