 Open Access Article
A novel ultrasensitive chemiluminescence enzyme immunoassay by employment of a signal enhancement of horseradish peroxidase-luminol-hydrogen peroxide reaction for the quantitation of atezolizumab, a monoclonal antibody used for cancer immunotherapy
Ibrahim A. Darwish *a,
Mohammad A. H. Alia,
Mohammed S. Alsalhia and
Daohong Zhangb
aDepartment of Pharmaceutical Chemistry, College of Pharmacy, King Saud University, P.O. Box 2457, Riyadh 11451, Saudi Arabia. E-mail: idarwish@ksu.edu.sa; Fax: +966-114676220; Tel: +966-114677348
bCollege of Food Science and Engineering, Northwest A&F University, Yangling 712100, Shaanxi, China
First published on 11th March 2024
Abstract
This study describes, for the first time, the development and validation of a novel ultrasensitive chemiluminescence enzyme immunoassay (CLEIA) for the quantification of atezolizumab (ATZ), a monoclonal antibody approved by the FDA for treatment of different types of cancer. The assay involved the non-competitive binding of ATZ to its specific antigen (PD-L1 protein). The immune complex of PD-L1/ATZ formed on the internal surface of the plate wells was quantified by a novel chemiluminescence (CL)-producing horseradish peroxidase (HRP) reaction. The reaction employed a highly efficient CL enhancer for the HRP-luminol-hydrogen peroxide reaction which was 4-(imidazol-1-yl)phenol. The conditions of the CLEIA and its detection system were refined, and the optimum procedures were established. The CLEIA was validated in accordance with the guidelines of immunoassay validation for bioanalysis, and all the validation criteria were acceptable. The assay's limit of detection and limit of quantitation were 12.5 and 37.5 pg mL−1, respectively, with a working dynamic range of 25–800 pg mL−1. The assay enables the accurate and precise quantitation of ATZ in human plasma samples without any interferences from endogenous substances and/or the plasma matrix. The results of the proposed CLEIA were favourably comparable with those of a pre-validated enzyme-linked immunosorbent assay using a colorimetric detection system. The CLEIA is characterized by simple and high throughput features. The CLEIA is superior to the existing analytical methodologies for ATZ. The proposed CLEIA has a great value in the quantitation of ATZ in clinical settings for assessment of its pharmacokinetics, therapeutic drug monitoring, and refining the safety profile.
1. Introduction
The immunotherapy of cancer with immune checkpoint inhibitors (ICIs) is a novel attracting approach which has gained significant attention among oncologists. These ICIs are human (or humanized) monoclonal antibodies that function by obstructing the binding of immune checkpoint proteins to their partner proteins, thereby preventing the transmission of the “off” signal.1 Programmed cell death protein 1 (PD-1) is a surface protein found on immune cells that infiltrate tumors. The primary counterpart for the PD-1 protein is programmed death-ligand 1 (PD-L1), which is expressed on antigen-presenting cells and tumor cells. PD-1 and PD-L1 are immune checkpoint proteins that interact with each other to negatively regulate the body's adaptive immune response against tumors.2 The expression of PD-L1 allows tumor cells to evade detection by the immune system.2,3 As a result, immunotherapy using ICIs has been explored and proven to be a promising approach for treating various solid tumors.4,5 Treatment with monoclonal antibodies targeting the PD-1/PD-L1 pathway has revolutionized the management of advanced-stage cancers, such as melanoma, lung cancer, breast cancer, kidney cancer, and others.3–5Atezolizumab (ATZ) is a humanized monoclonal antibody that has been designed to specifically target PD-L1 and prevent its interaction with PD-1. This mechanism enables the immune system to identify and attack cancer cells.6 ATZ is produced by Genentech, Inc., a member of the Roche Group, and is marketed as TECENTRIQ® for intravenous infusion. The US Food and Drug Administration (FDA) has granted multiple approvals for ATZ in the treatment of various cancer types, including metastatic non-squamous non-small cell lung cancer,7–9 extensive-stage small cell lung cancer,10 unresectable locally advanced or metastatic triple-negative breast cancer,11 unresectable or metastatic melanoma,12 unresectable or metastatic alveolar soft part sarcoma,13 and locally advanced or metastatic urothelial carcinoma (bladder, ureter, and renal pelvis cancers).14 The recommended dosage of ATZ is 840–1200 mg administered intravenously over 60 minutes every 3 weeks until disease progression or unacceptable side effects occur. If the first infusion is well-tolerated, subsequent infusions may be delivered over 30 minutes. After intravenous administration, ATZ distributes into the extravascular space. The pharmacokinetic (PK) profile of ATZ is dose-dependent within the range of 1–20 mg kg−1, including a dose of 1200 mg administered every 3 weeks. Steady-state concentration of ATZ (above 6 μg mL−1) is achieved after 6 to 9 weeks of multiple doses, and the volume of distribution at steady state is 6.9 L. Being an antibody, ATZ undergoes minimal metabolism in the body and does not undergo hepatic metabolism. Its primary elimination occurs through proteolytic degradation, and the elimination half-life, which may vary among individuals, is typically around 27 days. Over time, ATZ clearance decreases, with an approximate mean maximal reduction of 17% from the baseline value.15
Despite the therapeutic benefits of ATZ, it is associated with significant adverse effects, including immune-related reactions (such as pneumonitis, hepatitis, colitis, endocrinopathies, myocarditis, and nephritis), infusion-related reactions (like fever, chills, and shortness of breath), infections, inability to taper corticosteroids, and potential harmful effects on embryos and fetuses when used during pregnancy. These adverse effects, along with the PK characteristics of ATZ, vary considerably among patients and exhibit known concentration-effect relationships.15 To ensure effective and safe therapy with ATZ, it is necessary to adjust the specific dosage and monitor the plasma concentrations in individual patients, aiming to improve outcomes and personalize patient care.16 Moreover, once the patent for ATZ expires, it is expected that different pharmaceutical companies will produce biosimilars and/or biobetters of ATZ. Therefore, there is a pressing need for efficient assays to accurately quantify ATZ and its biosimilar products. These assays are essential to ensure the quality of ATZ's pharmaceutical formulations and to assess its concentrations in biological specimens for PK studies and therapeutic drug monitoring (TDM) purposes.17
The available techniques for quantifying ATZ in plasma are currently limited. These techniques include liquid chromatography-tandem mass spectrometry (LC-MS/MS)18–20 and enzyme-linked immunosorbent assays (ELISAs).21,22 However, LC-MS/MS has several significant drawbacks. It involves time-consuming procedures for preparing and cleaning complex plasma samples, lengthy digestion steps using trypsin, and lacks a clear strategy for developing an appropriate LC-MS/MS method. Moreover, LC-MS/MS instruments are costly and not widely available in most clinical laboratories, particularly in poor countries. Additionally, LC-MS/MS methods can suffer from inconsistent peak performance and poor result precision. Although ELISAs are generally preferred over LC-MS/MS, the existing ELISAs for ATZ21,22 rely on assay plates coated with commercial anti-idiotype antibodies to capture ATZ from sample solutions. This approach introduces the risk of false positive results due to non-specific binding of similar human IgG antibodies present in the samples. Furthermore, these ELISAs have demonstrated inaccuracies with errors of up to ±20%. Moreover, the sensitivity of these ELISAs, which rely on colorimetric detection, is not sufficiently high. To address these limitations, there is a pressing need to develop an improved alternative immunoassay for quantifying ATZ in plasma.
In recent times, CLEIAs have gained significant attention and have been applied in various fields, including pharmacology and molecular biology.23 CLEIAs offer several advantages over ELISAs involving colorimetric signals, such as higher sensitivity and a wider dynamic range. Notably, there is currently no CLEIA reported in the literature for the bioanalysis of ATZ. In this study, we developed a novel enhanced CLEIA for the quantification of ATZ in plasma samples by utilizing 4-(1-imidazolyl)phenol (IMP) as a chemiluminescence enhancer for the HRP-luminol-H2O2 reaction. The experimental work consisted of two main phases. Initially, we aimed to determine the optimal chemiluminescent conditions in the presence of IMP and adapt the optimized immunoassay protocol of ATZ, recently developed in our laboratory. Subsequently, the developed CLEIA was validated in terms of its practical utility, sensitivity, accuracy, precision, and specificity. The developed ultrasensitive CLEIA prototype provides a dependable tool for reliable measuring plasma levels of ATZ. It exhibits high specificity, eliminating the need for any pre-treatment of plasma samples. Moreover, it allows for rapid throughput analysis, enabling the efficient processing of numerous samples in PK, TDM, and bioequivalence studies of ATZ. Importantly, this study establishes the foundation for future development of a CLEIA kit for ATZ, ensuring independent intellectual property rights for the assay.
2. Experimental
2.1. Instruments
The SpectraMax® M5 microplate reader, manufactured by Molecular Devices, LLC in San Jose, California, USA, offers multiple detection modes including absorbance, fluorescence, fluorescence polarization, time-resolved fluorescence, and chemiluminescence. It has a wide light reading range of 200 to 1000 nm with 1 nm increments. The reader can accommodate various microplate formats, from standard 6-well to 384-well, and its 4-zone system allows for precise temperature control up to 50 °C, ensuring excellent stability for temperature-sensitive assays. Additionally, the instrument features an internal shaker with three different speed settings (low, medium, and high) for efficient solution mixing. The reader is controlled and operated using the SoftMax® Pro Enterprise software, which is included with the device. Other laboratory equipment used in the study includes the ELx50 automatic microplate strip washer from Bio-Tek Instruments Inc. in Winooski, USA, the Milli-Q water purification system from Labo, Millipore Ltd in Bedford, USA, the microprocessor laboratory pH meter from Mettler-Toledo International Inc. in Zürich, Switzerland, the Clifton Cyclone CM1 vortex mixer from Weston, England, and the Sanyo MDF-U5312 biomedical freezer from Onoda, Japan.2.2. Materials
ATZ was acquired from Selleck Chemicals LLC, located in Houston, Texas, USA. Recombinant PD-L1 protein was obtained from R&D Systems in Lilly, France. The purity of PD-L1 protein was >95%, by SDS-PAGE visualized with Silver Staining and quantitative densitometry by Coomassie® Blue Staining. Goat anti-human IgG was sourced from Sigma-Aldrich Chemical Co. in St. Louis, MO, USA. Additionally, goat anti-human horseradish peroxidase conjugate (HRP-IgG) and bovine serum albumin (BSA) were purchased from Sigma-Aldrich Chemicals Co. in St. Louis, Missouri, USA. Luminol was procured from ABCR GmbH in Karlsruhe, Germany, and 4-(imidazol-1-yl)phenol (IMP) was obtained from Sigma-Aldrich Chemicals Co. in St. Louis, MO, USA. Hydrogen peroxide was purchased from Merck in New Jersey, NJ, USA. White opaque flat-bottom high binding 96-well plates for chemiluminescence were obtained from Corning/Costar Inc. in Corning, NY, USA. Plasma samples were provided by King Khalid University Hospital in Riyadh, Kingdom of Saudi Arabia. These samples were stored frozen at −20 °C until they were utilized in the experiment. All other chemicals, reagents, and buffer components used throughout the study were of analytical grade.2.3. Buffer and reagent solutions
The buffer solution used for coating of the PD-L1 protein onto the assay plate wells was a phosphate-buffered saline (PBS) solution (0.1 mol L−1, pH 7.4). The blocking buffer solution used for blocking the assay plate consisted of PBS containing bovine serum albumin (BSA) at a concentration of 2% (w/v). For washing the plate wells, a washing buffer solution was used, which comprised of PBS containing Tween-20 (PBS-T) at a concentration of 0.05% (v/v). A freshly prepared chemiluminescence enhancement solution (CES) was prepared in Tris–HCl buffer (0.1 M, pH 8.5). The ECS consisted of luminol (0.1 mM), hydrogen peroxide (1 mM) and IMP (0.2 mM).2.4. Solutions of ATZ antibody and PD-L1 protein
To create stock solutions of ATZ and PD-L1, 5 mg of the lyophilized powder for each substance was reconstituted in 5 mL of PBS, resulting in a concentration of 1 mg mL−1. These stock solutions were then further diluted in PBS to generate working solutions with the appropriate concentrations for specific use.2.5. CLEIA procedures and data analysis
To coat the PD-L1 protein onto the internal surface of the microwells of 96-well high-binding white opaque plates, 50 μL of a solution (1 μg mL−1) was incubated in a coating buffer solution buffer at 37 °C for 1 h in a thermostatically controlled incubator. The microwells were then washed three times using a washing buffer solution (PBS-T). To block the remaining protein-binding sites on the wells, 100 μL of a blocking buffer solution (2% w/v BSA in PBS) was added to the assay plate wells and allowed to sit for 0.5 h at 37 °C. The plate was subsequently washed with PBS-T three times. In each well of the assay plates, 50 μL of the standard solution of ATZ or ATZ-spiked plasma samples were added. The binding of ATZ to the immobilized antigen (PD-L1) was allowed to proceed for 0.5 h at 37 °C. The wells were then washed three times with PBS-T. Next, 50 μL of HRP-IgG solution (0.5 μg mL−1, in PBS) was added to each well. The plates were incubated for 0.5 h at 37 °C to allow the binding of HRP-IgG to the immune antigen/antibody complex (PD-L1/ATZ). After three washes with PBS-T, 200 μL of CES was dispensed into to the plate wells. The CL intensities at 425 nm were measured using a microplate reader after allowing the luminol activation reaction and CL development to proceed for 60 seconds at room temperature. The data was acquired using Spectramax® software (Spectramax M5: Molecular Devices, California, USA) and transferred to Microsoft Excel 2016 (Microsoft Corporation, USA) for further analysis. A calibration curve was constructed by plotting the CL intensities (in arbitrary units: AU) against the corresponding concentrations of ATZ calibrator solutions. The concentrations of ATZ in the plasma samples were then determined using the regression equation derived from the calibration curve. In all quantitation experiments, negative controls were used to ensure the minimization of the potential background signal of IMP in the assay well in the absence of either of the ATZ, PD-L1 or HRP.3. Results and discussion
3.1. Strategy for CLEIA development
ATZ was chosen for this investigation because of its significant therapeutic value in treating various forms of cancer, and the serious need for an efficient immunoassay to support its PK, TDM, bioequivalence studies, and refinement of its safety profile. Given that ATZ exerts its immunotherapeutic effects by binding to the PD-L1 protein, this protein was selected as the capturing antigen for the development of the CLEIA described in this study. Although there were different formats available for developing CLEIA, the non-competitive format was chosen because of its typically high reliability. Furthermore, the entire protocol for this format could be completed within a reasonably short timeframe. Since ATZ is a monoclonal antibody of IgG subtype, anti-human HRP-IgG conjugate was used as a tracer in the assay. In previous studies,24,25 our laboratory developed non-competitive ELISAs for monoclonal antibodies using HRP and chromogenic substrates for colorimetric detection, and the results confirmed the reliability of this format. Therefore, this methodology was adopted for the present study. Moreover, HRP enzyme label has a great significance, plays a crucial role in the advancement of CLEIAs. The sensitivity of these HRP-based assays could be significantly increased by enhancement of the CL intensity of CL by inclusion of a CL enhancer molecule in the CL-inducing reaction. Various compounds have been utilized as signal enhancers in the development of HRP-based CLEIAs, resulting in enhancement of CL and yield more long-lasting, and stable light emission.26–28 Previous research29 has demonstrated that 4-(imidazol-1-yl)phenol (IMP) as a CL enhancer exhibits enhanced light emissions that are more intense, prolonged, and stable when developing CLEIAs. Therefore, the HRP-luminol-H2O2-IMP reaction was chosen and implemented as the detection system in the CLEIA described in this article.3.2. Description of CLEIA
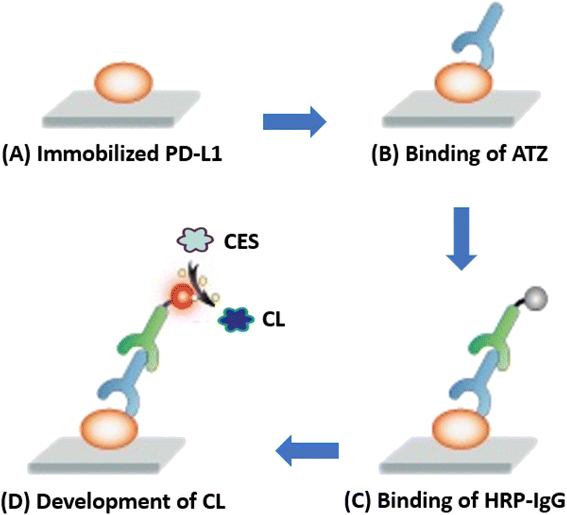
The present study describes a novel CLEIA for ATZ used for immunotherapy of different cancers. Fig. 1 provides an overview of the four-step protocol employed in this CLEIA. Firstly (A), the antigen (PD-L1) is immobilized on the internal surface of the assay plate wells, followed by blocking the remaining protein-binding sites using a high-concentration BSA solution. Then (B), ATZ (in it standard or sample solution) is allowed binds to the immobilized PD-L1 antigen protein. Subsequently (C), HRP-IgG is allowed to bind to the antigen/antibody complex (PD-L1/ATZ) present on the assay plate wells. Finally (D), the CES is added to induce an enhanced CL reaction. The CL signals are recorded by a plate reader at 425 nm, and the ATZ concentrations in the sample solutions are correlated with the measured CL signals.In a previous study,30 our laboratory optimized procedure for coating of PD-L1 protein onto the assay plates, blocking of assay plates, binding of ATZ and HRP-IgG. These procedures were employed in the development of HRP-based ELISA for ATZ. A summary of these optimized conditions is given in Table 1, and the details will be published elsewhere. In the current study, we employed these procedures in optimizing the factors that affect the enhancement of HRP-based CL reaction. The subsequent sections discuss the impact of various parameters on the CL intensity of the reaction.
| Condition | Optimum value |
|---|---|
| Binding reactions | |
| Immobilized capturing antigen | PD-L1 |
| Concentration of PD-L1 used for immobilization (μg mL−1) | 1 |
| Immobilization time (h)/temperature (°C) | 1/37 |
| Blocking with BSA: time (h)/temperature (°C) | 0.5/37 |
| Binding of ATZ: time (h)/temperature (°C) | 0.5/37 |
| Concentration of HRP-IgG (μg mL−1) | 0.5 |
| Binding of HRP-IgG: time (h)/temperature (°C) | 0.5/37 |
![[thin space (1/6-em)]](https://www.rsc.org/images/entities/char_2009.gif) |
|
| CL enhancement solution | |
| Luminol concentration (mM) | 0.1 |
| H2O2 concentration (mM) | 2 |
| IMP concentration (mM) | 0.2 |
| pH of CES (pH unit) | 8.5 |
| Concentration of DMF in ECS (%) | 2 |
| Volume of CES (μL per well) | 200 |
| CL development time (seconds) | 60 |
| CL measurement wavelength (nm) | 460 |
3.3. Chemiluminescence enhancement reaction
The reaction between luminol (as a hydrogen donor), and hydrogen peroxide (H2O2, as an oxidant and hydrogen acceptor) is catalyzed by HRP, and the CL signals are enhanced by IMP enhancer. Fig. 2 provides the chemical structure of IMP and illustrates the mechanism of enhanced HRP-luminol-H2O2 reaction. The luminol (3-aminophthalhydrazine) is converted by the basic solution into the tautomerism resonance-stabilized dianion, which is subsequently oxidized by H2O2 into the dicarboxylate ion, accompanied by the loss of molecular nitrogen, N2. When the dicarboxylate ion is formed, it is in an excited (higher energy) electronic state and sheds its “extra” energy by emitting a photon of CL light, allowing the molecule to go to its ground state form. The presence of IMP as a CL enhancer increases the intensity of the emitted CL light. It is believed that the primary factor contributing to the enhanced CL effect, through electron transfer between luminol and radicals, is the generation of the phenoxyl radical of IMP. Previous research on other 4-substituted phenols29 led us to hypothesize that the electronic properties of the substituents, particularly the resonance effect, play a crucial role in stabilizing the radicals and consequently improving the intensity of CL. Since IMP possesses a 4-substituent consisting of an aromatic ring and nitrogen heteroatoms, it may be capable of stabilizing phenoxyl radicals through resonance via π-delocalization. Additionally, electron-donating groups contribute to the stabilization of phenoxyl radicals by reducing the energy required for the dissociation of the O–H bond. Therefore, we postulated that this stabilization mechanism was responsible for IMP's highly effective enhancement of chemiluminescent intensity.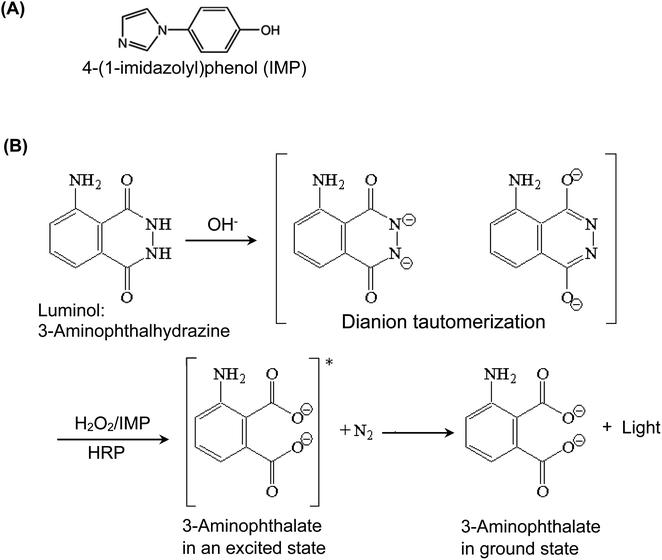 | ||
| Fig. 2 The chemical structure of 4-(1-imidazolyl)phenol (IMP) used as a CL enhancer for HRP-luminol-H2O2 reaction (A) and the reaction mechanism (B). | ||
3.4. Optimization of chemiluminescence enhancement reaction
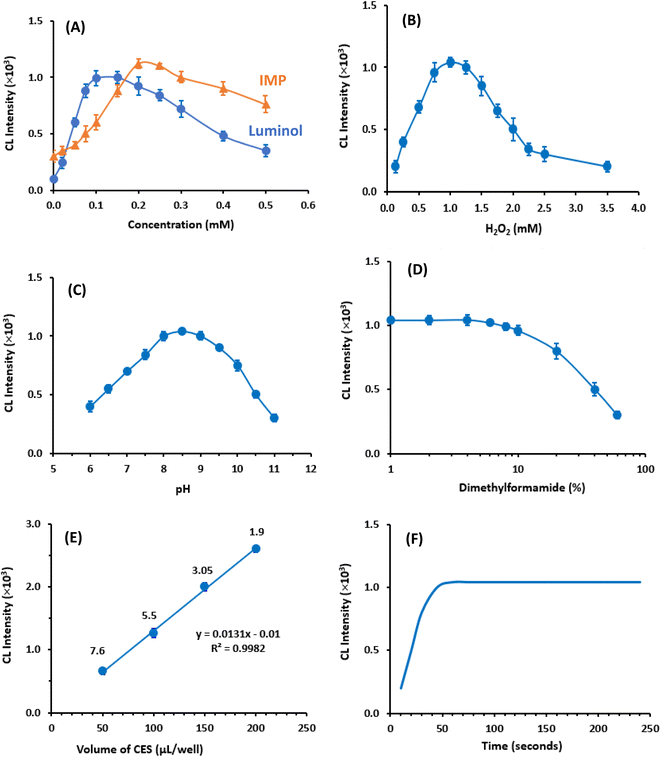
Similarly, to investigate the impact of IMP concentration on CL intensity, a series of experiments were conducted using various concentrations (0 to 0.5 mM) of IMP, while maintaining fixed concentrations of luminol (0.1 mM) and H2O2 (1 mM). The results (Fig. 3A) indicated that the maximum CL intensity was obtained when the IMP concentration was 0.2 mM. Consequently, the subsequent experiments were carried out using luminol and IMP concentrations of 0.1 mM and 0.2 mM, respectively.
Furthermore, the effect of H2O2 concentration in the CES on CL intensity was examined by using varying H2O2 concentrations (0.1 to 3.5 mM), while keeping the concentrations of luminol and IMP constant. It was observed that up to 1 mM of H2O2, the CL intensity increased proportionally with the increase in H2O2concentrations. However, beyond 1 mM, the CL intensity started to decrease (Fig. 3B). Based on this finding, the H2O2 concentration used for subsequent experiments was determined.
| Y = 0.01 − 0.0131X (r = 0.9982) |
In conclusion, the lowest RSD value of 1.9% was obtained when using a volume of 200 μL per well. Therefore, this volume was selected for all subsequent experiments, ensuring optimal precision in the measurements.
In this study, the kinetic profile of the enhanced CL reaction was examined by monitoring the CL signals for 240 seconds from the initiation of the reaction. The results revealed that the maximum CL signals were achieved within 50 seconds and remained stable for the subsequent time (Fig. 3F). Based on this finding all subsequent investigations assessed the CL signals after 60 seconds from the reaction start.
In Table 1, an overview of the variables influencing the enhanced CL reaction, which was employed as the detection system in the proposed CLEIA for ATZ is presented. Under these optimum conditions, the increase of signal enhancement was found to be ∼20 folds higher than the assay signal without the chemiluminescence enhancer.
3.5. Validation of the CLEIA
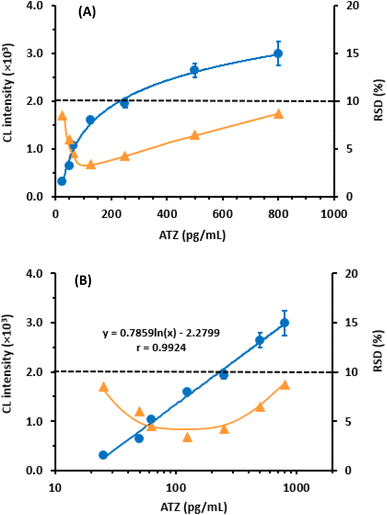
To determine the sensitivity of the assay in terms of its limit of detection (LOD) and limit of quantitation (LOQ), the guidelines of the International Council of Harmonization (ICH) for the validation of analytical procedures31 were followed. The following formula was used for calculation: LOD = 3.3 × SDa/b and LOQ = 10 × SDa/b, where SDa represents the standard deviation of the calibration line intercept, and b represents its slope. The calculated LOD and LOQ were found to be 12.5 and 37.5 pg mL−1, respectively. These exceptionally low values indicate the high sensitivity of the proposed CLEIA. This level of sensitivity allows for the determination of ATZ in plasma samples, considering the reported steady-state concentration of ATZ after a 60 minutes intravenous infusion at doses of 1200 mg every 3 weeks15 A summary of the calibration parameters for the proposed CLEIA can be found in Table 2.
| Parameter | Value |
|---|---|
| a The values were derived from the calibration curved given in Fig. 4B. | |
| Working range (pg mL−1) | 25–800 |
| Intercept (×103) | −2.2799 |
| Standard deviation of intercept | 14.68 |
| Slope (×103) | 0.7859 |
| Standard deviation of slope (×103) | 0.0197 |
| Correlation coefficient (r) | 0.9924 |
| LOD (pg mL−1) | 12.5 |
| LOQ (pg mL−1) | 37.5 |
| ATZ conc. (pg mL−1) | Recovery (% ± RSD) | |
|---|---|---|
| Intra-assay (n = 3) | Intra-assay (n = 6) | |
| 50 | 102.8 ± 6.2 | 104.4 ± 6.5 |
| 100 | 100.5 ± 3.4 | 97.2 ± 5.5 |
| 200 | 97.8 ± 3.5 | 96.7 ± 4.3 |
| 400 | 98.4 ± 3.2 | 101.8 ± 4.8 |
| 600 | 103.3 ± 4.1 | 105.1 ± 5.1 |
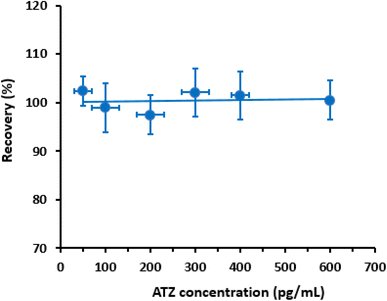
To evaluate the accuracy of the proposed CLEIA, the recovery of different concentrations of ATZ (Table 3) samples was measured. The obtained recovery values ranged from 97.8% to 103.3% and from 96.7% to 105.1% for the intra- and inter-assay runs, respectively (Table 3). These recovery values demonstrate the reliability of the proposed CLEIA for the quantitation of ATZ in plasma samples.
3.6. Comparison of the proposed CLEIA with previous ELISA
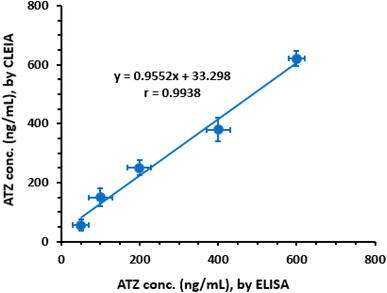
To evaluate the analytical performance of the proposed CLEIA in comparison to a pre-validated ELISA,22 plasma samples were spiked with ATZ at predetermined concentrations ranging from 50 to 600 ng mL−1. These concentrations were selected based on the sensitivity of the ELISA. However, since the proposed CLEIA exhibited higher sensitivity, the samples were diluted with PBS to bring their concentrations within the linear range of the CLEIA. The concentrations measured by ELISA were plotted against the corresponding values obtained from the proposed CLEIA (Fig. 6). Regression analysis was performed, and the results demonstrated good agreement between the two methods:| Y = 33.298 + 0.9552X (r = 0.9938) |
3.7. Advantages of CLEIA
The proposed CLEIA encompasses several advantageous features, which can be summarized as follows. Firstly, the CLEIA capitalizes on the measurement of enhanced CL signals using a CL-enhancement reaction, enabling exceptional sensitivity for the quantification of ATZ at concentrations as low as 37.5 pg mL−1. Secondly, the CLEIA exhibits outstanding selectivity, ensuring the specific measurement of ATZ plasma levels without any interference from other components or the plasma matrix. This specificity guarantees reliable and accurate assay results. Thirdly, the CLEIA is a high-throughput technique that enables the simultaneous analysis of multiple samples in clinical laboratories. This capability enhances efficiency and productivity in the analysis of large sample volumes, rendering it suitable for high-volume testing requirements. Fourthly, the assay is cost-effective, utilizing small sample volumes and commercially available reagents that are affordable. This cost-efficiency renders the assay economically viable for routine implementation in laboratory settings. Finally, the CLEIA eliminates the need for labor-intensive and time-consuming extraction or clean-up procedures during pretreatment of plasma samples prior to analysis. This simplifies the workflow and reduces the overall analysis time, providing convenience for laboratory personnel. In summary, the proposed CLEIA offers exceptional sensitivity, excellent selectivity, high-throughput capability, cost-effectiveness, and simplified sample preparation, making it a valuable tool for accurately quantifying ATZ in plasma samples.4. Conclusion
This study describes the development and validation of an ultrasensitive sensitive and selective CLEIA for the quantification of ATZ in plasma samples. The inclusion of IMP as a CL enhancer resulted in a significant enhancement of the CL intensity generated by the HRP-luminol-H2O2 reaction. This enhancement contributed to the assay's exceptional sensitivity, allowing accurate and precise quantification of ATZ in plasma samples at concentrations as low as 37.5 pg mL−1. The assay's remarkable sensitivity also enables the use of very small plasma sample volumes, approximately 1 μL. The proposed CLEIA method allows for the processing of a batch of several hundred samples per day by a single analyst, making it a powerful tool for high-throughput analysis of plasma samples. Although the assay was not validated for matrices other than plasma; however, in principle it can be used also for serum samples. This capability makes the assay highly valuable for investigating various pharmaceutical fields, including PK, TDM, refining the safely profile. In principle this assay can be used for quantitation of other antibodies; however, it is not suitable for other protein molecule/antibody and ligand interaction analysis. In these cases, the kinetic Exclusion Assays on KinExA™ biosensor (Sapidyne Instruments, Boise, USA)33 and Surface Plasmon Resonance (SPR) biosensors34 are the most appropriate approaches.Conflicts of interest
The authors report no conflicts of interest for this work.Acknowledgements
The authors extend their appreciation to the Researchers Supporting Project Number (RSPD2024R944), King Saud University, Riyadh, Saudi Arabia, for funding this research work.References
- C. Robert, A decade of immune-checkpoint inhibitors in cancer therapy, Nat. Commun., 2020, 11, 3801 CrossRef CAS PubMed.
- C. Blank, T. F. Gajewski and A. Mackensen, Interaction of PD-L1 on tumor cells with PD-1 on tumor-specific T cells as a mechanism of immune evasion: implications for tumor immunotherapy, Cancer Immunol., Immunother., 2005, 54, 307–314 CrossRef CAS PubMed.
- N. Patsoukis, Q. Wang, L. Strauss and V. A. Boussiotis, Revisiting the PD-1 pathway, Sci. Adv., 2020, 6, eabd2712 CrossRef CAS PubMed.
- H. Ledford, H. Else and M. Warren, Cancer immunologists scoop medicine Nobel prize, Nature, 2018, 562, 20–21 CrossRef CAS PubMed.
- Q. Gou, C. Dong, H. Xu, B. Khan, B. Jin, Q. Liu, J. Shi and Y. Hou, PD-L1 degradation pathway and immunotherapy for cancer, Cell Death Dis., 2020, 11, 955 CrossRef CAS PubMed.
- NIH: National Cancer Institute, Atezolizumab, https://www.cancer.gov/about-cancer/treatment/drugs/atezolizumab, accessed 6 February 2024.
- FDA: US. Food & Drug Administration, FDA approves atezolizumab with chemotherapy and bevacizumab for first-line treatment of metastatic non-squamous NSCLC, https://www.fda.gov/drugs/fda-approves-atezolizumab-chemotherapy-and-bevacizumab-first-line-treatment-metastatic-non-squamous, accessed 8 December 2023.
- FDA: US. Food & Drug Administration, FDA approves atezolizumab for first-line treatment of metastatic NSCLC with high PD-L1 expression, https://www.fda.gov/drugs/resources-information-approved-drugs/fda-approves-atezolizumab-first-line-treatment-metastatic-nsclc-high-pd-l1-expression, accessed 8 December 2023.
- FDA: US. Food & Drug Administration, FDA approves atezolizumab as adjuvant treatment for non-small cell lung cancer. https://www.fda.gov/drugs/resources-information-approved-drugs/fda-approves-atezolizumab-adjuvant-treatment-non-small-cell-lung-cancer, accessed 6 February 2024.
- FDA: US. Food & Drug Administration, FDA approves atezolizumab for extensive-stage small cell lung cancer. https://www.fda.gov/drugs/drug-approvals-and-databases/fda-approves-atezolizumab-extensive-stage-small-cell-lung-cancer, accessed 6 February 2024.
- FDA: US. Food & Drug Administration, FDA approves atezolizumab for PD-L1 positive unresectable locally advanced or metastatic triple-negative breast cancer, https://www.fda.gov/drugs/drug-approvals-and-databases/fda-approves-atezolizumab-pd-l1-positive-unresectable-locally-advanced-or-metastatic-triple-negative, accessed 6 February 2024.
- FDA: US. Food & Drug Administration, FDA approves atezolizumab for BRAF V600 unresectable or metastatic melanoma, https://www.fda.gov/drugs/resources-information-approved-drugs/fda-approves-atezolizumab-braf-v600-unresectable-or-metastatic-melanoma, accessed 6 February 2024.
- FDA: US. Food & Drug Administration, FDA grants approval to atezolizumab for alveolar soft part sarcoma, https://www.fda.gov/drugs/resources-information-approved-drugs/fda-grants-approval-atezolizumab-alveolar-soft-part-sarcoma, accessed 6 February 2024.
- FDA: US. Food & Drug Administration, Atezolizumab for urothelial carcinoma, https://www.fda.gov/drugs/resources-information-approved-drugs/atezolizumab-urothelial-carcinoma, accessed 6 February 2024.
- M. Centanni, D. J. A. R. Moes, I. F. Trocóniz, J. Ciccolini and J. G. Coen van Hasselt, Clinical pharmacokinetics and pharmacodynamics of immune checkpoint inhibitors, Clin. Pharmacokisnet., 2019, 58, 835–857 CrossRef PubMed.
- M. Yan, Y. Liu and J. H. Martin, Editorial: Therapeutic drug monitoring and clinical toxicology of anti-cancer drugs, volume II, Front. Oncol., 2023, 13, 1153714 CrossRef PubMed.
- EMA: European Medicines Agency, Tecentriq, Assessment report, https://www.ema.europa.eu/en/documents/assessment-report/tecentriq-epar-public-assessment-report_en.pdf, accessed 8 December 2023 Search PubMed.
- H.-H. Chiu, H.-W. Liao, Y.-Y. Shao, Y.-S. Lu, C.-H. Lin, I.-L. Tsai and C.-H. Kuo, Development of a general method for quantifying IgG-based therapeutic monoclonal antibodies in human plasma using protein G purification coupled with a two internal standard calibration strategy using LC-MS/MS, Anal. Chim. Acta, 2018, 1019, 93–102 CrossRef CAS PubMed.
- K. A. de Jong, S. J. van Breugel, M. J. Hillebrand, H. Rosing, A. D. Huitema and J. H. Beijnen, Bottom-up sample preparation for the LC–MS/MS quantification of anti-cancer monoclonal antibodies in bio matrices, Bioanalysis, 2020, 12, 1405–1425 CrossRef CAS PubMed.
- K. Molnarova, K. Cokrtova, A. Tomnikova, T. Krizek and P. Kozlik, Liquid chromatography and capillary electrophoresis in glycomic and glycoproteomic analysis, Monatsh. Chem., 2022, 153, 659–686 CrossRef CAS PubMed.
- Eagle Bioscience, Atezolizumab ELISA Assay Kit, https://eaglebio.com/product/atezolizumab-elisa-assay-kit/, Accessed: Nov. 22, 2023.
- Krishgen Biosystems. KRIBIOLISA™ Atezolizumab (TECENTRIQ) ELISA, https://krishgen.com/product/details/atezolizumab-elisa-tecentriq accessed 6 February 2024.
- L. Cinquanta, D. E. Fontana and N. Bizzaro, Chemiluminescent immunoassay technology: what does it change in autoantibody detection?, Autoimmun. Highlights, 2018, 8, 1–8 Search PubMed.
- I. A. Darwish, M. M. Al-Shehri and M. A. El-Gendy, Development of new ELISA with high sensitivity and selectivity for bioanalysis of bevacizumab: a monoclonal antibody used for cancer immunotherapy, Curr. Anal. Chem., 2018, 14, 174–181 CrossRef CAS.
- M. M. Al-Shehri, M. A. El-Gendy and I. A. Darwish, Development of specific new ELISA for bioanalysis of cetuximab: a monoclonal antibody used for cancer immunotherapy, Curr. Pharm. Anal., 2018, 14, 519–525 CrossRef CAS.
- G. Chen, M. Jin, P. Du, C. Zhang, X. Cui, Y. Zhang, J. Wang, F. Jen, Y. She, H. Shao, S. Wang and L. Zheng, A review of enhancers for chemiluminescence enzyme immunoassay, Food Agric. Immunol., 2017, 28, 315–327 CrossRef CAS.
- H. Karatani, Luminol–hydrogen peroxide–horseradish peroxidase chemiluminescence intensification by kosmotrope ammonium sulfate, Anal. Sci., 2022, 38, 613–621 CrossRef CAS PubMed.
- L. Yang, M. Jin, P. Du, G. Chen, C. Zhang, J. Wang, F. Jin, H. Shao, Y. She, S. Wang, L. Zheng and J. Wang, Study on enhancement principle and stabilization for the luminol-H2O2-HRP chemiluminescence system, PLoS One, 2015, 10, e0131193 CrossRef PubMed.
- Y. Dotsikas and Y. L. Loukas, Employment of 4-(1-imidazolyl)phenol as a luminol signal enhancer in a competitive-type chemiluminescence immunoassay and its comparison with the conventional antigen–horseradish peroxidase conjugate-based assay, Anal. Chim. Acta, 2004, 509, 103–109 CrossRef CAS.
- I. A. Darwish, N. Z. Alzoman, N. N. Y. Khalil and H. W. Darwish, Novel highly sensitive chemiluminescence immunoassay for quantitation of durvalumab using a signal enhanced horseradish peroxidase-luminol-hydrogen peroxide reaction for detection system, Talanta Open, 2023, 7, 100219 CrossRef.
- ICH, ICH Guideline Q2(R1) on Validation of Analytical Procedures: Text and Methodology, London, 2022 Search PubMed.
- J. W. A. Findlay, W. C. Smith, J. W. Lee, G. D. Nordblom, I. Das, B. S. DeSilva, M. N. Khan and R. R. Bowsher, Validation of immunoassays for bioanalysis: a pharmaceutical industry perspective, J. Pharm. Biomed. Anal., 2000, 21, 1249–1273 CrossRef CAS PubMed.
- Sapidyne, KinExA: Kinetic Exclusion Assay, https://www.sapidyne.com/kinexatechnology.html, accessed 6 February 2024 Search PubMed.
- A. Gade, A. Sharma, N. Srivastava and S. J. S. Flora, Surface plasmon resonance: A promising approach for label-free early cancer diagnosis, Clin. Chim. Acta, 2022, 527, 79–88 CrossRef CAS PubMed.
| This journal is © The Royal Society of Chemistry 2024 |

