
 Open Access Article
 This Open Access Article is licensed under a
 Creative Commons Attribution 3.0 Unported Licence
Assessment of metabolome diversity in black and white pepper in response to autoclaving using MS- and NMR-based metabolomics and in relation to its remote and direct antimicrobial effects against food-borne pathogens†
Mostafa H. Baky‡
a,
Islam M. Kamal‡b,
Ludger A. Wessjohann c and
Mohamed A. Farag*d
c and
Mohamed A. Farag*d
aDepartment of Pharmacognosy, Faculty of Pharmacy, Egyptian Russian University, Badr city, 11829, Cairo, Egypt
bMicrobiology and Immunology Department, Faculty of Pharmacy, Cairo University, 11562 Cairo, Egypt
cDepartment of Bioorganic Chemistry, Leibniz Institute of Plant Biochemistry (IPB), Weinberg 3, 06120, Halle (Saale), Germany
dPharmacognosy Department, College of Pharmacy, Cairo University, 11562 Cairo, Egypt. E-mail: mohamed.farag@pharma.cu.edu.eg
First published on 3rd April 2024
Abstract
Piper nigrum L. (black and white peppercorn) is one of the most common culinary spices used worldwide. The current study aims to dissect pepper metabolome using 1H-NMR targeting of its major primary and secondary metabolites. Eighteen metabolites were identified with piperine detected in black and white pepper at 20.2 and 23.9 μg mg−1, respectively. Aroma profiling using HS-SPME coupled to GC-MS analysis and in the context of autoclave treatment led to the detection of a total of 52 volatiles with an abundance of β-caryophyllene at 82% and 59% in black and white pepper, respectively. Autoclaving of black and white pepper revealed improvement of pepper aroma as manifested by an increase in oxygenated compounds' level. In vitro remote antimicrobial activity against food-borne Gram-positive and Gram-negative bacteria revealed the highest activity against P. aeruginosa (VP-MIC 16.4 and 12.9 mg mL−1) and a direct effect against Enterobacter cloacae at ca. 11.6 mg mL−1 for both white and black pepper.
1. Introduction
Culinary herbs and spices are valuable food material owing to not only their special aroma but a myriad of nutritional and health benefits.1 Black pepper (Piper nigrum L.), belonging to the family Piperaceae, is considered as one of the most important spices used worldwide.2 P. nigrum includes different types according to maturity stage such as black pepper, green pepper, and red pepper.3 White pepper is produced from P. nigrum processing by peeling off its outer black layer.4P. nigrum seeds contain a myriad of phytochemicals such as alkaloids, essential oil, lignans, and terpenes, responsible for their biological and nutritional value.5 P. nigrum is used traditionally as a rubefacient, stimulant, appetite stimulant, anti-inflammatory agent, and for treatment of gastric complaints.6 Piperine, the major alkaloid in black pepper (5–9%) accounts for its pungency, and further stomachic action.2,5 Aside from alkaloids, essential oils are abundant in P. nigrum including monoterpenes (e.g., α-pinene, β-pinene, β-myrcene, and limonene), oxygenated monoterpenes (e.g., 1,8-cineole, linalool, terpinen-4-ol, and borneol), sesquiterpenes (e.g. β-caryophyllene, humulene, and α-cubebene), and oxygenated sesquiterpenes (e.g., (E)-nerolidol, caryophyllene oxide, and bisabolol),4,7 that contribute to the seed flavor.
Cooking spices are widely used to impart and improve food flavor and aroma adding to their nutritional value. Likewise, processing of food spices by roasting and heat treatment can improve the quality characteristics of food products including aroma, flavor concurrent with changing their chemical profile.1 Autoclaving is increasingly used for food spice sterilization purposes as it can aid to eliminate pathogen microorganisms and affects physicochemical properties, mainly color, flavor, and texture.8 Heat processing was found to affect phenolic content and antioxidant capacity of culinary products including black pepper, fennel, cinnamon, cardamom, and clove.9 In black pepper, heat processing showed significant loss in piperine level by 16–34%, and likewise observed in case of curcumin in turmeric by 27–53%, and capsaicin in red pepper by 18–36%.10 With regards to aroma profile, heat treatment revealed a remarkable change in black pepper aroma by altering its aroma composition with significant increase of monoterpenes: α- and β-pinene, camphene, sabinene, myrcene, α-phellandrene, 3-carene, α-terpinene, p-cymene, 1,8-cineole, limonene, γ-terpinene proportions compared to the control.11
Owing to their antimicrobial potential, essential oils derived from spices are considered as potential source of food preservatives.4 Four pepper oils (P. longum, P. cubeba, P. nigrum, and white pepper) were tested for their antimicrobial potential revealing promising effects against Helicobacter pylori, with P. longum oil showing the most potential effect with minimum inhibitory concentration (MIC) value at 1.95 μg mL−1, comparable to that of clarithromycin antibiotic.4 Considering the rich aroma composition in pepper, it can exert remote antibacterial action similar to other herbs and spices,12 though not yet revealed in pepper and likely to contribute for its food preservation action. Other biological activities reported in black pepper include antioxidant, anti-inflammatory, cytotoxic, hepatoprotective, digestive, anti-platelet aggregation, and anti-depressant.13
Owing to the growth in market demand for spices, a holistic approach is warranted to unveil their quality characteristics and composition.14 Recently, metabolomics tools are increasingly employed for profiling and fingerprinting of spices using both targeted and untargeted approaches for quality control purposes. Gas chromatography coupled with mass spectrometry technique (GC-MS) is well adopted for aroma profiling in food products15 asides from its high sensitivity. Compared with MS-based, NMR-based metabolomics offers a rapid, robust, and non-destructive tool adopted for the identification and quantification of food chemicals16 though less sensitive compared with MS spectroscopy. NMR-spectroscopy offers several measurements including 1D 1H NMR and 2D HSQC, TOCSY, and HMBC for identification and quantification of major chemicals17 that aid to dissect overlapping NMR peaks observed in 1D-NMR and confirm metabolites identification.
The current study presents the first holistic comparative metabolomics approach in black and white pepper using MS- and NMR-based technologies and visualized using chemometric tools. Whilst NMR provided the targeted quantification of major primary and secondary metabolites in both black and white pepper for standardization purposes, SPME-GC-MS provided an overview of aroma composition and in context to processing to thermal treatment as exemplified by autoclaving for the first time in literature. Further, screening of the remote and direct antimicrobial effects of black and white pepper against 9 food borne bacteria and fungi was also tested using in vitro assay revealing inhibitory activity against both Gram-positive and Gram-negative bacteria involved in food contamination.
2. Materials and methods
2.1. Plant material and autoclave treatment
Authenticated black and white pepper (Piper nigrum L.) entire fruits were kindly provided by Dr Ahmed Mediani, Malaysia from the institute of Systems Biology, Universiti Kebangsaan Malaysia, Selangor, UKM Bangi, Malaysia, during October 2022; the plant name followed that listed in plant list website (http://www.theplantlist.org/). The dried fruits were grinded using liquid nitrogen, mortar and pestle and kept at −20 °C till further analyses. A voucher specimen from the fruits was deposited at the College of Pharmacy Herbarium, Cairo University, Cairo, Egypt. Autoclaving was performed by wrapping white and black pepper in aluminum foil and placing them inside an Autoclave ALP Model CNBA-75-1-HH, Japan set at 105 °C for 5 min. Methanol extract was prepared by cold maceration of pepper samples (10 g each) in 100% MeOH (100 mL) with sonication for three times (1 h for each time) and filtration followed by evaporation under reduced pressure at 45 °C to yield dry residue that was kept at −20 °C until further analyses.2.2. SPME and chemicals
Fibers used in SPME volatile extraction including stable flex coated with divinylbenzene/carboxen/polydimethylsiloxane (DVB/CAR/PDMS, 50/30 μm) or PDMS (polydimethylsiloxane) were purchased from Supelco (Oakville, ON, Canada). Volatile and alkane standards were provided from Sigma Aldrich (St. Louis, MO, USA).2.3. SPME-GC-MS volatiles analysis
Freeze dried finely powdered fruits (100 mg) were placed in SPME screw-cap vials (1.5 mL) spiked with 10 μg (Z)-3-hexenyl acetate (absent from pepper samples to serve as an internal standard) with fibers inserted manually above and placed in an oven kept at 50 °C for 30 min. HS-SPME analysis of volatile compounds was performed as reported in ref. 18 with slight modifications. The fiber was subsequently withdrawn into the needle and then injected manually into the injection port of a gas chromatography-mass spectrometer (GC-MS). GC-MS analysis was adopted on an Shimadzu GC as reported in.19,20 Volatiles separation was made using a DB-5 column (30 m × 0.25 mm i.d. × 0.25 μm film thickness; Supelco) and coupled to a quadrupole mass spectrometer. The interface and the injector temperatures were both set at 220 °C. Volatile elution was carried out using the following gradient temperature program: oven was set at 40 °C for 3 min, then increased to 180 °C at a rate of 12 °C min−1, kept at 180 °C for 5 min, finally increased at a rate of 40 °C min−1 to 240 °C and kept at this temperature for 5 min. Helium was utilized as a carrier gas with a total flow rate of 0.9 mL min−1. For ensuring complete elution of volatiles, SPME fiber was prepared for the next analysis by placing it in the injection port at 220 °C for 2 min. Three different samples for each accession were analyzed under the same conditions to assess biological replicates, and blank runs were made during sample analyses. The mass spectrometer was adjusted to EI mode at 70 eV with a scan range set at m/z 40–500.2.4. Volatiles identification and multivariate data analyses
Identification of volatile components was performed by comparing their retention indices (RI) in relation to n-alkanes (C6–C20), mass matching to NIST 11.0, WILEY library database and with standards whenever available. Peaks were first deconvoluted using AMDIS software (http://www.amdis.net)21 prior to mass spectral matching. Peak abundance data were exported for multivariate data analysis by extraction using MS-Dial software under same conditions cited in.20,22 GC-MS files were converted to .netcdf file format using through MS Convert option in Shimadzu program, then to abf files utilizing ABF converter (https://www.reifycs.com/AbfConverter/). In that regard, data analysis was performed using MS dial software (http://prime.psc.riken.jp/compms/msdial/main.html) according to the following parameters: mass range (0–220 Da), MS1 tolerance for alignment (0.015 Da), retention time (0–18 min), minimum peak height (1000), sigma (0.7), accurate mass tolerance (MS) 0.01 Da, and peak area 1000. Peak abundance was exported for multivariate data analysis where final ID and metabolites were Pareto scaled using SIMCA 14.1 (Umetrics, Umea, Sweden) in which the obtained data were subjected to principal component analysis (PCA) and orthogonal partial least squares discriminant analysis (OPLS-DA). PCA was carried out to show the variance of metabolites amongst different samples whilst information on differences in the metabolite composition can be professed by OPLS-DA plot.2.5. Samples preparation for NMR analysis
Samples extraction followed the protocol described in.19 All 1H-NMR spectra were obtained successively within a 48 h time interval with samples prepared directly before data acquisition. Three biological replicates for each specimen were extracted and analyzed in parallel under the same conditions to assess for biological variance.2.6. NMR data acquisition
All 1H-NMR spectra were recorded using an Agilent VNMRS 600 NMR spectrometer as previously reported.23 All 1H-NMR spectra were recorded on an Agilent VNMRS 600 NMR spectrometer operating at a proton NMR frequency of 599.83 MHz equipped with a 5 mm inverse detection cryoprobe; digital resolution 0.367 Hz/point (32k complex data points); pulse width (pw) = 2.1 μs (30°); relaxation delay = 18 s; acquisition time = 2.0 s; number of transients = 160. Zero filling up to 128k and an exponential window function with lb = 0.4 was used prior to Fourier transformation. 2D-NMR spectra were recorded at a frequency of 599.83 MHz using standard CHEMPACK 6.2 pulse sequences (COSY, HSQC, HMBC) implemented in standard VNMRJ 4.0A spectrometer software. The HSQC experiment was optimized for 1JCH = 146 Hz with DEPT-like editing and 13C-decoupling during acquisition time. The HMBC experiment was optimized for a long-range coupling of 8 Hz; a 2-step 1JCH filter was used (130–165 Hz).2.7. NMR data processing
Spectra were imported to ACD/NMR Manager lab version 10.0 software (Toronto, Canada) and automatically Fourier transformed to ESP files. The spectra were referenced to internal HMDS at 0.062 ppm for 1H-NMR and 1.96 ppm for 13C-NMR, respectively.23 Spectra were imported to ACD/NMR Manager lab version 10.0 software (Toronto, Canada) and automatically Fourier transformed to ESP files. The spectra were referenced to internal HMDS at 0.062 ppm for 1H-NMR and 1.96 ppm for 13C-NMR, respectively. Spectral intensities were reduced to integrated regions, referred to as buckets, of equal width (0.04 ppm) for all spectral (δ 0.4–11.0 ppm) and aromatic (δ 5.5–11.0 ppm) regions. The spectral regions corresponding to the residual solvent signals; δ 4.90–4.80 (water) and δ 3.33–3.28 ppm (methanol), were removed before multivariate analyses. This binning allowed us to evaluate the absolute quantification of the identified metabolites.2.8. Quantification of major metabolites via 1H-NMR
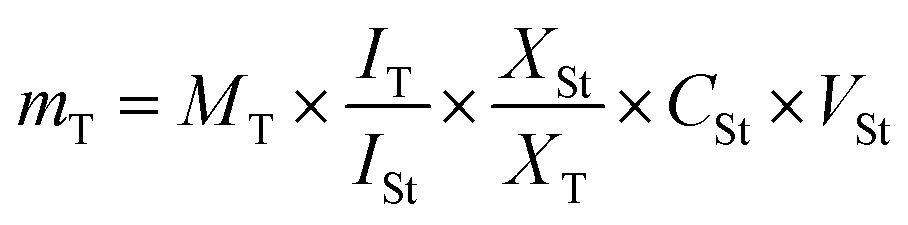
For the quantification of metabolites listed in Table 1 using NMR spectroscopy, the peak area of selected proton signals belonging to the target compounds, and the peak area of the internal standard (HMDS) were integrated manually for all the samples. The equation applied for the calculations was described in ref. 24. The following equation was applied for the calculations:mT mass of the target compound in the solution used for 1H-NMR measurement (μg), MT molecular weight of the target compound (g mol−1), IT relative integral value of the 1H-NMR signal of the target compound, ISt relative integral value of the 1H-NMR signal of the standard compound, XSt number of protons belonging to the 1H-NMR signal of the standard compound. XT number of protons belonging to the 1H-NMR signal of the target compound, CSt concentration of the standard compound in the solution used for 1H-NMR measurement (mmol l−1), VSt volume of solution used for 1H-NMR measurement (ml).
| Metabolite | Assignment | δ 1H (ppm) | TOCSY correlations δ 1H (ppm) | HSQC correlations δ 13C (ppm) | HMBC correlations δ 13C (ppm) | Black pepper (μg mg−1) | White pepper (μg mg−1) |
|---|---|---|---|---|---|---|---|
| Alkaloids/nitrogenous | |||||||
| Piperine (N1) | C1/3 | 1.551–1.643 (m) | 25.5, 27.8 | 27.7 (C-2), 44.5 (C-4), 48.1 (C-6) | 20.21 ± 4.67 | 23.94 ± 2.61 | |
| C2 | 1.679–1.738 (m) | 27.7 | 27.8 (C-3), 44.5 (C-4), 48.1 (C-6) | ||||
| C-4, C-6 | 3.618–3.636 (m) | 44.5, 48.1 | 25.5 (C-2), 44.5 (C-4), 48.1 (C-6), 167.6 (C-7) | ||||
| C-20 | 5.961 (s) | 102.6 | 149.7 (C-16–17) | ||||
| C-9 | 6.611 (d, 14.65 Hz) | 7.32 | 120.6 | 167.6 (C-7), 144.5 (C-10), 126.3 (C-11) | |||
| C-11/12 | 6.803–6.907 (m) | 126.3, 140.1 | 144.5 (C-10), 126.3 (C-11), 106.6 (C-18) | ||||
| C-15 | 6.783 (d, 8.03 Hz) | 109.2 | 149.7 (C-16), 132.3 (C-13) | ||||
| C-14 | 6.968 (dd, 1.46, 8.04 Hz) | 6.783 | 123.7 | 149.7 (C-16), 140.1 (C-12) | |||
| C-18 | 7.091 (d, 1.49 Hz) | 6.783, 6.9 | 106.6 | 149.7 (C-17), 140.1 (C-12), 123.7 (C-14) | |||
| C-10 | 7.323 (dd, 14.63, 10.66 Hz) | 6.89, 6.63 | 144.5 | 167.6 (C-7), 126.3 (C-11), 140.1 (C-12) | |||
| Piperine isomer (chavicine) (N2) | C1/3 | 1.557–1.641 (m) | 25.5, 27.8 | 27.7 (C-2), 44.5 (C-4), 48.1 (C-6) | 7.93 ± 1.04 | 5.68 ± 1.09 | |
| C2 | 1.776–1.890 (m) | 27.7 | 27.8 (C-3), 44.5 (C-4), 48.1 (C-6) | ||||
| C-4, C-6 | 3.607–3.635 (m) | 44.5, 48.0 | 25.5 (C-2), 44.50 (C-4), 48.08 (C-6), 167.66 (C-7) | ||||
| C-20 | 5.896 s | 102.5 | 149.2 (C-9–10) | ||||
| C-9 | 6.644 (d, 14.65 Hz) | 120.5 | 167.6 (C-1), 140.1 (C-3), 123.5 (C-5) | ||||
| C-11/12 | 6.843–6.932 (m) | 123.8, 140.1 | 140.1 (C-3), 120.5 (C-2) | ||||
| C-15 | 6.893 (d, 10.76 Hz) | 106.4 | 149.3 (C-9), 132.3 (C-6) | ||||
| C-14 | 6.947 (dd, 1.46, 8.04 Hz) | 123.6 | 149.3 (C-9), 106.6 (C-8) | ||||
| C-18 | 7.091 (d, 1.49 Hz) | 109.3 | 149.2 (C-10), 132.3 (C-6) | ||||
| C-10 | 6.803 (dd, 8.15, 9.84 Hz) | 144.5 | 167.6 (C-1), 120.5 (C-2), 140.1 (C-4) | ||||
| Choline (N3) | N-(CH3)3 | 3.270 (m)* | 3.82, 3.64 | 53.7 | 53.7 (N-CH3), 67.1 (N-CH2) | ||
| N-CH2 | 3.822 (m)* | 67.1 | 53.7 (N-CH3) | ||||
![[thin space (1/6-em)]](https://www.rsc.org/images/entities/char_2009.gif) |
|||||||
| Organic acids/fatty acids | |||||||
| Acetic acid (N4) | C-2 | 1.976 (s) | 20.3 | 172.6 (COO) | 0.22 ± 0.06 | 0.14 ± 0.03 | |
| Succinic acid (N5) | C-2 (α,β) | 2.529 (s) | 35.3 | — | 0.47 ± 0.06 | 0.37 ± 0.03 | |
| Syringic acid (N6) | C-3/C-5 | 3.899* | 56.3 | 149.2 (C3/C5) | |||
| C-2/C-6 | 7.042* | 109.2 | 123.1 (C1) | ||||
| Fatty acids (N7) | C-1 | — | 179.12 | ||||
| C-2 | 2.228 (m)* | 33.89 | 26.1 (C3), 30.1 (C4), 179.12 (C1) | ||||
| C-3 | 1.603 (m)* | 26.85 | 30.2 (C3), 125.43, 136.14 (CH![[double bond, length as m-dash]](https://www.rsc.org/images/entities/char_e001.gif) CH) CH) |
||||
| Inner CH2 | 1.285–1.309 brs | 0.9, 1.11, 1.55 (terminal CH3) | 30.1–33.2 | 23.7, 27.9, 30.7, 32.1 (inner CH2) | |||
| ω-1 | 1.321* | 2.03 | 28.1 | 32.9 (inner CH2) | |||
| –CHCH– |
5.338 (t, J = 5.59 Hz) | 1.32 | 130.8 (CC) |
28.1 (inner CH2) | |||
| 2.03 | |||||||
| ω-2 | 0.907 (t, J = 7.2 Hz) | 1.29 | 14.4 | 23.7 (ω-1), 33.03 (ω-2) | |||
| 1.79 | |||||||
| 3.06 | |||||||
| Fatty acid amide (N8) | Inner CH2 | 1.26–1.3 | 0.9 | 30.7 | 23.62, 30.23 | ||
| C-2 | 2.318 | 1.61, 1.38 | 34.8 | 174.52, 30.23 | |||
| 1-Monoacylglycerol (1MAG) (N9) | C-3 | 3.485 (dd, J = 5.88, 9.02 Hz) | 4.003 | 64.4, 65.8 | 25.3, 43.9, 49.8, 69.3 | ||
| 3.792 (dd, J = 3.31, 5.21 Hz) | 3.392 | 69.3 | 148.8, 71.7 | ||||
| C-2 | 3.956 (m) | 3.751, 3.641 | 62.7, 83.2 | 62.7 | |||
| C-1 | 4.025 (dd, J = 5.88, 11.4 Hz) | 3.62, 3.76 | 64.5 | 63.3 | |||
| 4.164 (dd, J = 3.58, 12.07 Hz) | 4.335 | 63.1 | 70.58 (C-2), 164.6 (CO) |
||||
|
|||||||
| Amino acids | |||||||
| Isoleucine (N10) | C-5 | 0.866 (t, J = 6.6 Hz) | 11.5 | 22.8 (C-3), 16.6 (C-4) | |||
| C-6 | 0.995 (d, J = 4.95 Hz) | 14.4 | 22.8 (C-3), 54.5 (C-2) | ||||
| C-4 | 1.596 m | 16.6 | 22.8 (C-3), 54.5 (C-2) | ||||
| C-3 | 1.709 m | 22.8 | 14.4 (C-6), 16.6 (C-4) | ||||
| C-2 | 3.621* | 54.5 | 22.8 (C-3), 167.6 (COO) | ||||
| Methionine (N11) | C-6 | 2.059 (s) | 14.4 | — | 0.67 ± 0.07 | 0.90 ± 0.08 | |
| C-4 | 2.697 (t, J = 7.5 Hz) | 30.6 | 35.4 (C-3) | ||||
| C-2 | 2.474* | 64.4 | 173.8 (COO) | ||||
| C-3 | 1.991* | 35.4 | |||||
|
|||||||
| Sterols | |||||||
| β-Sitosterol (N12) | C-18 | 0.923 (3H, s) | 14.4 | 43.9 (C-13), 55.5 (C-14) | 8.14 ± 1.24 | 3.64 ± 0.34 | |
| C-19 | 1.195 (3H, s) | 20.3 | 57.2 (C-9), 33.8 | ||||
| C26/27 | 0.850 (d, 6 Hz) | 14.4, 20.3 | 26.9 (C-25) | ||||
| C-3 | 3.463 (m) | 65.8 | 35.8 (C-2) | ||||
| C-6 | 5.338 (brt) | 125.5 | 128.9 (C-5), 40.9 (C-4), 30.7 (C-7) | ||||
|
|||||||
| Sugars | |||||||
| α-Glucose (N13) | C-1 | 5.095 (d, J = 3.6 Hz) | 3.35, 3.68 | 93.9 | — | 1.48 ± 0.37 | 1.07 ± 0.81 |
| C-2 | 3.35* | 73.8 | 74.7 (C3) | ||||
| C-5 | 3.68 (d, J = 2.4 Hz) | 65.8 | 72.9 (C4) | ||||
| β-Glucose (N14) | C-1 | 4.457 (d, J = 7.79 Hz) | 3.28, 3.34 | 98.1 | 77.9 (C2) | 1.07 ± 0.00 | 1.07 ± 0.64 |
| C-2 | 3.288* | 77.9 | 74.8 (C3) | ||||
| C-5 | 3.344* | 73.3 | 71.6 (C4) | ||||
| Sucrose (N15) | C-1 | 5.019 (d, J = 3.85 Hz) | 3.42, 3.70 | 93.6 | 73.1 (C5), 105.2 (C2′) | 2.03 ± 0.59 | 1.24 ± 0.70 |
| C-2 | 3.458 (d, J = 1.68 Hz) | ||||||
| C-3 | 3.707* | 62.7 | |||||
| α-Fructofuranose (N16) | C-2 | 4.711 brs | 112.3 | 35.5 | 1.36 ± 1.42 | 6.11 ± 6.49 | |
| 49.8 | |||||||
| C-5 | 4.028 (d, J = 1.2 Hz) | 76.78 | 71.2 (C4) | ||||
| β-Fructofuranose (N17) | C-2 | 4.924 brs | 112.3 | 35.4 | 1.98 ± 2.22 | 1.42 ± 1.51 | |
| 49.8 | |||||||
| C-3 | 4.163 (d, J = 5.7 Hz) | 76.7 | 75.6 (C5) | ||||
| C-6 | 3.734* | 63.7 | 72.9 (C5) | ||||
| Glycerol (N18) | C-1 | 3.575 (m)* | 64.6 | 74.8 (C2) | |||
| C-2 | 3.635* | 74.8 | — | ||||
2.9. Statistical analysis
NMR quantification data were analyzed using the Co-Stat version 8 software (Monterey, CA, USA). Data are expressed as mean ± SD of the groups. One-way ANOVA followed by Student–Newman–Keuls tests were used to determine significant differences among pepper sample groups, with 95% confidence limit. Differences were considered statistically significant when p ≤ 0.05. Statistical analysis from microbial count test was done using Graphpad prism 6.2.10. Antimicrobial activity
For MBC determination, microplates from the MIC experiment were used after incubation. A volume of 10 μL was spotted onto Mueller–Hinton agar (MHA) plates from the wells that showed visible inhibition of growth, and incubated for 24 h at 37 °C. The MBC was defined as the minimum concentration of the tested extract without detectable growth on MHA plates of the target organism.26 The experiment was done at least in three independent replicates, and MIC was expressed as mean ± SD.
3. Results and discussion
The current study aims to assess metabolome variation in black and white pepper in the context of aroma, nutrient, and secondary metabolites profiles, and further in response to autoclaving using MS- and NMR-based metabolomics. Comparison between remote (air based) and direct (extract based) antimicrobial effects against several food borne pathogens was determined to better assess for its food preservative action against bacteria and fungi and in relation to its metabolite profile revealed using NMR and MS techniques.3.1. NMR analysis of black and white pepper fruits' metabolome
1H-NMR was introduced herein to assess metabolites heterogeneity among black and white pepper, alongside quantification of its major metabolites for future standardization purposes using NMR. 1H-NMR signal assignments were further confirmed using 2D-NMR experiments including 1H-1H TOCSY, 1H-13C HSQC, and 1H-13C HMBC to aid in metabolites assignments.27 Eighteen metabolites were identified and listed along with their chemical shifts and distribution in black and white pepper, Table 1. 1H-NMR spectra from black and white pepper methanol extracts are shown in Fig. 1. 1H NMR spectra were divided into two main regions: an upfield region from δ 0.5–5.0 ppm for high intensity signals belonging mostly to primary metabolites viz. fatty acids (FAs), amino acids, organic acids, and sugars (Fig. 1A). A second downfield region from δ 5.0–7.5 ppm was ascribed to secondary metabolites and highly dominated by piperine (N1) and its isomer chavicine (N2) signals (Fig. 1B), structures are listed in Fig. 2.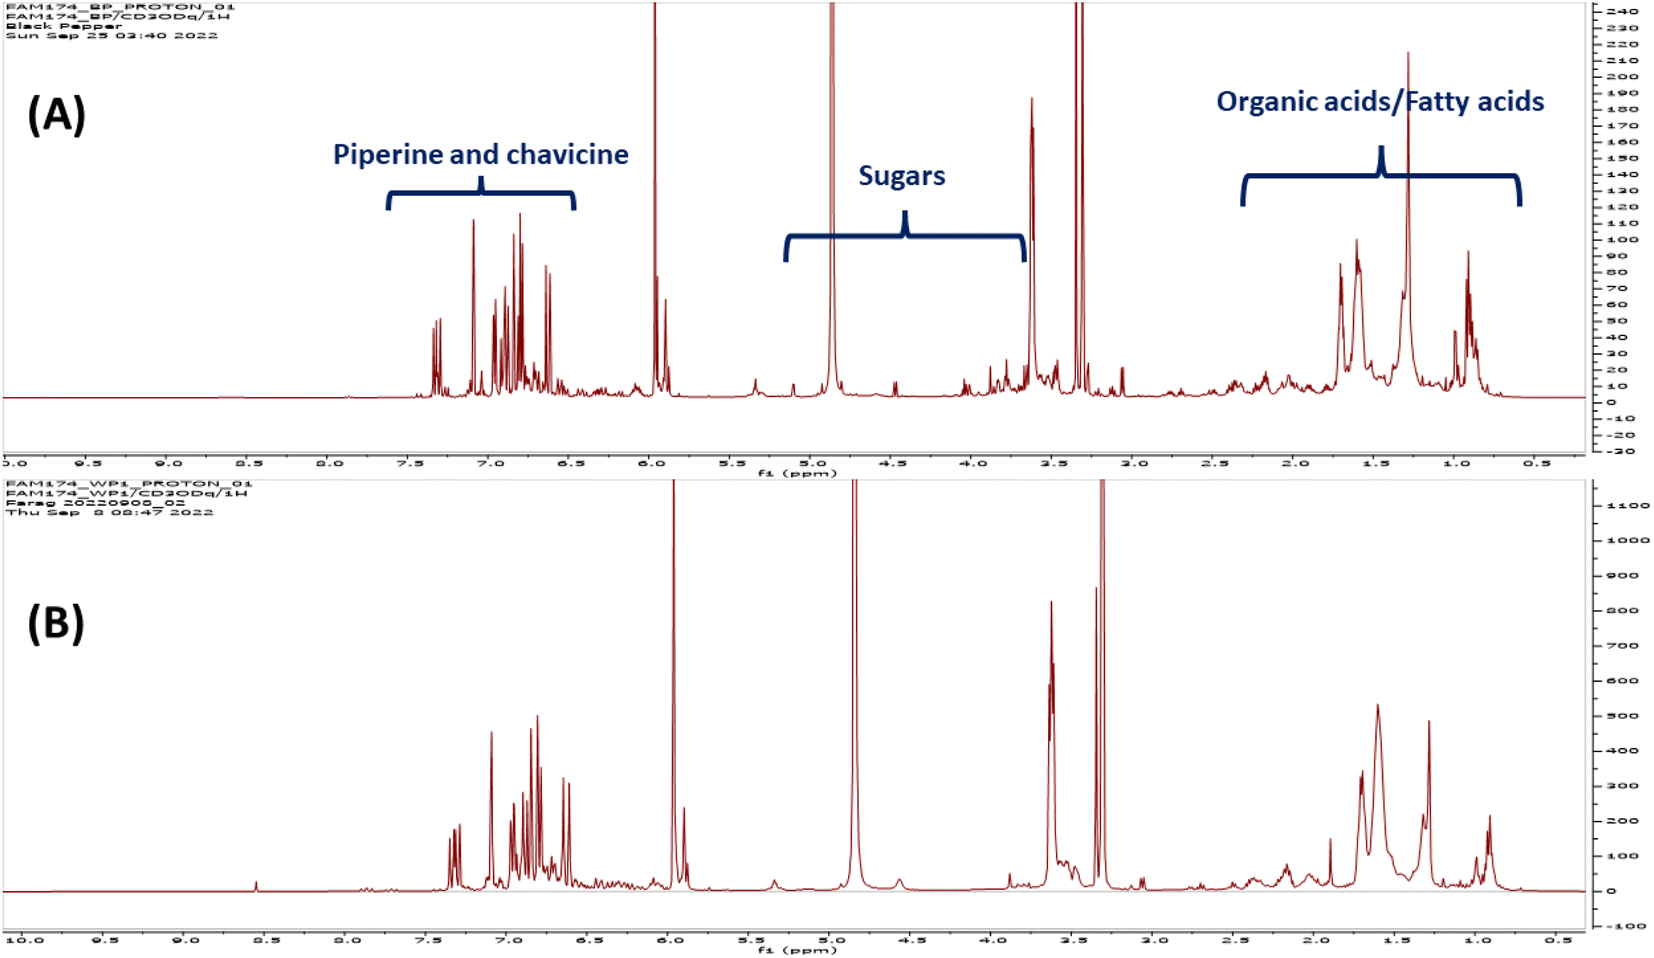 | ||
| Fig. 1 1H-NMR spectra of (A) black pepper and (B) white pepper extracts (CD3OD) showing compound classes that are observed up-field vs. downfield in the NMR spectra. | ||
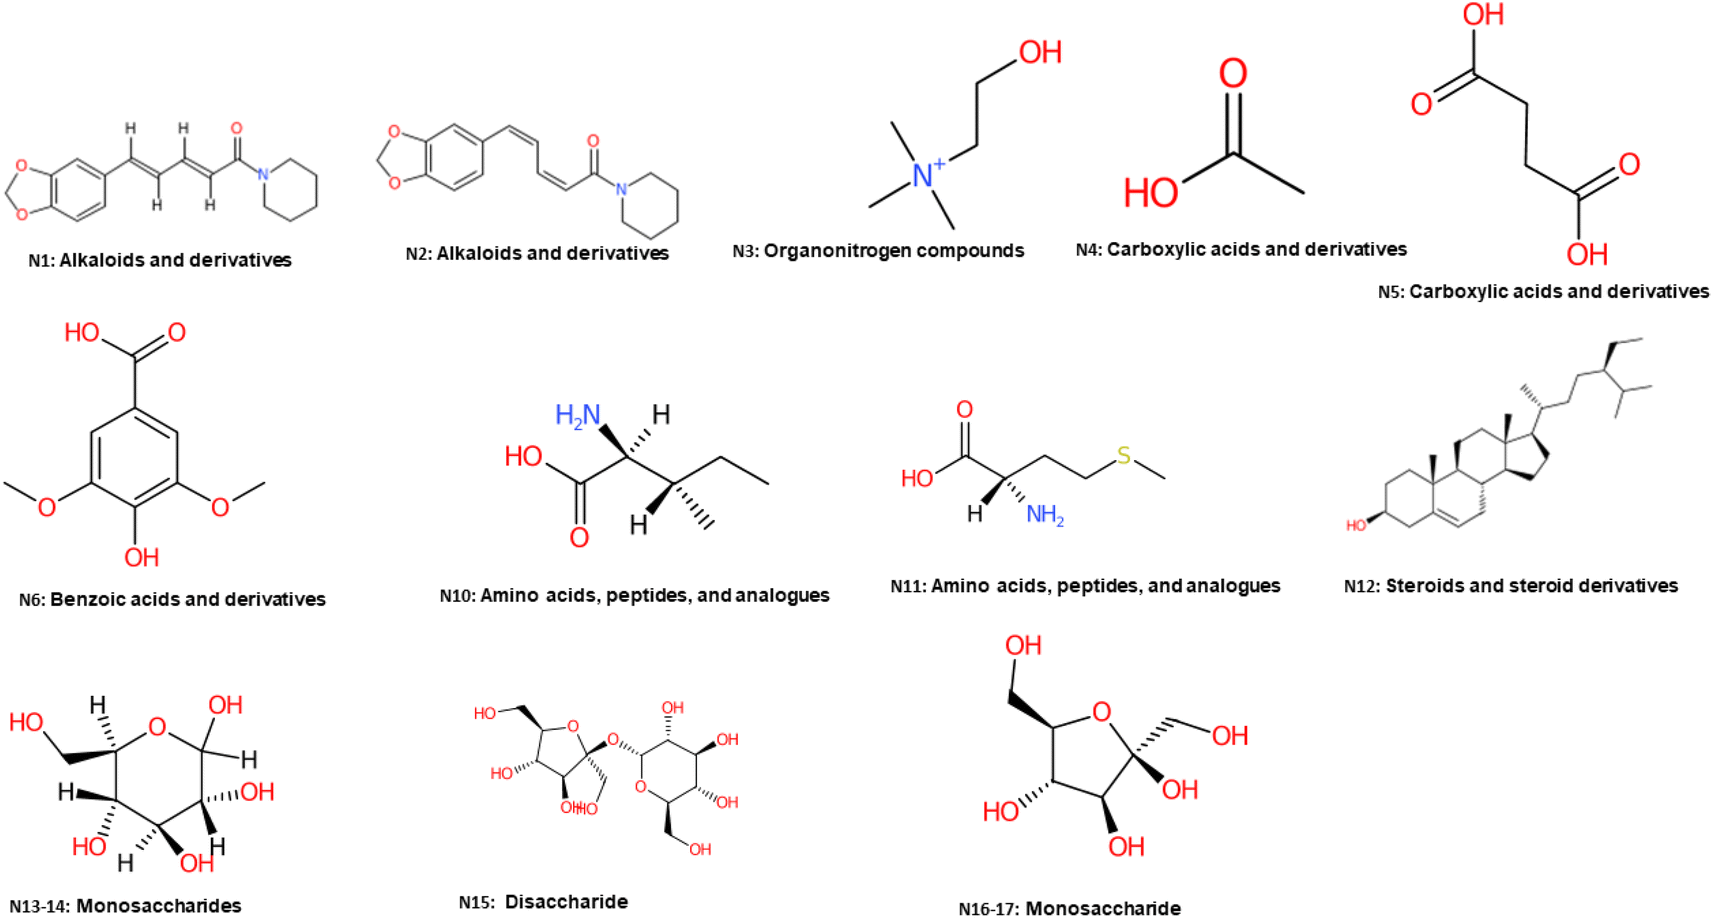 | ||
| Fig. 2 Major identified metabolites in black and white pepper using NMR and classified with ClassyFire.49 | ||
CH–) of unsaturated fatty acids at δ 5.338 ppm (Fig. 1, Table 1). In addition, upfield aliphatic region showed triplet at δ 0.907 ppm (J = 7.2 Hz) assigned to the terminal methyl group (–CH3), whereas methylene groups in fatty chains (–(CH2)n–) were detected at δ 1.285–1.309 ppm (Table 1). Other prominent signals characteristic for FAs were detected such as methylene groups adjacent to the carbonyl moiety (–CH2–COOR) appearing at δ 2.324 ppm (Table 1). FAs 1H NMR data were confirmed using 1H-13C-HSQC revealing cross peak δH/C between δH 1.26–1.30 with methylene carbon at δC 30.1 indicative of the repeated methylenes in FA chain. Additionally, unsaturation in FA chains was confirmed by the presence of cross peak at δH/C (5.338/130.8) which could be confirmed from HMBC correlation to adjacent methylene at δH/C 2.03/28.1, and the aliphatic methylenes at δC 30.2, Fig. S4.† Moreover, fatty acids were characterized from carbonyl at δC 179.12 and adjacent methylene at δH/C 2.324/34.1. Amide derivatives could be identified from the upfield shift of amide carbon at δC 174.52 and downfield shift of the adjacent methylene proton at δH 2.33 (Table 1, Fig. S4†). 1H NMR signals characteristic for glycerol backbone of 1-monoacylglycerol (1-MAG) were assigned in accordance to literature,2 in addition to TOCSY, HSQC, and HMBC spectra. 1-MAG 1H NMR signals were observed at δ 3.485 ppm (dd, J = 5.88, 9.02 Hz), δ 3.792 ppm (dd, J = 3.31, 5.21 Hz), δ 3.956 ppm (m), δ 4.025 ppm (dd, J = 5.88, 11.4 Hz), and δ 4.164 ppm (dd, J = 3.58, 12.07 Hz) (Table 1).Characteristic signals for β-sitosterol (N12) were identified at (δ 0.923, s; 1.195, s; 0.85, d; 3.463, m; and 5.33, t) and further in 2D spectra HSQC (δH/C 0.923/14.4, 1.195/20.3, and 5.338/125.5), and HMBC (δH/C 5.338/128.9, 40.9, 30.7) in accordance with literature, Fig. S4, S6, and S7.†28,29 Other identified primary metabolites included carboxylic acids i.e., acetic (δ 1.976 ppm, s), succinic (δ 2.529 ppm, s), and syringic acid (δ 3.899, 7.042 ppm), with 2D spectra to confirm their assignments.
3.2. Quantitative NMR of major pepper metabolites
Owing to its universal response to all metabolites, NMR can be used for quantification especially if well resolved discriminatory signals exist28 via 1H-NMR expressed as μg mg−1 dry powder, Table 1. Piperine level in black and white pepper was quantified from its characteristic signal at δH 5.961 (s) detected at 20.2 and 23.9 μg mg−1, respectively, and identified as major secondary metabolite.2 Unlike piperine, its isomer chavicine was quantified at a much lower level of 7.9, and 5.6 μg mg−1 in black and white pepper, respectively. Organic acids were detected at trace levels exemplified by acetic acid at 0.1–0.2 μg mg−1, whereas succinic acid was detected at ca. 0.4 μg mg−1 to likely to contribute to pepper flavor and taste perception. β-Sitosterol30 was quantified from its signal at δH 0.923 (s) at much higher level in black pepper (8.1 μg mg−1) compared to white pepper (3.6 μg mg−1). Regarding sugars, low levels of mono sugars were detected compared to secondary metabolites in both peppers represented by glucose and sucrose at 2.0 and 1.5 μg mg−1. In contrast, fructose was quantified at 7.5 and 3.3 μg mg−1 in white and black pepper, respectively.3.3. Unsupervised multivariate data analysis of NMR dataset
Both principal component analysis (PCA) score and loading plots were initially constructed to discriminate between black and white pepper metabolite profiles in two attempts, from all spectral width (δ 0.4–10.0 ppm), and from the aromatic region only (δ 5.5–10.0 ppm) to more focus on secondary metabolites in black and white pepper as illustrated in the heat map (Fig. S9†).The first PCA model based on the full 1H-NMR spectrum (δ 0–10 ppm) provided an overview of primary and secondary metabolites distribution derived mostly from the aliphatic upfield (δ ≤ 5.4 ppm) and the aromatic downfield regions (δ > 5.5 ppm), respectively. Based on the full δ H scale, PCA score plot accounted for 80% of the total variance (Fig. 3A). An obvious segregation was observed between black pepper at the right side from white pepper at left side alongside PC1. The corresponding loading plot (Fig. 3B) revealed that piperine alkaloid could be recognized as most abundant in white pepper, whereas unsaturated fatty acids, isoleucine, and β-sitosterol were more enriched in black pepper. Likewise, to aid in identifying variation within aromatic region (δ H 5.5–10.0 ppm), another PCA model (Fig. 3C) was constructed. The main principal component (PC) to differentiate specimens in PCA i.e., PC1 accounted for 92% of the total variance with black pepper positioned at left side, whereas white pepper segregated towards the right side. PCA Loading plot (Fig. 3D) revealed piperine and its isomer (chavicine) were enriched in white pepper. Such results match the literature which revealed the abundance of piperine in white pepper detected at 2.9% in black versus 4.1% in white peppercorn.31
 | ||
| Fig. 3 (A) PCA score plot (0.4–10 ppm). (B) Loading plot derived from black pepper modeled against white pepper sample analyzed using 1H-NMR (δ 0–10.0 ppm), n = 3. (C) PCA score plot (5.5–10 ppm). (D) Loading plot derived from black pepper modeled against white pepper sample analyzed by 1H-NMR (δ 5.5–10.0 ppm), n = 3. | ||
3.4. Headspace-SPME-GC-MS volatiles analysis of raw and autoclaved pepper
Assessment of aroma in both white and black pepper pre- and post-autoclaving was performed to account for aroma determinants in pepper as revealed using headspace SPME technique (Fig. 4). A total of 52 volatile peaks were detected in pepper using headspace-solid-phase microextraction (HS-SPME) coupled with GC-MS analysis (Table 2, Fig. S10†). Identified volatiles belonged to several classes viz. alcohols, ketones, aliphatic hydrocarbons, oxides/ether, oxygenated monoterpene, esters, phenols/ethers, and monoterpene/sesquiterpene hydrocarbons as discussed in the next subsections.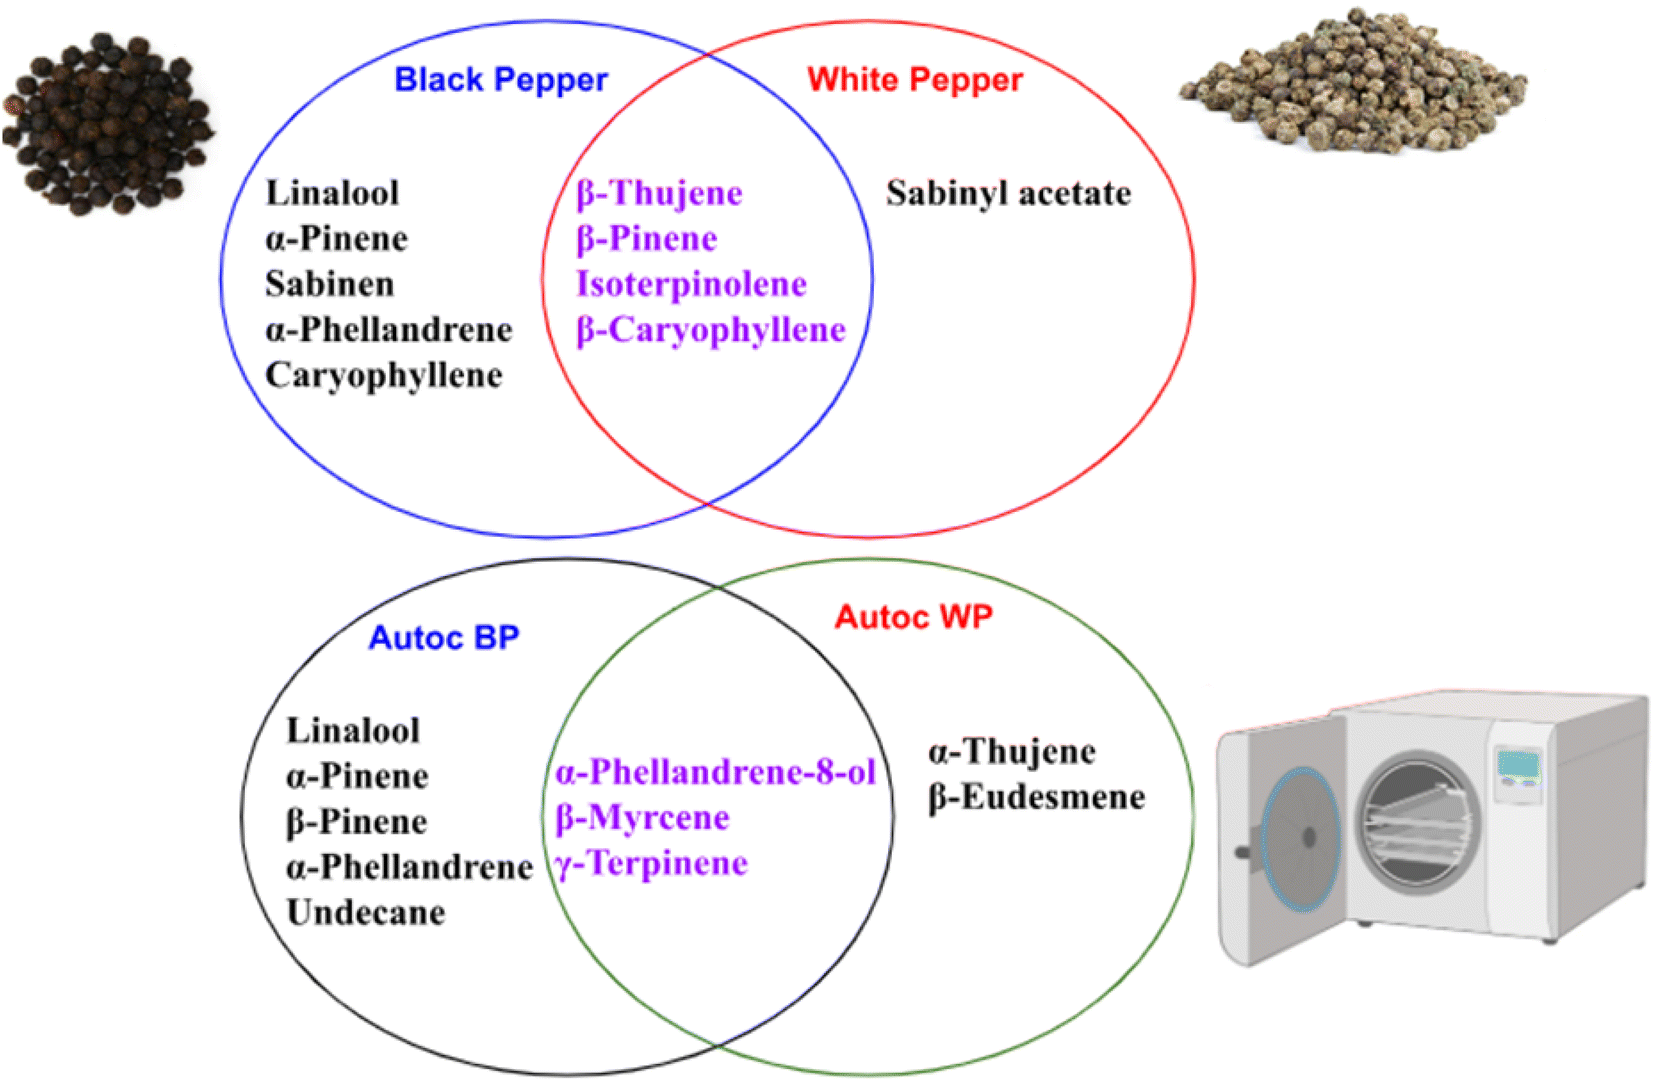 | ||
| Fig. 4 A Venn diagram summarizing the unique and shared metabolites detected in black and white pepper before and after autoclaving. | ||
| Peak no | Average Rt (min) | Average RI | Name | Class | Black pepper | White pepper | Autoc BP | Autoc WP |
|---|---|---|---|---|---|---|---|---|
| 1 | 6.78 | 890 | 3-Hexenol | Alcohol | 0.01 ± 0.01 | — | 1.64 ± 1.36 | — |
| 20 | 10.55 | 1119 | 4-Thujanol | Alcohol | 0.01 ± 0.01 | — | 0.11 ± 0.13 | — |
| 23 | 10.91 | 1144 | Linalool | Alcohol | 0.02 ± 0.02 | — | 1.47 ± 1.79 | — |
| 24 | 11.03 | 1152 | β-Terpineol | Alcohol | — | — | 0.04 ± 0.04 | — |
| 28 | 11.84 | 1210 | α-Phellandrene-8-ol | Alcohol | — | — | 0.08 ± 0.13 | 60.47 ± 16.63 |
| 29 | 12.08 | 1229 | p-Cymen-8-ol | Alcohol | — | — | 0.20 ± 0.08 | — |
| 30 | 12.20 | 1237 | 4-Terpineol | Alcohol | 0.02 ± 0.01 | — | 0.47 ± 0.22 | — |
| Total alcohol | 0.06 ± 0.05 | 0.01 ± 0.00 | 4.01 ± 3.77 | 60.47 ± 16.63 | ||||
| 16 | 10.02 | 1084 | Undecane | Aliphatic hydrocarbon | — | — | 1.28 ± 0.51 | — |
| 33 | 13.15 | 1311 | 2-Methylundecane | Aliphatic hydrocarbon | — | — | 0.13 ± 0.14 | 0.10 ± 0.04 |
| Total aliphatic hydrocarbon | — | — | 1.40 ± 0.66 | 0.10 ± 0.04 | ||||
| 35 | — | 1340 | Sabinyl acetate | Ester | — | 0.02 ± 0.02 | 0.78 ± 0.17 | 0.18 ± 0.10 |
| 42 | — | 1434 | α-Terpinyl acetate | Ester | — | — | 3.34 ± 0.31 | — |
| Total ester | — | 0.02 ± 0.02 | 4.12 ± 0.48 | 0.18 ± 0.10 | ||||
| 9 | 9.14 | 1027 | 2-Nonanone | Ketone | 0.04 ± 0.04 | 0.05 ± 0.01 | 1.22 ± 1.24 | — |
| 41 | 14.43 | 1415 | 3′-Hydroxyacetophenone | Ketone | — | — | — | 0.23 ± 0.19 |
| 27 | 11.59 | 1192 | Camphor | Ketone | — | — | 0.02 ± 0.02 | 0.09 ± 0.05 |
| Total ketone | 0.04 ± 0.04 | 0.05 ± 0.01 | 1.24 ± 1.26 | 0.32 ± 0.24 | ||||
| 2 | 7.36 | 922 | α-Thujene | Monoterpene hydrocarbon | — | — | — | 0.21 ± 0.18 |
| 3 | 8.00 | 959 | α-Pinene | Monoterpene hydrocarbon | 0.13 ± 0.14 | — | 4.52 ± 3.33 | — |
| 4 | 8.16 | 968 | β-Thujene | Monoterpene hydrocarbon | 0.11 ± 0.10 | 0.07 ± 0.02 | 6.37 ± 0.75 | — |
| 5 | 8.72 | 1002 | β-Thujene isomer | Monoterpene hydrocarbon | 0.22 ± 0.38 | — | 4.94 ± 2.34 | — |
| 6 | 8.88 | 1010 | Sabinen | Monoterpene hydrocarbon | 0.33 ± 0.17 | — | 10.80 ± 0.52 | — |
| 7 | 8.99 | 1018 | β-Pinene | Monoterpene hydrocarbon | 0.16 ± 0.07 | 0.15 ± 0.04 | 1.88 ± 0.11 | — |
| 8 | 9.06 | 1023 | β-Myrcene | Monoterpene hydrocarbon | — | — | 0.03 ± 0.03 | 4.32 ± 1.18 |
| 10 | 9.41 | 1044 | α-Phellandrene | Monoterpene hydrocarbon | 0.14 ± 0.24 | — | 8.39 ± 3.23 | — |
| 11 | 9.53 | 1052 | Isoterpinolene | Monoterpene hydrocarbon | 15.57 ± 13.53 | 40.50 ± 15.81 | 0.42 ± 0.16 | — |
| 12 | 9.71 | 1064 | Limonene | Monoterpene hydrocarbon | 0.05 ± 0.03 | 0.06 ± 0.02 | 1.52 ± 1.53 | — |
| 13 | 9.86 | 1072 | m-Cymene | Monoterpene hydrocarbon | 0.39 ± 0.17 | 0.23 ± 0.05 | 0.63 ± 0.67 | — |
| 14 | 9.88 | 1076 | β-Ocimene | Monoterpene hydrocarbon | 0.01 ± 0.01 | — | 0.64 ± 0.15 | — |
| 17 | 10.23 | 1097 | γ-Terpinene | Monoterpene hydrocarbon | — | — | 0.01 ± 0.01 | 20.78 ± 14.06 |
| 19 | 10.47 | 1111 | Terpinolene | Monoterpene hydrocarbon | — | — | 0.05 ± 0.06 | 0.31 ± 0.20 |
| 21 | 10.70 | 1129 | α- Terpinolene | Monoterpene hydrocarbon | 0.01 ± 0.01 | 0.01 ± 0.00 | 0.26 ± 0.17 | — |
| 22 | 10.76 | 1135 | p-Cymenene | Monoterpene hydrocarbon | — | — | 0.06 ± 0.07 | 3.08 ± 2.34 |
| Total monoterpene hydrocarbon | 17.12 ± 14.84 | 41.02 ± 15.94 | 40.53 ± 13.12 | 28.69 ± 17.97 | ||||
| 15 | 9.98 | — | Cineole | — | 0.01 ± 0.01 | — | 0.12 ± 0.11 | — |
| Total oxide/ether | 0.01 ± 0.01 | — | 0.12 ± 0.11 | — | ||||
| 32 | 12.69 | 1274 | Methyl mandelate | Phenol/ether | — | — | 0.07 ± 0.03 | 0.17 ± 0.11 |
| Total phenol/ether | — | — | 0.07 ± 0.03 | 0.17 ± 0.11 | ||||
| 18 | 10.36 | 1105 | α-Cubebene | Sesquiterpene hydrocarbon | — | — | 0.06 ± 0.06 | 5.78 ± 1.49 |
| 25 | 11.30 | 1172 | Copaene | Sesquiterpene hydrocarbon | 0.04 ± 0.07 | — | 0.14 ± 0.10 | — |
| 26 | 11.54 | 1188 | β-Elemene | Sesquiterpene hydrocarbon | — | — | — | 0.19 ± 0.21 |
| 31 | 12.52 | 1262 | Caryophyllene | Sesquiterpene hydrocarbon | 0.30 ± 0.52 | — | 1.01 ± 0.63 | — |
| 34 | 13.24 | 1317 | α-Humulene | Sesquiterpene hydrocarbon | 0.02 ± 0.03 | — | 0.17 ± 0.18 | — |
| 36 | 13.72 | 1357 | Germacrene D | Sesquiterpene hydrocarbon | 0.01 ± 0.01 | — | 0.06 ± 0.08 | 0.15 ± 0.07 |
| 37 | 13.93 | 1371 | α-Selinene | Sesquiterpene hydrocarbon | — | — | 0.01 ± 0.02 | 0.24 ± 0.23 |
| 38 | 14.10 | 1387 | β-Farnesene | Sesquiterpene hydrocarbon | 0.01 ± 0.02 | — | 0.30 ± 0.06 | 3.49 ± 2.04 |
| 39 | 14.21 | 1397 | δ-EIemene | Sesquiterpene hydrocarbon | 0.05 ± 0.02 | 0.06 ± 0.00 | 0.67 ± 0.40 | — |
| 40 | 14.35 | 1408 | α-Cubebene | Sesquiterpene hydrocarbon | 0.01 ± 0.01 | — | 0.25 ± 0.25 | — |
| 43 | 14.79 | 1445 | Copaene | Sesquiterpene hydrocarbon | 0.13 ± 0.08 | 0.03 ± 0.00 | 0.33 ± 0.05 | — |
| 44 | 14.91 | 1454 | γ-Gurjunene | Sesquiterpene hydrocarbon | 0.02 ± 0.01 | 0.01 ± 0.00 | 1.06 ± 1.06 | — |
| 45 | 15.23 | 1480 | α-Gurjunene | Sesquiterpene hydrocarbon | 0.01 ± 0.00 | — | 43.17 ± 5.10 | — |
| 46 | 15.44 | 1498 | β-Caryophyllene | Sesquiterpene hydrocarbon | 82.07 ± 13.08 | 58.76 ± 15.97 | 0.76 ± 0.52 | — |
| 47 | 15.75 | 1520 | α-Muurolene | Sesquiterpene hydrocarbon | — | — | 0.06 ± 0.04 | 0.06 ± 0.06 |
| 48 | 15.90 | 1530 | α-Bisabolene | Sesquiterpene hydrocarbon | 0.06 ± 0.03 | 0.03 ± 0.00 | 0.29 ± 0.19 | — |
| 49 | 16.27 | 1556 | D-Germacrene | Sesquiterpene hydrocarbon | 0.01 ± 0.01 | — | 0.09 ± 0.08 | 0.04 ± 0.04 |
| 50 | 16.40 | 1564 | β-Eudesmene | Sesquiterpene hydrocarbon | — | — | — | 0.11 ± 0.15 |
| 51 | 16.47 | 1570 | γ-Selinene | Sesquiterpene hydrocarbon | 0.01 ± 0.01 | — | 0.01 ± 0.01 | — |
| 52 | 16.71 | 1587 | δ-Cadinene | Sesquiterpene hydrocarbon | 0.01 ± 0.01 | — | 0.04 ± 0.04 | — |
| Total sesquiterpene hydrocarbon | 82.76 ± 13.90 | 58.90 ± 15.98 | 48.49 ± 8.89 | 10.07 ± 4.29 | ||||
3.5. PCA and OPLS analyses of black and white pepper fruits aroma
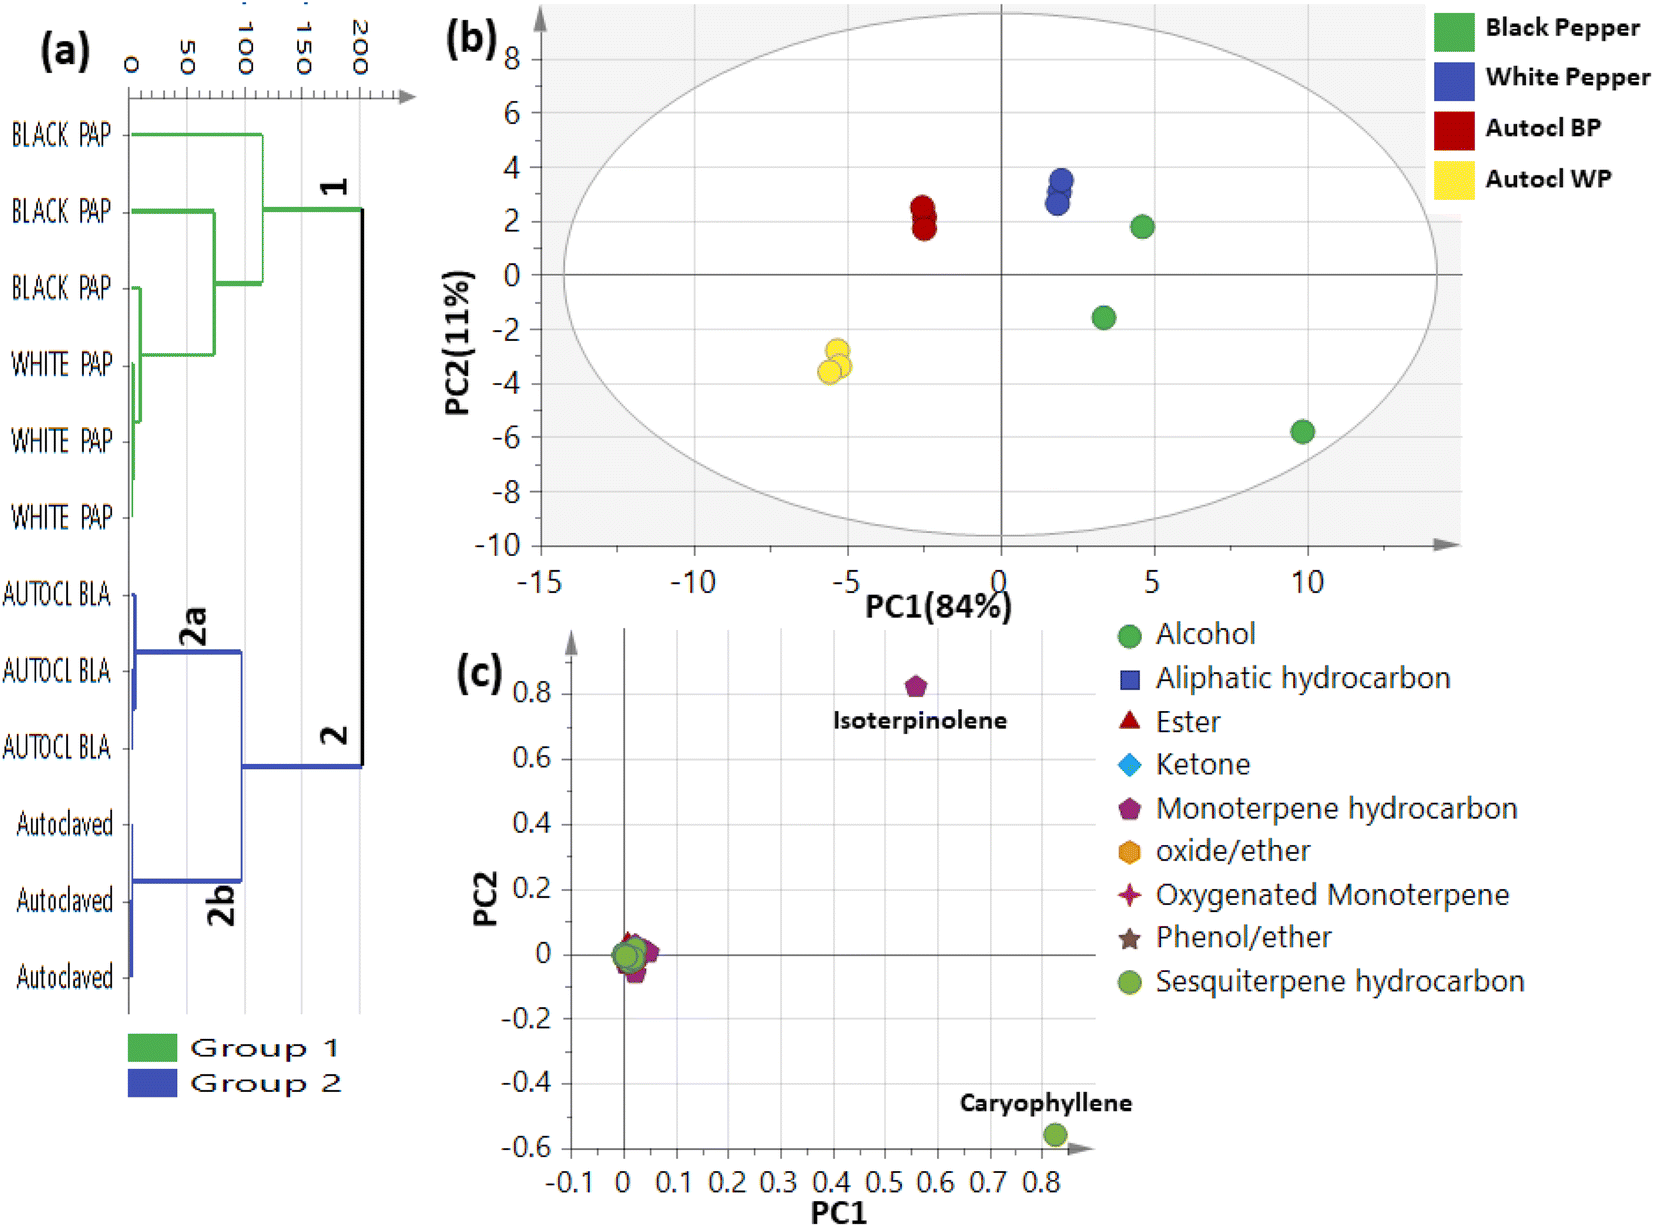 | ||
| Fig. 5 Unsupervised multivariate data analyses of black and white pepper aroma compounds before and after autoclaving detected using GC-MS (n = 3). (a) HCA plot. (b) PCA score plot of PC1 vs. PC2 scores. (c) The respective loading plot for PC1 and PC2, providing peak assignments. The metabolome clusters are placed in two-dimensional space at the distinct locations defined by two vectors of principal component PC1 = 84% and PC2 = 11%. | ||
3.6. Antimicrobial activity of pepper samples via vapor-phase minimum inhibitory concentration (VP-MIC) and MIC of pepper fruit extract
Spices typically present a good source of antimicrobial agents that could be used as food preservative43,44 mostly attributed to its essential oil rich composition. Essential oils are though mostly hydrophobic in nature with poor solubility in aqueous solutions and require solvents and emulsifiers for solubilization in aqueous culture media.45 To overcome such drawback, VP-MIC was used in this study to assess pepper antimicrobial effect. Another advantage for using VP-MIC lies in its ability to use the solid intact herb to assess its suitability be used as food preservative.25 The VP-MIC was examined for the remote inhibition effect of pepper against different resistant bacterial cultures reported to be food borne (Fig. S13A and B†). Interestingly, results showed inhibitory activity of both white and black pepper against both Gram-positive and Gram-negative bacteria using this assay (Table S1†). The highest activity was recorded against P. aeruginosa (VP-MIC 16.4 and 12.9 mg mL−1) for white pepper and black pepper, respectively. Such results is due to the abundance of sesquiterpene in black and white pepper specially β-caryophyllene which was reported for its flavor asides from antimicrobial properties.32,33 However, autoclaving of both black and white pepper resulted in decreased antimicrobial effect as demonstrated by loss of activity against most tested organisms (Table S1†). Such decline in the activity is attributed for the distinct decrease in sesquiterpene hydrocarbons post autoclaving as β-caryophyllene almost reached trace level in autoclaved black and white pepper owing to its decomposition at elevated temperature.34 Except for such pattern was sustain of antimicrobial effect post autoclaving against two medically important enteric pathogens (P. aeruginosa and S. typhi) with though higher VP-MIC values (40 mg mL−1) as demonstrated in Table S1.† The decreased antimicrobial activity post autoclaving might be attributed for decrease in key antimicrobial volatiles specially β-caryophyllene which almost reached trace level in autoclaved black and white pepper owing to its decomposition at elevated temperature.46 To further compare antimicrobial effect of ground pepper mediated via its aroma (remote effect) as analyzed using SPME GCMS, crude extract was prepared and subjected for antimicrobial activity under same conditions as a direct measure of pepper antimicrobial effect better revealed using NMR technique. Pepper extract was further tested for the direct inhibition using microdilution method for the determination of MIC against bacteria especially that showed positive inhibition in VP-MIC (MRSA Staphylococcus aureus USA 300, Acinetobacter baumannii AB5075, Salmonella typhi ATCC35664, Enterococcus faecalis ATCC19433, Enterobacter cloacae and Pseudomonas aeruginosa PAO1). The MIC results using microdilution method of pepper methanol extracts was demonstrated in Table S2.† It should be noted that MIC values in VP-MIC (remote action) were higher than those obtained in the microdilution assay (direct action), which might be due to either the presence of non-volatile antimicrobial compounds in pepper extracts to contribute more to pepper antimicrobial action47 or dilution of antimicrobial agent in the headspace above ground pepper powder in remote assay scenario. No bactericidal activity (MBC) was detected for pepper extracts, which suggested that the direct inhibition previously observed in the microplate might be due to a bacteriostatic rather than a bactericidal action.484. Conclusion
The current study presented a comparative NMR and GC-MS based metabolomics approach for Piper nigrum analysis including both black and white pepper and in response to autoclaving. NMR fingerprinting of black and white pepper led to the identification of 18 metabolites belonging to alkaloids/nitrogenous, organic/fatty/amino acids, sterols, and sugars among which 11 metabolites were quantified for the first time. Piperine (N1) was the major metabolites quantified in both black and white pepper at comparable levels 20–24 μg mg−1, respectively. Furthermore, 52 volatiles belonging to different classes were identified using HS-SPME/GC-MS analysis. Sesquiterpene hydrocarbons amounted as major class in black and white pepper detected at ca. 82.7 and 58.9%, respectively represented mostly by β-caryophyllene (peak 46) as most abundant at ca. 82 and 58.7%, respectively. A supervised OPLS-DA model of raw and autoclaved pepper fruit revealed distinct segregation between raw and autoclaved pepper indicating the effect of autoclaving on pepper sensory attributes but not efficient to distinguish between raw black and white pepper. Screening for the remote antimicrobial activity of both black and white pepper was tested in vitro revealing inhibitory activity against both Gram-positive and Gram-negative bacteria, which suggests that pepper condiment could be used as a natural food preservative. Moreover, the remote antimicrobial effect was retained against the powerful enteric pathogens P. aeruginosa and S. typhi after autoclaving. However, the remote activity against other bacteria was lost post autoclaving. The direct antimicrobial activity of pepper methanol extract was more powerful than the remote effect, which supports the potential use of pepper in food preservation when it's in direct contact with the food preparation. Future work shall assess other processing methods i.e., pasteurization, or γ-radiation as other methods for sterilization of raw spices. In addition, other spices could be mixed to obtain a wider spectrum of antimicrobial activity to achieve the ecofriendly vision of foods preservation with natural spices as safer options and to benefit from the synergized action of poly herbal formula as typical in most spices. In vivo animal models should be the next logical step to evaluate the direct effect of pepper methanol extract in the treatment of enteric pathogens as a possible alternative to conventional antibiotics, and likewise changes to occur on gut microbiota considering the increasing role of their contribution to health status and nutraceuticals effects.Author contributions
Mostafa H. Baky: methodology, investigation, formal analysis, writing – review editing. Islam M. Kamal: investigation, writing-original draft, Ludger A. Wessjohann: writing-review & editing Mohamed A. Farag: supervision, conceptualization, investigation, writing – review & editing.Conflicts of interest
The authors declare no conflicts of interest.Acknowledgements
This paper is based upon work supported by the Science, Technology & Innovation Funding Authority (STDF), Egypt under grant number 47051.References
- A. Serag, M. H. Baky, S. Döll and M. A. Farag, RSC Adv., 2020, 10, 76–85 RSC.
- A. Rivera-Pérez, R. Romero-González and A. G. Frenich, J. Food Compos. Anal., 2022, 105, 104235 CrossRef.
- A. Rivera-Pérez, R. López-Ruiz, R. Romero-González and A. G. Frenich, Food Chem., 2020, 321, 126727 CrossRef PubMed.
- E. Al-Sayed, H. A. Gad and D. M. El-Kersh, ACS Omega, 2021, 6, 25652–25663 CrossRef CAS PubMed.
- N. Ahmad, H. Fazal, B. H. Abbasi, S. Farooq, M. Ali and M. A. Khan, Asian Pac. J. Trop. Biomed., 2012, 2, S1945–S1953 CrossRef.
- E. E. Mgbeahuruike, T. Yrjönen, H. Vuorela and Y. Holm, S. Afr. J. Bot., 2017, 112, 54–69 CrossRef CAS.
- J. K. da Silva, R. da Trindade, N. S. Alves, P. L. Figueiredo, J. S. Maia and W. Setzer, Int. J. Mol. Sci., 2017, 18, 2571 CrossRef PubMed.
- H. Zhang, R. V. Tikekar, Q. Ding, A. R. Gilbert and S. T. Wimsatt, Compr. Rev. Food Sci. Food Saf., 2020, 19, 2110–2138 CrossRef PubMed.
- M. Polovka and M. Suhaj, Food Rev. Int., 2010, 26, 138–161 CrossRef.
- D. Suresh, H. Manjunatha and K. Srinivasan, J. Food Compos. Anal., 2007, 20, 346–351 CrossRef CAS.
- J. SádeCká, Czech J. Food Sci., 2010, 28, 44–52 CrossRef.
- M. H. Taleb, N. F. Abdeltawab, R. N. Shamma, S. S. Abdelgayed, S. S. Mohamed, M. A. Farag and M. A. Ramadan, Molecules, 2018, 23, 2164 CrossRef PubMed.
- V. M. Verma, Medicinal Plants: From Farm to Pharmacy, 2019, pp. 111–127 Search PubMed.
- M. H. Baky, S. N. Shamma, M. R. Khalifa and M. A. Farag, Metabolites, 2022, 13, 18 CrossRef PubMed.
- M. H. Baky, S. N. Shamma, J. Xiao and M. A. Farag, Food Chem., 2022, 383, 132374 CrossRef CAS PubMed.
- G. Nagana Gowda and D. Raftery, Applications, 2021, pp. 19–37 Search PubMed.
- E. A. Mahrous and M. A. Farag, J. Adv. Res., 2015, 6, 3–15 CrossRef CAS PubMed.
- M. H. Baky, M. B. Elsaid and M. A. Farag, Phytochemisty, 2022, 113345 CrossRef CAS PubMed.
- M. A. Farag, D. M. Rasheed and I. M. Kamal, Food Res. Int., 2015, 78, 327–335 CrossRef CAS PubMed.
- M. A. Farag, S. E. Ali, R. H. Hodaya, H. R. El-Seedi, H. N. Sultani, A. Laub, T. F. Eissa, F. O. Abou-Zaid and L. Wessjohann, Molecules, 2017, 22, 761 CrossRef PubMed.
- S. M. Afifi, A. El-Mahis, A. G. Heiss and M. A. Farag, ACS Omega, 2021, 6, 5775–5785 CrossRef CAS PubMed.
- E. A. El-Hawary, A. Zayed, A. Laub, L. V. Modolo, L. Wessjohann and M. A. Farag, Antioxidants, 2022, 11, 131 CrossRef CAS PubMed.
- A. M. Otify, A. Serag, A. Porzel, L. A. Wessjohann and M. A. Farag, Food Anal. Methods, 2022, 15, 2095–2106 CrossRef.
- A. Serag, A. Zayed, A. Mediani and M. A. Farag, Sci. Rep., 2023, 13, 2533 CrossRef CAS PubMed.
- M. S. Sedeek, S. M. Afifi, M. K. Mansour, M. Hassan, F. M. Mehaya, I. A. Naguib, M. A. Abourehab and M. A. Farag, Molecules, 2022, 27, 6471 CrossRef CAS PubMed.
- I. Serrano, B. Alhinho, E. Cunha, L. Tavares, A. Trindade and M. Oliveira, Life, 2023, 13, 504 CrossRef CAS PubMed.
- M. A. Farag, M. H. Baky, I. Morgan, M. R. Khalifa, R. Rennert, O. G. Mohamed, M. M. El-Sayed, A. Porzel, L. A. Wessjohann and N. S. Ramadan, RSC Adv., 2023, 13, 21471–21493 RSC.
- M. A. Farag, Z. T. Shakour, T. Lübken, A. Frolov, L. A. Wessjohann and E. Mahrous, J. Pharm. Biomed. Anal., 2021, 193, 113727 CrossRef CAS PubMed.
- A. M. Otify, A. Serag, A. Porzel, L. A. Wessjohann and M. A. Farag, Food Anal. Methods, 2022, 15, 2095–2106 CrossRef.
- P. Yadav, C. Chauhan, S. Singh, S. Banerjee and K. Murti, Curr. Bioact. Compd., 2022, 18, 19–27 Search PubMed.
- Z.-X. Liu, S.-R. Xiong, S.-H. Tang, Y. Wang and J. Tan, Food Res. Int., 2023, 167, 112654 CrossRef CAS PubMed.
- K. Myszka, M. T. Schmidt, M. Majcher, W. Juzwa and K. Czaczyk, LWT--Food Sci. Technol., 2017, 83, 118–126 CrossRef CAS.
- H. M. Hashiesh, M. N. Meeran, C. Sharma, B. Sadek, J. A. Kaabi and S. K. J. N. Ojha, Nutrients, 2020, 12, 2963 CrossRef CAS PubMed.
- H.-Y. Lee and M.-J. Ko, Food Sci. Biotechnol., 2021, 30, 1527–1533 CrossRef CAS PubMed.
- N. S. Dosoky, P. Satyal, L. M. Barata, J. K. R. da Silva and W. Setzer, Molecules, 2019, 24, 4244 CrossRef CAS PubMed.
- S. M. Afifi, A. El-Mahis, A. G. Heiss and M. A. Farag, ACS Omega, 2021, 6, 5775–5785 CrossRef CAS PubMed.
- V. J. F. Anikeev, Flavour Fragrance J., 2010, 25, 443–455 CrossRef CAS.
- J. E. Sánchez-Velandia, J.-A. Becerra, S. M. Mejía, A. L. Villa and F. Martínez O, ACS Omega, 2021, 6, 34206–34218 CrossRef PubMed.
- J. D. Tibbetts and S. D. Bull, Adv. Sustainable Syst., 2021, 5, 2000292 CrossRef CAS.
- M. Dvorakova, I. Valterova, D. Saman and T. J. M. Vanek, Molecules, 2011, 16, 10541–10555 CrossRef PubMed.
- V. Vaičiulytė, K. Ložienė, J. Švedienė, V. Raudonienė and A. J. M. Paškevičius, Molecules, 2021, 26, 1065 CrossRef.
- R. F. Lusi, M. A. Perea and R. Sarpong, Acc. Chem. Res., 2022, 55, 746–758 CrossRef CAS.
- V. V. M. A. Souza, J. M. Almeida, L. N. Barbosa and N. C. C. Silva, J. Essent. Oil Res., 2022, 34, 181–194 CrossRef CAS.
- S. Khorrami, F. Kamali and A. Zarrabi, Biocatal. Agric. Biotechnol., 2020, 25, 101620 CrossRef.
- P. Kloucek, J. Smid, A. Frankova, L. Kokoska, I. Valterova and R. Pavela, Food Res. Int., 2012, 47, 161–165 CrossRef CAS.
- S. Ge, Y. Chen, S. Ding, H. Zhou, L. Jiang, Y. Yi, F. Deng and R. Wang, J. Sci. Food Agric., 2020, 100, 3087–3098 CrossRef CAS PubMed.
- S. Van Vuuren, S. Suliman and A. Viljoen, Lett. Appl. Microbiol., 2009, 48, 440–446 CrossRef CAS PubMed.
- S. Khorrami, F. Kamali and A. Zarrabi, Biocatal. Agric. Biotechnol., 2020, 25, 101620 CrossRef.
- Y. Djoumbou Feunang, R. Eisner, C. Knox, L. Chepelev, J. Hastings, G. Owen, E. Fahy, C. Steinbeck, S. Subramanian and E. Bolton, J. Cheminf., 2016, 8, 1–20 Search PubMed.
Footnotes |
| † Electronic supplementary information (ESI) available. See DOI: https://doi.org/10.1039/d4ra00100a |
| ‡ Equal contribution. |
| This journal is © The Royal Society of Chemistry 2024 |