 Open Access Article
Integrated hybrid modeling and SHAP (SHapley Additive exPlanations) to predict and explain the adsorption properties of thermoplastic polyurethane (TPU) porous materials†
Kangyong Ma *
*
Department of Chemistry and Chemical Engineering, College of Ecology, Lishui University, Lishui, 323000, China. E-mail: kangyongma@outlook.com
First published on 4th April 2024
Abstract
As a novel type of oil–water separation material, thermoplastic polyurethane (TPU) porous material exhibits many excellent properties such as low density, high specific surface area, and outstanding oil–water separation performance. However, the performance of thermoplastic polyurethane (TPU) porous materials is often impeded by various factors, and conducting numerous experiments to investigate the relationship between these factors and the adsorption performance can be both expensive and time-consuming. As an alternative to these experiments, machine learning (ML) techniques can be used to estimate experimental results. Therefore, in this study, we developed an integrated hybrid model to predict the adsorption performance of materials and replaced some experiments. We also constructed XGBoost (XGB), Decision Tree Regressor (DT), K-Neighbors Regressor (KNN), Bagging Regression (BGR), and Extra Trees Regression (ETR) single models to predict material properties, all of which exhibited high prediction accuracy. On this basis, SHAP values were employed to explain the influence of single-factor and multi-factor characteristics of such materials on material properties.
1 Introduction
Water is the source of life, but the development of society has caused problems with water ecology, so the development of a new generation of materials that can effectively sense and capture water pollutants is a focus in today's materials science research.1,3,5 In recent years, there has been rapid development of porous materials in the field of water remediation such as metal–organic frameworks (MOFs), polymer porous materials and synthetic 3D porous absorbers.1 However, there are defects such as high production cost, difficult structural design and low adsorption capacity in practical applications. The future development of porous materials will be combined with emerging disciplines such as machine learning to solve the problems in practical applications. The introduction of machine learning techniques provides a new way for the design and optimization of porous materials, which is expected to overcome some of the limitations of traditional preparation methods.1,2Thermoplastic polyurethane (TPU) porous material is a new type of oil–water separation material, which has received widespread attention in the field of oil–water separation due to its low density, high porosity, large specific surface area, three-dimensional interconnected pore structure, hydrophobicity and lipophilicity.7,25 Despite the wide application of TPUs, their performance in practical applications is often affected by a variety of factors such as preparation conditions, pollutant types and environmental conditions.4 Thermoplastic polyurethane (TPU) comprises two key elements: the hard segment, which is obtained by the reaction of isocyanates and diols, and imparts toughness and strength; and the soft segment that provides flexibility and resilience through the reaction of either polyesters or polyethers.4,6
There is a considerable body of literature available today that documents research on thermoplastic polyurethanes and porous materials. For example, Qin et al.7 investigated the hydrophobic obedience of layered porous TPU through thermally induced phase separation in the different solutions concentrations. Ye et al.8 investigated the TPU adsorption under different pH ranges (1–14), temperature (0–90 °C) and flow conditions and performed the quantitative evaluation. Wang et al.9 studied the effect of different pollutant species on the adsorption capacity of TPU porous materials prepared using a simple thermally induced phase separation method. While these studies have made progress in understanding the properties of TPU porous materials, the methods used are often empirical in nature, relying on a trial-and-error approach that is expensive, time-consuming, and environmentally polluting. It is necessary to seek alternative ways and further study the adsorption mechanism to better understand the relationship between TPU porous materials adsorption performance and influencing factors.
Recently, machine learning techniques have garnered significant attention for their exceptional data analysis abilities, and the implementation of advanced machine learning approaches to predictive models has increased.10,11 Pruksawan et al.11 reported the utilization of machine learning for the design and development of bespoke, highly functional materials based on small sample datasets within the domain of materials science. Yan et al.10 demonstrated the potential of machine learning through the successful prediction of corrosion rates through statistical analysis and machine learning algorithms. The study utilized a low-alloy steel marine atmospheric corrosion database to examine the impact of alloying elements and environmental factors on the corrosion behavior of low-alloy steels. These studies highlight the advantages of machine learning for correlation analysis, multivariate fitting, simulation, and data visualization. Therefore, we developed an integrated hybrid machine learning model that includes three basic learners: K-Neighbors Regressor (KNN), Bagging Regression (BGR), Extra Trees Regression (ETR), and an XGBoost (XGB) model and a neural network model to predict the adsorption performance of TPU porous materials, which is more complex than a single prediction model, which is more reliable. Integrating machine learning technology into the research of TPU porous materials is expected to solve the limitations of traditional experimental methods, reduce experimental costs and environmental pollution.
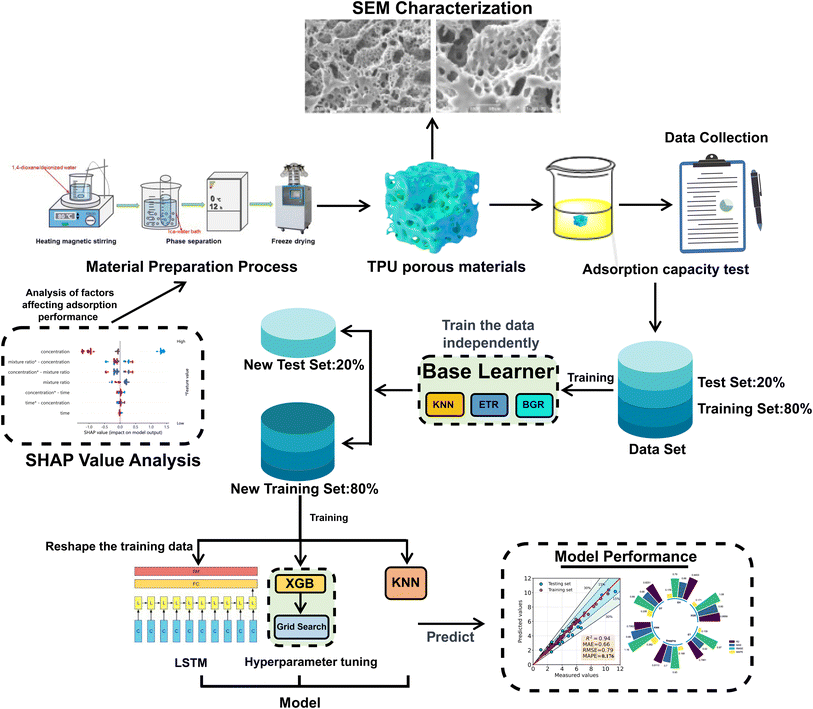
This study combines Shapley value interpretation with machine learning algorithms to construct a prediction model for the adsorption capacity of thermoplastic polyurethane porous materials using experimental data as input. The effect of different preparation conditions on the adsorption properties of TPU porous materials was also investigated through SHapley Additive exPlanations. This work not only demonstrates the potential of machine learning algorithms in predicting material properties and data mining, but also provides new ideas for further research on this type of materials. Fig. 1 shows the experimental procedure of this study.
2 Experimental and machine learning
2.1. Materials
Thermoplastic polyurethane (TPU) particles were purchased from Suzhou Huileduo Plasticizing Co; acetone, cyclohexane, toluene, and anhydrous ethanol were purchased from Shanghai Titan Technology Co. Coconut oil, sweet almond oil, and peanut oil were purchased locally, and deionized water was used during the experiments (ESI† for details).2.2. Preparation of TPU porous materials
Fig. 2 illustrates the procedure for the preparation of TPU porous materials. Weighing 3.2 g of TPU particles, they were dissolved in a mixture of 1,4-dioxane and deionized water (9![[thin space (1/6-em)]](https://www.rsc.org/images/entities/char_2009.gif) :
:![[thin space (1/6-em)]](https://www.rsc.org/images/entities/char_2009.gif) 1, v/v) by heating to 80 °C and magnetic stirring for 90 minutes, resulting in a homogeneous TPU suspension. This suspension was then transferred into a glass tube (15 mm in diameter) and subjected to a preliminary phase separation by placement in an ice-water bath at 0 °C for 30 minutes, followed by transfer to a −20 °C environment for a complete phase separation over the course of 12 hours. The resulting TPU porous material was obtained via freeze-drying at −80 °C and 5 Pa for 48 hours.12,13
1, v/v) by heating to 80 °C and magnetic stirring for 90 minutes, resulting in a homogeneous TPU suspension. This suspension was then transferred into a glass tube (15 mm in diameter) and subjected to a preliminary phase separation by placement in an ice-water bath at 0 °C for 30 minutes, followed by transfer to a −20 °C environment for a complete phase separation over the course of 12 hours. The resulting TPU porous material was obtained via freeze-drying at −80 °C and 5 Pa for 48 hours.12,13
In addition, by changing the initial concentration (4%, 6%, 8% and 10%), phase separation time (15, 30 min), phase separation temperature (0, 4 °C), mixing ratio (8.5![[thin space (1/6-em)]](https://www.rsc.org/images/entities/char_2009.gif) :
:![[thin space (1/6-em)]](https://www.rsc.org/images/entities/char_2009.gif) 1.5, 9
1.5, 9![[thin space (1/6-em)]](https://www.rsc.org/images/entities/char_2009.gif) :
:![[thin space (1/6-em)]](https://www.rsc.org/images/entities/char_2009.gif) 1 and 9.5
1 and 9.5![[thin space (1/6-em)]](https://www.rsc.org/images/entities/char_2009.gif) :
:![[thin space (1/6-em)]](https://www.rsc.org/images/entities/char_2009.gif) 0.5) prepared a series of TPU porous materials under different experimental conditions and tested their adsorption properties according to the method in Section 2.3.
0.5) prepared a series of TPU porous materials under different experimental conditions and tested their adsorption properties according to the method in Section 2.3.
2.3. Pollutant adsorption experiment
A weighing method was used to evaluate the saturable adsorption capacity of thermoplastic polyurethane porous materials for various oils and organic solvents at room temperature. The method consists of immersing the sample in a beaker containing sufficient contaminant for five minutes, then removing it and measuring the weight.14,15 The saturated adsorption capacity (Qm) was calculated using the following equation:where M0 represents the initial mass of the sample and M represents the mass of the sample after immersion and removal, as determined weighing.
2.4. Data and preprocessing
Data from different sources in the literature can be noisy and inconsistent because different environmental conditions, sample sources, purity, and preparation processes can affect experimental data; on the other hand, design-specific material data are often scarce, and the accuracy of data analysis and data mining is influenced by the quality of material data.16 Therefore, in this paper, data on adsorption properties (ESI†) of TPU porous materials under different preparation conditions (concentration, temperature, time, mixing ratio) and different pollutant types (acetone, olive oil, peanut oil, cyclohexane, toluene, sweet almonds, anhydrous ethanol, and coconut oil) have been experimentally tested as the original data set. Following that, the data were subjected to Z-score normalization to reduce redundancy and ensure data consistency and integrity.2.5. Algorithm of adsorption capacity prediction model
Six machine learning algorithms are applied to our dataset as regression tools: Extreme Gradient Boosting (XGBoost), Decision Tree Regressor (DT), K-Neighbors Regressor (KNN), Bagging Regression (BGR), Extra Tree Regression (ETR) and Ensemble Hybrid (EH) model.2.6. Ensemble hybrid model (EH)
The ensemble hybrid model is a hybrid model that integrates multiple basic models and algorithms to improve predictive performance and generalization capabilities. Compared with a single model, integrated mixed models can obtain more information and insights from the predictions of multiple models, and combine them to improve the stability of the prediction. It usually contains two or more basic models, which can be the same or different models. For example, different types of models such as decision trees, random forests, neural networks, and support vector machines can be combined. Each base learner has its advantages and disadvantages. Combining them together can compensate for their respective shortcomings and thus improve the predictive performance of the whole model.17In this study, an ensemble hybrid model based on a single machine learning prediction model was developed for improving the stability and accuracy of prediction results. The model is implemented to predict the data by introducing base learners (KNN, bagging and extra trees), XGBoost model and LSTM (Long Short Term Memory) model. The base learners (KNN, bagging and extra trees) are first trained with the original dataset before prediction is made on test set. The predictions' outcomes are used as new training and test set. The XGBoost model is trained on a new training set, and grid search is used to further optimize model parameters to improve model performance. Another KNN model is trained based on the comprehensive prediction of the base learner, and the LSTM neural network is introduced to make up for the shortcomings of the traditional machine learning algorithm. Finally, the prediction results of the XGBoost, KNN and LSTM models are weighted and averaged. Among them, LSTM (Long Short-Term Memory) is a particular type of RNN (Recurrent Neural Networks) and is a powerful tool that mitigates the long term memory problem and vanishing problem, which appear to be tricky issues in RNNs.18,19 It has become an effective and scalable model for solving several learning problems related to sequential data. The core idea of LSTM is to replace the summation unit in the hidden layer by introducing a storage unit. It can maintain its state over time, as well as a nonlinear gating unit, which regulates the flow of information in and out of the unit.19 Specifically, the LSTM model consists of the following four main components:
Input gate: it decide how much of the input data to the network at the current moment needs to be saved to the cell state.
Forget gate: it decide how much of the unit state from the previous moment needs to be preserved for the current moment.
Cell state: it is the memory part of the LSTM model, responsible for storing long-term infrmation for use in subsequent time steps.
Output gate: it controls how much of the current cell state needs to be output to the current output value.
In addition, five single machine learning models including Extreme Gradient Boosting (XGBoost), Decision Tree Regression (DT), K-Neighborhood Regression (KNN), Bagging Regression (BGR), and Extra Tree Regression (ETR) were used in this study to predict the adsorption capacity of the thermoplastic polyurethane porous material. The parameters of these models were determined by grid search and their specific parameters are shown in Table 1.
| Models | Model parameters |
|---|---|
| XGBoost | n_Estimators = 60, learning_rate = 0.04, max_depth = 6, min_child_weight = 2 |
| Decision tree | Max_depth = 5, random_state = 50, min_samples_split = 2 |
| K-neighbors | Algorithm = ‘ball_tree’, leaf_size = 2, n_neighbors = 3 |
| Bagging | Max_features = 10, max_samples = 40, n_estimators = 100 |
| Extra tree | Max_depth = 12, min_samples_leaf = 2, min_samples_split = 7 |
| Ensemble hybrid | Epochs = 500, number of neurons = 128, dropout = 0.1, batch size = 32 |
2.7. Model performance evaluation
In this paper, four metrics are used to evaluate the performance of adsorption prediction models for thermoplastic polyurethane porous materials: R2, MAE, RMSE, and MAPE. The R2 value is used to evaluate how accurately a regression model predicts regression instances that have not yet been observed. The range of R2 is 0–1, and when it gets closer to 1, the model can be considered to have higher accuracy. MAE represents the average of the absolute errors between the true and predicted values, and RMSE is a measure of the dispersion of the predicted and true values in the data set, with the largest impact being outliers in the data set.20 It is particularly sensitive to outliers in the data and is therefore used as a common indicator of the accuracy of regression models. MAPE, expressed as a percentage, reflects the relative deviation between predicted and actual values. The accuracy of the model predictions can be quantitatively assessed by introducing these metrics, and the mathematical formulas for the above metrics are expressed in the corresponding equations.10
 | (1) |
 | (2) |
 | (3) |
 | (4) |
2.8. SHapley Additive exPlanations
SHapley Additive exPlanations utilizes the classic Shapley value from game theory proposed by economist Lloyd Shapley and its related extensions to link optimal credit allocation with local explanations to explain the output of any machine learning model.26 For example, Bi et al.21 utilized the SHAP (SHapley Additional exPlanation) model interpretation method based on Shapley values. They quantified the contribution of each feature to the model output by calculating the SHAP value for each training sample. The sum of SHAP values of different features in all samples were ranked to determine the important features for m7G locus identification.21 The interpretability of SHAP is achieved by plotting the SHAP values for each sample, with each data point in the plot corresponding to a sample and colored according to the value of the corresponding feature. Red represents features with increasing predictive values (positive correlation), blue represents features with decreasing predictive values, and the width of the colored region indicates the magnitude of the feature's impact on the model output. For a detailed description of the SHAP method, see the SHAP GitHub page.222.9. Machine learning experimental procedure details
Initially, a Pearson correlation analysis was performed on the experimentally obtained dataset to determine the correlation between features. This information was then used for further analysis and modeling. In this study, the dataset is divided into two parts, where 80% of the data is used as the training set and the remaining 20% as the test set. The test set is only used to verify the accuracy of the model predictions after optimizing the parameters of the training set. XGBoost (XGB), Decision Tree Regression (DT), K-Neighbors Regression (KNN), Bagging Regression (BGR), Extra Trees Regression (ETR), and Ensemble Hybrid (EH) modeling algorithms were constructed based on this dataset to build adsorption prediction models. In addition, the SHAP value method was utilized to explain the effect of key features on the adsorption properties of the materials. The purpose of the above experiments is to demonstrate the feasibility and effectiveness of machine learning for adsorption data mining of TPU porous materials.The statistical analysis and data mining tasks were conducted using the Python software and the Scikit-Learn tools.
3 Results and discussion
3.1. Pearson correlation coefficient
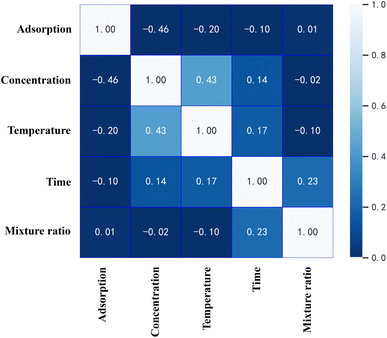
Pearson's correlation coefficient, invented by Karl Pearson in the late 19th century, is a measure of linear correlation between two arbitrary random variables and has a wide range of applications.23 The coefficient is within the range of −1 and 1, where 1 represents a perfect positive correlation between two characteristics; −1 denotes a perfect negative correlation between two characteristics and 0 means no linearism between variables. In addition, the Pearson correlation coefficient can be used to measure the strength of the relationship between two variables, with the magnitude of the coefficient indicating the strength of the linear correlation between the variables.10 If the value is close to 0, the strength of direct correlation is small. However, if the value is closer to 1, the strength of the direct correlation is large.In this study, Pearson correlation matrix was utilized to understand the correlation of each feature with other features. Pearson correlation analysis was performed on these features, and the results are shown in Fig. 3. A positive value indicates a positive correlation, while a negative value indicates a negative correlation. This shows that there is a significant negative correlation between concentration and adsorption compared to other characteristic values. Although the Pearson correlation matrix shows full information about the correlation between each attribute and the other attributes, the effect of concentration on the amount of adsorption compared to the other attributes will be the main topic of discussion. One of the main techniques in machine learning is to select input features based on the Pearson coefficient. Since there is no obvious linear relationship between the input features, and the correlation coefficient does not exceed 0.8, all input features are required and the data must be standardized to prevent inaccurate model calculations.
3.2. Comparison of different models
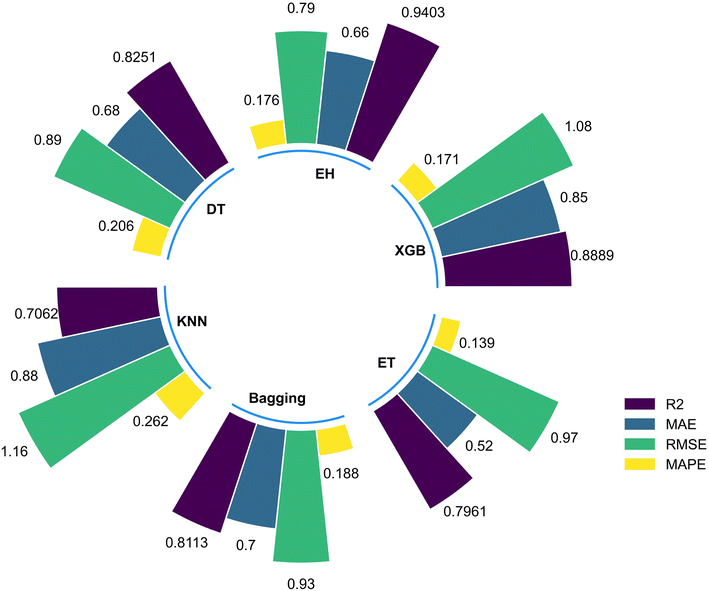
After adjusting the relevant parameters in all models, each model was evaluated and assessed based on the performance indicators mentioned earlier. Table 2 shows the performance indicators obtained by all six models in the testing phase. From the table, it can be seen that most models exhibit good prediction performance, with an R2 greater than 0.8 achieving satisfactory performance indicators. However, the best performance indicator is found in the Ensemble Hybrid (EH) model, which suggests that the Ensemble Hybrid (EH) model is more successful in the prediction phase than other models. Following the Ensemble Hybrid (EH) model, the XGBoost (XGB), Bagging Regression (BGR), and Extra Trees Regression (ETR) models also show good prediction performance, but the significant difference in performance compared to the Ensemble Hybrid (EH) model can be clearly demonstrated in Fig. 4.| Models | Accuracy of models | |||
|---|---|---|---|---|
| R2 | MAE | RMSE | MAPE | |
| XGBoost | 0.8889 | 0.85 | 1.08 | 0.171 |
| Ensemble hybrid | 0.9403 | 0.66 | 0.79 | 0.176 |
| Decision tree | 0.8251 | 0.68 | 0.89 | 0.206 |
| K-neighbors | 0.7062 | 0.88 | 1.16 | 0.262 |
| Bagging | 0.8113 | 0.70 | 0.93 | 0.188 |
| Extra tree | 0.7961 | 0.52 | 0.97 | 0.139 |
These results indicate that single machine learning models may suffer from overfitting or underfitting issues, and are sensitive to noise and outliers, while ensemble hybrid models can better handle these issues. Ensemble hybrid models can combine the strengths of multiple models, improve model accuracy and stability, and usually have stronger predictive capabilities. Therefore, when dealing with more complex datasets, using ensemble hybrid models may be more suitable than single machine learning models.
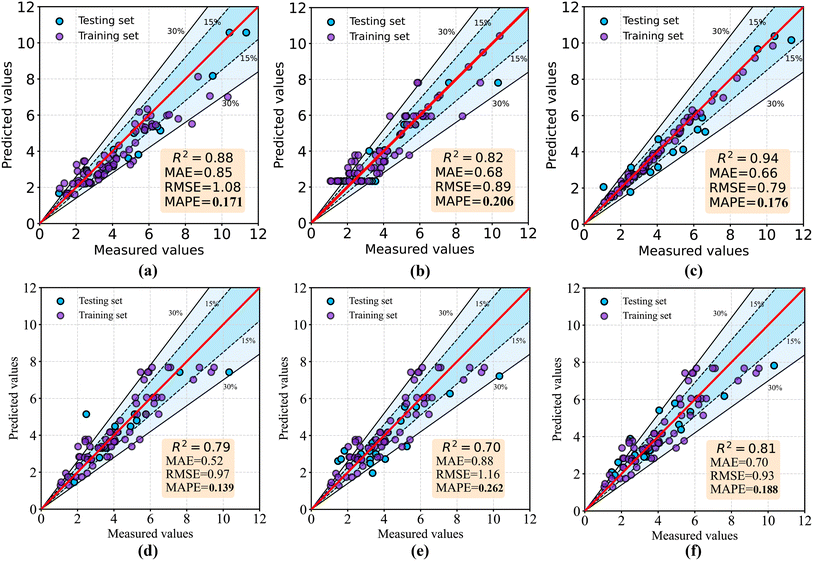
Fig. 5 shows the regression plots for all models during prediction and training phases. The x-axis in each plot represents the observed values in the training samples, and the y-axis represents the predicted values by the models. The red line in each plot represents perfect prediction, where the observed values and predicted values are identical. The other radial lines represent prediction errors within 15% and 30% of the red line. If all data points are on the red line with y = x equation, it means that the model can predict the actual values without any error. It can be observed from the plot that the ensemble hybrid model not only has the highest R2 value but also has the most similar equation to y = x, indicating an excellent predictive performance. In addition, the integrated model can better utilize the advantages of different models and reduce the overall prediction error therefore the MAE and RMSE indicators of this model also perform better with 0.66 and 0.79 respectively. Other models also show good predictive performance but are inferior to the ensemble hybrid model.
In addition, the Fig. 5 shows the performance of the model on both the training and test sets. As there is no significant difference between the model's performance on the two different datasets, it indicates that the model established in this study did not exhibit obvious overfitting. To mitigate the overfitting risk of the ensemble hybrid model due to its complex structure, we introduced dropout and regularization during the development of the model. Dropout can randomly ignore a portion of neurons during the training process, which prevents the model from relying too much on specific neurons and thus improves generalization ability. Regularization method can add regularization terms to the loss function, which makes the model more inclined to choose smaller weight values, thereby reducing model complexity and lowering the risk of overfitting. The results show that these measures can effectively avoid overfitting of complex models on small sample datasets.
Furthermore, this study also explores the contribution of preparation conditions to the model using SHAP value analysis to identify important features, which provides new ideas for exploring how to improve the performance of TPU porous materials.
3.3. SHAP value interpretation
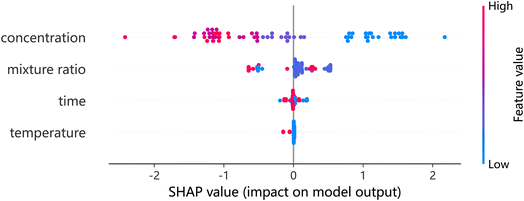
The SHAP (SHapley Additive exPlanations) feature importance map is a visualization tool that shows how much each feature affects the model output. The figure shows the SHAP value of each feature and the value range of the feature in the data set, as well as the positive and negative conditions of the SHAP value. In general, the higher the SHAP value, the greater the impact of the feature on the model output.24In this plot, each data point represents a sample, and each feature has a bar graph representing the distribution of its SHAP values. The color of the bar graph represents the value of the feature in the sample, the darker the color, the higher the value, and the lighter the color, the lower the value. The position of the bar graph indicates the degree of influence of the feature on the model output. The left shift of the bar graph means that the feature has a greater negative impact on the model output, and the right shift of the bar graph means that the feature has a positive effect on the model output. This graph can help researchers quickly identify which features are most important for model output, so as to perform feature selection or optimize model performance.22
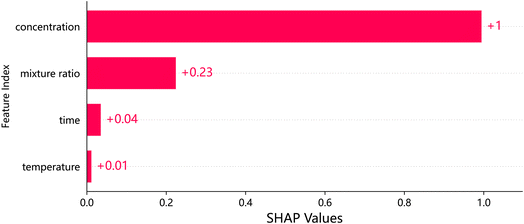
The features in the SHAP feature importance map are listed in descending order of importance as follows: concentration, mixing ratio, time and temperature are shown in Fig. 6, which helps to understand which features has the greatest impact on the prediction results of the model, in order to perform feature selection or adjust model parameters, optimize model performance, or further explore the relationship between these features and target variables.
The feature importance plot provides a visual representation of the importance of each feature in predicting the target variable. However, to evaluate the features comprehensively, both the feature importance and its impact on the prediction should be considered simultaneously. The SHAP summary plot integrates these two aspects to provide a more comprehensive view. The y-axis of the plot describes the features, while the x-axis represents the corresponding SHAP values. The points in the plot are color-coded based on their feature values, with low values indicated in blue and high values indicated in red. The points located on the right side of the zero line indicate a positive effect on the adsorption capacity, while those on the left side indicate a negative effect. Our results show that the concentration of the initials and the mixture ratio have a significant effect on the adsorption capacity, while the effects of the two preparation conditions, time and phase separation temperature, are relatively weak.
Furthermore, the initial concentration has a negative impact on the adsorption capacity, with a larger initial concentration resulting in a greater negative effect, while a lower concentration has a positive effect. However, the adsorption capacity of such materials is often influenced by multiple factors simultaneously.
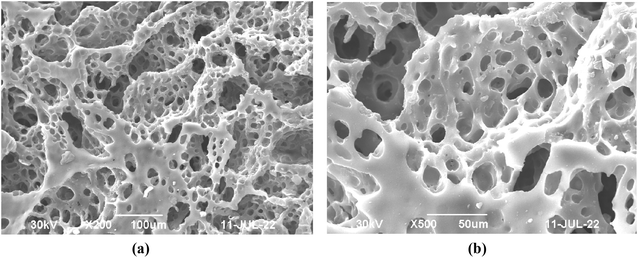
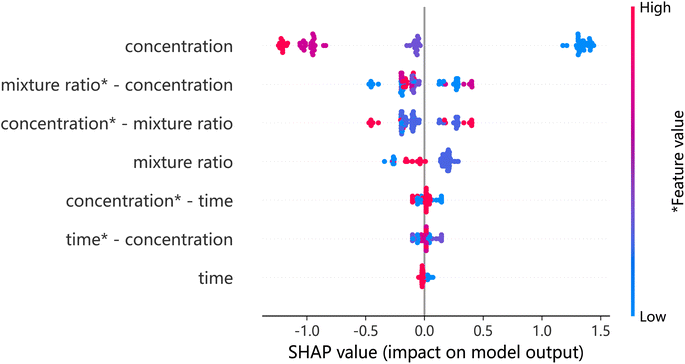
Fig. 7 explains the effect of a single characteristic variable on the adsorption capacity, but not the effect of multivariate combinations on the adsorption capacity. Interaction plots can reflect the importance of individual features and feature combinations, and rank them to determine the importance of feature combinations. Therefore, we use the SHAP interaction diagram for further investigation. The concentration-mixing-ratio feature combination in Fig. 9 is the most important feature combination. TPU porous materials have a hierarchical porous structure as described in the literature25 and shown in Fig. 8. In addition, according to the literature, concentration has a significant effect on the microporous skeleton structure of the material.25 The mixing ratio plays a crucial role in determining the number of micropores in the microporous skeleton.
Although a low concentration would increase the porosity of the material, the adsorption capacity would also decrease when the mixing ratio (1,4-dioxane: deionized water) was too small, because too small a mixing ratio would lead to an increase in the number of surfaces micropores. When the number of micropores is too large, the skeleton of the material will collapse and the adsorption capacity will decrease. As shown in Fig. 9, higher or lower concentrations and mixing ratios can negatively affect the adsorption capacity. In summary, the adsorption performance of TPU porous materials is affected by the synergistic effect of various factors, and the order of importance is shown in Fig. 9. SHAP value interpretation illustrates the complex functional relationship between variable combinations in a more intuitive way, laying the foundation for further development of such materials.
4 Conclusion
In this study, we successfully prepared TPU porous materials using a simple thermally induced phase separation method and established a machine learning prediction model for adsorption capacity. Based on the single predictive model, we further developed a hybrid ensemble model that combines LSTM and ensemble models. The deeper optimization using LSTM model showed better prediction accuracy (R2 = 0.94) than the single model. Additionally, we used SHAP values to explain the influence of individual and combined features on the adsorption performance of materials. The results revealed that TPU concentration and mixing ratio significantly affected the adsorption performance. This study addresses previous research difficulties and lays the foundation for further research in this field. Furthermore, it provides new solutions to data acquisition difficulties, data quality issues, feature selection and extraction difficulties, model selection, and optimization challenges encountered in machine learning in the polymer domain.Data availability
The data supporting the findings of this study are available from the corresponding author upon reasonable request.Author contributions
Kangyong Ma was responsible for the conception and design of this study. He conducted the data analysis and interpretation. He wrote the original draft of the manuscript and created the visualizations.Conflicts of interest
The authors have no conflicts of interest to declare.Acknowledgements
I am grateful to the experts for their valuable comments, which have improved the quality of the paper. I sincerely thank the editors for their efforts in making this paper possible. In addition, I would like to thank Lishui University for providing the experimental equipment. Thanks to Jianwei He for his guidance in drawing the TPU porous material model pictures! Thank you for the open-source project Saravia, E. (2021). ML Visuals. https://github.com/dair-ai/ml-visuals. Thanks to Deepl for enhancing the coherence and readability of the passages in this article.References
- S. Mukherjee, D. Sensharma and O. T. Qazvini, et al., Advances in adsorptive separation of benzene and cyclohexane by metal-organic framework adsorbents, Coord. Chem. Rev., 2021, 437, 213852 CrossRef CAS.
- S. Mukherjee, S. Dutta and Y. D. More, et al., Post-synthetically modified metal-organic frameworks for sensing and capture of water pollutants, Dalton Trans., 2021, 5(48), 11785–17832 Search PubMed.
- A. Carpenter, Oil pollution in the North Sea: the impact of governance measures on oil pollution over several decades, Hydrobiologia, 2019, 845(1), 109–127 CrossRef CAS.
- J. Li, P. Xu, J. Guo, Y. Luo, L. Shao, G. Xing and C. Qi, Recyclable porous polyurethane sponge for highly efficient oil–water separation, J. Appl. Polym. Sci., 2023, 141(3) DOI:10.1002/app.54823.
- S. B. Joye, Deepwater Horizon, 5 years on, Science, 2015, 349(6248), 592–593 CrossRef CAS PubMed.
- H. Zhang, F. Zhang and Y. Wu, Robust stretchable thermoplastic polyurethanes with long soft segments and steric semisymmetric hard segments, Ind. Eng. Chem. Res., 2020, 59(10), 4483–4492 CrossRef CAS.
- X. Qin, B. Wang, X. Zhang, Y. Shi, S. Ye and Y. Feng, et al., Superelastic and Durable Hierarchical Porous Thermoplastic Polyurethane Monolith with Excellent Hydrophobicity for Highly Efficient Oil/Water Separation, Ind. Eng. Chem. Res., 2019, 58(44), 20291–20299 CrossRef CAS.
- S. Ye, B. Wang, Z. Pu, T. Liu, Y. Feng and W. Han, et al., Flexible and robust porous thermoplastic polyurethane/reduced graphene oxide monolith with special wettability for continuous oil/water separation in harsh environment, Sep. Purif. Technol., 2021, 266, 118553 CrossRef CAS.
- Q. Wang, F. Yu, J. Zhu, N. Li, Y. Zhang and X. Peng, et al., Treating Waste with Waste: Facile Preparation of Elastic Thermoplastic Polyurethane Monolith for Efficient Oil/Water Separation, Bull. Chem. Soc. Jpn., 2022, 95(11), 1515–1517 CrossRef CAS.
- L. Yan, Y. Diao, Z. Lang and K. Gao, Corrosion rate prediction and influencing factors evaluation of low-alloy steels in marine atmosphere using machine learning approach, Sci. Technol. Adv. Mater., 2020, 21(1), 359–370 CrossRef CAS PubMed.
- S. Pruksawan, G. Lambard, S. Samitsu, K. Sodeyama and M. Naito, Prediction and optimization of epoxy adhesive strength from a small dataset through active learning, Sci. Technol. Adv. Mater., 2019, 20(1), 1010–1021 CrossRef CAS PubMed.
- M. Gholami, V. Haddadi-Asl and I. S. Jouibari, A review on microphase separation measurement techniques for polyurethanes, J. Plast. Film Sheeting, 2022, 38(4), 502–541 CrossRef CAS.
- X. Wang, Y. Pan, C. Shen, C. Liu and X. Liu, Facile Thermally Impacted Water-Induced Phase Separation Approach for the Fabrication of Skin-Free Thermoplastic Polyurethane Foam and Its Recyclable Counterpart for Oil–Water Separation, Macromol. Rapid Commun., 2018, 39(23), e1800635 CrossRef PubMed.
- T. Zhang, L. Kong and Y. Dai, et al., Enhanced oils and organic solvents absorption by polyurethane foams composites modified with MnO2 nanowires, Chem. Eng. J., 2017, 309, 7–14 CrossRef CAS.
- H. Meng, T. Yan, J. Yu and F. Jiao, Super- hydrophobic and super-lipophilic functionalized graphene ox- ide/polyurethane sponge applied for oil/water separation, Chin. J. Chem. Eng., 2018, 26(5), 957–963 CrossRef CAS.
- Y. Liu, C. N. Niu, Z. W. Wang, G. Sun and T. S. Zhu, Machine learning in materials genome initiative: a review, J. Mater. Sci. Technol., 2020, 57, 113–122 CrossRef.
- Z. Huo, L. W. Wang and Y. H. Huang, Predicting carbonation depth of concrete using a hybrid ensemble model, J. Build. Eng., 2023, 76, 107320 CrossRef.
- K. Greff, R. K. Srivastava and J. Koutnik, et al., Lstm: a search space odyssey, IEEE Transact. Neural Networks Learn. Syst., 2017, 28(10), 2222–2232 Search PubMed.
- D. G. Da Silva and A. A. D. M. Meneses, Comparing long short-term memory (lstm) and bidirectional lstm deep neural networks for power consumption prediction, Energy Rep., 2023, 10, 3315–3334 CrossRef.
- M. Al-Fahdi, T. Ouyang and M. Hu, High-throughput computation of novel ternary b-c-n structures and carbon allotropes with electronic-level insights into superhard materials from machine learning, J. Mater. Chem. A, 2021, 9(48), 27596–27614 RSC.
- Y. Bi, D. Xiang, Z. Ge, F. Li, C. Jia and J. Song, An Interpretable Prediction Model for Identifying N7-Methylguanosine Sites Based on XGBoost and SHAP, Mol. Ther.--Nucleic Acids, 2020, 22, 362–372 CrossRef CAS PubMed.
- SHAP, cited 2020 Mar 18, available from: https://github.com/slundberg/shap.
- J. Deng, Y. Deng and K. H. Cheong, Combining conflicting evidence based on pearson correlation coefficient and weighted graph, Int. J. Intell. Syst., 2021, 36(12), 7443–7460 CrossRef.
- J. Zhang, W. Niu, Y. Yang, D. Hou and B. Dong, Machine learning prediction models for compressive strength of calcined sludge-cement composites, Constr. Build. Mater., 2022, 346, 128442 CrossRef CAS.
- F. Wu, K. Pickett, A. Panchal, M. Liu and Y. Lvov, Superhydrophobic Polyurethane Foam Coated with Polysiloxane-Modified Clay Nanotubes for Efficient and Recyclable Oil Absorption, ACS Appl. Mater. Interfaces, 2019, 11(28), 25445–25456 CrossRef CAS PubMed.
- S. Lundberg and S. Lee, A unified approach to interpreting model predictions, arXiv, 2017, arXiv:1705.07874, DOI:10.48550/arXiv.1705.07874.
Footnote |
| † Electronic supplementary information (ESI) available. See DOI: https://doi.org/10.1039/d4ra00010b |
| This journal is © The Royal Society of Chemistry 2024 |

