 Open Access Article
Structure–activity relationship study of anti-wear additives in rapeseed oil based on machine learning and logistic regression
Jianfang Liu *a,
Chenglingzi Yia,
Yaoyun Zhanga,
Sicheng Yanga,
Ting Liua,
Rongrong Zhanga,
Dan Jiab,
Shuai Penga and
Qing Yanga
aSchool of Life Science and Technology, Wuhan Polytechnic University, Wuhan, 430023, China. E-mail: jianfang66@126.com
bState Key Laboratory of Special Surface Protection Materials and Application Technology, Wuhan Research Institute of Materials Protection, Wuhan, 430030, China
First published on 13th March 2024
Abstract
Anti-wear performance is a crucial quality of lubricants, and it is important to conduct research into the structure–activity relationship of anti-wear additives in bio-based lubricants. These lubricants are eco-friendly and energy-efficient. A literature review resulted in the construction of a dataset comprising 779 anti-wear properties of 79 anti-wear additives in rapeseed oil, at various loadings and additive levels. The anti-wear additives were classified into six groups, including phosphoric acid, formate esters, borate esters, thiazoles, triazine derivatives, and thiophene. Logistic regression analysis revealed that the quantity and kind of anti-wear agents had significant effects on the anti-wear properties of rapeseed oil, with phosphoric acid being the most effective and thiophene being the least effective. To identify the specific structural data that affect the anti-wear capabilities of additives in bio-based lubricants of rapeseed oil, a random forest classification model was developed. The results showed a 0.964 accuracy (ACC) and a 0.931 Matthews Correlation Coefficient (MCC) on the test set. The ranking of importance and characterization of MACCS descriptors in the model confirms that anti-wear additives with chemical structures containing P, O, N, S and heterocyclic groups, along with more than two methyl groups, improve the anti-wear performance of rapeseed oil. The application of data analysis and machine learning to investigate the classifications and structural characteristics of anti-wear additives in rapeseed oil provides data references and guiding principles for designing anti-wear additives in bio-based lubricants.
Introduction
Lubricants are some of the largest oil consumers,1 being about 90% base oils and 10% additives. Mineral oil forms the bulk of these base oils. In order to mitigate the negative environmental impact of lubricants,2 bio-based lubricants are becoming increasingly popular as a sustainable alternative. Bio-based lubricants are derived from animal or vegetable oils and have favourable qualities such as being environmentally friendly and biodegradable.3 Plant-based lubricants have a wide range of applications, and they are widely used to lubricate various types of machinery and equipment, such as automobiles, aircraft, ships, and industrial equipment. In the food processing industry, food oil or butter can also be used directly for equipment lubrication, replacing traditional food machinery lubricants. In particular, rapeseed oil has been extensively studied as a potential lubricant due to its high viscosity, excellent lubrication properties, cost-effectiveness and environmental protection. Okechukwu4 conducted friction tests with rapeseed oil and paraffin oil as lubricants. It was observed that the friction decreased more in rapeseed oil compared to paraffin oil at an elevated sliding speed. Ermakov,5 utilizing a four-ball friction machine, discovered that an environmentally friendly lubricant derived from rapeseed oil, when compared to mineral-base lubricants commonly used in railway transport, resulted in reduced wear on interacting solid surfaces and lower temperatures.Commonly used lubricant additives include dispersants, detergents, anti-foam agents, viscosity index improvers, antioxidants, and anti-wear agents.6,7 The purpose of anti-wear agents is to reduce wear on metallic surfaces, thereby prolonging the life of the engine. Initially, anti-wear agents were mainly composed of inorganic compounds, such as lead chloride and molybdenum disulfide. However, with advancements in science and technology,8 research into organic compound anti-wear agents has become more sophisticated. Examples of such agents include phosphate esters, sulfides, nitrates, and borides. As we all know, the anti-wear effects of different types of anti-wear agents in various lubricating base oils, as well as their synergistic effects with other additives, vary. Scientists have been working on identifying anti-wear additives suitable for bio-based lubricants from the extensive variety available.
In the past, experimental methods have been widely used to identify effective anti-wear agents. By conducting laboratory experiments, the performance of a lubricant in friction, wear, viscosity, and oxidative stability can be assessed. Subsequently,9 various physicochemical methods are employed to characterize the lubricant, such as, infrared spectroscopy, nuclear magnetic resonance, and mass spectrometry, to analyse its chemical composition, molecular structure, and molecular weight distribution. This experimental data is crucial for understanding the behaviour and performance of the lubricant under different conditions.10 The simulation calculation and software can assess the wear resistance of lubricants in a virtual environment. This method can significantly cut down on trial-and-error costs and lessen reliance on physical prototypes and trials, ultimately saving time and resources. However, it remains difficult to identify suitable and efficient lubricating oil additives using computational simulation due to the vast array of additive types available.
In recent years, there has been a focus on designing lubricants with superior anti-wear properties in current tribological research. Many scientists have concentrated on developing effective quantitative structural friction capacity relationship (QSTR) to predict an oil's anti-wear properties and design new lubricants.11 Various mathematical and statistical methods, such as multiple linear regression (MLR), partial least squares (PLS) and random forests (RF), can be used for quantitative structural friction relationship studies. MLR can only solve linear models, and nonlinear models are generally constructed using machine learning methods. Gao et al.12 developed the quantitative structural friction capacity relationship to determine whether there is a relationship between lubricant performance and lubricant molecular structure. A decision tree is a hierarchical feature-based decision model that classifies or regresses samples through a series of decision rules. In a random forest, each decision tree is constructed independently, and their decision rules can be chosen flexibly based on the data distribution and the relationship between the features. Therefore, a random forest can capture nonlinear patterns and relationships. Vladimir Svetnik13 used Random Forest to construct predictive models for six chemistry informatics datasets, and the analysis demonstrated that Random Forest is a powerful tool capable of delivering performance that is one of the most accurate methods to date. Three additional features of Random Forest are also presented: a built-in performance evaluation, a measure of the relative importance of the descriptors, and a measure of compound similarity weighted by the relative importance of the descriptors, making Random Forest particularly suitable for chemo informatics modelling.
Bio-based lubricants have a wide range of potential applications, particularly in industries with strict environmental requirements. The performance and reliability of bio-based lubricants can be enhanced, and their use in various fields can be expanded through thorough investigation of the structural relationships of anti-wear agents. While previous studies have utilized machine learning, such as random forests, to model additive QSPR, there has been a lack of research on anti-wear agent QSPR using a combination of binary logistic regression and machine learning. Additionally, existing studies have been limited to a single group. This study utilized binary logistic regression to assess different experimental loads, as well as the contents and types of additives, as influencing factors in order to determine the degree of influence of each group on anti-wear performance. Furthermore, to the study analysed the degree of influence of each factor on anti-wear performance. The six categories of anti-wear agents were then qualitatively classified using random forests, and specific sub-structural fragments with significant influence on anti-wear performance were identified by evaluating the relative importance of the MACCS descriptors and fingerprint characterization. The information can serve as a reference to aid in the design of bio-based lubricant formulations.
Materials and methods
Database construction
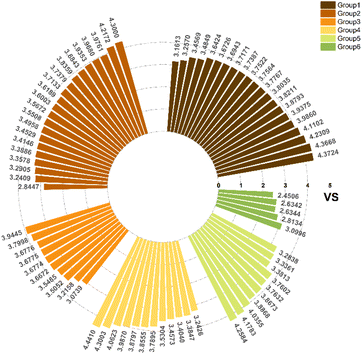
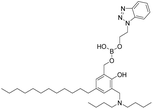
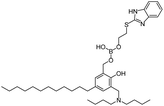
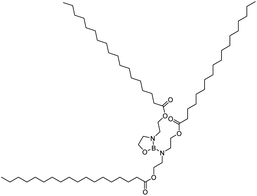
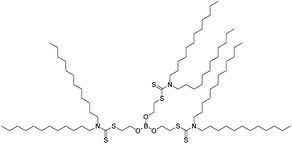
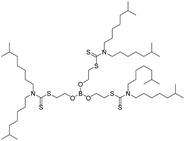
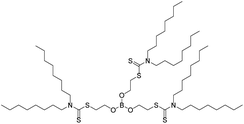
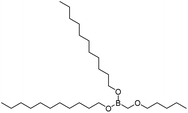
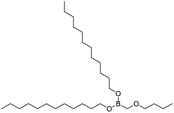
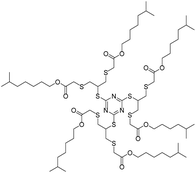
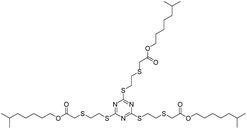
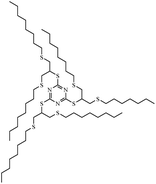
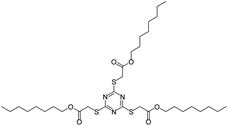
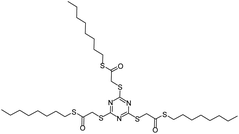
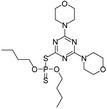
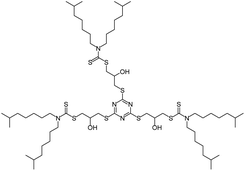
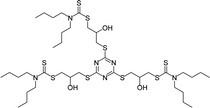
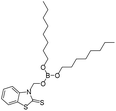
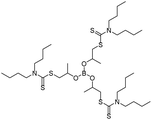
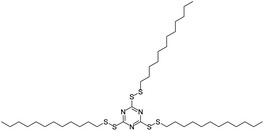
As the primary oil for biobased oil, rapeseed oil offers high sustainability, good lubrication performance, excellent low temperature performance, oxidation resistance, and cost-effectiveness. It is not only widely used with a large amount of reliable data. So, the anti-wear agent in rapeseed oil was chosen as the focus of the research, and14–45 data on additives were obtained from the literature. A total of 79 additives were classified into six categories: borate esters (Group 1), triazine derivatives (Group 2), thiazoles (Group 3), formate esters (Group 4), phosphoric acid (Group 5), and thiophenes (Group 6). During the dataset building process, it was discovered that the original data had redundant conditions of mill spot diameter, which were unsuitable for modelling, and lacked valuable information, such as optimal concentration of additives and molecular weight. To facilitate subsequent modelling, the information on the wear scar diameter of canola oil containing anti-wear agents at a load of 392 N was screened, and the wear scar diameter (WSD) was converted according to eqn (1). The structure, type, and wear scar diameter information of the anti-wear agents are listed in Fig. 1 and Table 5.
 | (1) |
Binary logistic regression
Binary logistic regression is a widely used and effective classification algorithm in data mining and machine learning.47 Its formula is:
 | (2) |
 follows a binary logistic distribution, representing the probability of occurrence. 1 − P represents the probability of non-occurrence. Xm is the influencing factor, Y is dichotomous data, and Y will only have the numbers 1 and 0, with 1 standing for YES, and 0 standing for NO. The purpose of the model is to predict values that are as close as possible to 1 when the original data is 1, and as close to 0 when the original data is 0.
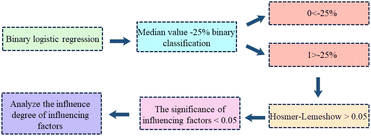
Binary logistic regression is used to study the effect of X on Y, whose specific flow chart is shown in Fig. 2. Firstly, data processing was carried out to collect the diameters of wear spots of 79 anti-wear agents in the dataset at different loads and at different contents, a total of 779 groups, the middle value −25% will be binary classification. Secondly, a binary logistic regression analysis model was constructed using Jamovi software.48 The model's fitting situation and effect will be judged using the Hosmer–Lemeshow goodness-of-fit test. If the P-value is greater than 0.05 when the Hosmer–Lemeshow test is performed, it means that the factual data situation is consistent with the model's fitting results, i.e., the model is well-fitted. Finally, the influence relationship is analysed. If a variable presents significance (significance value less than 0.05), it means that the variable has an influence relationship on Y. Binary logistic regression analysis also involves a term – logarithmic ratio (Exp(B) value). It is a multiplicative concept indicator whose value is equal to the exponential power of the regression coefficient, and the degree of influence between various influences can be obtained from it.
Machine learning algorithms
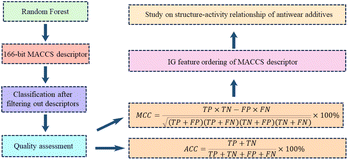
Random Forest (RF) is a machine learning algorithm that randomly draws training samples and put them back,49 creating a model that is simple in principle, highly accurate, and widely used. It can be applied to classification, regression, and unsupervised learning clustering. The parameter optimization for RF algorithm in this study includes n_estimators, max_depth, min_samples_leaf, max_features of the decision tree. The hyperparameters are tuned using grid optimization with 5 and 10 weights of cross-checking, and the prediction accuracy of the test set is also scored.In this study,50 scikit-learn in Python was utilized for evaluation and model construction based on the randomized division of the dataset using 166 bit MACCS fingerprint descriptors. The process is shown in Fig. 3.51 The MACCS fingerprint descriptors are based on specific compound properties to determine the presence of contain fragments within the compounds. The number of input descriptor features is limited to construct the predictive model for the final prediction. Therefore, it is necessary to filter the descriptors based on the compound sample data in the training set before building the classification model. Since the fingerprint descriptors consist of discrete values with 0 and 1 distributions, we then filter out the fingerprint descriptors that occur less frequently in the compound samples based on variance. The variance of each descriptor is calculated based on the data in the training set, and fingerprints with variance less than the mean variance of all fingerprints in the training set are eliminated.
The random forest model's quality was assessed by accuracy (ACC), Matthews Correlation Coefficient (MCC), sensitivity (SE), specificity (SP), fivefold cross-validation accuracy (5-CV), tenfold cross-validation accuracy (10-CV) and Leave-One-Out (LOO). The formulas and significance of these metrics are provided below:
 | (3) |
 | (4) |
 | (5) |
 | (6) |
The term “TP” represents true positives, indicating the count of samples with high resistance to abrasion. Conversely, “TN” denotes true negatives, representing the count of samples with low resistance to abrasion. On the other hand, “FP” refers to false positives, signifying the count of predicted high resistance cases that are actually low in resistance. Lastly, “FN” stands for false negatives and represents the count of predicted low resistance cases that are actually high in resistance.
MCC is a metric used to evaluate the accuracy of binary classification models, with values ranging from −1 to 1. Higher MCC scores indicate better model performance. SE and SP refer to the sensitivity and specificity of the computer model in identifying high and low anti-wear compounds, respectively. k-CV involves dividing the dataset into K subsets for training and validation purposes, while LOO is a variant where only one data point is left out for validation at a time.52 The scikit-learn GridSearchCV function can be utilized to implement this methodology.
Results and discussion
Descriptive statistics and data reliability analysis
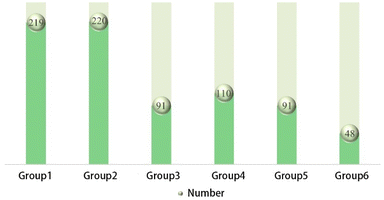
The data samples for the six types of anti-wear agents are illustrated in Fig. 4. There is no bias in the overall data. Logistic regression was performed to analyse the factors influencing the independent variables on the dependent variables. It is well known that the load, content, rotational speed, time, temperature, and anti-wear agent all impact the magnitude of WSD. Different loads (196 N, 264 N, and 392 N), different contents (0.5–5%), and the six types were entered as independent variables, while the rotational speed was fixed at 1450 (rpm), and the time was 30 min all at room temperature conditions.The impact of additives on wear in different base oils varies. To eliminate base oils' influence on the experimental results and maintain the study's scientific validity, all WSD data were processed in the following way. The formula is as follows:
 | (7) |
RWSD represents the rate of change of anti-wear agent WSD, excluding the impact of base oil. S0 denotes the wear scar diameter of steel balls without any additive, while S denotes the wear scar diameter of steel balls with the additive.
The middle value of −25% is used to divide them into two categories. A total of 353 data points fall under the category of 0, which represents better anti-wear performance, while 426 data points fall under the category of 1, which represents poorer anti-wear performance. Fig. 5 displays the obtained data. The normal distribution's symmetry, continuity, and consistency make it an ideal model for describing many random variables. The data in Fig. 5 are mostly normally distributed, indicating that the experimental data is scientifically reliable and consistent with the facts.
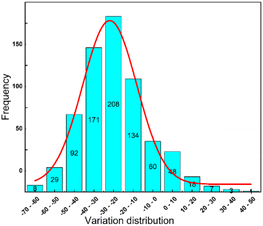 | ||
| Fig. 5 Distribution of rate of change of vegetable oils as base oil anti-wear agents excluding the effect of base oil. | ||
Logistic regression analysis
The results of the analysis are shown in Table 1. The Hosmer–Lemeshow (HL) fit value is 0.3070, which is greater than 0.05. This indicates that the model fits well with the real data, and the analysed results can accurately reflect a real relationship between the original variables. In the figure, B represents the regression coefficient and intercept, Wald is the chi-square value of B divided by its standard error, and Exp(B) is the ratio definition, with the most important parameter being Exp(B). The logistic regression model captures the effects of the base reference level, with the coefficients of the other variables indicating changes relative to this base level. As a result, the base reference level is typically not explicitly shown in the table. Group 6 serves as the base reference level, and the remaining 5 groups are compared to this reference level. As observed in the figure, the significance values of content, load and group are less than 0.05, indicating a significant impact on the anti-wear performance. Among these, species is a categorical variable that can be compared in parallel, and the significance value of each group is also less than 0.05. When comparing their Exp(B) values, a higher value indicates a stronger influence. Phosphoric acid exhibited the highest influence, followed by formate esters, thiazole, borate esters, triazine derivatives, and finally thiophene.| B | Standard error | Wald | P | Exp(B) | HL fit | |
|---|---|---|---|---|---|---|
| Content | 34.3550 | 7.5350 | 20.7890 | <0.01 | 8.3240 × 10¹⁴ | 0.3070 |
| Load | 0.1200 | 0.0100 | 101.6430 | <0.01 | 0.9880 | |
| Group | <0.01 | |||||
| Group 1 | 4.0740 | 0.6760 | 36.3120 | <0.01 | 58.7960 | |
| Group 2 | 3.2960 | 0.6720 | 24.0680 | <0.01 | 27.0050 | |
| Group 3 | 3.8020 | 0.7020 | 29.3330 | <0.01 | 44.7740 | |
| Group 4 | 4.4250 | 0.6990 | 40.0520 | <0.01 | 83.4880 | |
| Group 5 | 4.8460 | 0.7210 | 45.2030 | <0.01 | 127.2650 |
Random forest classification analysis
The model is based on the random division method with optimal parameters. The split criterion is entropy, the maximum depth is 8; the leaf nodes contain a minimum of 1 sample, and the number of random forest spanning trees is 100. The effect of the model constructed above is shown in Table 2.
| Training set | ACC | 0.964 |
| 5-CV | 0.662 | |
| 10-CV | 0.660 | |
| LOO | 0.679 | |
| MCC | 0.931 | |
| Test set | ACC | 0.720 |
| SE | 0.948 | |
| SP | 0.976 |
The ACC and MCC of the training set of the model are 0.964 and 0.931 respectively, indicating that the model is extremely powerful in classifying the test data, with a classification rate of over 96%. The ACC of the prediction set is 0.720, suggesting that the model has better generalization ability in the prediction set. The accuracy of the prediction set is smaller than that of the test set, mainly because the model is trained on the training set and learns the patterns and features of the samples in the training set. When applied to the new prediction set data, the classification correctness will be decreased due to the difference between the data features and patterns of the prediction set and the training set. Various validation methods show an accuracy greater than 0.6, indicating the reliability of the model. This model can be used for subsequent comprehensive analysis.
From Table 3, it can be observed that the MACCS_102 fingerprint falls in the group of strong anti-wear ability with a high ratio of 1.9829 and the largest IG of 0.1290. MACCS_102 consists of an oxygen atom connected to a heteroatom, typically forming an oxide or an oxide analogue. The introduction of heteroatoms can alter the crystal structure or surface properties of the material, indirectly impacting its anti-wear properties. This indicates that the MACCS_102 fingerprint descriptor positively influences the enhancement of anti-wear capability. MACCS_141 has a ratio of 1.5954 and an IG value of 0.0755, representing the presence of methyl groups. Generally, the introduction of methyl groups may modify the surface lubricity of the material and reduce friction and wear during friction. MACCS_141 also has a positive effect on anti-wear properties. Similarly, fingerprints such as MACCS_146 and MACCS_48 are also oxygenated structures with ratios of 1.4575 and 1.6239, respectively, placing them in the higher anti-wear group and contributing positively to the improvement of anti-wear capability.
| Number | MACCS fingerprints | MACCS description | IGa | P_RBb (%) | P_NRBc (%) | Δd (%) | Ratee |
|---|---|---|---|---|---|---|---|
| a The value of information gain.b The proportion of compounds with strong wear resistance in which this MACCS descriptor appears.c The proportion of descriptors that appear in the general class of compounds with wear resistance.d The difference between p_RB (%) minus p_NRB (%), the frequency at which sub-structural fragments occur in the two classes of compounds.e The ratio of p_RB (%) to p_NRB (%); A can be any valid chemical element, Q is a hetero-atom (an atom other than carbon and hydrogen), and X is a halogen atom (F, Cl, Br, I); % denotes an aromatic bond, ! denotes the main chain or non-ring key, and $ denotes the ring key. | |||||||
| 1 | MACCS_102 | QO | 0.1290 | 74.36 | 37.50 | 36.86 | 1.9829 |
| 2 | MACCS_165 | Ring | 0.1037 | 58.97 | 82.50 | −23.53 | 0.7148 |
| 3 | MACCS_120 | Heterocycle atom >1 (&…) | 0.1020 | 56.41 | 65.00 | −8.59 | 0.8679 |
| 4 | MACCS_121 | N heterocycle | 0.1020 | 56.41 | 65.00 | −8.59 | 0.8679 |
| 5 | MACCS_105 | A$A($A)$A | 0.1005 | 5.13 | 20.00 | −14.87 | 0.2564 |
| 6 | MACCS_137 | Heterocycle | 0.0983 | 56.41 | 80.00 | −23.59 | 0.7051 |
| 7 | MACCS_163 | 6M ring | 0.0952 | 43.59 | 65.00 | −21.41 | 0.6706 |
| 8 | MACCS_86 | CH2QCH2 | 0.0809 | 74.36 | 57.50 | 16.86 | 1.2932 |
| 9 | MACCS_83 | QAAAA@1 | 0.0783 | 17.95 | 35.00 | −17.05 | 0.5128 |
| 10 | MACCS_141 | CH3 >2 (&…) | 0.0755 | 71.79 | 45.00 | 26.79 | 1.5954 |
| 11 | MACCS_118 | ACH2CH2A >1 | 0.0750 | 100.00 | 85.00 | 15.00 | 1.1765 |
| 12 | MACCS_111 | NACH2A | 0.0703 | 74.36 | 57.50 | 16.86 | 1.2932 |
| 13 | MACCS_48 | OQ(O)O | 0.0661 | 48.72 | 30.00 | 18.72 | 1.6239 |
| 14 | MACCS_112 | AA(A)(A)A | 0.0644 | 23.08 | 30.00 | −6.92 | 0.7692 |
| 15 | MACCS_115 | CH3ACH2A | 0.0607 | 100.00 | 82.50 | 17.50 | 1.2121 |
| 16 | MACCS_129 | ACH2AACH2A | 0.0492 | 92.31 | 75.00 | 17.31 | 1.2308 |
| 17 | MACCS_146 | O >2 | 0.0490 | 69.23 | 47.50 | 21.73 | 1.4575 |
| 18 | MACCS_148 | AQ(A)A | 0.0479 | 87.18 | 82.50 | 4.68 | 1.0567 |
| 19 | MACCS_108 | CH3AAACH2A | 0.0455 | 74.36 | 47.50 | 26.86 | 1.5655 |
| 20 | MACCS_97 | NAAAO | 0.0439 | 15.38 | 40.00 | −24.62 | 0.3846 |
| 21 | MACCS_142 | N >1 | 0.0371 | 58.97 | 45.00 | 13.97 | 1.3105 |
| 22 | MACCS_98 | QAAAAA@1 | 0.0336 | 35.90 | 42.50 | −6.60 | 0.8446 |
| 23 | MACCS_161 | N | 0.0317 | 89.74 | 80.00 | 9.74 | 1.1218 |
| 24 | MACCS_159 | O >1 | 0.0263 | 74.36 | 67.50 | 6.86 | 1.1016 |
| 25 | MACCS_65 | CN | 0.0211 | 35.90 | 45.00 | −9.10 | 0.7977 |
| 26 | MACCS_139 | OH | 0.0210 | 7.69 | 15.00 | −7.31 | 0.5128 |
| 27 | MACCS_158 | C–N | 0.0201 | 74.36 | 72.50 | 1.86 | 1.0256 |
| 28 | MACCS_80 | NAAAN | 0.0181 | 28.21 | 27.50 | 0.71 | 1.0256 |
| 29 | MACCS_47 | SAN | 0.0137 | 74.36 | 70.00 | 4.36 | 1.0623 |
| 30 | MACCS_138 | QCH2A >1 (&…) | 0.0125 | 100.00 | 95.00 | 5.00 | 1.0526 |
MACCS_165, MACCS_137, and MACCS_163 represent cyclic or heterocyclic, and they occur in over 60% of general wear resistance instances. Previous studies have shown that they also enhance anti-wear performance to some extent compared to base oils without additives. This indicates that these fingerprints also positively impact the anti-wear capacity.
In summary, among the top 30 descriptors, MACCS_102, MACCS_141, MACCS_146, MACCS_48, MACCS_165, MACCS_137, MACCS_163, MACCS_47, MACCS_80 have a significant influence on the anti-wear performance of additives.
| Group | MACCS fingerprint keya | High/low wear resistanceb | Example of MACCS fingerprint keyc | Representative skeletond | Representative compounde |
|---|---|---|---|---|---|
| a (1) Indicates the presence of a molecule's structure, while (0) indicates its absence.b The ratio of high and low wear-resistance molecules in the subclass.c The SMARTS of the structure in the listed MACCS example.d The substructure of the MACCS bond in the molecule. The colour red, blue, and yellow represent the matching structures.e The representative molecules in this class, and red, blue, and yellow represent the matching substructures. | |||||
| Group 5 | MACCS_102 (1) | 7/3 |  |
 |
 |
| MACCS102 | |||||
| QO | |||||
| MACCS_141 (1) | CH3 >2 |  |
|||
| MACCS141 | |||||
| MACCS_48 (1) |  |
 |
|||
| MACCS48 | |||||
| OQ(O)O | |||||
| MACCS_146 (1) | O >2 |  |
|||
| MACCS146 | VS = 4.0355 | ||||
| Group 4 | MACCS_102 (1) | 7/5 | N |  |
 |
| MACCS_141 (1) | MACCS161 | ||||
| MACCS_161 (1) |  |
 |
|||
| MACCS_47 (1) | MACCS47 | ||||
| SAN | VS = 3.8555 | ||||
| Group 1 | MACCS_102 (1) | 14/7 |  |
 |
 |
| MACCS102 | |||||
| QO | |||||
| MACCS_141 (1) | CH3 >2 |  |
|||
| MACCS141 | |||||
| MACCS_146 (1) | O >2 |  |
|||
| MACCS146 | VS = 3.7171 | ||||
| Group 3 | MACCS_102 (1) | 2/8 | O >2 |  |
 |
| MACCS_146 (1) | MACCS146 | ||||
| MACCS_161 (1) |  |
 |
|||
| MACCS_47 (1) | MACCS47 | ||||
| SAN | VS = 3.6672 | ||||
| Group 2 | MACCS_102 (0) | 9/13 | CH3 >2 |  |
 |
| MACCS141 | |||||
| MACCS_141 (1) |  |
 |
|||
| MACCS80 | |||||
| MACCS_80 (1) | NAAAN | ||||
 |
 |
||||
| MACCS_65 (1) | MACCS65 | ||||
| C%N | VS = 2.8447 | ||||
| Group 6 | MACCS_102 (0) | 0/5 |  |
 |
 |
| MACCS83 | |||||
| MACCS_141 (0) | QAAAA@1 | ||||
| MACCS_83 (1) |  |
||||
| MACCS_137 (1) | MACCS137 | ||||
| Heterocycle | VS = 2.4506 | ||||
Group 4 and Group 3 contain MACCS_161 and MACCS_47, which correspond to the presence of N and S atoms, while some heteroatom incorporation also leads to an increase in anti-wear properties. Mechanistic studies indicate that S and N active elements play a role in the formation of boundary films, potentially resulting in a composite film on the metal surface.
Group 2 and Group 6 also demonstrated improved anti-wear properties compared to canola oil without additives. They contain MACCS_80, MACCS_83, and MACCS_137, which represent rings or heterocycles formed by atoms other than those containing C and H and N. This finding proves that lubricating oils containing hetero-cyclic rings are also positively affected. The absence of MACCS_102 structure in Group 6 may explain its inferior anti-wear ability. Overall, the presence of O, N, S, heterocyclic rings, and more than two methyl groups can enhance the anti-wear performance of lubricants to some extent. These substructure fragments can offer guidance for the design of compounds.
Conclusion
With the advancement of technology, bio-based lubricants are expected to have wider application prospects and market opportunities in the future. It is important to continuously narrow the gap with petroleum-based products in terms of key performance and cost. To reduce the experimental cost and time, the use of machine learning in lubricant design has become a trend, and its application in bio-based lubricants can also significantly improve the experimental efficiency. This study initially analysed the influence of different loads, contents, and types of additives on the anti-wear performance of 79 additives using logistic regression. The results demonstrated that both content and type have significant effects. The types were classified into six groups based on name and structure, and the ranking of the influence of each structure on anti-wear additives was determined. Phosphoric acid had the highest degree of influence, followed by formate esters, then thiazoles, borate esters, triazine derivatives, and finally thiophenes.The 79 additives in the established dataset were used to construct a random forest classification model and MACCS fingerprint descriptors. The ACC and MCC of the model on the test set were 0.964 and 0.931, respectively. Subsequently, the importance ranking and fingerprint analysis of all fingerprints based on the random forest model yielded the following conclusions: among the top 30 ranked by IG, MACCS_102, MACCS_141 and MACCS_146 accounted for a significant proportion in the first four groups with greater influence. MACCS_80, MACCS_83 and MACCS_137 also played an important role in Group 2 and Group 6; the structures represented by the descriptors proved consistent with traditional mineral oils, showing the presence of hetero-atoms and hetero-cycles such as O, N, and S, as well as more than two methyl groups or more in the anti-wear agents in the bio-based lubricants is beneficial to the anti-wear performance.
This study utilizes a random forest classification model in combination with logistic regression to provide a clear understanding of how each additive impacts anti-wear performance, as well as the influence of structural fragments on anti-wear performance. This approach can significantly decrease the cost of experimental trial and error in bio-based lubricant research and offer guidance for future machine learning lubricant model development. With the increasing number of anti-wear molecules, research on bio-based lubricants is ongoing, and the extensive database will establish a resource with comprehensive coverage, clear structure, and suitable conditions. Furthermore, as traditional machine learning algorithms continue to evolve, future efforts can explore the use newer algorithms to build more stable models applicable to a wider range of applications.
Author contributions
Conceptualization: Jianfang Liu; data curation: Chenglingzi Yi, Sicheng Yang, Ting Liu, Qing Yang and Shuai Peng; formal analysis: Sicheng Yang, Ting Liu, Qing Yang and Shuai Peng; investigation: Chenglingzi Yi, Rongrong Zhang and Dan Jia; methodology: Jianfang Liu; resources: Yaoyun Zhang, Rongrong Zhang and Dan Jia; validation: Yaoyun Zhang, Rongrong Zhang and Dan Jia; visualization: Yaoyun Zhang; writing – original draft: Chenglingzi Yi; writing – review & editing: Jianfang Liu.Conflicts of interest
The authors have no relevant financial or non-financial interests to disclose.Appendix
Acknowledgements
The authors are grateful for the financial supports from the National Natural Science Foundation of China (Grant No. 52075405).References
- M. A. H. Shaah, M. S. Hossain, F. A. S. Allafi, A. Alsaedi, N. Ismail, M. O. Ab Kadir and M. I. Ahmad, RSC Adv., 2021, 11, 25018–25037 RSC.
- S. Shankar, M. Manikandan, D. K. Karupannasamy, C. Jagadeesh, A. Pramanik and A. K. Basak, Biomass Convers. Biorefin., 2021, 13, 3669–3681 CrossRef.
- A. Z. Syahir, N. W. M. Zulkifli, H. H. Masjuki, M. A. Kalam and A. Alabdulkarem, J. Cleaner Prod., 2017, 168, 997–1016 CrossRef CAS.
- N. N. Okechukwu, B. J. Young and J. Kim, Tribol. Lubr., 2020, 36, 11–17 Search PubMed.
- C. F. Ermakov, T. G. Chmykhova, A. V. Timoshenko and E. B. Shershnev, J. Frict. Wear, 2019, 40, 194–199 CrossRef.
- N. A. Zainal, N. W. M. Zulkifli, M. Gulzar and H. H. Masjuki, Renewable Sustainable Energy Rev., 2018, 82, 80–102 CrossRef CAS.
- C. Ren, X. Zhang, M. Jia, C. Ma, J. Li, M. Shi and Y. Niu, Molecules, 2023, 28, 3152 CrossRef CAS PubMed.
- O. P. Parenago, E. Y. Oganesova, A. S. Lyadov and A. A. Sharaeva, Russ. J. Appl. Chem., 2020, 93, 1629–1637 CrossRef CAS.
- J. Ilowska, J. Chrobak, R. Grabowski, M. Szmatola, J. Woch, I. Szwach, J. Drabik, M. Trzos, R. Kozdrach and M. Wrona, Molecules, 2018, 23, 2025 CrossRef PubMed.
- X. L. Gao, K. Dai, Z. Wang, T. T. Wang and J. B. He, Friction, 2016, 4, 105–115 CrossRef.
- X.-J. Liu, Q. Jia, C.-Y. Wang and N.-L. Wang, J. Chin. Med. Mater., 2009, 32, 1252–1255 CAS.
- X. L. Gao, Z. Wang, H. Zhang and K. Dai, J. Tribol., 2015, 137, 021802 CrossRef.
- V. Svetnik, A. Liaw, C. Tong, J. C. Culberson, R. P. Sheridan and B. P. Feuston, J. Chem. Inf. Comput. Sci., 2003, 43, 1947–1958 CrossRef CAS PubMed.
- L. P. Xiong, Z. Y. He, S. Han, J. Tang, Y. L. Wu and X. Q. Zeng, Tribol. Int., 2016, 104, 98–108 CrossRef CAS.
- X. Q. Zeng, F. LI and M. Zhou, Lubr. Eng., 2007, 61–63 CAS.
- X. Sun and H. Shang, J. North China Univ. Sci. Technol., 2018, 40, 45–50 Search PubMed.
- Q. G. Ong and Y. Laigui, Tribology, 2001, 270–273 Search PubMed.
- C. Yueping and Y. Laigui, Tribology, 2000, 20, 119–122 Search PubMed.
- Z. he and L. Xiong, Mater. Mech. Eng., 2011, 35, 36–39 CAS.
- W. Huang, Tribology, 2003, 33–37 CAS.
- Y. Wang and J. Li, Sci. Bull., 2007, 2607–2612 Search PubMed.
- C. K. Fan, F. F. Li and L. P. Sheng, China Pet. Process. Petrochem. Technol., 2008, 58–62 CAS.
- L. Shui, Y. Zhou, G. Zhang, H. Chen and Y. Zhao, J. Tribol., 2012, 134, 031802 CrossRef.
- Q. Gong, W. He and W. Liu, Tribol. Int., 2003, 36, 733–738 CrossRef CAS.
- X. J. Zeng, F. Huang, J. M. Li and Y. Y. Jiang, China Pet. Process. Petrochem. Technol., 2012, 14, 56–60 CAS.
- L. Xiong, Z. He, H. Xu, J. Lu, T. Ren and X. Fu, Lubr. Sci., 2010, 23, 33–40 CrossRef.
- J. Yan, J. Bu, X. Bai, J. Li, T. Ren and Y. Zhao, Proc. Inst. Mech. Eng., Part J, 2012, 226, 377–388 CrossRef CAS.
- X. Ji, Y. Chen, X. Wang and W. Liu, Ind. Lubr. Tribol., 2012, 64, 315–320 CrossRef.
- X. Zeng, H. Wu, H. Yi and T. Ren, Wear, 2007, 262, 718–726 CrossRef CAS.
- X. Zeng, J. Li, X. Wu, T. Ren and W. Liu, Tribol. Int., 2007, 40, 560–566 CrossRef CAS.
- Y. Sun, L. Hu and Q. Xue, Wear, 2009, 266, 917–924 CrossRef CAS.
- W. Huang, B. Hou, P. Zhang and J. Dong, Wear, 2004, 256, 1106–1113 CrossRef CAS.
- K. Fan, J. Li, H. Ma, H. Wu, T. Ren, M. Kasrai and G. M. Bancroft, Tribol. Int., 2008, 41, 1226–1231 CrossRef CAS.
- Z. He, J. Lu, X. Zeng, H. Shao, T. Ren and W. Liu, Wear, 2004, 257, 389–394 CrossRef CAS.
- Z. He, L. Xiong, F. Xie, M. Shen, S. Han, J. Hu and W. Xu, PLoS One, 2018, 13, e0207267 CrossRef PubMed.
- X. Xu, J. Li, L. Sun and Q. Xue, Ind. Lubr. Tribol., 2013, 65, 19–26 CrossRef.
- Y. Wang, J. Li, Z. He and T. Ren, Proc. Inst. Mech. Eng., Part J, 2008, 222, 133–140 CrossRef CAS.
- P. Ning, L. Wang, W. Wang, S. Li and Z. Ye, J. Dispersion Sci. Technol., 2015, 37, 699–705 CrossRef.
- W. Hua, L. Jing, M. Haibing, R. Tianhui, M. Kasrai and G. M. Bancroft, Tribol. Trans., 2009, 52, 277–283 CrossRef CAS.
- C. L. Li, L. P. Xiong, L. T. Xiong and W. Wang, Adv. Mater. Res., 2012, 496, 493–497 CAS.
- R. K. Singh, A. Kukrety and A. K. Singh, ACS Sustain. Chem. Eng., 2014, 2, 1959–1967 CrossRef CAS.
- Z. Tang, L. Sun, J. Wang and F. Fan, Proc. Inst. Mech. Eng., Part J, 2017, 231, 1464–1473 CrossRef CAS.
- H. Wu, X. Zeng, L. Lu and T. Ren, Chin. Sci. Bull., 2007, 52, 194–199 CrossRef CAS.
- J. C. Yan, X. Q. Zeng, E. van der Heide, T. H. Ren and Y. D. Zhao, RSC Adv., 2014, 4, 20940–20947 RSC.
- W. Zhan, Y. Song, T. Ren and W. Liu, Wear, 2004, 256, 268–274 CrossRef CAS.
- Z. Song, T. Chen, T. T. Wang, Z. Wang and X. L. Gao, J. Tribol., 2019, 141, 091801 CrossRef CAS.
- C. Otunga, J. Odindi, O. Mutanga, C. Adjorlolo and J. Botha, Geocarto Int., 2018, 33, 489–504 CrossRef.
- M. W. Fagerland and D. W. Hosmer, Stata J., 2012, 12, 447–453 CrossRef.
- Z. Wang, Teh. Vjesn.-Tech. Gaz., 2023, 30, 623–633 Search PubMed.
- W. de Vazelhes, C. J. Carey, Y. Tang, N. Vauquier and A. Bellet, J. Mach. Learn. Res., 2020, 21, 1–6 Search PubMed.
- E. O. Cannon, F. Nigsch and J. B. O. Mitchell, Chem. Cent. J., 2008, 2 DOI:10.1186/1752-153X-2-3.
- J. G. Hao and T. K. Ho, J. Educ. Behav. Stat., 2019, 44, 348–361 CrossRef.
| This journal is © The Royal Society of Chemistry 2024 |

