
 Open Access Article
 This Open Access Article is licensed under a Creative Commons Attribution-Non Commercial 3.0 Unported Licence
Ubiquitin specific peptidase (USP37) mediated effects in microscaffold-encapsulated cells: a comprehensive study on growth, proliferation and EMT†
Shreemoyee De‡
a,
Ravi Chauhan‡b,
Mayank Singh*b and
Neetu Singh *ac
*ac
aCentre for Biomedical Engineering, Indian Institute of Technology Delhi, Hauz Khas, New Delhi 110016, India. E-mail: shreemoyee.de@iitd.ac.in; sneetu@iitd.ac.in
bDepartment of Medical Oncology (Lab), All India Institute of Medical Sciences, New Delhi, India. E-mail: c.ravi117@gmail.com; mayank.osu@gmail.com
cBiomedical Engineering Unit, All India Institute of Medical Sciences, Ansari Nagar, New Delhi 110029, India
First published on 13th February 2024
Abstract
Though significant advances have been made in developing therapeutic strategies for cancer, suitable in vitro models for mechanistically identifying relevant drug targets and understanding disease progression are still lacking. Most studies are generally performed using two-dimensional (2D) models, since these models can be readily established and allow high throughput assays. However, these models have also been reported as the reason for unreliable pre-clinical information. To avoid this discrepancy, three-dimensional (3D) cell culture models have been established and have demonstrated the potential to provide alternative ways to study tissue behavior. However, most of these models first require optimization and cell cultures with a certain density, thus adding a prepping step in the platform before it can be used for any studies. This limits their use in studies where the fundamental understanding of biological processes must be carried out in a short time frame. In this study, we developed a 3D cell culture system that tests a less explored cancer therapeutic target—the deubiquitinating enzyme ubiquitin specific peptidase 37 (USP37)—in different cancer cell lines using sensitive carbon dot pH nanosensors, which provides a rapid model for studies compared to the parallel model available commercially. This enzyme is found to be elevated in different cancers and has been reported to play a role in cell cycle regulation, oncogenesis and metastasis. However, the confirmation of the role of USP37 downregulation in cellular proliferation via appropriate in vitro 3D models has not been demonstrated. To establish the applicability of the developed 3D platform in studying such oncogenes, classical 2D models have been used in this study for identifying the role of USP37 in tumor progression and metastasis. The data clearly suggests that this ingeniously developed 3D cell culture system is a better alternative to 2D models to study the growth and migration of different cancer cell lines on depletion of oncogenic proteins like USP37 and its effect on epithelial–mesenchymal transition (EMT) markers, and it can further be targeted as a viable therapeutic option.
1. Introduction
Despite decades of research and improvements in treatment modalities, overall survival and a superlative therapeutic approach remain distant goals in cancer therapy. Therefore, it is the foremost requirement to understand the disease at its core in order to improve current models and systems or switch to new ones to discover the best possible cure. Among the primary model systems used to study cancer cell proliferation are in vitro or in vivo model systems.1,2 Traditionally in vivo mouse models are among the fundamental models to study emerging therapeutic biomarkers in cancer. The disadvantages of murine models are that they are expensive and require skilled professionals, and they sometimes fail to reproduce human complexities owing to a different genetic makeup of the murine genome. In vitro systems use commercially available cell lines which are cultured in culture plates and dishes, which are termed two-dimensional (2D) platforms. However, these have their own set of shortcomings, such as lacking the complexities of in vivo tissue organization and too uniform distribution of cells and nutrients, thus failing to be a tangible model representation of any human tissue or organ.3 It has also been realized that only 10% of the drugs that show positive results in 2D systems give effective outcomes in clinical trials.4 This lack of appropriate platforms to understand how tumor cells actually grow inside the tumor microenvironment has also hindered the development of new cancer therapies.5 Thus, there is a tremendous need for developing reliable in vitro platforms where fundamental studies can be performed for understanding cancer cell proliferation and expansion. Such platforms can also be used for reliable testing and validation of novel therapeutic markers as well as identification of new chemotherapeutic regimes.6 To overcome these problems 3D models are being explored as an alternative option for in vitro studies. These models are easy to handle and can also mimic the complexities of the in situ environment, like the heterogeneous tumour microenvironment, hypoxia and matrix composition.7 Attempts are being made to design 3D models that can recapitulate the human like microenvironment not just in terms of the cells but the scaffold composition and hypoxic regions to get a better picture of the effects of drugs on cancer cells. These platforms, although in very nascent stages, are extremely useful for studying the fundamental aspects of a disease and its progression, along with applications in screening both mutagens and anti-cancer compounds for developing new therapeutics.8 The use of a synthetic 3D environment to preserve the function and characteristics of primary cells is now a well-established concept.9–113D scaffolds can provide a complex multi-cellular environment found in vivo and recapitulate the native cellular micro-environment by providing support for such spatiotemporal control of biochemical and mechanical cues.10 There has been significant progress in the development of an effective 3D cell culture system. Much effort has been put by researchers in understanding the material and biological requirements for developing such 3D micro-environments. However, the 3D platforms established to date lack control over size and shape and have a higher generation time, i.e., approximately more than 2 weeks. This makes it difficult to use 3D platforms to study the effect of transient alterations occurring in the cancer cells.12 Formation of spheroids lacks tumor architectural complexity, and lacks reproducibility as they are not of uniform sizes, as well as are not high-throughput in nature.13 3D models have been explored immensely in relation to creating in vitro platforms for studying cancer and it will be interesting if there is a platform to study these unstable modifications occurring in these cells which have a duration of only 72–96 hours. Cancer is a complex disease caused by either gain of function of an oncogene or loss of function of a tumor suppressor gene, which leads to uncontrolled growth and proliferation of cells.14 Metastasis is one of the hallmarks of cancer described by Hanahan and Weinberg. The epithelial–mesenchymal transition (EMT) is a primary cause of transformation of a benign tumor to a metastatic one, leading to cancer.15,16 According to various studies epithelial–mesenchymal transition (EMT) has been linked to the invasion and spread of cancerous tumours. Through numerous post translational modifications or systems, various proteins are shown to be altered and dysregulated during EMT.17 In eukaryotes, the ubiquitin-proteasome system (UPS) is essential for the breakdown of proteins. This system comprises one of the processes, i.e., ubiquitination in which the ubiquitin moiety is attached to the target protein, which further undergoes degradation.18 Ubiquitination of a protein as a post-translational modification is a highly conserved and reversible process, which regulates the fate of various proteins associated in different pathways.19 This process of ubiquitination is reversed by another process called deubiquitination, which is carried out by deubiquitinating enzymes (DUBs). DUBs can reverse these effects by cleaving the peptide or isopeptide bond between ubiquitin and its substrate protein.20 Dysregulation of DUBs is frequently associated with the tumorigenesis process such as self-renewal, apoptosis and EMT. Functioning and molecular role of various DUBs in different cancers have been shown already in various studies. They are one of the essential proteins to regulate stem cell associated markers, and control various aspects of metastatic progression.21 One of the DUBs is USP37, which is a member of the largest sub-family of DUBs, which stabilizes multiple oncoproteins, and also is found to be elevated in different cancers.21 Human USP37, localized mainly in the cytoplasm, is composed of 979 amino acids, and is known to be involved in stabilizing proteins involved in cell cycle progression and proliferation. USP37 also stabilizes various downstream targets such as SNAI, SNAIL involved in metastasis. Various in vitro and in vivo models and experiments are used to demonstrate how USP37 regulates various processes like cell cycle regulation, oncogenesis and metastasis.22 Unfortunately, most of the in vitro studies demonstrating the role of USP37 and the importance of similar oncogenes rely on 2D culture platforms. 3D models where these studies can be carried out are not practical as they usually require at least 2–3 weeks of prepping time for the platform before the studies can be initiated. This prolonged timeline poses a stability challenge when transient gene silencing is involved and the results might vary from real world scenarios.
Owing to the importance of studying the role of deubiquitinating enzymes in cancer cell proliferation and migration, herein, we report a 3D in vitro culture platform for understanding the effect of downregulation of a novel oncogene USP37 on cellular proliferation in cancer. The platform is a simple alginate–gelatin based 3D scaffold with nanoprobes (carbon dots) that can sense pH changes in the micro-environment, which further allows us to monitor cell proliferation in real time without any end-point assays, thus enabling longer period studies without disturbing the culture system.23,24 Our platform enables us to validate if USP37 can be used as a potential target for developing newer therapies by using this indigenously developed 3D cell culture model, which will help in recapitulating in vivo conditions. We performed the studies first in 2D culture and compared the observations in our 3D model to evaluate the proficiency of this system. Potential inhibitors of USP37 are still not known, and we believe this study not only establishes the indigenously developed 3D culture platform as a sensitive in vitro model for understanding processes and biological phenomena like cancer cell proliferation in cancer but will also provide useful insight into establishing USP37 as an exciting target for controlling metastasis in carcinoma cells as its depletion inhibits cancer cell migration.
2. Materials and methods
2.1 Cell lines
Ovarian cancer cell lines IGROV-1 and PA-1 were all obtained from The National Centre for Cell Science, Pune, India. MCF-10A cell lines were obtained from Elabscience and routinely tested for mycoplasma.2.2 Reagents and materials
PA-1 was cultured in Eagle's Minimum Essential Medium (EMEM; Gibco, Thermo Fisher Scientific) supplemented with 10% FBS (Gibco, Thermo Fisher Scientific) and 1% Pen/Strep (GIBCO) and IGROV-1 cells were cultured in Dulbecco's modified Eagle's medium (DMEM; Gibco, Thermo Fisher Scientific) supplemented with 10% FBS (Gibco, Thermo Fisher Scientific) and 1% PenStrep (GIBCO). MCF10A cells were cultured in DMEM/F12(EP-CM-L0113) +5% HS + 20 ng ml−1 EGF + 0.5 μg ml−1 hydrocortisone + 10 μg ml−1 insulin + 1% NEAA(EP-CM-L0463) + 1% Pen/Strep (GIBCO). All cells were incubated at 37 °C and 5% CO2.2.3 RNA-isolation and quantitative real-time PCR (qRT-PCR)
Total RNA was extracted using the Trizol method and reverse transcribed into cDNA using Verso cDNA Synthesis Kit (AB1453A). Real-time PCR was performed on a LightCycler 480 (Roche) with the LightCycler® 480 SYBR Green I Master. The 2−ΔΔCT method was used for relative quantification. Beta actin RNA was used for data normalization. All primer sequences of qRT-PCR are listed in Table 1 in ESI.†2.4 Transfections and treatments
siRNA transfections were performed using Lipofectamine RNAiMAX (ThermoFisher) according to the manufacturer's protocol. The sequences of siRNAs used in this study are as follows. Two sequences of siRNAs have been used in the current study: one is Mission Si RNA USP37 (Sigma Aldrich) with the target sequence.TGAGGTTCAGCACTCCATCATTTGTAAAGCATGTGGAGAGATTATCCCCAAAAGAGAACAGTTTAATGACCTCTCTATTGACCTTCCTCGTAGGAAAAAACCACTCCCTCCTCGTTCAATTCAAGATTCTCTTGATCTTTTCTTTAGGGCCGAAGAACTGGAGTATTCTTGTGAGAAGTGTGGTGGGAAGTGTGCTCTTGTCAGGCACAAATTTAACAGGCTTCCTAGGGTCCTCATTCTCCATTTGAAACGATATAGCTTCAATGTGGCTCTCTCGCTTAACAATAAGATTGGGCAGCAAGTCATCATTCCAAGATACCTGACCCTGTCATCTCATTGCACTGAAAATACAAAACCACCTTTTACCCTTGGTTGGAGTGCACATATGGCAATTTCTAGACCATTGAAAGCCTCTCAAATGGTGAATTCCTGCA.
Another sequence of siRNA against USP37, i.e., USP37 siRNA (sc-76845) and control scrambled SiRNA.
2.5 Immunoblotting
Cellular extracts were prepared in EBC buffer (50 mM tris (pH8.0)), 120 mM NaCl, 0.5% Nonidet P-40, 1 mM DTT and protease and phosphatase inhibitor tablets (ThermoFisher). Protein concentration was quantified by Pierce BCA assay (ThermoFisher) and samples were prepared by boiling in Laemmli buffer for 5 minutes. Equal amounts of whole cell lysates were resolved by hand-cast SDS-PAGE, and transferred to PVDF membranes (Millipore). All blocking and primary antibody steps were performed in 5% BSA diluted in TBST (137 mM NaCl, 2.7 mM KCl, 25 mM tris pH 7.4, 1% Tween-20). All primary antibody incubations were performed with shaking at 4 °C overnight. After transfer of the separated proteins to PVDF membranes, the membranes were probed with the following primary antibodies: USP37 (at dilution 1![[thin space (1/6-em)]](https://www.rsc.org/images/entities/char_2009.gif) :1000; from Elabscience) and β-actin (at 1:10000; from Sigma, MO, USA). After overnight incubation, the membranes were extensively washed, and then were incubated with either secondary goat anti-mouse/rabbit HRP-conjugated antibodies purchased from Cell Signalling Technology. Separated protein bands were visualized using a chemiluminescence HRP substrate (BioRad, CA, USA), and the membranes were imaged and analysed using the ChemiDoc™ imaging system from Bio-Rad (CA, USA).
:1000; from Elabscience) and β-actin (at 1:10000; from Sigma, MO, USA). After overnight incubation, the membranes were extensively washed, and then were incubated with either secondary goat anti-mouse/rabbit HRP-conjugated antibodies purchased from Cell Signalling Technology. Separated protein bands were visualized using a chemiluminescence HRP substrate (BioRad, CA, USA), and the membranes were imaged and analysed using the ChemiDoc™ imaging system from Bio-Rad (CA, USA).
2.6 Scratch assay
IGROV-1 and PA-1 cells were transfected with the si-USP37 (Santa Cruz, USA) at different concentrations for 48 hours and after that the cells were cultured in fresh culture media (DMEM with 10% FBS) to full confluence. After that, a wound was created using a 200 μL micropipette tip on the 6-well plate. After creating the scratch, the wells were washed with PBS to remove the non-adherent cells, the medium was then replaced with fresh culture media and incubated at 37 °C for 48 h. Then, the cells were washed twice with PBS and the wound was observed under a microscope (Leica DM6 Microscope, Wetzlar, Germany). Pictures were taken at the start of the experiment (0 h) and 24 hours later (24 h) and 48 hours later (48 h). Pictures of representative experiments are shown and the mean ± SD are illustrated in the graphs. The data was analysed using ImageJ software (National Institutes of Health, US).2.7 Colony formation assay
PA-1 cells were transfected with si-USP37 using Lipofectamine RNAiMAX (ThermoFisher). Then, they were collected and 500 cells per well were seeded in 6 well plates. Cells were allowed to grow for one week, until the colonies could be observed. The colonies were fixed with 3.7% formaldehyde for 30 min and stained with 0.4% crystal violet. Cells were washed with PBS to remove excess dye. The plate was left to air dry and the colonies were counted using ImageJ software (National Institutes of Health, US).2.8 Electrospray of alginate–gelatin microgels
Sodium alginate and gelatin were weighed and UV sterilized inside a laminar hood. The powder mix was allowed to dissolve in autoclaved PBS on a stirrer. The equipment was placed inside a biosafety cabinet. The solution was then allowed to pass through a 24 g needle under an open electric field at a flow rate of 40 ml h−1. The fluid fragmented into microdroplets and was sprayed onto a gelling bath containing 100 mM calcium chloride solution to instantly crosslink alginate. The drops were then incubated at 37 °C for 15–20 minutes for gelation of microgels. The microgels were given an HBSS wash and incubated in complete media (DMEM with FBS) at 37 °C with 5% CO2 for further studies.2.9 Cell encapsulation in microgels
Cells were trypsinized and a cell count of 106 cells per ml was suspended in the alginate–collagen solution as per the requirement of the experiment. They were then mixed with the solution. The solution was pipetted up and down to achieve a uniform suspension. The uniformly suspended solution was then loaded to the coaxial needle with the help of a pressure monitoring line (150 cm, 1.4 ml) and dropped into the 0.1 M CaCl2 bath. The micro-scaffolds containing the encapsulated cells formed in the gelling solution were washed with HBSS containing antibiotic antimycotic solution twice and suspended in DMEM media. They were stored in an incubator with 5% CO2 at 37 °C for further culture.2.10 Cell proliferation studies
Proliferation of the encapsulated cells, the ovarian teratocarcinoma cell line PA I, was monitored by two methods. One was the standard protocol of monitoring the metabolic activity of the cells using Alamar Blue over a period of time and the second method was to monitor the change in pH using pH sensitive carbon dots. The cell proliferation was studied before (control) and after transfection with siRNA.2.11 Gene expression study
The encapsulated cells from the alginate gelatin microgels were extracted using RNAse free 55 mM sodium citrate solution. Total RNA from extracted cells was isolated using the TRIzol method following the manufacturer's protocol. RNA (1 μg per 20 μL reaction volume) was reverse transcribed into cDNA using iScriptTM cDNA Synthesis Kit according to the manufacturer's instructions. Gene expression was measured using real-time quantitative PCR on a CFX96TM real-time PCR detection system (Bio Rad). PCR was performed using SsoFastTM Eva Green® Supermix according to the manufacturer's specifications. The gene expression was normalized to GAPDH as the internal control gene for EMT genes and USP37. The expressions determined from reactions run in triplicate on the same plate. For each gene, fold change relative to the control (cells grown on the tissue culture plate) was calculated using the ΔΔCt method. Error bars represent the SD of the ΔΔCt values.2.12 Immunofluorescence staining
Untreated and treated cells were allowed to grow inside the microgels for 24 hours and 48 hours. The microgels were then washed with HBSS and fixed in 4% PFA in HBSS for 2 hours at room temperature or overnight at 4 °C. microgels were washed 3 times (8 min each) with HBSS, then permeabilized with 0.1% (v/v) Triton X-100 for 2 hours and washed 3 times with HBSS. After incubating them for 2 hours at room temperature or overnight at 4 °C with blocking buffer (10% FBS in HBSS), the primary antibody diluted in blocking buffer was added (USP37 1:100 dilution, N-cadherin 1:100 dilution, and E-cadherin 1:00 dilution) and incubated overnight at 4 °C. The samples were washed 3 times (8 min each) with HBSS + CaCl2 solution. The anti-mouse Alexa Fluor 594 tagged secondary antibody (1:100) diluted in blocking buffer was incubated for 2 hours at room temperature, and then washed thrice (8 min each) with HBSS + CaCl2 solution. 1 μg ml−1 DAPI diluted in blocking buffer was added and kept for 15 minutes and then washed thrice with washing buffer. Samples were observed using a Carl Zeiss Axio Observer microscope with a 10× objective and an Olympus FluoviewFV1000 confocal microscope with a 20×/40× objective.
3. Results and discussion
3.1 Elevated USP37 levels in different cancers correlate with poor prognosis in gynecologic cancers
Various biomarkers were identified to be dysregulated in different cancers. Already many studies have shown that modifications at both transcriptional as well as translational levels regulate the expression of various factors involved in different pathways of cancers. Deubiquitylation, one of the most common modifications, carried out by deubiquitinating enzymes (DUBs) plays an important role in cancer progression.25 USP37 is an important member of the DUB family, which is found to be elevated in different cancers and is known for regulating various cellular processes like cell cycle regulation, oncogenesis and tumor progression. Interestingly, a TCGA based mRNA expression analysis of USP37 using GEPIA-2, an online database, indicates that the expression of USP37 in different cancers is elevated, and might be responsible for tumor progression and metastasis (Fig. 1A). It is also reported that the expression of USP37 found to be elevated in different cancers has a prominent effect on the overall and progression free survival of different cancers.22 Intrigued by these reports, we analyzed the correlation between the expressions of USP37 and overall survival, through GEPIA-2 and it was observed that indeed high expression of USP37 results in poor prognosis of different cancers, for example, gynecologic cancer like cervical cancer and ovarian cancer (Fig. 1). Thus, the literature survey and also TCGA database analyses signify that USP37 is upregulated in different types of cancers and the role of USP37 in modifying the EMT by stabilizing the EMT modifier SNAIL has been reported. Hence, we hypothesized that downregulation of USP37 will reduce the growth and migratory potential of the cancer cells.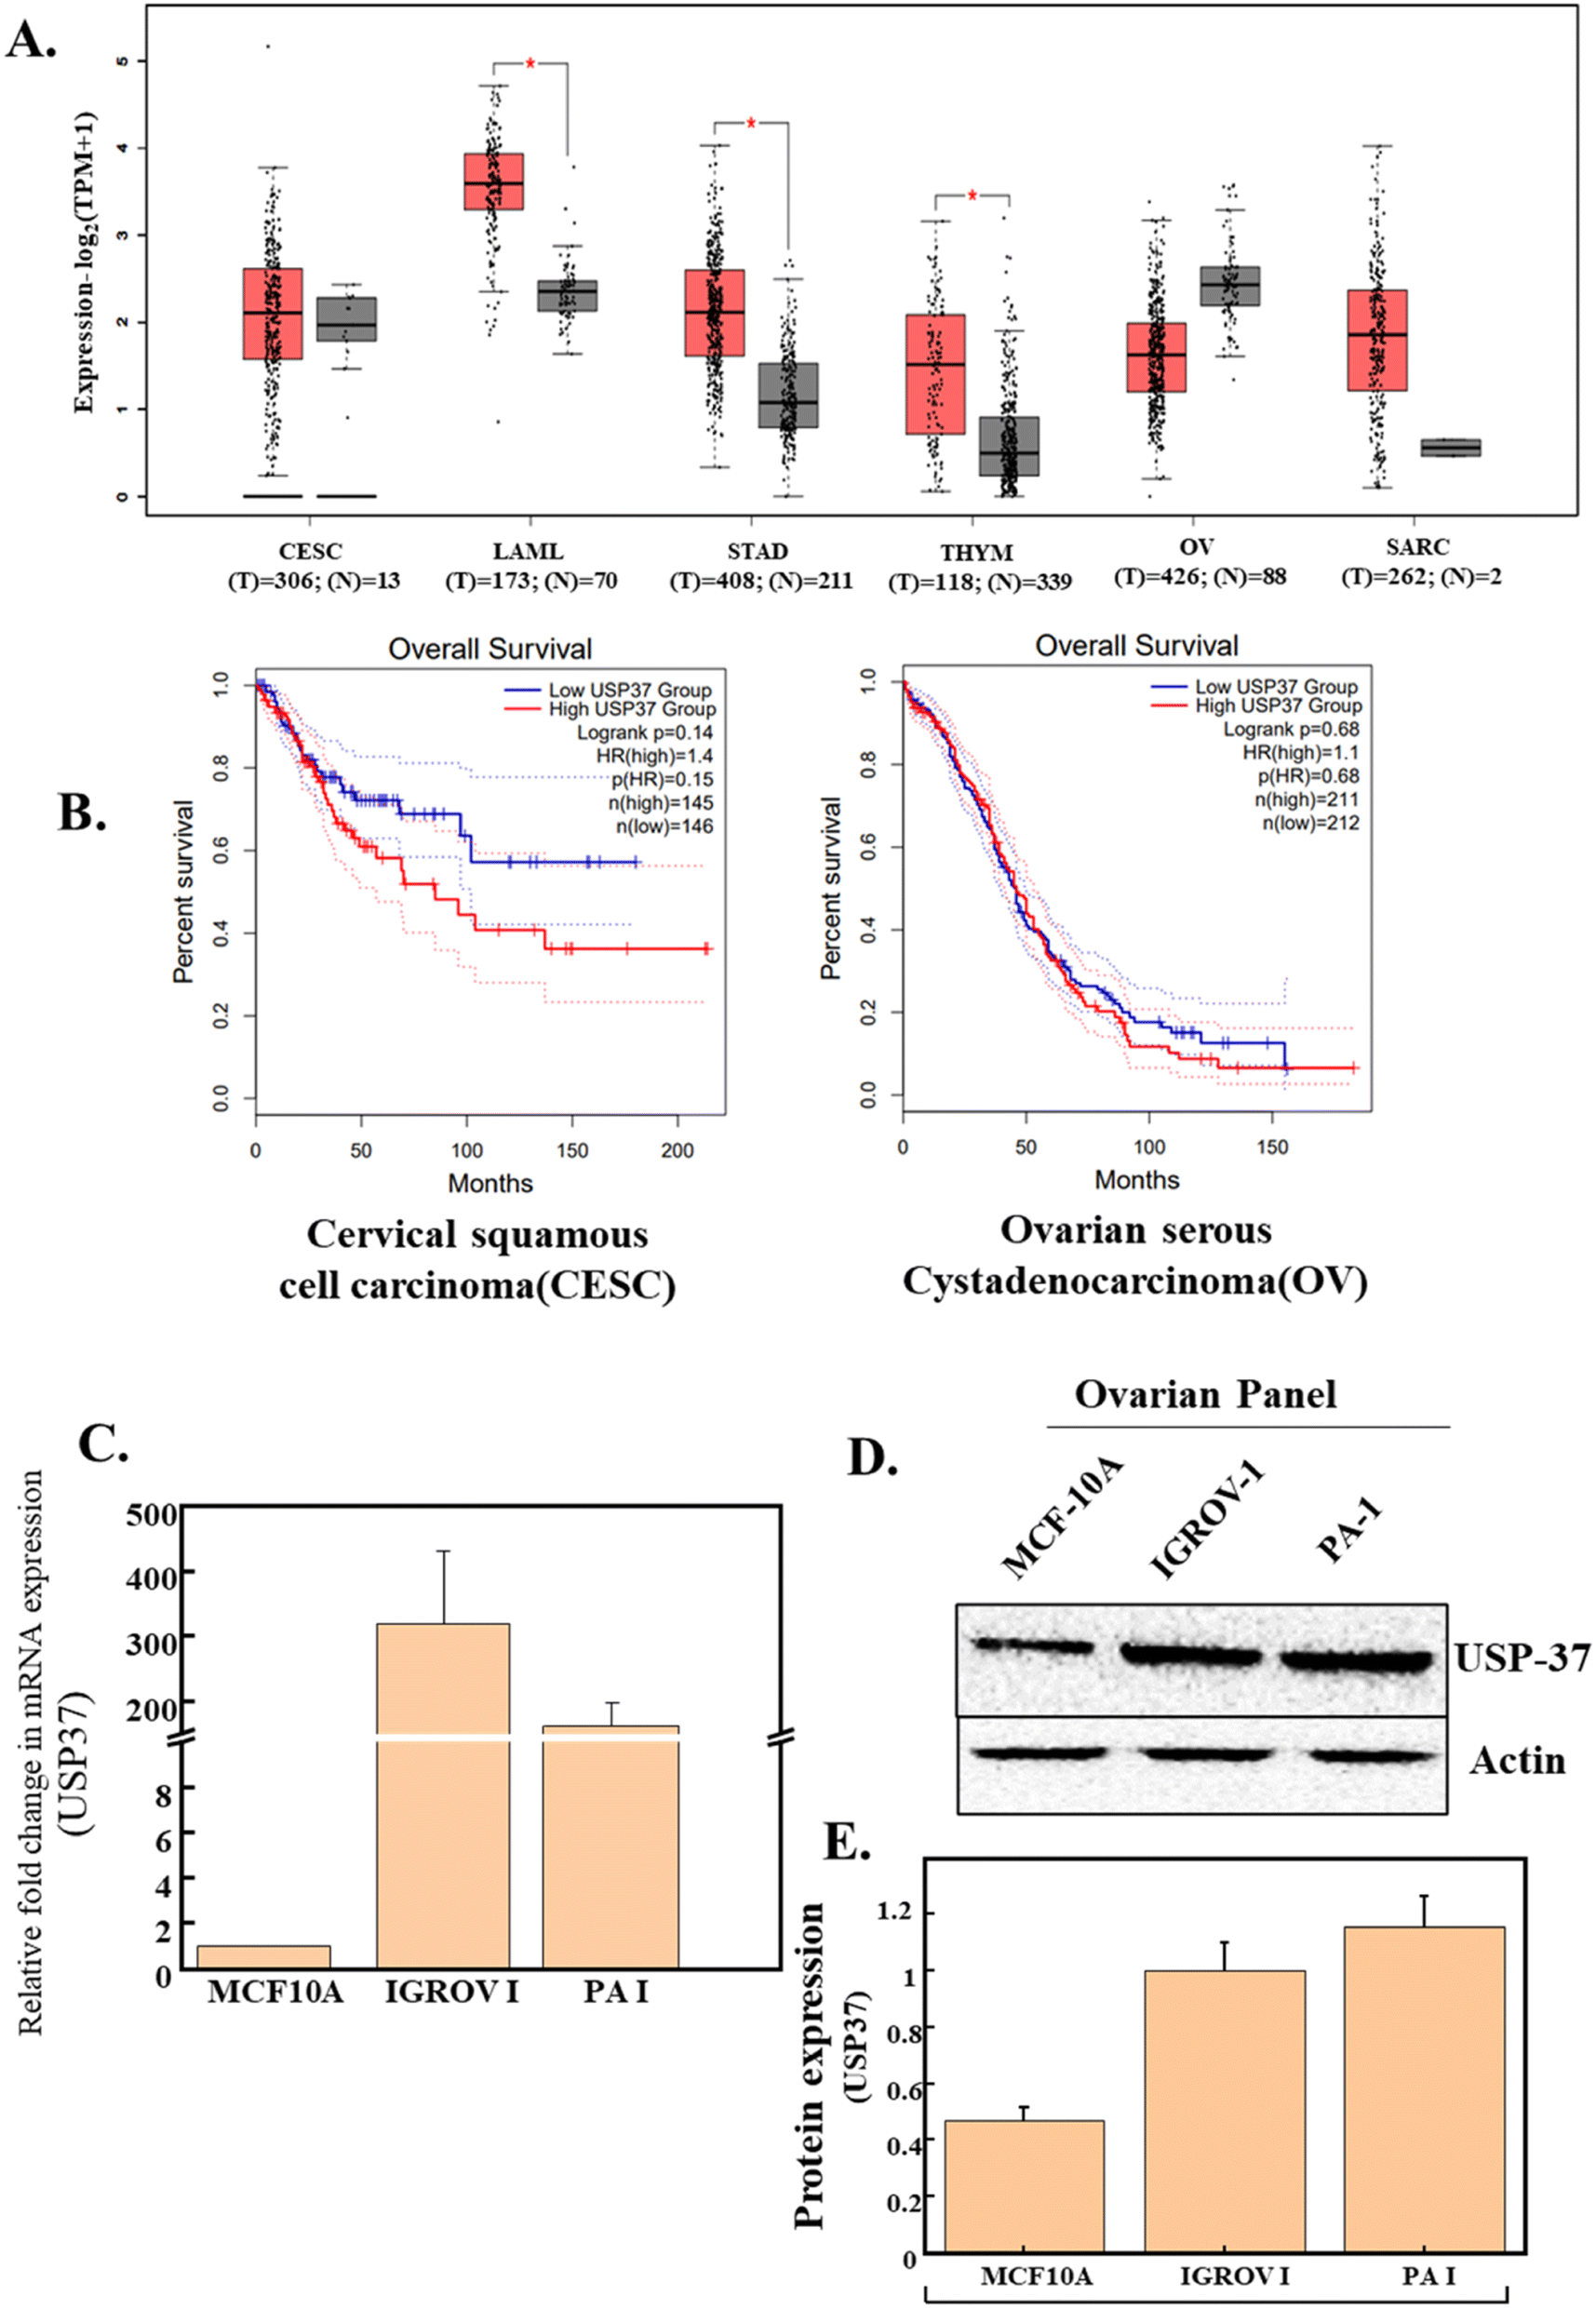 | ||
| Fig. 1 (A) Comparative expression analysis of USP37 in different cancers. The red boxplot indicates the tumor group. The grey boxplot indicates the normal group. Source: TCGA and GTEx data. (B) Survival analysis of patients with respect to USP37 expression in different gynecologic cancers (CESC and OV). (C) Comparative expression of USP37 in various cell lines. Relative mRNA expression of USP37 in ovarian cancer cell lines (IGROV-1 and PA-1) compared to the non-transformed cell line (MCF-10A). (D) Relative protein expression of USP37 in ovarian cancer cell lines (IGROV-1 and PA-1) compared to the non-transformed cell line (MCF-10A). (E) Graphical representation of western blot analysis between non-transformed (MCF10A) and ovarian cancer cell lines. | ||
Different studies have suggested that USP37 expression is significantly high in different cancers and it possibly functions as an oncogene. USP37 modulates the expression of various oncogenes and factors involved in cell cycle progression.22 The role of USP37 in ovarian cancer has not been studied to date, so to further investigate the correlation of USP37, and to study if it is responsible for the transformation of different cells, we performed a comparative expression analysis of USP37 at both transcriptional and translational levels between a normal non-transformed epithelial cell line (MCF-10a)26 and different ovarian cancer cell lines, i.e., IGROV-1 and PA-1(Fig. 1C and D). In USP37 comparative expression at the RNA as well as at the protein level (Fig. 1C–E) between non-transformed (MCF-10A) and transformed ovarian cancer cell lines (IGROV-1 and PA-1), we observed that USP37 expression is significantly higher in transformed cell lines (IGROV-1 and PA-1), which indicates that elevated USP37 might be responsible for the transformation. This high expression of USP37 in transformed or cancerous cell lines as compared to the normal epithelial cell line suggests that this high expression might be responsible for the alteration of different factors regulating various pathways in tumor progression in ovarian cancer cell lines.
3.2 Inhibition of USP37 results in the reduced survival of ovarian cancer cells
In particular, USP37 is the least studied member of the ubiquitin specific peptidase (USP) family. In different cancers it stabilises the expression of various oncogenes such as Myc in lung cancer, which has a prominent effect on proliferation and Warburg effect. Other than that, USP37 also stabilizes oncoproteins, i.e., PLZF-RARA, 14-3-3-γ, and Chk-1 in different cancers and regulates cell growth and survival.27 To demonstrate the role of USP37 in cell's proliferative potential, we performed colony formation assay after inhibition of USP37 under optimized conditions in the ovarian cancer PA-1 cell line. We found that the proliferation rate is decreased after inhibition of USP37 using siRNA against USP37 as observed in Fig. 2A and B. USP37 is considerably upregulated in different cancers as discussed previously and the expression of USP37 in different cancers potentially plays a key role in the tolerance of replication stress by stabilizing key replicative factors and cell cycle modulators. As its expression fluctuates according to different stages of the cell cycle and leads to modulation of different factors involved in cell growth and proliferation, its study in vitro becomes even more challenging. Other studies in the literature have also suggested similar observations that USP37 acts as an oncogene and alters the DNA replication dynamics and cell survival via a DNA damage mechanism. Our experiments and literature reports suggest that after inhibiting USP37 various other factors regulating cell proliferation and replication are also downregulated, which results in decreased proliferation rate, which can be analyzed by the reduced colony formation ability of the cells,22 which is a standard 2D assay to analyze the survival potential of cells in response to replicative stress. USP37 acts as a key modulator of factors involved in proliferation, migration, and invasion. Various studies suggest that USP37 modulates the expression of different markers like SNAIL, N-cadherin, and vimentin, in different cancers and its upregulation promotes EMT, migration, and invasion28. USP37 also participates in the sonic hedgehog (SHH) pathway and the stability of GLI1 protein and promotes EMT.19 To further corroborate the role of USP37 in migration we performed colony formation assay with PA-I cells, followed by the scratch assay in IGROV-1 and PA-1 cell lines after inhibition of USP37, which are the standard 2D assays to study cellular migration. Our results indicated that inhibition of USP37 decreases the migratory potential of cells as compared to control cells and even after 48 hours no significant migration was observed and the scratch was not filled in both PA 1 and IGROV-1 cells in which USP37 was depleted (Fig. 2C and D).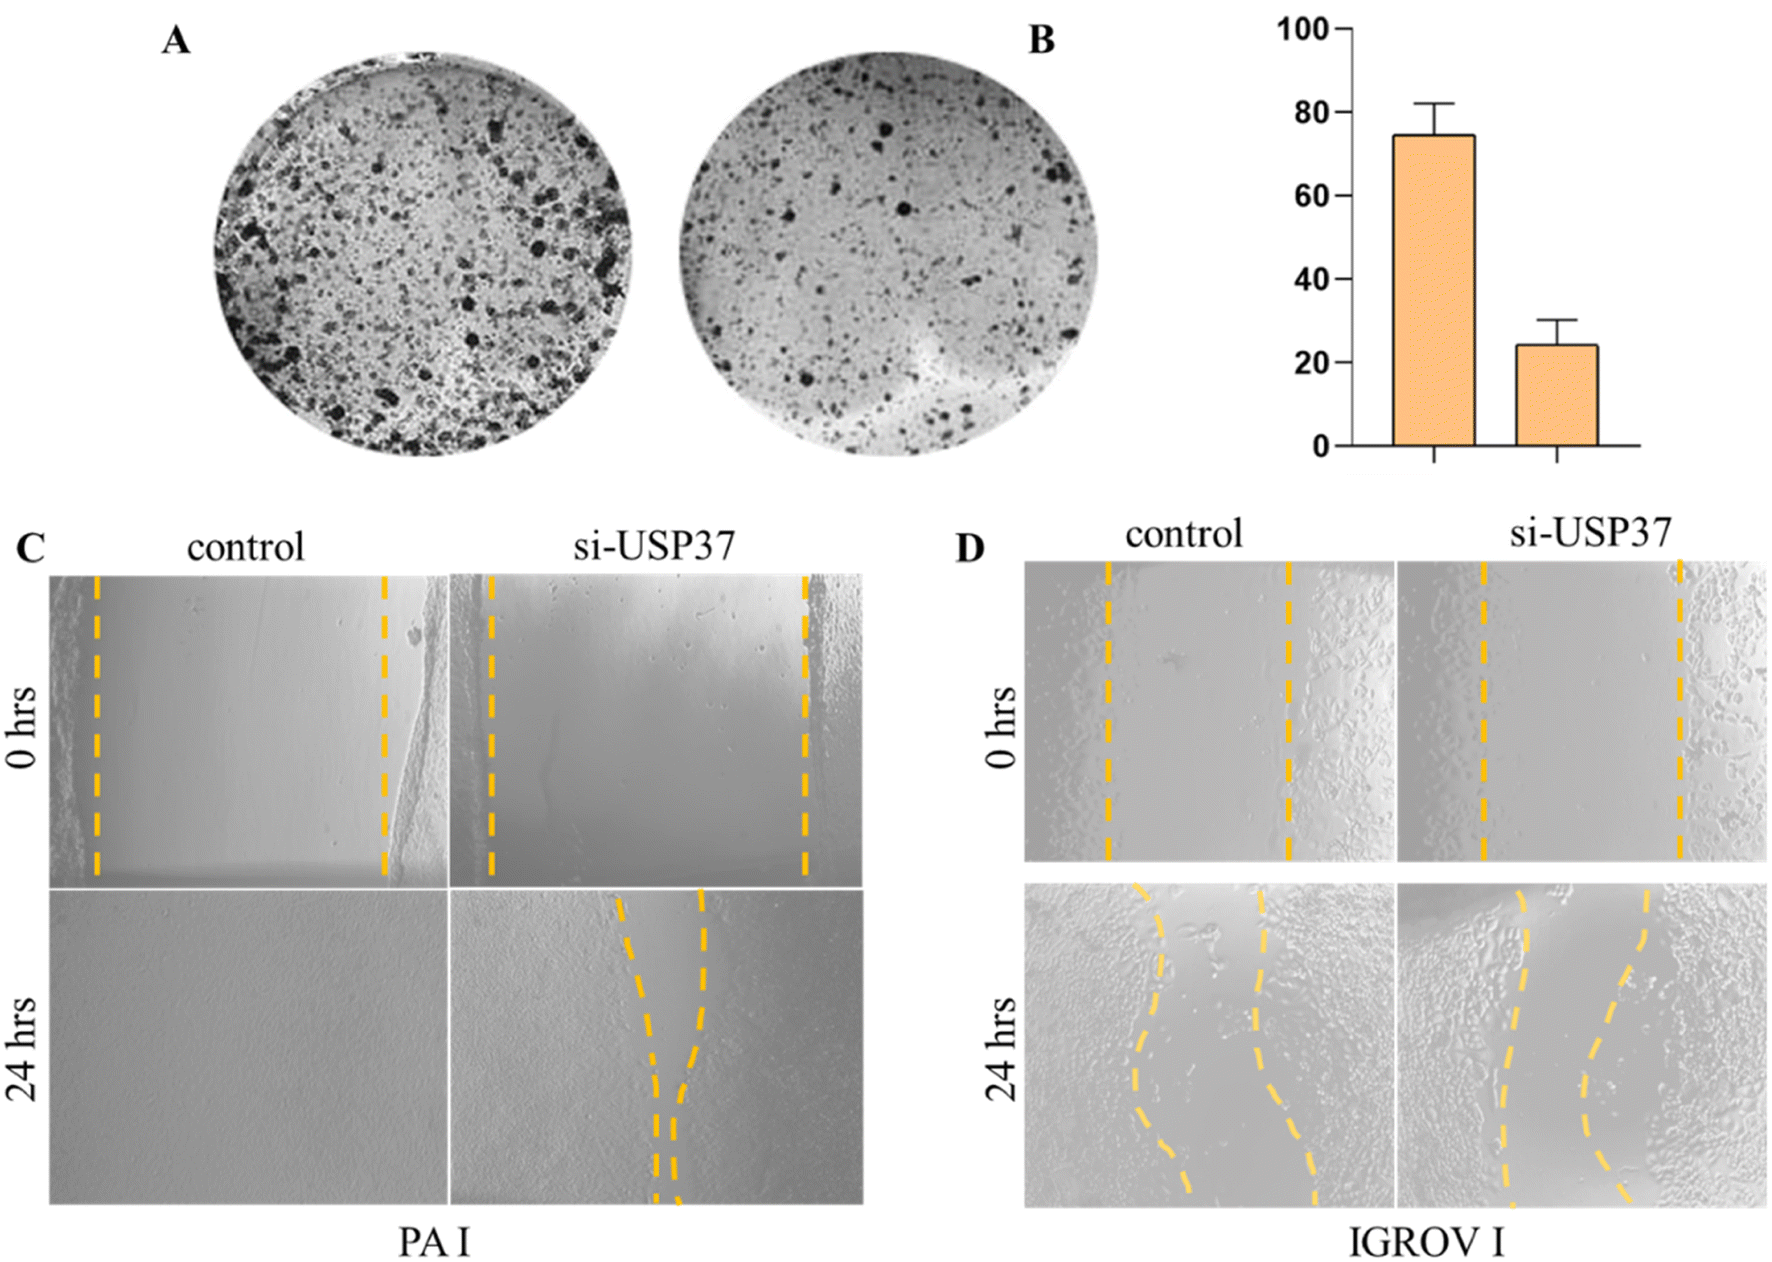 | ||
| Fig. 2 (A) Representative image of colony formation capability after the knockdown of USP37 using siRNA in the PA-1 cell line. (B) Quantification of the number of colonies formed in the untreated control and cells with downregulated USP37. Brightfield microscopic image showing the scratch assay in untreated control cells and cells with the downregulated USP37 gene in (C) PA-1 and (D) IGROV-1 cell lines. | ||
3.3 Inhibition of USP37 and its effects on different EMT markers
The downregulation of USP37 expression was also observed by immunofluorescence studies. As shown in the USP37 panel of Fig. 3A and B, a reduction in the USP37 expression can be observed in both PA-I and IGROV cell lines. There is a slight decrease observed in the N-cadherin levels in both the cell lines after siRNA treatment. In the case of E-cadherin there is a slight increase in the expression in the siRNA treated cells. This might be distantly related to the fact that USP37 plays a role in decrease in proliferation, which promotes epithelial phenotype (non-migratory) in the cells, thus an increase in the expression of E-cadherin.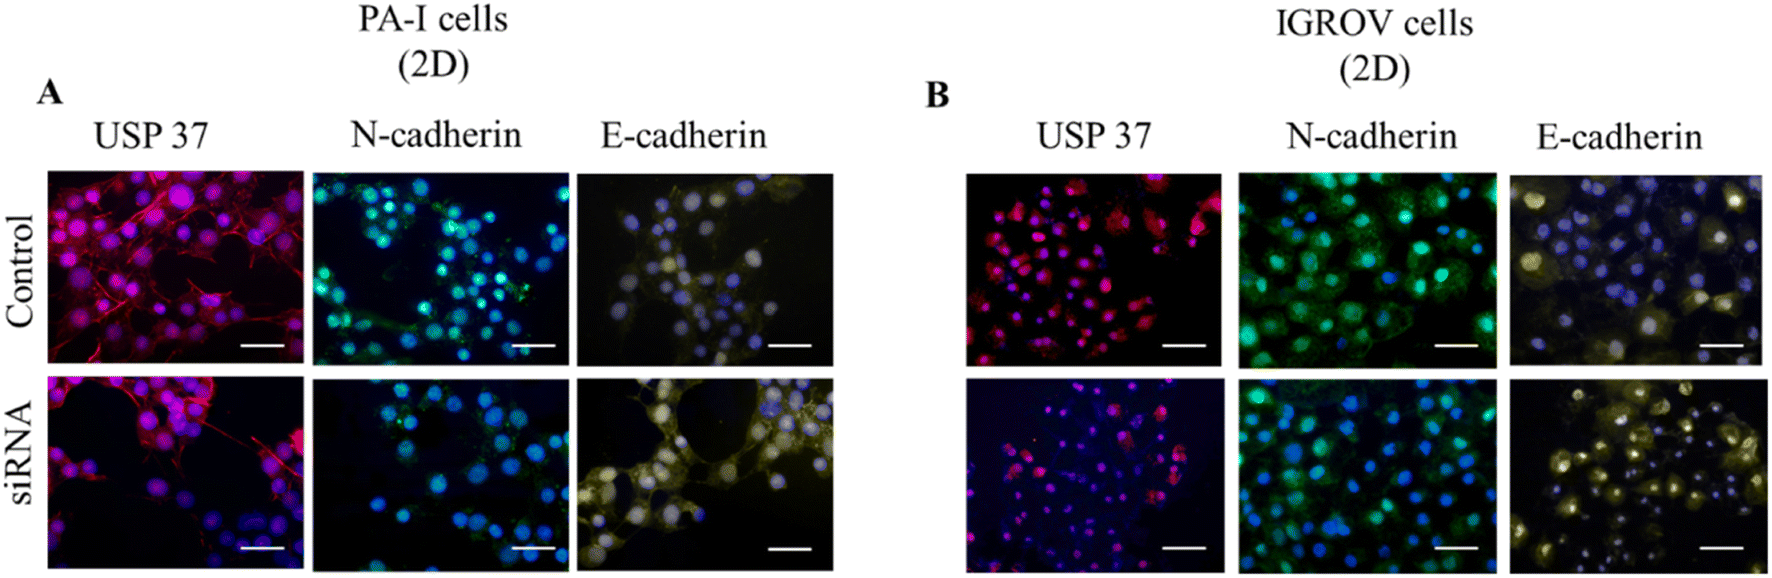 | ||
| Fig. 3 (A and B) Fluorescence micrographs of the cells grown in tissue culture plates (2D) for USP37 (red), N-cadherin (green), E-cadherin (yellow) and DAPI (blue). The images were captured at 20× magnification and were pseudo coloured using ImageJ software (scale bar: 50 μm). | ||
3.4 Cell proliferation study using a 3D cell culture system
Once the effect of downregulating USP37 was confirmed in 2D, we sought to study the effect in 3D culture, which gives a relatively closer picture of the in vivo systems. A simple micron-sized (400–500 μm) 3D culture platform for encapsulating cells was developed using alginate–gelatin based microgels and studies were performed to establish the effect of downregulation of USP37 on the proliferation of ovarian cancer cells. For monitoring of the growth rate of the cells, pH sensitive carbon dots, as shown in the HR-TEM image in Fig. S1A,† were encapsulated along with the cancer cells in the 3D microgels. Cancer cell lines have the property of decreasing the pH as the cell population increases. Utilizing this characteristic fluorescent carbon dots were developed, which have the property of increasing their fluorescence with the decrease in pH, as shown in the spectra in Fig. S1B,† thus allowing further correlation with the growth of cells. This positive change in green fluorescence can be monitored in real-time, without the need for end-point assays. The structure and porosity of the microgels on day 1 and day 5 were observed with SEM micrographs, shown in Fig. S1C and D.† The microgels can also be modified to have spatially separated heterogeneous population of cells (Fig. S2A†). For successfully demonstrating a 3D microgel platform, it should be able to generate hypoxic conditions as the cells grow, as is present in the native conditions. The hypoxic conditions developed can be easily observed by our platform using Image-IT green dye, which fluoresces with the decrease in the O2 concentration. Over a period of 96 hours, we showed that the hypoxia inside the microgels increases (Fig. S2B†), suggesting the applicability of this platform in studying hypoxia and also demonstrating that a key hallmark can be achieved in our microgel platforms. The microgel platform composition can be modified according to the requirement of the experiment or the study. We showed that by altering the composition of the polymer we can alter the porosity of the matrix and also we can add different components like collagen to make it more ECM-like (Fig. S3†).After confirming the tenability in terms of matrix composition, architecture and crosslinking, the microgels were used to study the effect of USP37 downregulation in 3D. It was observed that the observations made in 2D can be replicated in 3D and that indeed there is a decrease in proliferation rate, once USP37 is downregulated. Interestingly, the effect was not sustainable after day 5, as the cells were transiently transfected for downregulating USP37. The growth curve of ovarian (PA I) cancer cell lines was monitored via the standard Alamar Blue assay, and by monitoring the pH changes in the microenvironment due to cell growth by the pH sensitive carbon dots. The pH sensitive carbon dots have two fluorescence emission peaks, one at 450 nm (blue) and another at 550 nm (green). The peak at 550 nm increases with the decrease in pH, whereas the peak at 450 nm stays constant. The ratio of fluorescence intensities of green vs. blue can indicate the pH changes and specifically lowering of pH over time. Since the blue fluorescence is unaffected by pH changes it acts as an internal reference and any changes in the fluorescence intensity can signal the aggregation or other surface changes in the carbon dots due to the biological milieu. The ratiometric sensing thus allows for monitoring the pH changes specifically where the cells are growing. A monitoring of green vs. blue fluorescence intensity changes over time can give the growth curves in this closed system as the pH decrease can be directly correlated with cellular proliferation in the absence of any other pH changing processes. As we can see from Fig. 4A the cells transfected with siRNA show a slower growth rate as compared to the control cells. This observation was made by reading the growth curves by both the techniques. Along with determining the growth curves, the encapsulated cells were also monitored via cell viability assay. As observed in Fig. 4B, the growth rate in USP37 downregulated cells is lower as compared to the control cells observed on day 5.
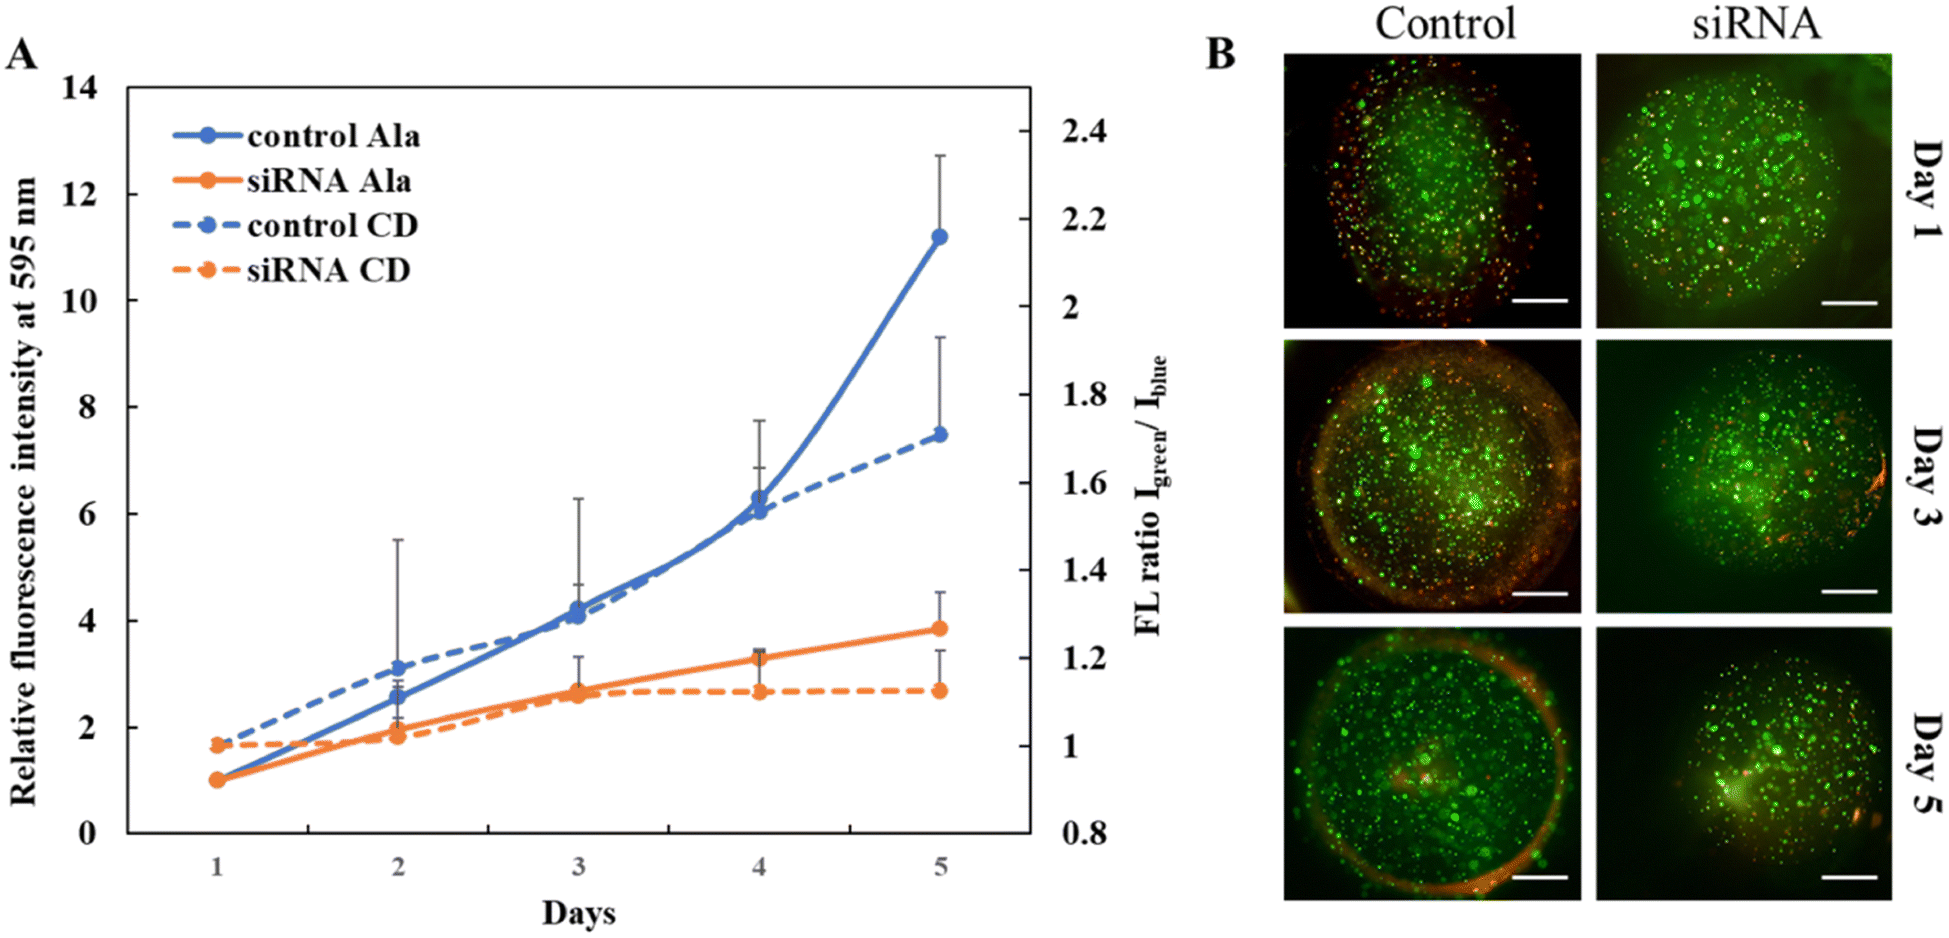 | ||
| Fig. 4 (A) Cellular growth curves. The change in pH was plotted as a ratio of emission intensities at 450 nm (blue) and 550 nm (green) for various cell lines over five days. For comparison cell growth was also quantified using the Alamar Blue assay and plotted for various cell lines over 5 days. The growth curves for the ovarian cancer cell line PA I under two conditions, control and downregulated USP37, were compared using pH sensitive carbon dots and the Alamar Blue assay. (B) Fluorescent micrographs for the encapsulated PA I cells under two conditions, control and downregulated USP37, over a period of 5 days (scale bar for fluorescent micrographs: 100 μm). | ||
3.5 Immunofluorescence and genetic expression study of USP37 depletion
The downregulation of USP37 was also observed in the encapsulated cells by immunofluorescence studies. The cells were stained on day 1 and day 5 and the fluorescence intensities were quantified using ImageJ software (Fig. 5A–C). The downregulation of USP37 decreased the N-cadherin levels slightly but no change in the E-cadherin levels was observed. This expression profile also correlates with the qPCR studies done in Fig. 5D. Since the microgels can be easily dissolved and the encapsulated cells can be retrieved after few days, the genetic changes, especially the expression of the EMT markers, over time were explored, as shown in Fig. 5D. The comparison of the expression was also done with the cells grown and treated in a 2D platform. The downregulation was better maintained in 3D microscaffolds. The expression of the EMT marker genes is also better in 3D as compared to the 2D platform. In the case of the ovarian cancer cell line, PA-I, a very slight decrease in the levels of N-cadherin is observed and almost no change is observed in the expression of E-cadherin. The levels of USP37 are downregulated throughout the study from day 1 to day 5. It has been reported in the literature that USP37 expression plays a role in stabilization of Snail transcription factor. In the gene expression panel, we can observe that the expression profile of Snail is in accordance with the expression of USP37. Downregulation of USP37 also decreases the expression of Snail. This expression level might indicate that Snail might be one of the direct targets of USP37 and might be involved in the pathway effecting the proliferation rate. E-cadherin and N-cadherin might not be directly affected by its downregulation. Further, genetic and protein profiling might lead to better understanding of the targets of USP37. Thus, the conclusion we derived from this study is that USP37 downregulation does decrease the proliferation rate of the cells and this transient effect of USP37 could be successfully captured by the 3D cell culture model.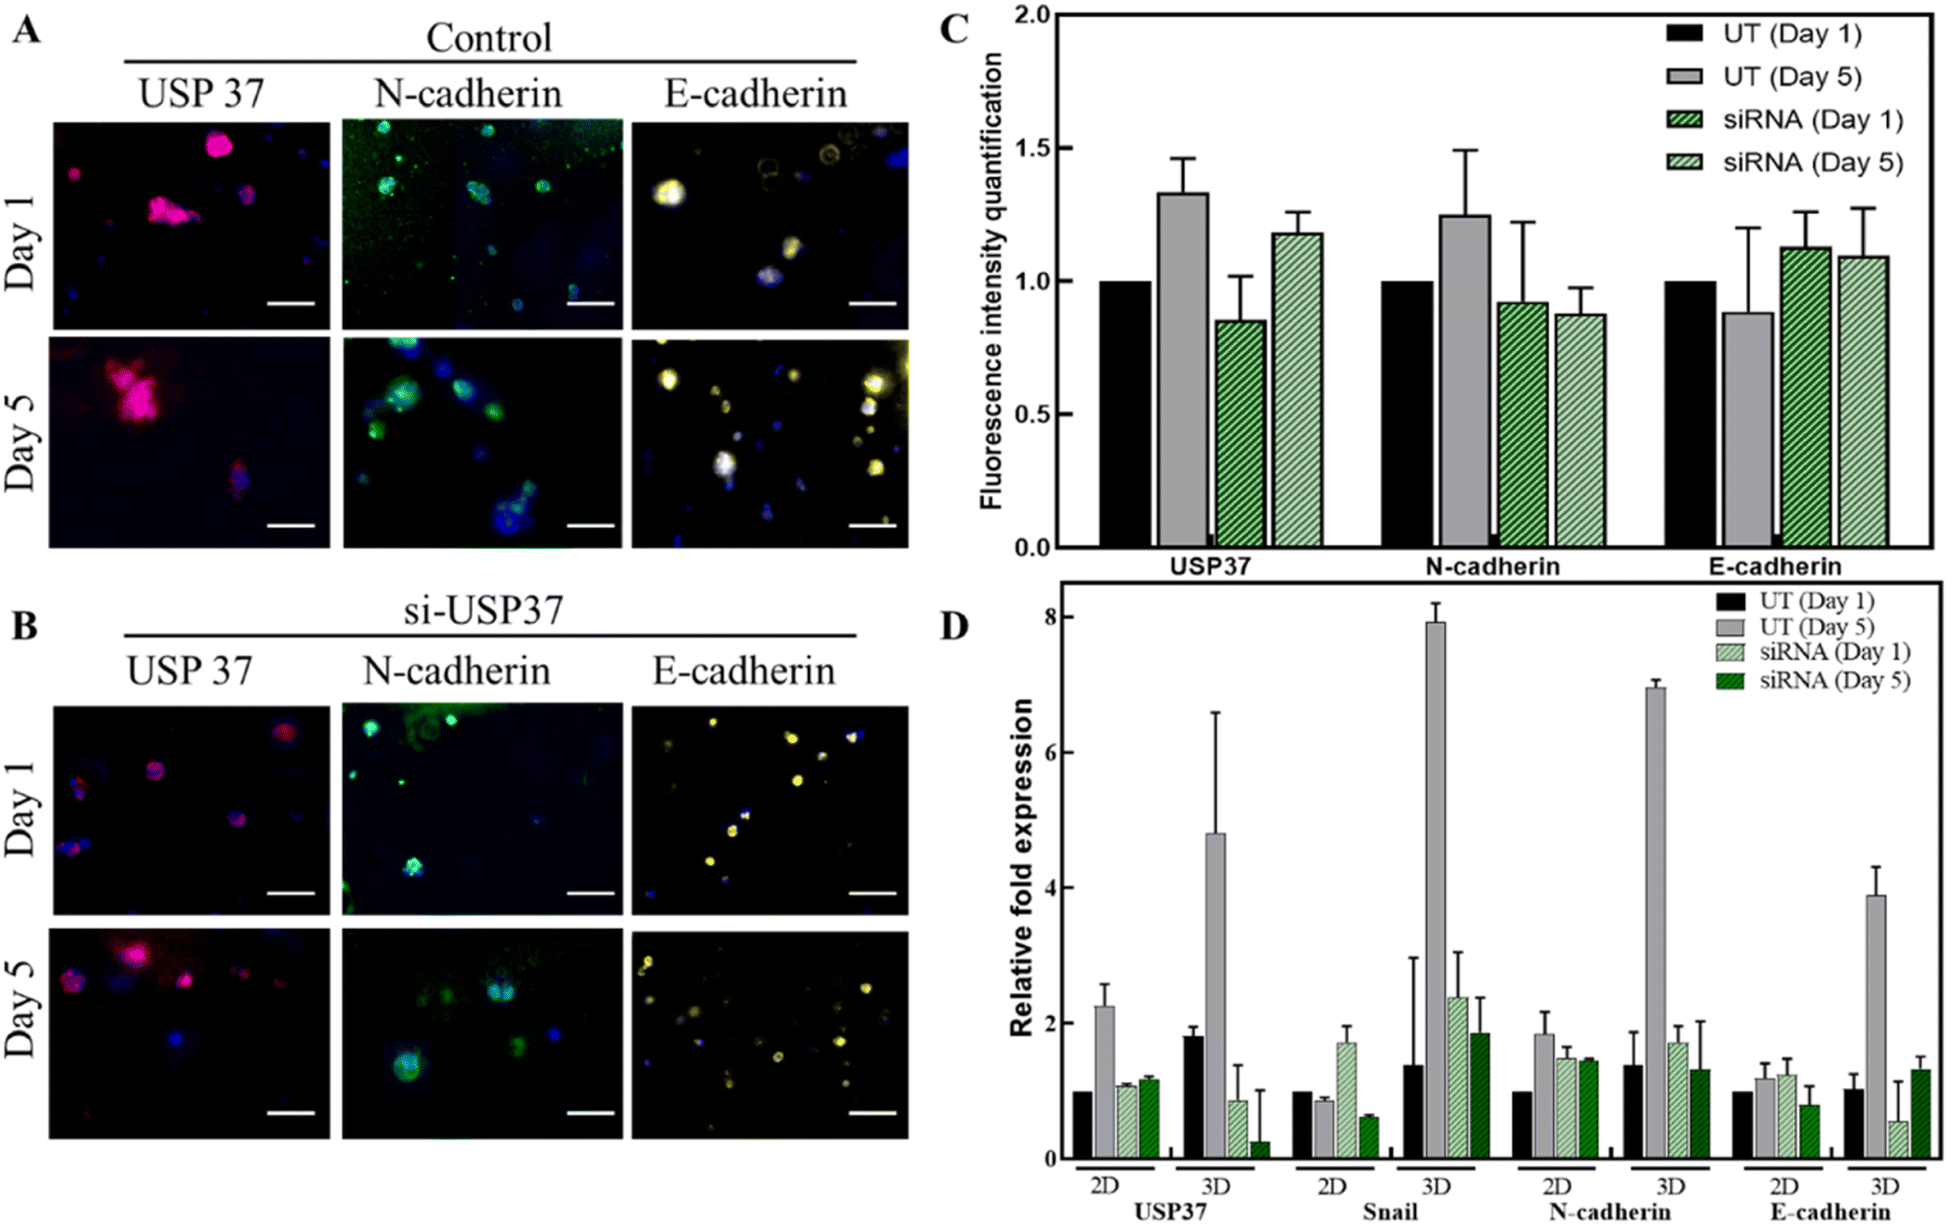 | ||
| Fig. 5 (A and B) Fluorescence micrographs of the cells encapsulated in the 3D microgels observed on day 1 and day 5 for USP37 (red), N-cadherin (green), E-cadherin (yellow) and DAPI (blue). The images were captured at 20× magnification and were pseudo coloured using the ImageJ software. (C) The fluorescence intensities were quantified for each image using the ImageJ software, normalized with respective DAPI and plotted using the GraphPad software. (D) Genetic expression of EMT markers (Snail, E-cadherin and N-cadherin) and USP37 in the ovarian cancer cell line (PA I) in both 2D and 3D platforms. The graphs plotted are an average of 2 biological replicates and 3 technical replicates. Scale bar for fluorescent micrographs: 100 μm. | ||
4. Conclusions
In the present study we explored the function of a novel cancer therapeutic target USP37, in ovarian cancer cell lines using both 2D and indigenously developed microgel based 3D platforms. USP37 has been shown to control the stability of a myriad of oncogenic proteins in different cancers. The majority of work that has been carried out to study the effect of USP37 is in 2D cell culture models, which have their own shortcomings including not mimicking the in vivo conditions. Interestingly, most of the 3D models that are available are not suited for performing studies where unstable transient genetic manipulations are carried out as the long time required to prep the platform makes it practically unfeasible. Addressing this, our study attempts developing and validating a simple micro-fluidic 3D platform that can be created instantly and allows real-time monitoring of cellular growth without any end-point assays. Further, the encapsulated cells can be easily recovered after the study for a complete analysis by other molecular biology cell profiling techniques. The carbon dot based nanosensors allow monitoring of the growth curves simply by recording the fluorescence from the microgels. Thus any effect of depletion of USP37 in ovarian cancer cell growth can be monitored and studied using this indigenously developed 3D cell culture system. Thus, the alginate–gelatin based carbon dot encapsulated 3D platform reported provides a rapid culture model for such studies in comparison to other 3D models available commercially, which requires a prolonged period of growth to test the efficacy of inhibition of any oncoprotein. After establishing the platform for cellular growth monitoring the effects observed were validated by comparing the observations to those obtained from performing the studies in a classical 2D culture platform. It was observed via colony formation assay that inhibition of USP37 indeed decreased the viability of cells. Further exploration of its effect on the migration of the cells by the conventional scratch-wound assay indicated that the inhibition of USP37 decreased the migratory potential of the cells, indicating that indeed in ovarian cancer cells depletion of USP37 leads to reduced migratory potential. Similar to the observations in 2D, in the 3D culture platform too, the transient inhibition of USP37 decreased the proliferation rate of the encapsulated cells; however, the results were more faithfully mimicking the conditions in vivo. We further explored the targets of USP37, such as EMT markers, via gene expression studies. Since the 3D scaffold was crosslinked with alginate, it allowed us to degrade the scaffold easily and retrieve the encapsulated cells for further characterization and analysis. Initial studies have shown that in other cancers USP37 directly regulates the stability of EMT regulating proteins like SNAIL. The gene expression studies revealed that EMT markers are regulated transiently by USP37 due to transient expression of USP37 and more stable depletion of USP37 will lead to further deciphering of downstream EMT signalling in ovarian cancer.Therefore, this study highlights the applicability of this sensitive 3D culture system used to determine the oncogenic potential of USP37 by studying the migratory behaviour of these cells in vivo using this platform. It is envisioned that this system can be further explored for drug screening of potential inhibitors of USP37 and other oncogenes. This will allow the identification of new therapeutic approaches for various cancers.
Conflicts of interest
There are no conflicts of interest to declare.Acknowledgements
We acknowledge financial support from the Indian Institute of Technology Delhi and All India Institute of Medical Sciences for the current study. We are grateful to CRF, IITD for SEM facility and CBME, IITD for RTPCR facility. We acknowledge IRD-IITD for financial support through FIRP-IITD (MI02226) sponsored by MHRD, Govt of India and IRD, IITD. We also thank DBT for providing us the financial support Janaki Ammal National Women Bioscientist Award, 2019 (BT/HRD/NBA-NWB/39/2020–21 (YC-2)) to establish 3D culture system in our lab. MS (AIIMS) was supported by AIIMS IITD grant (AI 34) for this study.References
- H. Sajjad, et al., Cancer models in preclinical research: A chronicle review of advancement in effective cancer research, Anim. Models Exp. Med., 2021, 4(2), 87–103 CrossRef PubMed.
- L. A. Ogilvie, et al., Models of Models: A Translational Route for Cancer Treatment and Drug Development, Front. Oncol., 2017, 7, 219 CrossRef PubMed.
- M. E. Katt, et al., In Vitro Tumor Models: Advantages, Disadvantages, Variables, and Selecting the Right Platform, Front. Bioeng. Biotechnol., 2016, 4, 12 CrossRef PubMed.
- K. V. Kitaeva, et al., Cell Culture Based in vitro Test Systems for Anticancer Drug Screening, Front. Bioeng. Biotechnol., 2020, 8, 322 CrossRef PubMed.
- V. van Duinen, et al., Microfluidic 3D cell culture: from tools to tissue models, Curr. Opin. Biotechnol., 2015, 35, 118–126 CrossRef CAS PubMed.
- X. Xu, M. C. Farach-Carson and X. Jia, Three-dimensional in vitro tumor models for cancer research and drug evaluation, Biotechnol. Adv., 2014, 32(7), 1256–1268 CrossRef CAS PubMed.
- A. Nyga, U. Cheema and M. Loizidou, 3D tumour models: novel in vitro approaches to cancer studies, J. Cell Commun. Signaling, 2011, 5(3), 239–248 CrossRef PubMed.
- F. Barre-Sinoussi and X. Montagutelli, Animal models are essential to biological research: issues and perspectives, Future Sci. OA, 2015, 1(4), FSO63 Search PubMed.
- Y. Imamura, et al., Comparison of 2D- and 3D-culture models as drug-testing platforms in breast cancer, Oncol. Rep., 2015, 33(4), 1837–1843 CrossRef CAS PubMed.
- R. Edmondson, et al., Three-dimensional cell culture systems and their applications in drug discovery and cell-based biosensors, Assay Drug Dev. Technol., 2014, 12(4), 207–218 CrossRef CAS PubMed.
- O. Habanjar, et al., 3D Cell Culture Systems: Tumor Application, Advantages, and Disadvantages, Int. J. Mol. Sci., 2021, 22(22), 12200 CrossRef CAS PubMed.
- M. A. Tutty, D. Movia and A. Prina-Mello, Three-dimensional (3D) liver cell models – a tool for bridging the gap between animal studies and clinical trials when screening liver accumulation and toxicity of nanobiomaterials, Drug Delivery Transl. Res., 2022, 12(9), 2048–2074 CrossRef PubMed.
- B. Pinto, et al., Three-Dimensional Spheroids as In Vitro Preclinical Models for Cancer Research, Pharmaceutics, 2020, 12(12), 1186 CrossRef CAS PubMed.
- C. R. Thoma, et al., 3D cell culture systems modeling tumor growth determinants in cancer target discovery, Adv. Drug Delivery Rev., 2014, 69–70, 29–41 CrossRef CAS PubMed.
- C. L. Chaffer and R. A. Weinberg, A perspective on cancer cell metastasis, Science, 2011, 331(6024), 1559–1564 CrossRef CAS PubMed.
- K. E. Pickup, et al., Expression of Oncogenic Drivers in 3D Cell Culture Depends on Nuclear ATP Synthesis by NUDT5, Cancers, 2019, 11(9), 1337 CrossRef CAS PubMed.
- D. Ribatti, R. Tamma and T. Annese, Epithelial–Mesenchymal Transition in Cancer: A Historical Overview, Transl. Oncol., 2020, 13(6), 100773 CrossRef PubMed.
- J. Callis, The ubiquitination machinery of the ubiquitin system. Arabidopsis Book, 2014, vol. 12, p. e0174 Search PubMed.
- T. Qin, et al., Abnormally elevated USP37 expression in breast cancer stem cells regulates stemness, epithelial–mesenchymal transition and cisplatin sensitivity, J. Exp. Clin. Cancer Res., 2018, 37(1), 287 CrossRef CAS PubMed.
- J. Grillari, R. Grillari-Voglauer and P. Jansen-Durr, Post-translational modification of cellular proteins by ubiquitin and ubiquitin-like molecules: role in cellular senescence and aging, Adv. Exp. Med. Biol., 2010, 694, 172–196 CrossRef CAS PubMed.
- W. L. Jin, X. Y. Mao and G. Z. Qiu, Targeting Deubiquitinating Enzymes in Glioblastoma Multiforme: Expectations and Challenges, Med. Res. Rev., 2017, 37(3), 627–661 CrossRef CAS PubMed.
- R. Chauhan, et al., Ubiquitin-specific peptidase 37: an important cog in the oncogenic machinery of cancerous cells, J. Exp. Clin. Cancer Res., 2021, 40(1), 356 CrossRef CAS PubMed.
- A. Chandra and N. Singh, Cell Microenvironment pH Sensing in 3D Microgels Using Fluorescent Carbon Dots, ACS Biomater. Sci. Eng., 2017, 3(12), 3620–3627 CrossRef CAS PubMed.
- S. De, et al., Alginate based 3D micro-scaffolds mimicking tumor architecture as in vitro cell culture platform, Mater. Sci. Eng., C, 2021, 128, 112344 CrossRef CAS PubMed.
- C. Vaklavas, S. W. Blume and W. E. Grizzle, Translational Dysregulation in Cancer: Molecular Insights and Potential Clinical Applications in Biomarker Development, Front. Oncol., 2017, 7, 158 CrossRef PubMed.
- Y. Qu, et al., Evaluation of MCF10A as a Reliable Model for Normal Human Mammary Epithelial Cells, PLoS One, 2015, 10(7), e0131285 CrossRef PubMed.
- J. Pan, et al., USP37 directly deubiquitinates and stabilizes c-Myc in lung cancer, Oncogene, 2015, 34(30), 3957–3967 CrossRef CAS PubMed.
- J. Cai, et al., USP37 Promotes Lung Cancer Cell Migration by Stabilizing Snail Protein via Deubiquitination, Front. Genet., 2019, 10, 1324 CrossRef CAS PubMed.
Footnotes |
| † Electronic supplementary information (ESI) available. See DOI: https://doi.org/10.1039/d3ra08786g |
| ‡ Shreemoyee De and Ravi Chauhan contributed equally to this work. |
| This journal is © The Royal Society of Chemistry 2024 |