 Open Access Article
Characterization of activated carbon produced from the green algae Spirogyra used as a cost-effective adsorbent for enhanced removal of copper(II): application in industrial wastewater treatment
Zohra Djezzar *a,
Amel Aidiab,
Hanane Rehaliab,
Sbarina Ziadc and
Tarik Othmaned
aLaboratory of LARGHYDE, University of Biskra, P.O. Box 145, Biskra 07000, Algeria. E-mail: zohra.djezzar@univ-biskra.dz; Tel: +213 0660707064
bDepartment of Industrial Chemistry, University of Biskra, P.O. Box 145, Biskra 07000, Algeria
cLaboratory of LARHYSS, University of Biskra, BP 145 RP, Biskra 07000, Algeria
dScientific and Technical Research Center for Arid Zones CRSTRA, University of Biskra, P.O. Box 145, Biskra 07000, Algeria
First published on 9th February 2024
Abstract
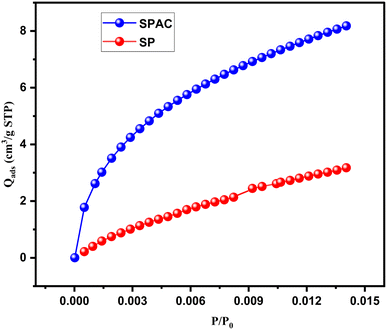
In this study, we prepared porous carbon (SPAC) derived from the green algae Spirogyra (SP), which was activated using natural lemon through pyrolysis at 600 °C for 3 h, and investigated its adsorption ability and performance towards copper ions in an aqueous solution. The physicochemical characteristics of SPAC were evaluated using FTIR, BET, SEM/EDS, XRD and pHPZC analyses and the results were compared with those of the raw algae (SP). The results indicated the presence of rich surface functional groups and that SPAC possessed a highly porous structure that increased the specific surface area by about 1.8 times compared to the SP surface (SBET = 71.087 m2 g−1 and VTotal = 12.019 cm3 g−1). XRD indicated that the main phase of the samples was CaCO3. The pHPZC value of activated carbon was 9.25. After optimizing the effects of operational parameters, the maximum adsorption efficiency of Cu2+ rapidly reached 95.09% after about 20 min of stirring time with an amount of 0.1 g adsorbent and an initial copper concentration of 200 mg L−1 at an optimum pH of around 5.28 and ambient temperature of 25 °C. The pseudo-first-order (PFO) nonlinear model provided a good description of the adsorption kinetics of SPAC. The experimental equilibrium data fit the Sips and Liu models slightly better than other isotherm models. The calculated thermodynamic parameters ΔH°, ΔS°, and ΔG° revealed that the adsorption process of Cu2+ was spontaneous and exothermic. Physisorption was the dominant mechanism for Cu2+ adsorption onto SPAC; SPAC was also evaluated for the adsorption of copper ions present in wastewater from the cable industry. Overall, the findings suggest that the prepared activated carbon can be employed as a cost-effective and promising adsorbent for the removal of toxic Cu2+ from wastewater.
1. Introduction
Water pollution is one of the most serious environmental problems that leads to the scarcity of clean water, given the toxic pollutants resulting from the significant increase in industrial and human activities.1,2 These pollutants can be classified into either organic substances, such as dyes and phenolic compounds, or heavy metal ions,3 including Cu, Pb, Zn, and Cd.In recent years, heavy metals have been considered the major source of water contamination4 and are the most pressing issue because they pose increasing risks to the health of the environment, humans, and other organisms.5,6 Due to their toxicity and non-biodegradable nature, they are highly persistent, are not destroyed over time, and tend to accumulate in water. The presence of various types and amounts of heavy metals in wastewater is increasing with the rapid growth and development of industrialization and human activities7 such as mining; pharmaceutical industries; battery, fertilizer, and pesticide manufacturing; metal plating; plastic and textile industry; and electroplating.8,9 Although heavy metals are essential elements in maintaining metabolism in the human body, only trace amounts are required, since high concentrations that exceed the limits of legislative standards may result in severe poisoning.10,11
According to the World Health Organization, copper (Cu) is one of the most common and toxic heavy metals and is found in wastewater from a variety of industries, including mining waste, electronic and electrical devices and equipment, metal plating, and glass colouring.2 Copper is an essential trace element that is necessary for the survival of living organisms12 and plays a major role in human and animal health and cell function.13 Moreover, it helps in the proper development and functioning of the brain, forming red blood cells, maintaining the nervous system and immune functions, and improving the bones and tissues in the human body.14 However, high concentrations and excessive doses of copper cause accumulation that can lead to many serious health problems including nausea, diarrhea, malfunctioning of the liver, kidney failure, anemia, and central nervous system problems followed by depression,10,15 and even death.13 Therefore, the Health Organization has established 0.5 mg L−1 as the maximum limited permissible level in wastewater in Algeria to avoid inappropriate discharge.
Environmental protection is imperative to conserve water resources.16 For these considerations, it is necessary to look for an effective and specialized method for the removal of copper ions from effluents to reduce their concentration below the maximum allowable safe discharge standards.
To date, several physical, chemical, and biological treatment techniques have been suggested and have attracted the attention of researchers to effectively remove heavy metal ions from wastewater using methods such as electrocoagulation, electrochemical,17 membrane filtration, ion exchange, chemical precipitation,18 solvent extraction, reverse osmosis19 and adsorption. Unfortunately, these methods have certain drawbacks related to low removal efficiency, high costs, reuse difficulties, high-energy requirements, expensive equipment, and low selectivity.13,19 In this context, recent studies have made additional efforts and are focused on novel and low-cost techniques to address copper contamination by taking all of the above into consideration. Adsorption has been reported and is preferred as a convincing and alternative process due to its facility, high efficiency, selectivity, low cost and environmentally friendly nature.3,6
The successful use of the adsorption process in the treatment of wastewater containing heavy metals is widely related to the search for low-cost materials as solid adsorbents with high adsorption efficiency. Over the past decade, porous and functional activated carbon has been considered the most efficient material for copper elimination because of its large surface area. Commercial activated carbon is available but it is expensive and not economically viable,4 prompting a search for cheaper and more efficient alternatives. Recently, a wide variety of raw materials that are abundant in nature have been used to prepare porous materials that have been converted into low-cost activated carbon for copper removal, such as beech wood chips and garden green waste residues,20 palm fiber,21 soy waste,22 peanut shells,6,23 soybean and mustard husks,10 walnut shells,24 waste wood-based panels,15 olive stone,25 pigeon peas hulls,26 apple tree branches,5 lignites,27 waste tea residue,13 eggshells,28 oak fruit shells,29 sea mango shells,30 wolfberry stems31 and empty fruit bunches.32 The adsorption capacity of these adsorbents is high and the research is still focused on looking for low-cost adsorbents that are abundant in nature to improve the efficiency. Accordingly, to fill this gap, and because of its numerous features, considerable attention has been paid to algae plants for wastewater treatment as a cost-effective adsorbent that is environmentally friendly, renewable, readily available year-round, with simple preparation steps and high metal adsorption capacities due to good surface characteristics and diversity of functional groups.8,33 Algae are multicellular aquatic plants that lack true roots, stems and leaves, and grow naturally in wetlands.34 They are generally classified into brown (Phaeophyceae), red (Rhodophyta), and green (Chlorophyta) algae.35 When the green algae “Spirogyra” were highlighted as an adsorbent for removing heavy metal in many previous studies, it was found that the adsorption capacity of the raw algae was not high.2 Therefore, to improve the adsorption capacity and obtain a larger surface area, physical or chemical activation should be performed. On the other hand, there have been few reviewed papers discussing the removal of copper from wastewater using Spirogyra; hence, more studies are needed.
The present work valorises the green algae “Spirogyra” to produce new activated carbon by activation with natural lemon, denoted as “SPAC”, and to assess its adsorption ability to remove Cu(II) ions from aqueous solution as a first step. BET, FTIR, SEM/EDS, XRD and pHPZC analytical techniques were employed for physicochemical characterization of the samples. To optimize the adsorption performance, the influences of the operational parameters of the process, including contact time, adsorbent dosage, initial concentration, initial pH and temperature were investigated. Several kinetic and isotherm models and thermodynamic studies were also comprehensively investigated herein to fit the experimental data. Finally, we evaluated the performance of SPAC as an adsorbent for copper in industrial wastewater from the local cable industry company (ENICAB) of Biskra, Algeria.
2. Materials and methods
2.1. Sampling and sample preparation
The green algae “Spirogyra” was collected from El Oued El Abyadh, M'Chouneche region, on the East of Biskra, located in northeastern Algeria as the raw biomaterial. The green algae was used as an adsorbent to remove copper II ions (Cu2+) from synthetic water. The algae were exhaustively washed several times with tap water followed by distilled deionized water to remove any dirt, colour and soluble materials, and air-dried at room temperature for 2–3 days, followed by drying in an air-blast drying box at 200 °C for 1 h until a constant dry weight was achieved. The biomaterial was then crushed and sieved to obtain a stable and favourable powder size. In the current study, we selected and used only particles in the range of 63–90 μm.2.2. Activated porous carbon preparation
The dried algae biomass (SP) was used as feed for activated carbon preparation by impregnation with a solution consisting of 40% pure volume of natural lemon by dilution with distilled water until 100 mL.Around 10 g of biomass was added to this stock solution and fully mixed under magnetic agitation for 30 min. The mixture was soaked under anaerobic conditions and allowed to stand. After 24 h, the excess solution was decanted and the immersed biomass (SPA) was oven-dried at 105 °C for 24 h, then placed in a porcelain crucible and carbonized at 600 °C (5 °C min−1) for 3 h in a muffle furnace. After cooling to room temperature, the sample was rinsed with distilled water until the filtrate was completely neutralized (pH around 7). The recovered material (SPAC) was again dried at 105 °C (24 h) and stored in a scintillation vial for subsequent usage. The ash rate, which is a measure of carbonization yield (Ash%) was calculated as follows:
 | (1) |
The burn-off result was 3.39%, which indicates that the activated carbon (SPAC) represents a low percentage of mineral substance (Ash).
The humidity ratio (H%) was determined by drying the adsorbent in an oven and is expressed as a percentage as follows:
 | (2) |
The iodine value (mg g−1), which is an indicator of the microporosity of the adsorbent and the surface area available for adsorption, is expressed in terms of the number of centigrams of iodine absorbed per gram of sample as follows:
 | (3) |
2.3. Wastewater
To examine the practical efficiency of SPAC as an adsorbent in removing copper ions, the process was carried out using an industrial wastewater sample from a local company of the cable industry (ENICAB) of Biskra, Algeria, without any addition of metallic reagents, which is responsible for the manufacturing of electrical industrial cables. The three most important parameters for evaluating the quality of this treated wastewater were determined (pH = 8.28, T = 26 °C and the initial concentration of copper ions is 22.42 mg L−1). The results were compared with the Algerian standard for liquid industrial discharges as indicated in the Official Journal of the Algerian Republic (pH between 6.5–8.5, T ≤ 30 °C and the limited Cu concentration is 0.5 mg L−1);36 thus, this value is higher than the maximum permissible value.2.4. Physicochemical characterization methods
In our study, the characterization methods were used to observe the changes that occurred between the raw algae (SP) and activated carbon (SPAC).The functional groups on the surface of the adsorbents were surveyed using FT-IR spectroscopy over the wavenumber range of 400–4000 cm−1 using the KBr pellet technique (Shimadzu IR Affinity). The crystalline structures and compositions of adsorbents were investigated by X-ray diffraction (XRD) using the diffractometer “PANalytical” with Cu Kα radiation (λ = 1.5406 Å) at 30 mA and 40 kV. The scans were acquired over the 2Theta range 2–70° with a scan speed of 2° per minute. The external surface features and morphological and chemical structures of SP and SPAC were examined by scanning electron microscopy images coupled with an energy-dispersive spectroscopy analyzer (SEM-EDS, Tescan Vega 3) to determine surface element contents. Moreover, the Brunauer–Emmett–Teller (BET) method was performed to determine the textural property parameters of samples specific surface area (SBET) and porosity (VTotal) using a CO2 isotherm (ASAP 2420) at 30 °C. The pH at the point of zero charge (the isoelectric point pHpzc) was examined by using the protocol of the pH drift method as reported in a previous related work by (Amina et al., 2022).29 Approximately 0.1 g of each sample was suspended in 50 mL of 0.01 M NaCl that was previously adjusted in the range of 2–12 with either HCl or NaOH solution and then stirred for 24 h at ambient temperature. The final pH (pHf) was measured. The pHpzc was determined graphically by plotting the final solution pH as a function of the initial pH. The pHPZC value is the point at which the initial and final pH values are identical.
2.5. Copper adsorption experiments
In a typical experiment, distilled water was used for the preparation of synthetic copper solutions with anhydrous copper sulfate (CuSO4).As a preliminary adsorption test, the collected product powder was monitored for copper adsorption by evaluating the performance of this activated carbon as an adsorbent in copper removal by testing several parameters affecting and optimizing the process.
In each adsorption experiment, 50 mL of copper solution at a specified concentration was stirred with a predetermined dose of SPAC at a constant speed of 400 rpm on a magnetic stirrer and at room temperature (24 ± 1 °C) without any pH adjustment (an initial pH of the solution of about 5.48), except for experiments studying the influence of pH and temperature.
• The set time interval (10, 20, 30, 40, 50, 60, 90 min) was determined to provide experimental data for adsorption kinetics studies to explore the effect of adsorption time for a copper solution content of 200 mg L−1 in the presence of 0.1 g of SPAC.
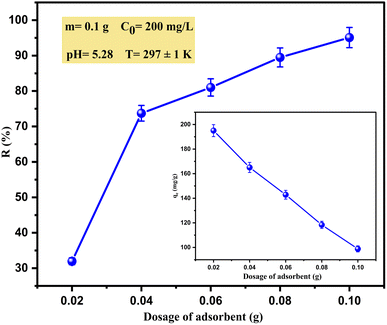
• Different doses of adsorbent (0.02, 0.04, 0.06, 0.08, 0.1 g) were added to the main solution (at 200 mg L−1) to explore the effect of adsorbent dose on the adsorption efficiency.
• The initial content of Cu2+ varied from 200 to 1000 mg L−1 in the presence of 0.1 g of the SPAC.
• The impact of the solution pH on copper adsorption was investigated by adjusting the values from 2 to 12 with the addition of either 0.1 M NaOH or 0.1 M HCl (the pH of the solution was measured using a WTW Inolab model pH 7310 P pH meter).
• Various solutions at different temperatures (15–55 °C) were also prepared to investigate the effect of temperature on the copper adsorption capacity for SPAC.
After equilibrium, the solutions were separated by centrifugation at 3000 rpm for 10 min and then passed through a 0.45 μm filter.
To ensure accuracy, all experiments were conducted twice and the data were reported as mean values in calculations.
The preliminary and final concentrations of Cu2+ were determined by a UV-visible spectrophotometer (HACH DR-6000) at 810 nm.
The copper(II) removal efficiency (R%) and adsorption capacity at equilibrium (qe, mg g−1) and at any time t (qt, mg g−1) were evaluated using the following expressions:
 | (4) |
 | (5) |
 | (6) |
2.6. Analysis of adsorption data and modelling
All equations used in this study to investigate the adsorption mechanism of copper ions on the tested SPAC, and related to the nonlinear kinetic and isotherm models, are summarized in Table 1. Some common kinetic tests were conducted using the pseudo-first-order (PFO), pseudo-second-order (PSO), Elovich, Avrami and Weber–Morris intra-particle diffusion models. The isotherm data were adjusted to describe the adsorption behaviour of the SPAC by using the Langmuir, Freundlich, Redlich–Peterson, Sips and Liu models. These were performed using the complementary functions in the Origin 2018 software.| Model | Equation | Plot | Parameters |
|---|---|---|---|
| PFO | qt = qe(1 − e−K1t) (7) | - qt and qe (mg g−1): the adsorbed amount of copper at any time “t” and at the end, respectively | Fig. 8 |
| PSO |  (8) (8) |
- K1 (min−1), K2 (g (min−1 mg−1)), kAV (min−1): the constants of PFO, PSO and Avrami, respectively | Fig. 8 |
| Elovich |  (9) (9) |
- α (mg (g−1 min−1)): the sorption rate constant associated with the covered surface of chemisorption in the Elovich kinetic model | Fig. 8 |
| - β (mg g−1): the desorption constant associated with the reaction energy of chemisorption in the Elovich kinetic model | |||
| Avrami |  (10) (10) |
- nAV: the Avrami constant exponent (dimensionless) | Fig. 8 |
| Intraparticle diffusion |  (11) (11) |
- Kint (mg (g−1 min−1/2)): rate constant of the Weber–Morris model | Fig. 8 |
| -C (mg g−1): constant depending on the boundary layer thickness in the Weber–Morris kinetic model | |||
| Langmuir |  (12) (12) |
- Qmax (mg g−1): maximum adsorption capacity of Langmuir | Fig. 9 |
| - KL (L mg−1): the constants of Langmuir | |||
| Freundlich |  (13) (13) |
- KF [(mg g−1)/(mg L−1)1/n]: the constants of Freundlich | Fig. 9 |
| - nF: dimensionless Freundlich parameter of intensity | |||
| Redlich–Peterson |  (14) (14) |
-KRP (L g−1) and aRP (mg L−1)−g: the Redlich–Peterson equilibrium constants, respectively | Fig. 9 |
| - g: the dimensionless Redlich–Peterson exponent should be ≤1 | |||
| Sips |  (15) (15) |
- qs and Qmax (mg g−1): the maximum adsorption capacity of Sips and Liu isotherms, respectively | Fig. 9 |
| Liu |  (16) (16) |
- KS and Kg (L mg−1): the Sips and Liu equilibrium constants, respectively | Fig. 9 |
| - ns and nL: the dimensionless Sips and Liu exponents, respectively |
The most appropriate model for the experimental data of the adsorption process was identified by determining the values of three statistics parameters, namely, the coefficient of correlation (R2), standard deviation (SD) and chi-square (χ2) as follows:
 | (17) |
 | (18) |
 | (19) |
The values of R2, SD and χ2 could be used to judge whether the model is the best fit for describing the data, when either the values of R2 are high or SD and χ2 values are small.
2.7. Thermodynamic study
The thermodynamic parameters used include the standard Gibbs free energy (ΔG°, J mol−1), enthalpy (ΔH°, J mol−1), and entropy (ΔS°, J (mol−1 K−1)) relevant to the practical application of the adsorption process of Cu(II) (type, spontaneity, feasibility and mechanism).1 In the present research, these thermodynamic parameters were estimated by using the following well-known eqn (20)–(23) below:
 | (20) |
ΔG°= −RT![[thin space (1/6-em)]](https://www.rsc.org/images/entities/char_2009.gif) ln ln![[thin space (1/6-em)]](https://www.rsc.org/images/entities/char_2009.gif) KC KC
| (21) |
| ΔG° = ΔH° − TΔS° | (22) |
The ΔH° and ΔS° values were obtained from the slope and intercept of the ln![[thin space (1/6-em)]](https://www.rsc.org/images/entities/char_2009.gif) KC linear plot as a function of (1/T) according to the van't Hoff relation, which is given by the relationship between thermodynamic parameters (eqn (23)):
KC linear plot as a function of (1/T) according to the van't Hoff relation, which is given by the relationship between thermodynamic parameters (eqn (23)):
 | (23) |
Regarding the determination of these thermodynamic parameters, the data were obtained from the study of the effect of temperature on the adsorption of copper ions onto the SPAC.
3. Results and discussion
3.1. Characterization of SP and SPAC
Table 2 below shows some characteristics of the raw algae and activated carbon used in this study.| Characteristic | SP | SPAC |
|---|---|---|
| Ash rate (%) | — | 3.39 |
| Humidity (%) | 6.68 | 0.1383 |
| Iodine number (mg g−1) | 2017.71 | 1142.1 |
| pHpzc | 7.5 | 9.25 |
| Parameters | Prepared materials | |
|---|---|---|
| SP | SPAC | |
| Surface area (m2 g−1) | 40.9873 | 71.087 |
| Total pore volume (Vtotal (cm3 g−1)) | 6.93 | 12.019 |
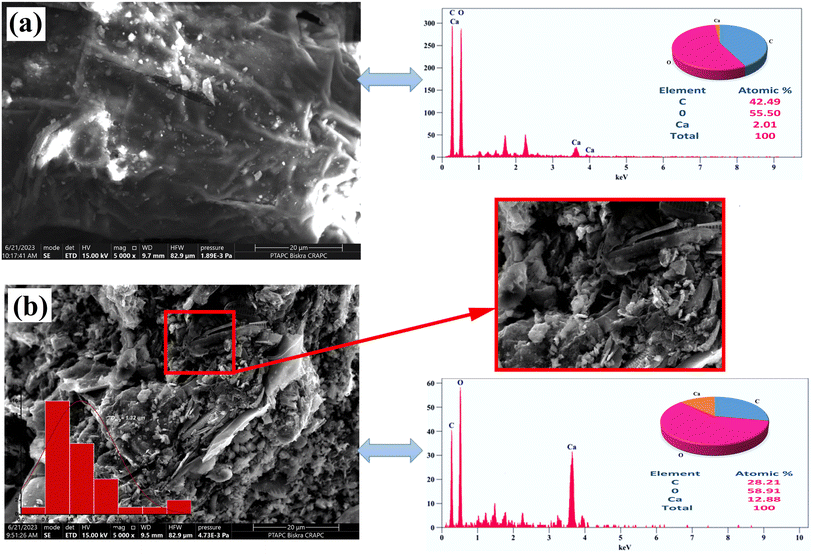
The external surface of raw algae is relatively smooth, obscure and undefined, except for a few cracks, without any obvious porous structure, which contributes to the low BET surface area. The activated carbon showed substantial changes on the surface; it was rough, hollow, and heterogeneous, full of cavities and irregular agglomerates of uneven particles to form a dispersed composite, with a highly porous structure with pores of different shapes and sizes, consistent with the increase in surface area. The average pore diameter was determined from the distribution of pore sizes on the SPAC surface, using the ImageJ program, to be approximately 1.32 μm, confirming the presence of micropores (as illustrated in Fig. 2b). This pore structure was created by the evaporation of the activating agent, lemon, during pyrolysis, leaving cavities that may be advantageous for the efficient adsorption of copper ions Cu2+.
The EDS spectrum (Fig. 2) indicated the presence of C, O and Ca, which were attributed to algae, with their atomic percentage decreasing as follows: O (55.50%), C (42.49%) and Ca (2.01%). However, the spectrum of SPAC showed that the atom percent of O and Ca increased to 58.91% and 12.88%, respectively, while carbon decreased to 28.21% as compared to SP. It appears that C and O are the main components of both materials; oxygen is dominant, indicating more oxygen-containing functional groups. Similar results were reported by other studies (Zeyneb et al., 2022; Mohamed et al., 2020; Narsica et al., 2022).11,14,33
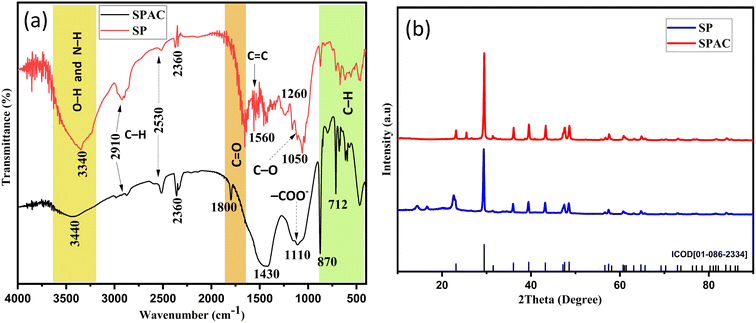
![[double bond, length as m-dash]](https://www.rsc.org/images/entities/char_e001.gif) O.2 Moreover, this last peak also appeared at 1800 cm−1 due to the functional group in carboxylic acids, anhydrides, ketones and esters.29 Some peaks (small and sharp) were observed for SP between 1600–1000 cm−1, assigned to the C
O.2 Moreover, this last peak also appeared at 1800 cm−1 due to the functional group in carboxylic acids, anhydrides, ketones and esters.29 Some peaks (small and sharp) were observed for SP between 1600–1000 cm−1, assigned to the C![[double bond, length as m-dash]](https://www.rsc.org/images/entities/char_e001.gif) C aromatic ring stretching vibration (1560 cm−1),9,45 the ionic carboxylic groups –COO− (1420 cm−1),14,33,46 C–O stretching (1260–1050 cm−1)9 and C–O–C groups.6 In the SPAC spectrum, two peaks at 1430 and 1110 cm−1 were attributed to (–COO−) and C–N aliphatic amines,37 respectively.
C aromatic ring stretching vibration (1560 cm−1),9,45 the ionic carboxylic groups –COO− (1420 cm−1),14,33,46 C–O stretching (1260–1050 cm−1)9 and C–O–C groups.6 In the SPAC spectrum, two peaks at 1430 and 1110 cm−1 were attributed to (–COO−) and C–N aliphatic amines,37 respectively.
Absorption peaks below 1000 cm−1 confirmed the presence of aromatic bending vibrations C–H (870 cm−1) and alkyl halides (712 and 660 cm−1).14
3.2. Parameters affecting the adsorption of copper on activated carbon
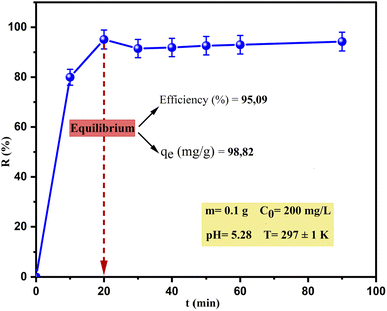
Cu(II) adsorption occurred rapidly during the first 20 min when the maximum removal reached about 95.09%; thereafter, the removal rate decreased relatively slowly by about 3–10% until equilibrium with negligible difference at 20 min and 90 min (95.09% and 94.25% respectively). Therefore, one of the advantages of this material (SPAC) is its short adsorption time, which makes it effective and economical at industrial scales.
Previous studies indicated that the adsorption of heavy metals took place in two steps. In the beginning stage, the rate of adsorption was extremely fast because the adsorbate molecules adhered to the outside surface of the adsorbent due to the high availability of active binding sites for adsorption. As the adsorption of the metal ion progressed, the surface sites on the adsorbent decreased and there was subsequent slow removal, which might be due to the transport of metal ions from the exterior to the farther and deeper interior sites of the adsorbent particles.14,48,49 This rate slowdown resulted in the equilibrium of adsorption, consistent with the results of this study.
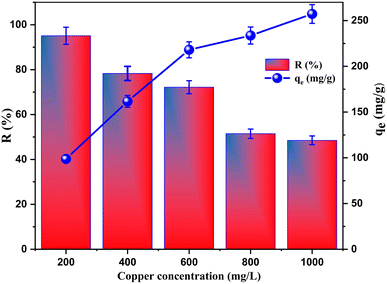 | ||
| Fig. 6 The impact of the initial Cu2+ concentration on the removal efficiency and adsorption capacity of copper. | ||
Consequently, as can be seen from the results, the adsorption process in this study was favoured at the concentration of 200 mg L−1 of copper ions.
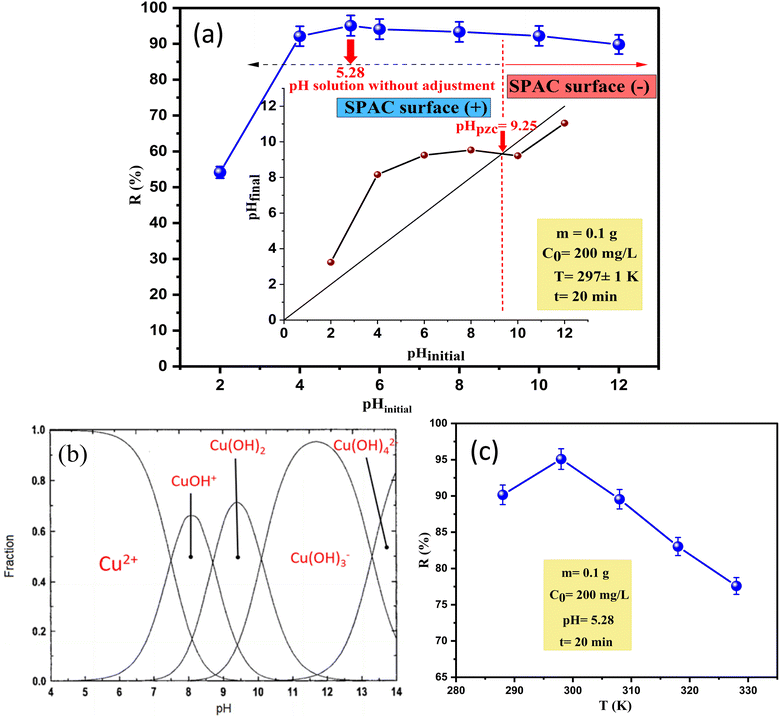 | ||
| Fig. 7 (a) pHPZC of SPAC and the influence of the pH of the solution; (b) copper speciation in solution as a function of pH. (c) The effect of temperature on the removal efficiency of copper. | ||
This phenomenon can be explained as follows: the poor adsorption efficiency at pH 2 (R = 54.15%) is due to the excessive concentration of H+ ions, which causes competition for surface active sites with copper ions in solution. As the pH increases, this competition decreases as the H+ ion density is reduced and more Cu(II) can react with SPAC, which is associated with a maximum increase in percentage removal R = 95.09%. Accordingly, the highest removal occurred at pH 5.28, which was the original pH of the copper solution (without adjustment). Based on the distribution diagram (Fig. 7b) of copper species in solution as a function of the pH obtained, the dominance of Cu2+ ions in solution appears between pH 2 and 6. At pH > 6, more OH− ions might exist in the solution, leading to the hydrolysis of copper ions and the appearance of the hydroxide complexes such as CuOH+, Cu3(OH)42+, Cu(OH)3− and Cu(OH)42−, after which the Cu(OH)2 precipitates may be generated as solids. Thus, the removal of copper ions from the aqueous solution gradually decreased to 89.84%.
The adsorption of Cu(II) can also be understood based on the pHpzc by investigating the charge property of the SPAC surface and determining the optimal pH for adsorption.52 As shown in (Fig. 7a), the pHpzc value was around 9.25, where the surface revealed zero net electrical charge. Consequently, at a pH < 9.25 the surface of SPAC was more positively charged and enhanced the adsorption of anions and could result in electrostatic repulsion between the adsorbent and the metal ions.15 At a pH above 9.25, more surface groups of SPAC are negatively charged, which may lead to improved copper adsorption capacity via electrostatic attraction. However, this did not increase the Cu2+ removal and SPAC still adsorbed Cu2+ ions well when the pH of solution was lower than pHpzc. The results suggest that the electrostatic attraction was not the only mechanism and that other forces stronger than these forces were present in the adsorption process.6 For the above reasons, the optimum pH of the solution was selected at around 5.28 for further adsorption experiments in this work.
3.3. Modelling of adsorption kinetics
To examine and elucidate the adsorption kinetics process of Cu2+ onto SPAC, the nonlinear pseudo-first order, pseudo-second order, Elovich, and Avrami models, and the linear Weber–Morris model (intraparticle diffusion) were fitted to experimental data as shown in (Fig. 8a), while the associated kinetic parameters are reported in Table 4.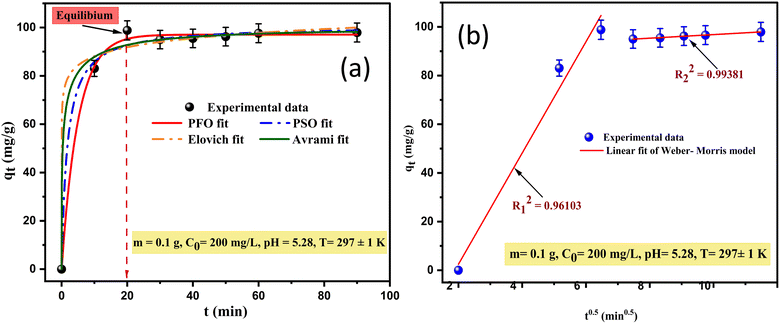 | ||
| Fig. 8 Experimental data and (a) the non-linear fitting of the PFO, PSO, Elovich, and Avrami models; (b) the linear fitting of the Weber–Morris model for copper adsorption onto SPAC. | ||
| Model | Parameters | Unit | Value |
|---|---|---|---|
| PFO | qexp | mg g−1 | 98.82 |
| qe(PFO) | mg g−1 | 97.069 | |
| K1 | min−1 | 0.1998 | |
| t0.5 | min | 3.469 | |
| adj-R2 | — | 0.997 | |
| SD | — | 8.391 | |
| Red-χ2 | — | 3.425 | |
| PSO | qe(PSO) | mg g−1 | 100.729 |
| K2 | g (min−1 mg−1) | 0.0057 | |
| adj-R2 | — | 0.993 | |
| SD | — | 19.783 | |
| Red-χ2 | — | 8.076 | |
| Elovich | α | mg (g−1 min−1) | 6.415 × 10⁶ |
| β | mg g−1 | 0.1848 | |
| adj-R2 | — | 0.988 | |
| Red-χ2 | — | 13.227 | |
| Avrami | qe(AV) | mg g−1 | 96.857 |
| KAV | min−1 | 0.122 | |
| nAV | — | 3.325 | |
| adj-R2 | — | 0.991 | |
| SD | — | 26.877 | |
| Red-χ2 | — | 10.017 | |
| Intraparticle diffusion | First stage | ||
| C1 | mg g−1 | 2.4379 | |
| Kint | mg (g−1 min−0.5) | 22.867 | |
| adj-R2 | — | 0.961 | |
| Second stage | |||
| C2 | mg g−1 | 90.949 | |
| Kint | mg (g−1 min−0.5) | 0.736 | |
| adj-R2 | — | 0.993 | |
A comparison of all obtained statistical kinetic coefficients revealed that our kinetics data fit well with the pseudo-first-order model as compared to the other applied models. Therefore, it is the best approach to describing the adsorption process of Cu ions by SPAC, based on the highest values of adj-R2 = 0.997 and the lowest red-χ2 and SD (3.425 and 10, respectively). The fitting order was as follows: PFO model > PSO model > Avrami model > Elovich model.
Likewise, the adsorption capacity value as predicted by the PFO model (qcal = 97.069 mg g−1) was approximately very close and consistent with the experimentally calculated values (qexp = 98.82 mg g−1). Based on this model, the process was physisorption, which was a significant rate-limiting step for the adsorption of copper ions. The half-life (t0.5), which is the time taken to reach 50% of the total adsorption capacity, was 3.469 min, proving once again that the adsorption process was very fast.
The Weber and Morris intraparticle diffusion (IPD) models were evaluated in this study to further understand the adsorption rate control steps, and to determine the method of transport of Cu ions from solution into the SPAC pores. The curve-fitting plots obtained for qt versus t1/2 are shown in (Fig. 8b), which occurred in multi-linearity by two segments presenting two different stages. The first line deviates from the origin, indicating that intraparticle transport is not the exclusive rate-limiting step and more than one adsorption process may occur in the kinetic adsorption system of copper as electrostatic interactions, ion exchange, and so on. According to (Soufiane et al., 2022),25 the existence of various surface functional groups (Fig. 3a) allows for facile interaction with metal ions. The corresponding parameters for these stages (Kint, C and adj-R2) are listed in Table 4. The high Kint value of the first stage (Kint = 22.867 mg (g−1 min−0.5)) demonstrates that the adsorption rate is very fast at the beginning of the process. The second stage is a slower process, nearly reaching equilibrium, which describes the gradual diffusion of metal ions into the pores of the SPAC, resulting in a lower Kint value (Kint = 0.736 mg (g−1 min−0.5)). The significant difference between the rate constants is due to the availability of active sites on the adsorbent surface to interact with the ions of the solution. However, it should be noted that the highest value of the boundary layer thickness constant (C = 90.949 mg g−1) indicates a certain degree of boundary layer effect.
It can be concluded that despite the satisfactory values of adj-R2 (R2 = 0.961–0.993), the IPD model is not appropriate for describing the copper ion removal onto SPAC because it is lower than the value of the pseudo-first-order model (R2 = 0.997).
3.4. Adsorption isotherms
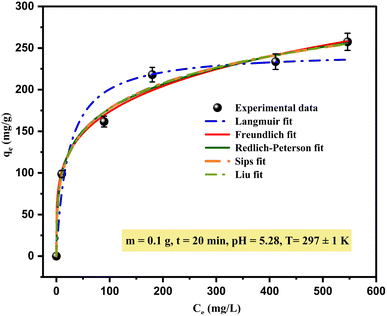
Generally, the adsorption isotherm has a significant impact on the feasibility of the adsorption process by describing the relationship and the interaction between adsorbate ions (liquid phase, e.g., heavy metal) and adsorbent (solid phase) at a constant temperature under the given conditions. Thus, there is the need to explain the nature of adsorption sites and the number of layers that can form on them to predict the most suitable isotherm equation model that accurately describes the process. In this study, fitting adsorption isotherms data is described by the non-linear equations of the Langmuir, Freundlich, Redlich–Peterson, Sips and Liu models.The Langmuir isotherm model puts forward the assumption that all unoccupied adsorption sites are equivalent to the interactions between the adsorbent and adsorbate; this means that once an adsorbed molecule holds a site, no further adsorption can occur at the same site, so it describes a monolayer-type process on homogeneous surfaces. For the Freundlich model, the basic assumptions dictate that the adsorption is a multilayer phenomenon that occurs on heterogeneous surfaces and can only be applied in low to medium concentrations.
To get a detailed and clear understanding of the adsorption process by comparing these equilibrium models considered, the curves are illustrated in (Fig. 9), and their parameters and coefficients are given in Table 5. The inserts in (Fig. 9) show that the adsorption isotherm can be classified as the typical “L” shape. According to the computed parameters (Table 5), the best-fit isotherm model was selected based on the highest values of correlation coefficients (adj-R2) and the lowest red-χ2, which showed that the Langmuir model created the poorest fit with experimental data (adj-R2 = 0.943); other models are more suitable for describing the adsorption of copper ions using SPAC.
| Model | Parameters | Unit | Value |
|---|---|---|---|
| Langmuir | Qmax | mg g−1 | 245.86 |
| KL | L mg−1 | 0.044 | |
| adj-R2 | — | 0.943 | |
| Red-χ2 | — | 538.96 | |
| Freundlich | KF | (mg g−1) | 59.248 |
| nF | (mg L−1)1/n | 4.2918 | |
| adj-R2 | — | 0.96 | |
| Red-χ2 | — | 161.73 | |
| Redlich–Peterson | KRP | L g−1 | 67.573 |
| aRP | (mg L−1)−g | 0.955 | |
| g | — | 0.795 | |
| adj-R2 | — | 0.984 | |
| Red-χ2 | — | 147.95 | |
| Sips | qS | mg g−1 | 546.35 |
| KS | L mg−1 | 0.095 | |
| nS | — | 2.84 | |
| adj-R2 | — | 0.985 | |
| Red-χ2 | — | 139.36 | |
| Liu | Qmax | mg g−1 | 545.94 |
| Kg | L mg−1 | 0.0012 | |
| nL | — | 0.35 | |
| adj-R2 | — | 0.985 | |
| Red-χ2 | — | 139.36 |
The Sips and Liu models show a good fit, similar to the experimental data (highest adj-R2 = 0.985) but more satisfactory; the adsorption of Cu(II) by SPAC reasonably follows both isotherms but it should be noted that the fitting follows the order of Sips and Liu (adj-R2 = 0.985) > Redlich–Peterson (adj-R2 = 0.984) > Freundlich (adj-R2 = 0.96) > Langmuir (adj-R2 = 0.943). It is implied that the adsorption process of copper ions mainly tends to adsorb onto SPAC heterogeneously and involves a multilayer mechanism. For this reason, the results show a good fit with hybrid models (Sips, Liu, and Redlich–Peterson) that combine the Langmuir and Freundlich models.54 Cu2+ adsorption by the Sips model revealed that the process occurred at a low concentration of copper ions.55
Based on the Freundlich isotherm model, KF ((mg g−1)/(mg L−1)1/n) is the empirical constant that describes the capacity or energy required for Cu2+ adsorption on SPAC, which was (KF = 59.248 (mg g−1)/(mg L−1)1/n). The coefficient nF is known as the rate related to adsorption intensity and refers to the Freundlich heterogeneity factor; it is often used to evaluate the appropriateness and favourability of the adsorption process. According to some researchers,2,56 if the value of nF > 1, the adsorption process is physical, chemical if nF < 1, and linear if nF = 1; a high value indicates that the adsorption intensity is satisfactory and favourable over the entire concentration range studied. The ratio 1/nF provides information regarding surface heterogeneity. Thus, whenever 1/nF < 1 (closer to zero), the mechanism is readily executed and there is greater heterogeneity. In this study, as can be seen from Table 5, the value of nF was 4.2918 and 1/nF = 0.233 < 1, indicating that the physical process is favourable and easy to conduct.
3.5. Adsorption thermodynamics studies
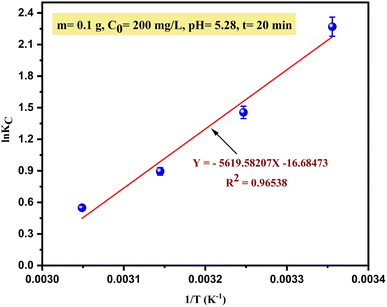
To understand and evaluate the adsorption behaviour of Cu2+ on SPAC (process spontaneous or not), the thermodynamic parameters were calculated from the slope and intercepts of the van't Hoff plot (Fig. 10) and are summarized in Table 6.| T (°K) | KC | van't Hoff equation | ΔG° (kJ mol−1) | ΔH° (kJ mol−1) | ΔS° (J (kmol−1)) |
|---|---|---|---|---|---|
| 298 | 9.67577 | Y = −5619.58207 × −16.68473 | −5623.15891 | −46721.2053 | −138.71682 |
| 308 | 4.28594 | −3726.70634 | |||
| 318 | 2.44699 | R2 = 0.96538 | −2365.87396 | ||
| 328 | 1.73123 | −1496.66085 |
Based on the results, the square correlation coefficient R2 was about 0.96538, which indicates that the data of this study fit well with the van't Hoff equation. The negative values of free energy change (ΔG°) under all the studied temperature ranges exhibited that the adsorption process was thermodynamically favourable, feasible and occurred spontaneously. Additionally, as the temperature was decreased, the ΔG° value became more negative, which further indicated that the adsorption of Cu2+ on SPAC is more favourable at lower temperatures (298 K). On the other hand, the negative ΔH° value (−46721.2053 kJ mol−1) suggested that the adsorption process was exothermic. This behaviour was confirmed by a decrease in the thermodynamic equilibrium constant (KC) with increasing temperature.
According to the approach supported by Tran et al., 2016 (ref. 57) to determine whether the type of adsorption process is physical or chemical, since ΔH° < 10 kJ mol−1 (low adsorption enthalpy value), the main mechanism was physisorption with relatively weak interaction between Cu(II) and the SPAC's surface (i.e., van der Waals force). Meanwhile, the negative ΔS° value explains the decreased randomness at the adsorbent/solution interface during the adsorption process when the temperature increases.
These results are somewhat similar to the research of Ouasfi et al., 2019,17 which showed that the thermodynamic parameters during the adsorption of ketoprofen and aspirin molecules on porous carbon from the Laminaria digitata algae activated using NaOH (PCLD) were negative for all studied temperatures.
3.6. The applicability of SPAC in industrial wastewater treatment
Most of the industrial processes generate wastewater containing more than one heavy metal ion. For this reason, our study tested the adsorptive activity of SPAC and removal efficiency toward Cu2+ in wastewater collected from ENICAB of Biskra, Algeria under identical circumstances. According to the above experiments, 50 mL of wastewater solution with 0.1 g SPAC was shaken at 25 °C for 20 min.Table 7 summarizes the results of the physical and chemical parameters of the wastewater sample before and after the treatment process. The pH of this industrial wastewater was 8.28 with a mean concentration of Cu ions of 22.42 mg L−1 and a conductivity of more than 1000 μS cm−1 (2780 μS cm−1), indicating that this wastewater was highly mineralized. This effluent included high levels of calcium (308 mg L−1), magnesium (84 mg L−1), chloride (489 mg L−1) and sodium (240 mg L−1). As expected, monitoring Cu2+ adsorption revealed an appreciably high removal efficiency (R = 96.30%), which may be due to the porous structure of the prepared SPAC. Hence, the prepared SPAC is suitable and has great potential for removing copper ions from wastewater discharged from electric cable industries.
| Parameter | Initial wastewater | Treated wastewater | Maximum allowable for industrial liquid discharges36 |
|---|---|---|---|
| Temperature (C°) | 26 | 26 | ≤30 |
| pH | 8.28 | 8.34 | 6.5–8.5 |
| Conductivity (μS cm−1) | 2780 | 1695 | — |
| TH (mg L−1) | 1050 | 850 | — |
| Calcium (mg L−1) | 308 | 140 | — |
| Magnesium (mg L−1) | 84 | 96 | — |
| Chlorides (mg L−1) | 489 | 380 | — |
| Ammonium NH4+ (mg L−1) | 2.48 | 1.72 | — |
| TAC (mg L−1) | 186 | 174 | — |
| Nitrate NO3− (mg L−1) | 0.136 | 0.150 | — |
| Nitrite NO2− (mg L−1) | 25.5 | 19.3 | — |
| Sodium Na+ (mg L−1) | 240 | 192 | — |
| Phosphate PO43− (mg L−1) | 1.379 | 1.668 | — |
| Copper Cu2+ (mg L−1) | 22.42 | 0.83 | 0.5 |
4. Conclusions
Herein, we have explored the possibility of Cu2+ adsorption from aqueous solution using SPAC-activated carbon obtained from the green algae “Spirogyra” as an inexpensive and earth-available material through activation and pyrolysis methods, which has proven successful and efficient in the reduction of this pollutant under various conditions. Based on the results obtained in synthetic solutions of distilled water, relevant insights can be drawn.FTIR, BET, XRD and SEM/EDS techniques were used to fully characterize and confirm the structural properties of SP and SPAC. The results of the XRD analysis indicated that the crystalline structure of the samples was very close to CaCO3, while the BET method showed a greater specific surface area for SPAC (SBET = 71.087 m2 g−1) as compared to SP (SBET = 40.9873 m2 g−1). After investigating the effects of various operational parameters on adsorption efficiency, the adsorbent showed a maximum Cu2+ removal of about 95.09% under optimum conditions. The high pHPZC of SPAC at around 9.25 confirmed that electrostatic attractions were not the only mechanism and that other forces stronger than these forces were present in the adsorption process. The nonlinearity of the kinetic studies supported the fitting of the experimental data of Cu2+ adsorption with the pseudo-first-order (PFO) model. The isothermal adsorption of Cu2+ by SPAC fits the Sips and Liu models reasonably well, demonstrating that the mechanistic analysis mainly tends toward heterogeneous adsorption and involves a multilayer coverage of the SPAC surface. Moreover, thermodynamic parameters (ΔG°, ΔH°, and ΔS°) revealed that the adsorption process was feasible, spontaneous, and exothermic. It was confirmed that the adsorption process was exclusively dominated by the physisorption mechanism. Finally, the applicability of SPAC as an adsorbent to remove copper ions present in wastewater from a local cable industry company resulted in satisfactory treatment performance.
In summary, based on the above, this work highlights a new method for future research to valorise the green algae “Spirogyra” as a low-cost, eco-friendly, readily available alternative material in a simple approach to producing activated carbon for application in wastewater treatment processes; it can be also used in many environmental applications.
Conflicts of interest
All authors declare that they have no conflict of interest.References
- E. A. Abdel-Galil, H. E. Rizk and A. Z. Mostafa, Desalin. Water Treat., 2015, 57, 17880–17891 CrossRef.
- Z. Al-Qodah, M. Al-Shannag, A. Amro, E. Assirey, M. Bob, K. Bani-Melhem and M. Alkasrawi, Turk. J. Chem., 2017, 41, 190–208 CrossRef CAS.
- M. Elkady, H. Shokry and H. Hamad, Materials, 2020, 13, 2498 CrossRef CAS PubMed.
- L. Niazi, A. Lashanizadegan and H. Sharififard, J. Cleaner Prod., 2018, 185, 554–561 CrossRef CAS.
- S. Zhao, N. Ta and X. Wang, Energies, 2020, 13, 3498 CrossRef CAS.
- D. B. Salem, A. Ouakouak, F. Touahra, N. Hamdi, A. S. Eltaweil, A. Syed, R. Boopathy and H. N. Tran, Bioresour. Technol., 2023, 383, 129225 CrossRef CAS PubMed.
- N. A. A. Qasem, R. H. Mohammed and D. U. Lawal, npj Clean Water, 2021, 4, 36 CrossRef CAS.
- F. Almomani and R. R. Bhosale, Sci. Total Environ., 2021, 755, 142654 CrossRef CAS PubMed.
- S. Mandal, J. Calderon, S. B. Marpu, M. A. Omary and S. Q. Shi, J. Contam. Hydrol., 2021, 243, 103869 CrossRef CAS PubMed.
- D. Humelnicu, M. Ignat and F. Doroftei, Environ. Monit. Assess., 2015, 187, 1–11 CrossRef CAS PubMed.
- Z. Naserifard, M. Niad and S. Zarei, Inorg. Chem. Commun., 2022, 139, 109404 CrossRef CAS.
- M. C. Benalia, L. Youcef, M. G. Bouaziz, S. Achour and H. Menasra, Arabian J. Sci. Eng., 2021, 47, 5587–5599 CrossRef.
- N. Jean Claude, L. Shanshan, J. Khan, W. Yifeng, H. dongxu and L. Xiangru, Sci. Rep., 2022, 12, 3519 CrossRef CAS PubMed.
- M. Tavana, H. Pahlavanzadeh and M. J. Zarei, J. Environ. Chem. Eng., 2020, 8, 104272 CrossRef CAS.
- W.-S. Chen, Y.-C. Chen and C.-H. Lee, Processes, 2022, 10, 150 CrossRef CAS.
- M. K. Uddin and A. Nasar, Sci. Rep., 2020, 10, 7983 CrossRef CAS PubMed.
- N. Ouasfi, M. Zbair, S. Bouzikri, Z. Anfar, M. Bensitel, H. A. Ahsaine, E. Sabbar and L. Khamliche, RSC Adv., 2019, 9, 9792–9808 RSC.
- I.-S. Bădescu, A.-A. Ciobanu, D. Bulgariu and L. Bulgariu, TechHub Journal, 2021, 1, 6–14 Search PubMed.
- P. Kumar, A. K. Patel, R. R. Singhania, C.-W. Chen, R. G. Saratale and C.-D. Dong, Bioresour. Technol., 2023, 388, 129654 CrossRef CAS PubMed.
- V. Frišták, M. Pipíška, J. Lesný, G. Soja, W. Friesl-Hanl and A. Packová, Environ. Monit. Assess., 2014, 187, 1–16 Search PubMed.
- L. Zhou, J. Zhou, X. Zhou, J. Guo and Y. Liu, Sep. Sci. Technol., 2018, 53, 2860–2869 CrossRef CAS.
- L. Bulgariu and D. Bulgariu, J. Cleaner Prod., 2018, 197, 875–885 CrossRef CAS.
- L. Zheng, Y. Gao, J. Du, W. Zhang, Y. Huang, Q. Zhao, L. Duan, Y. Liu, R. Naidu and X. Pan, Processes, 2021, 9, 1829 CrossRef CAS.
- R. Najam and S. M. A. Andrabi, Desalin. Water Treat., 2016, 57, 27363–27373 CrossRef CAS.
- S. Youcef, S. Guergazi and L. Youcef, Modeling Earth Systems and Environment, 2022, vol. 8, pp. 3927–3940 Search PubMed.
- D. K. Venkata Ramana and K. Min, Desalin. Water Treat., 2015, 57, 6967–6980 CrossRef.
- J. Di, Z. Ruan, S. Zhang, Y. Dong, S. Fu, H. Li and G. Jiang, Sci. Rep., 2022, 12, 1394 CrossRef CAS PubMed.
- M.-Y. Chou, T.-A. Lee, Y.-S. Lin, S.-Y. Hsu, M.-F. Wang, P.-H. Li, P.-H. Huang, W.-C. Lu and J.-H. Ho, Sci. Rep., 2023, 13, 437 CrossRef CAS PubMed.
- A. Soudani, L. Youcef, L. Bulgariu, S. Youcef, K. Toumi and N. Soudani, Chem. Eng. Res. Des., 2022, 188, 972–987 CrossRef CAS.
- L. Sellaoui, F. E. Soetaredjo, S. Ismadji, É. C. Lima, G. L. Dotto, A. B. Lamine and A. Erto, Phys. Chem. Chem. Phys., 2017, 19, 25927–25937 RSC.
- Y. Xu, J. Lan, B. Wang, C. Bo, J. Ou and B. Gong, RSC Adv., 2023, 13, 21199–21210 RSC.
- M. A. Issa, Z. Z. Abidin, M. Y. Pudza and H. Zentou, RSC Adv., 2020, 10, 14979–14990 RSC.
- N. Smječanin, D. Bužo, E. Mašić, M. Nuhanović, J. Sulejmanović, O. Azhar and F. Sher, Mater. Chem. Phys., 2022, 283, 125998 CrossRef.
- P. Bhatt, G. Bhandari, R. F. Turco, Z. Aminikhoei, K. Bhatt and H. Simsek, Environ. Pollut., 2022, 309, 119688 CrossRef CAS PubMed.
- F. G. Torres and G. E. De-la-Torre, Sustainable Energy Technol. Assess., 2022, 53, 102658 CrossRef.
- Executive Decree No. 06-141 defining the limits of industrial liquid effluent discharge values, Official Journal of the Algerian Republic No. 26, 19 April 2006 Search PubMed.
- J. Zhu, H. Zhang, R. Chen, Q. Liu, J. Liu, J. Yu, R. Li, M. Zhang and J. Wang, J. Colloid Interface Sci., 2019, 543, 192–200 CrossRef CAS PubMed.
- Q. Zaib and D. Kyung, Sci. Rep., 2022, 12, 8845 CrossRef CAS PubMed.
- S. Wang, J.-H. Kwak, M. S. Islam, M. A. Naeth, M. Gamal El-Din and S. X. Chang, Sci. Total Environ., 2020, 712, 136538 CrossRef CAS PubMed.
- X. Chen, G. Chen, L. Chen, Y. Chen, J. Lehmann, M. B. McBride and A. G. Hay, Bioresour. Technol., 2011, 102, 8877–8884 CrossRef CAS PubMed.
- M. Turk Sekulic, N. Boskovic, A. Slavkovic, J. Garunovic, S. Kolakovic and S. Pap, Process Saf. Environ. Prot., 2019, 125, 50–63 CrossRef CAS.
- K. Hamida, H. Rehali, H. Menasra, F. Bekiri and A. Aidi, React. Kinet., Mech. Catal., 2024, 1–19 Search PubMed.
- A. Aidi, H. Rehali and D. Barkat, J. Chem. Technol. Metall., 2023, 58, 897–905 CrossRef CAS.
- H. Rehali, Tob. Regul. Sci., 2023, 929–949 Search PubMed.
- H.-O. Chahinez, O. Abdelkader, Y. Leila and H. N. Tran, Environ. Technol. Innovation, 2020, 19, 100872 CrossRef.
- N. Rouahna, D. B. Salem, I. Bouchareb, A. Nouioua, A. Ouakouak, A. Fadel, N. Hamdi and R. Boopathy, Water, Air, Soil Pollut., 2023, 234, 324 CrossRef CAS.
- R. Baby, B. Saifullah and M. Z. Hussein, Sci. Rep., 2019, 9, 18955 CrossRef CAS PubMed.
- R. H. Crist, K. Oberholser, N. Shank and M. Nguyen, Environ. Sci. Technol., 1981, 15, 1212–1217 CrossRef CAS.
- Z. A. Jamiu, T. A. Saleh and S. A. Ali, RSC Adv., 2015, 5, 42222–42232 RSC.
- I. Hilbrandt, V. Lehmann, F. Zietzschmann, A. S. Ruhl and M. Jekel, RSC Adv., 2019, 9, 23642–23651 RSC.
- L. Morales-Barrera, C. M. Flores-Ortiz and E. Cristiani-Urbina, Processes, 2020, 8, 1089 CrossRef CAS.
- A. Naima, F. Ammar, O. Abdelkader, C. Rachid, H. Lynda, A. Syafiuddin and R. Boopathy, Bioresour. Technol., 2022, 347, 126685 CrossRef CAS PubMed.
- R. Pelalak, Z. Heidari, S. M. Khatami, T. A. Kurniawan, A. Marjani and S. Shirazian, Arabian J. Chem., 2021, 14, 102991 CrossRef CAS.
- J. Rojas, D. Suarez, A. Moreno, J. Silva-Agredo and R. A. Torres-Palma, Appl. Sci., 2019, 9, 5337 CrossRef CAS.
- D. Mohan, H. Kumar, A. Sarswat, M. Alexandre-Franco and C. U. Pittman, Chem. Eng. J., 2014, 236, 513–528 CrossRef CAS.
- A. C. Martins, O. Pezoti, A. L. Cazetta, K. C. Bedin, D. A. S. Yamazaki, G. F. G. Bandoch, T. Asefa, J. V. Visentainer and V. C. Almeida, Chem. Eng. J., 2015, 260, 291–299 CrossRef CAS.
- H. N. Tran, S.-J. You and H.-P. Chao, J. Environ. Chem. Eng., 2016, 4, 2671–2682 CrossRef CAS.
| This journal is © The Royal Society of Chemistry 2024 |

