 Open Access Article
Optimization and pathway study on destruction of the spent extraction solvent in supercritical water
Ye Li ab,
Qiang Qina,
Zhizhi Zhangab and
Shuai Wang*a
aShanghai Institute of Applied Physics, Chinese Academy of Sciences, Shanghai 201800, China. E-mail: wangshuai@sinap.ac.cn
bUniversity of Chinese Academy of Sciences, Beijing 100049, China
First published on 9th February 2024
Abstract
Sustainable management of spent extraction solvents (SES) is paramount in the nuclear industry. This study delves into the optimization and oxidation pathways of treating these solvents using supercritical water oxidation (SCWO). Response surface methodology (RSM) has been employed to optimize key operating variables, that is, temperature, residence time and oxidant concentration, producing a highly accurate quadratic polynomial model. The results showed that the total organic carbon (TOC) removal could reach up to 99.25% under 549 °C, 67.7 s and with an oxidation coefficient of 274.3%. Product analysis of the effluent via GC-MS/FTIR/GC revealed the pivotal role of ketones and aldehydes as major intermediates. This study proposes potential chemical pathways for the destruction of these solvents, providing invaluable insights for process intensification. In conclusion, this study underscores the potential of SCWO as an efficient and sustainable solution for disposing of SES in the nuclear industry.
Introduction
With the development of the nuclear fuel industry, the sustained expansion and accumulation of large volumes of radioactive organic waste liquids has become an inevitable challenge that must be addressed.1 SES is the main source among the current radioactive organic waste liquids, which are typically categorized as low to medium-level radioactive organic waste liquids.2 SES mainly consists of kerosene, tributyl phosphate (TBP) and its irradiation products, nitric acid, and a small amount of radionuclides. Due to its complex composition, radioactive nature and high concentration of organic constituents, clean and efficient treatment of SES is challenging.1,3Incineration is currently the only commercialized treatment method worldwide.4,5 Although incineration effectively diminishes waste volume and achieves high treatment efficiency, the construction cost of incineration facilities is high, and the incineration temperature typically exceeds 1000 °C, leading to equipment corrosion6 and the simultaneous generation of secondary pollutants (such as NOX, SOX and dioxins, etc.). These factors have collectively led to a low public acceptance of incineration.7 Therefore, it is a necessity to develop new technologies for efficient and safe waste disposal, including emulsification, absorption, wet oxidation, and supercritical water oxidation (SCWO).8,9 Among these methods, the efficiency of SCWO in treating organic waste has been effectively demonstrated.10,11 Supercritical water (SCW) has been increasingly important as an eco-friendly reaction medium that promotes the oxidation of organic compounds.12,13 Under supercritical conditions (>374 °C, >22.1 MPa), water exhibits properties such as low hydrogen bond density, low dielectric constant, and low phase interface tension.14 Under SCWO, complex substances can rapidly degrade into smaller molecules (such as CO2, N2 and H2)15 in a homogeneous medium without generating secondary waste. Therefore, SCWO has been applied in widespread applications and researches in industrial and municipal wastewaters.16,17
In recent years, researchers have conducted comprehensive investigations on SCWO treatment of radioactive organic waste. Xu et al.18 investigated the optimization of the waste anion exchange resin from the nuclear industry in SCW. Under optimized conditions, the removal rates of the COD and TN could reach up to 99.91% and 36.02%, respectively. Wang et al.19 investigated the optimization of the conditions for TBP in SCWO, examined the effect of reaction conditions on the liquid and gaseous products, and SCWO experiments with spent extraction solvent simulants were conducted, in which the TOC removal of spent extraction solvent simulants was more than 99.7% under the optimal conditions. Kosari et al.20 investigated the kinetic modeling of the oxidation of TBP by SCW with and without catalysts, and the use of Fe2O3 catalysts in the experiments greatly improved the TOC removal efficiency. Qin et al.2 conducted a study on the use of ionic oxidant performance in the oxidation of TBP by SCW, and the results showed that the addition of a very small amount of oxidant could effectively enhance the oxidation capacity of SCWO. The experimental results of Golmohammadi et al.21 showed that tri-n-butyl phosphate (TNBP) could achieve 99% TOC removal under optimal conditions and could convert TNBP into by-product that did not induce any cytotoxicity. To further understand the reaction process, the researchers revealed the oxidation mechanism of SCW. For model compounds, Chen et al.22 selected amoxicillin as the representative antibiotic in wastewater, and the detailed mechanisms of amoxicillin decomposition in SCW are studied by ReaxFF reactive molecular dynamics (MD) simulation. Hu et al.23 analyzed the potential reaction pathways of o-chloroaniline based on the intermediate products, and proposed three possible reaction pathways for o-chloroaniline to generate o-chlorophenol, catechol, and phenylamino groups. For complex mixtures, Wang et al.24 performed experiments using mixed ion exchange resins in SCWG under differing conditions, analyzed intermediate products, and discussed the reaction pathways. Although significant progress has been made in the research of SCWO, there still lacks a systematic analysis of the degradation process of complex mixtures.
In this work, SES consisting of kerosene, TBP, dibutyl phosphate (DBP), and nitric acid was used as model compounds. The optimization and pathway study on destruction of the SES in SCWO has been conducted. Firstly, RSM was used to investigate the effects of interactions among different reaction conditions (temperature, reaction time, oxidation coefficient) on the TOC removal of SES in SCWO. Secondly, the intermediates were identified and the potential reaction pathways of SES in SCWO were proposed to analyze their evolution patterns.
Experimental section
Materials
TBP (AR, 98.5%), hydrogen peroxide (H2O2, AR, 30%, w/w), nitric acid (HNO3, AR, purity of 65–68%), DBP (AR, 97%), CH2Cl2 (AR, 99.5%), Na2SO4 (AR, 99%) were purchased from Sinopharm Chemical Reagent Co. (China). The sample of kerosene was collected from China National Nuclear Industry Corporation 404. Deionized water was prepared using a Milli-Q ultrapure water purification system with a 0.22 μm filter.Apparatus and procedure
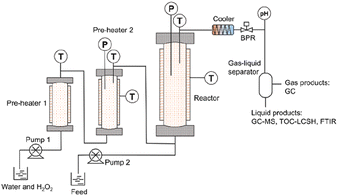
The SCWO-1000 system was constructed based on the system had been used in the previous studies.25,26Fig. 1 shows the SCWO-1000 system that was employed in this study. The reaction system mainly included one tank reactor (1000 mL, Inconel 625) and two preheaters (200 mL and 250 mL, Inconel 625). The maximum operating temperature and pressure of the equipment were 600 °C and 28.4 MPa, respectively. Before the start of each SCWO experiment, deionized water was pumped into reactor, and the temperature was gradually increased using the PID meter (proportional integral derivative). When the internal temperature exceeded 100 °C, the pressure should be slowly increased to the expected value. Deionized water and a hydrogen peroxide solution were jointly pumped into the preheaters. Then, the feedstock was pumped directly into the tank reactor. After the exothermic SCWO reaction, the temperature and pressure were gradually adjusted to ambient temperature and pressure.
Analysis methods
TOC in liquid products was analyzed with a TOC analyzer (Shimadzu TOC-L CSH, Japan). The three samples were measured, and the average was used to calculate TOC removal.The liquid effluent was extracted using CH2Cl2 and the sample was dried with Na2SO4 before taking the supernatant for testing. The Fourier transform infrared spectra (FTIR) of the reaction solution was measured by the Thermo Scientific Nicolet iS5 FTIR spectrometer. The main ingredients of spent extraction solvent and liquid effluent were analyzed by a gas chromatography/mass spectrometry (GC7890A/MS5975C, Agilent, USA) with a HP-5MS capillary column (30 m × 0.25 mm I.D., 0.25 μm film thickness). Helium (1 mL min−1) was used as carrier gas. The temperature setting of the oven was as follows: isothermal at 50 °C for 5 min, ramped up to 100 °C at 5 °C min−1, and ramped up to 300 °C at 10 °C min−1, and held for 10 min. The working voltage of the MS ion source (EI) was 70 eV, and its working temperature was 230 °C. 150 °C was used as the operating temperature of the MS quadrupole.
The gas composition was determined by a gas chromatograph (Agilent GC 7890A, Agilent Technologies, Inc. USA). The program of the GC was as follows: a thermal conductivity detector (TCD) and a G3591-80013 Q packed column (helium was employed as the carrier gas at a flow rate of 40 mL min−1); flame ionization detector (FID) and a G3591-80013 Q packed column (N2 was employed as the carrier gas at a flow rate of 40 mL min−1). The column, TCD, and FID temperatures were maintained at 50, 250, and 300 °C, respectively.
The TOC removal of the liquid effluent was calculated using eqn (1):
 | (1) |
The oxidation coefficient (α, %) is calculated using eqn (2):
 | (2) |
The reaction time (t, s) refers to the residence time in the reactor, and it is defined in eqn (3):
 | (3) |
Experimental model design
Based on the central composite design (CCD) principle, RSM was applied to design the experimental scheme for SCWO of spent extraction solvent. Design Expert software version 13 (Stat-Ease, Inc., Minneapolis, MN, USA) was used for the design. Response surface design is an advanced technique, which can be used to optimize the response variable, identify linear and interactive effects between independent factors and the response value, as well as determine the level at which to optimize the response.28,29 This approach is used to select the optimal operating conditions that meet the requirements. By using the Response Surface Design technique, the number of experiments can be reduced, which significantly lowers the time, material, and labor costs.30For the design of response surface scheme, it is necessary to identify the main significant factors and their ranges through single-factor experiments. In single-factor experiments, temperature (T), reaction time (t) and oxidation coefficient (α) were selected to examine the effect of SCWO on the removal of TOC from spent extraction solvents. Next, the central selection points of the main significant factors were determined. To investigate the effects of the main significant factors, a three-factor, five-level CCD was used. The interaction between these significant factors can be intuitively determined, and the optimal reaction conditions can be obtained using a high-precision quadratic regression equation.31 The experimental design included 20 experiments: 6 axial points, 8 fractional points and 6 points replicate at the center.
A quadratic polynomial model was used for model fitting and the correlation was determined based on the obtained experimental results:
| Y = β0 + ∑βiXi + ∑βiiXi2 + ∑βijXiXj + ε | (4) |
Finally, the reliability of the response surface model was assessed by analyzing R2 (coefficient of determination) and Radj2 (adjusted value). Analysis of variance (ANOVA) at the 95% confidence level (p-value < 0.05) was used to evaluate the significance of each factor and to examine the adequacy of the fitted model. To obtain the optimal conditions, the model parameters were obtained based on the experimental data; afterwards, the optimal conditions were estimated based on the model.
Results and discussion
Based on our previous work,32 the reaction pressure and feed concentration were set to 24 MPa and 2% (V/V), respectively.Single-factor experiment
This stage of the experiment examined the impacts of factors, including temperature (T), reaction time (t), and oxidation coefficient (α), on TOC removal. The purpose of the study was to determine the range of significant factors.Effect of temperature
The TOC removal of SES was significantly affected by the temperature, at reaction time of 60 s, and oxidation coefficient of 200% as shown in Fig. 2(a). The TOC removal increases sharply with increasing the temperature in all experiments. At 450 °C, the effluent's TOC concentration was as high as 3632 ppm (mg L−1), and the TOC removal was only 71.27%. When the temperature was increased from 450 °C to 560 °C, TOC removal of 97.07% and an effluent TOC concentration of 369.9 ppm were achieved. Therefore, increasing the temperature can rapidly enhance the TOC removal of organic matter. Therefore, the temperature range of 470–550 °C could be a reasonable selection for the response surface experiments, and 510 °C is selected as the center point.Effect of reaction time
The effect of reaction time on the TOC removal of the SCWO process at temperature of 500 °C, and oxidation coefficient of 200% is shown in Fig. 2(b). As can be seen, the TOC removal is positively correlated with the increase of reaction time. In the range of 30 to 75 s, the TOC removal increased rapidly, and most of the organic compounds were significantly degraded. The TOC removal increment slowed down significantly after 75 s, and it was only increased by 1.5% from 75 s to 90 s. Here, the results indicate that the reaction time ranged from 30 to 90 s was reasonable, and reaction time of 60 s was selected as the response surface center design point.Effect of oxidation coefficient
The variation tendencies of TOC and TOC removal versus oxidation coefficient at reaction time of 60 s and 500 °C are shown in Fig. 2(c). In the range of 100–200%, the TOC removal increased rapidly with the increase of oxidation coefficient. While in the range of 200–300%, the promotion of TOC removal by oxidation coefficient was limited, and the maximum value of 89.4% was reached at the oxidation coefficient of 300%. It indicates that at lower oxygen concentrations, the presence of O2 greatly improves the conversion rate of organic matter. In addition, we found that at low oxidation coefficient, insoluble char appeared in the effluent. Yu33 also found that if the reaction conditions are not appropriate, hard-to-degrade substances such as char will be produced, which will seriously affect the efficiency of organic matter degradation. In order to reduce the production of char, 100% to 300% was selected as the range of oxidation coefficients for the response surface experiments, with 200% as the center point.So, in this study, temperature range of 470–550 °C, reaction time range of 30–90 s and oxidation coefficient range of 100–300% were selected as the parameter range for RSM optimization experiments to examine the effect of SCWO on the removal of TOC from spent extraction solvents.
Response surface optimization analysis and validation
| Factors | Symbols | Range and levels of independent factors | ||||
|---|---|---|---|---|---|---|
| −2 | −1 | 0 | 1 | 2 | ||
| Temperature (°C) | T | 470 | 490 | 510 | 530 | 550 |
| Reaction time (s) | t | 30 | 45 | 60 | 75 | 90 |
| Oxidation coefficient (%) | α | 100% | 150% | 200% | 250% | 300% |
The experiments were performed according to experimental design. The complete experimental design matrix, including the actual and predicted values for the response are shown in Table 2.
| Run | Variables | Responses | |||
|---|---|---|---|---|---|
| T (°C) | t (s) | α (%) | TOC removal (%) | ||
| Experimental | Predicted | ||||
| 1 | 510 | 60 | 200 | 91.15 | 91.34 |
| 2 | 470 | 60 | 200 | 80.51 | 80.43 |
| 3 | 530 | 45 | 250 | 91.54 | 91.69 |
| 4 | 550 | 60 | 200 | 96.07 | 96.16 |
| 5 | 530 | 75 | 150 | 92.44 | 93.36 |
| 6 | 510 | 60 | 200 | 92.34 | 91.34 |
| 7 | 510 | 60 | 200 | 91.05 | 91.34 |
| 8 | 530 | 45 | 150 | 88.92 | 87.65 |
| 9 | 490 | 45 | 250 | 85.37 | 84.44 |
| 10 | 490 | 75 | 150 | 85.04 | 84.88 |
| 11 | 510 | 60 | 200 | 90.89 | 91.34 |
| 12 | 510 | 60 | 300 | 92.4 | 92.16 |
| 13 | 510 | 60 | 200 | 91.65 | 91.34 |
| 14 | 510 | 60 | 200 | 90.94 | 91.34 |
| 15 | 490 | 75 | 250 | 86.69 | 87.94 |
| 16 | 510 | 60 | 100 | 84.79 | 85.05 |
| 17 | 510 | 90 | 200 | 93.71 | 92.7 |
| 18 | 530 | 75 | 250 | 99.37 | 99.37 |
| 19 | 490 | 45 | 150 | 83.37 | 83.35 |
| 20 | 510 | 30 | 200 | 82.46 | 83.49 |
The predicted response values were determined based on a quadratic polynomial, and fitted to the actual values. The modified regression model for TOC removal was written as in eqn (5).
| TOC removal = −353.78426 + 1.77870T − 1.32221t − 0.270764α + 0.003483Tt + 0.000738Tα + 0.000660Tα − 0.001901T2 − 0.003607t2 − 0.000274α2 | (5) |
ANOVA was used to verify the reliability of the model. Table 3 shows the ANOVA of the quadratic polynomial model. A model p-value of less than 0.05 indicates that the model terms are stable and significant and a p-value of less than 0.0001 indicates that the model term is highly significant. Accordingly, it can be seen that the model is highly significant, which verifies the accuracy of the model response and can be used for subsequent analysis and optimization using this approximate model. The value of the R2 indicated that the model was able to fit at least 98.00%. It can also be seen that these factors are very significant factors in the experimental design. In contrast, based on the magnitude of the F-value, it can be concluded that the oxidation coefficient has less significant effect than the two factors and the temperature is determined as the most significant factor.
| Source | Sum of squares | Degree of freedom | Mean square | F-value | p-Value |
|---|---|---|---|---|---|
| Model | 427.90 | 9 | 47.54 | 54.40 | <0.0001 |
| T | 247.43 | 1 | 247.43 | 283.11 | <0.0001 |
| t | 84.82 | 1 | 84.82 | 97.05 | <0.0001 |
| α | 50.48 | 1 | 50.48 | 57.76 | <0.0001 |
| Tt | 8.74 | 1 | 8.74 | 10.00 | 0.0101 |
| Tα | 4.35 | 1 | 4.35 | 4.98 | 0.0497 |
| tα | 1.96 | 1 | 1.96 | 2.24 | 0.1651 |
| T2 | 14.53 | 1 | 14.53 | 16.63 | 0.0022 |
| t2 | 16.56 | 1 | 16.56 | 18.94 | 0.0014 |
| α2 | 11.76 | 1 | 11.76 | 13.46 | 0.0043 |
| Residual | 8.74 | 10 | 0.8740 | ||
| Lack of fit | 7.116 | 5 | 1.43 | 4.54 | 0.0613 |
| Pure error | 1.58 | 5 | 0.3157 | ||
| Cor total | 436.64 | 19 | |||
| R2 = 0.9800, adjusted R2 = 0.9620 | |||||
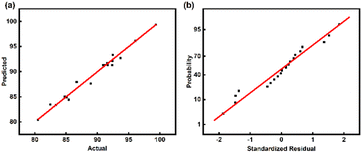
To better compare the actual data with those predicted by the model, comparison of the actual data with the results predicted by the model is shown in Fig. 3(a), and the data points are distributed on a straight line, showing a good linear correlation between the actual and predicted values. Fig. 3(b) shows that the points follow a linear regularity, which means that the error terms are normally distributed. Therefore, the proposed model is credible.
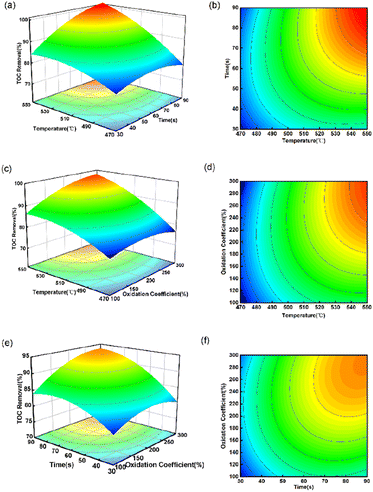
Fig. 4 shows that TOC removal significantly increased with rising temperature and time in all experiments, indicating that their interaction has a substantial impact on the oxidation reaction of spent extraction solvent in SCW. This result is in agreement with the results obtained from ANOVA (Table 3), where Tt was found to be highly significant due to its very low p-value. On the one hand, increasing the temperature has the benefit to increasing the number of ·OH radicals, thereby enhancing the collision with organic matter and leading to an increase in TOC removal.11 On the other hand, it is also possible that high temperature increases the number of activated molecules and the frequency of collisions between organic matter and oxygen, thus promoting organic decomposition.34 Fig. 4(a) and (b) show the interaction of temperature and reaction time on the TOC removal at oxidation coefficient of 200%. When the quantity of oxidant remains consistent, TOC removal rises with higher temperature and longer reaction time. When the temperature increased from 470 to 550 °C, and the reaction time went up from 30 s to 90 s, the TOC removal rose from 76.48 to 99.06%. It tends to increase rapidly at first, and then gradually rises. This phenomenon can be explained based on the free radical reaction mechanism. With an increase in the residence time, more ·OH can be produced, leading to an increased contact time between ·OH and organic matter. But with the progression of the reaction, a significant decrease in the concentration of both oxidant and organic matter was observed, resulting in a slowed conversion of organic matter.35 Havva36 studied the SCWO of polycyclic aromatic hydrocarbons (PAHs) in landfill leachate, and the results showed that The COD removal efficiency increased from 68% to 78% when the residence time was increased from 5 min to 15 min at 300 °C. At the same time, the addition of oxidant would also promote the degradation of organic matter. H2O2 is widely used as a source of free radicals,37 since higher TOC removal can be achieved in the presence of H2O2. As can be seen in Fig. 4(e) and (f), oxidation coefficient had a relatively weak impact on the TOC removal than the reaction time. When the TOC removal exceeded a certain value, a continuous increase in reaction time and oxidation coefficient did not have a significant effect on the TOC removal. This may be due to the fact that the ·OH decomposed by H2O2 in the reaction system is close to saturation, and temperature is the main rate-limiting factor at this time.
One of the main purposes of using RSM is to determine the optimal operating conditions for a system.38 The optimal process parameters are 548.8 °C, 67.7 s and coefficient of 274.3%, resulting in a predicted value of approximately 100%. However, considering the operability of the experiment, the temperature was set to 549 °C. As shown in Table 4, to verify the consistency between the predicted and experimental values, three parallel experiments were conducted under the optimal process parameters and the average TOC removal was 99.25%. The difference between the experimental and predicted values is less than 1%, which indicates the reliability of the regression model's predictions.
| Process parameters | Temperature (°C) | Reaction time (s) | α (%) | TOC removal (%) |
|---|---|---|---|---|
| Values | 549 | 67.7 | 274.3 | 99.25 |
Reaction pathway for SCWO of SES
It was found that kerosene consists mainly of straight-chain alkanes and cycloalkanes,39 including 2-methyldecane, 4-methylundecane, 5-methyltetradecane, dodecane, ethylcyclohexane, cyclotridecane, and so on.
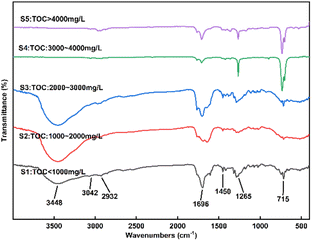
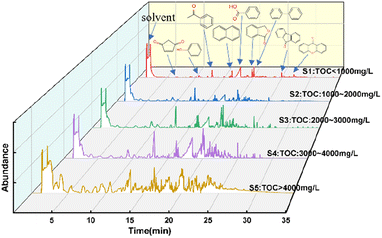
The liquid effluent samples were classified into five categories according to their TOC content: sample 1 (S1): TOC < 1000 mg L−1, S2: 1000–2000 mg L−1, S3: 2000–3000 mg L−1, S4: 3000–4000 mg L−1, S5: >4000 mg L−1. Fig. 5 and 6 show FTIR spectra and GC-MS of liquid products with different samples.
It's worth noting that the pH of samples 1, 2 and 3 was approximately 3.0, indicating a higher acidity level. In Fig. 5, the infrared characteristic peaks of the reaction products following SCWO of the SES showed that the broad absorption peaks of samples 1, 2 and 3 were prominently visible at 3448 cm−1, indicating the stretching vibration of O–H, and at 1696 cm−1, indicating the stretching vibration of C![[double bond, length as m-dash]](https://www.rsc.org/images/entities/char_e001.gif) O. Therefore, these samples contained the functional group –COOH, signifying acidity. The absorption peaks at 3042 and 1450 cm−1 suggest the presence of benzene rings.40,41 The range of 1690–1760 cm−1 indicates the existence of the functional groups –C
O. Therefore, these samples contained the functional group –COOH, signifying acidity. The absorption peaks at 3042 and 1450 cm−1 suggest the presence of benzene rings.40,41 The range of 1690–1760 cm−1 indicates the existence of the functional groups –C![[double bond, length as m-dash]](https://www.rsc.org/images/entities/char_e001.gif) O (aldehyde) or –C
O (aldehyde) or –C![[double bond, length as m-dash]](https://www.rsc.org/images/entities/char_e001.gif) O (ketone). Peak at 1265 cm−1 indicates the stronger C–O stretching vibration absorption peak while peak at 2932 cm−1 implies the presence of stretching vibration –CH3. For S4 and S5 in Fig. 5, peak at 2962 cm−1 indicates several telescopic vibrations of –CH3, while peak at 733 cm−1 indicates the presence of out-of-plane swinging vibrations of –(CH2)n–.
O (ketone). Peak at 1265 cm−1 indicates the stronger C–O stretching vibration absorption peak while peak at 2932 cm−1 implies the presence of stretching vibration –CH3. For S4 and S5 in Fig. 5, peak at 2962 cm−1 indicates several telescopic vibrations of –CH3, while peak at 733 cm−1 indicates the presence of out-of-plane swinging vibrations of –(CH2)n–.
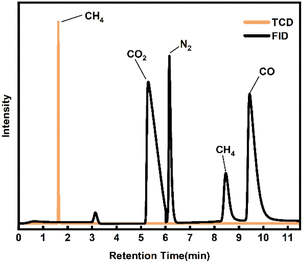
Combined with the analysis of the GC-MS results in Fig. 6, the SES degradation products were found to contain benzoic acid, 1(3H)-isobenzofuranone, acetophenone, naphthalene, biphenyl, 2-heptanone, 2-hexanone and other constituents. For S4 and S5, in the case of insufficient oxidative degradation reaction, the intermediates in the liquid phase were mainly chain products and oxygen-containing benzene series, such as 2-hexanone, 2-hexanone, 1(3H)-isobenzofuranone, 4-methylphthalaldehyde, maleic anhydride, 4-methylacetophenone. For S3, there were a significant increase in benzoic acid content, and an increase in polyaromatic ring compounds such as naphthalene and 9-fluorenone, while chain products were present in very low concentrations. For S1 and S2, there is a gradual decrease in the variety of compounds, which are basically benzene ring compounds such as benzoic acid, acetophenone, phenylacetaldehyde, and biphenyl. In Fig. 7, under the 500 °C, 60 s and coefficient of 150%, the gas-phase product's composition was analyzed and found to consist mainly of CO2, CH4 and CO.
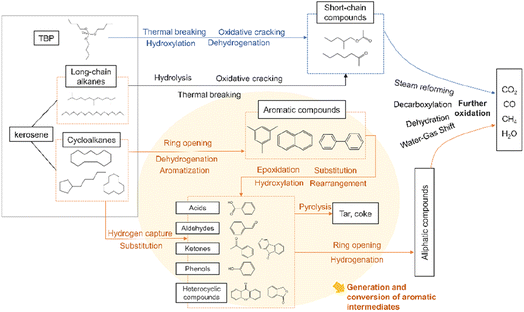
For straight-chain alkanes and TBP, the process initiates with their interaction with ·OH radicals. The breaking of the C–C bond leads to the formation of short-chain compounds, which subsequently proceed to undergo a process of oxidative decomposition. There is very little chain alkane in the later stages of the reaction. The aromatic compounds seemed to accumulate for a longer time and degrade more slowly than long-chain alkanes.42 Finally, the reaction is completed by binding smaller radicals to form a stabilized product, making the entire process much less complex than aromatics.
Under the action of ·OH, ·H, and O2, cycloalkanes can react to form monocyclic compounds that contain benzene rings. These compounds include benzaldehyde, phenol, and benzoic acid, which are formed through hydrogen capture, substitution, and oxidation reactions.43 Intramolecular rearrangements of benzoic acid produced 1(3H)-isobenzofuranone. Bicyclic compounds such as 9-fluorenone or xanthone can also be reconstituted by phenoxy radical addition.44 Polycyclic compounds such as naphthalene and phenanthrene in the product may be produced by coupling reaction of phenyl under high temperature and high pressure. One of the naphthalene rings breaks into a chain to form benzoic acid and benzaldehyde, and these products will be rapidly oxidized.45 Some intermediates are polymerized to form dibenzofuran, fluorenone and xanthone, and these complex compounds require long residence time to be destroyed.46 Then those products undergo further ring-opening, producing linear alcohols, aldehydes, acids, and esters, which will ultimately be fully mineralized into basic compounds such as CO2, CO, CH4, and so on. If an insufficient amount of oxidizer is present, coke and other substances may be produced.
At high temperature and pressure, phenyl undergoes a coupling reaction, generating dimers or polycyclic compounds such as naphthalene and phenanthrene. They are mainly converted into dibenzofuran, fluorenone and xanthone after one-ring cracking, and then those products undergo further ring-opening, producing linear alcohols, aldehydes, acids, and esters, which will ultimately be fully mineralized into basic compounds such as CO2, CO, CH4, and so on. If an insufficient amount of oxidizer is present, coke and other substances may be produced.
Conclusions
In this study, we have conducted an in-depth investigation into the optimization and mechanistic understanding of the treatment of spent extraction solvents in supercritical water. Following conclusions can be made:(1) Using response surface methodology (RSM) design and experimental analysis, a polynomial equation model has been developed to predict TOC removal, with the assistance of RSM. The R2 of the model was 0.9800.
(2) The results indicate that the SCWO process of solvents is mainly influenced by the reaction temperature and residence time. Under the optimal process conditions, the TOC removal of spent extraction solvents reached 99.25%.
(3) Multiple effluents under different SCWO conditions were obtained and analyzed, and the results indicate that ketones and aldehydes are important intermediates in the oxidative degradation of spent extraction solvents.
(4) The degradation pathway of spent extraction solvents was preliminarily inferred to mainly involve processes like decomposition, oxidation, ring opening, and steam reforming.
In summary, this study provides a foundation for further research and development of SCWO treatment for organic solvents present in radioactive waste. It highlights the significant potential of SCWO in addressing waste challenges in the nuclear industry.
Author contributions
Ye Li: conceptualization, software, investigation, data curation, writing – original draft, visualization. Qiang Qin: validation, writing – review & editing, project administration. Zhizhi Zhang: resources, investigation. Shuai Wang: supervision, funding acquisition.Conflicts of interest
There are no conflicts to declare.Acknowledgements
This work is sponsored by Gansu Provincial Natural Science Foundation (23JRRH0007).Notes and references
- T. Xu, S. Wang, Y. Li, J. Li, J. Cai, Y. Zhang, D. Xu and J. Zhang, Sci. Total Environ., 2021, 799, 149396 CrossRef CAS.
- Q. Qin, X.-B. Xia, S.-B. Li, S. Wang and H.-J. Ma, Nucl. Sci. Tech., 2022, 33, 38 CrossRef CAS.
- H. Jin, W. Ding, B. Bai and C. Cao, Rev. Chem. Eng., 2022, 38, 95–109 CrossRef CAS.
- H. Xia, J. Tang, L. Aljerf, T. Wang, J. Qiao, Q. Xu, Q. Wang and P. Ukaogo, Environ. Pollut., 2023, 318, 120949 CrossRef CAS PubMed.
- H. Xia, J. Tang, L. Aljerf, T. Wang, B. Gao, Q. Xu, Q. Wang and P. Ukaogo, Sci. Total Environ., 2023, 883, 163705 CrossRef CAS PubMed.
- R. Yan, D. T. Liang, K. Laursen, Y. Li, L. Tsen and J. H. Tay, Fuel, 2003, 82, 843–851 CrossRef CAS.
- S. N. V. K. Aki and M. A. Abraham, Environ. Prog., 1998, 17, 246–255 CrossRef CAS.
- R. O. A. Rahman, H. A. Ibrahium and Y.-T. Hung, Water, 2011, 3, 551–565 CrossRef.
- S. A. Walling, W. Um, C. L. Corkhill and N. C. Hyatt, npj Mater. Degrad., 2021, 5, 1–20 CrossRef.
- Z. Song, F.-R. Xiu and Y. Qi, J. Hazard. Mater., 2022, 423, 127018 CrossRef CAS PubMed.
- J. Li, S. Wang, Y. Li, C. Yang, D. Xu, J. Zhang, Y. Zhang and T. Xu, Chem. Eng. Res. Des., 2021, 168, 122–134 CrossRef CAS.
- B. Yang, Z. Cheng, M. Fan, J. Jia, T. Yuan and Z. Shen, Chemosphere, 2018, 205, 426–432 CrossRef CAS.
- W. Cao, W. Wei, H. Jin, L. Yi and L. Wang, J. Environ. Chem. Eng., 2022, 10, 107591 CrossRef CAS.
- N. Wei, D. Xu, B. Hao, S. Guo, Y. Guo and S. Wang, Water Res., 2021, 190, 116634 CrossRef CAS PubMed.
- N. Wei, B. Hao, D. Xu, X. Liu, M. Ma and Y. Guo, Fuel Process. Technol., 2022, 236, 107377 CrossRef CAS.
- S. Abdpour and R. M. Santos, Process Saf. Environ. Prot., 2021, 149, 169–184 CrossRef CAS.
- T. S. S. Ribeiro, L. C. Mourão, G. B. M. Souza, I. M. Dias, L. A. Andrade, P. L. M. Souza, L. Cardozo-Filho, G. R. Oliveira, S. B. Oliveira and C. G. Alonso, J. Environ. Chem. Eng., 2021, 9, 106095 CrossRef CAS.
- T. Xu, S. Wang, Y. Li, J. Zhang, J. Li, Y. Zhang and C. Yang, Ind. Eng. Chem. Res., 2020, 59, 18269–18279 CrossRef CAS.
- S. Wang, Q. Qin, K. Chen, X. Xia, H. Ma, Y. Qiao and L. He, Nucl. Sci. Tech., 2015, 26, 115–121 Search PubMed.
- M. Kosari, M. Golmohammadi, J. Towfighi and S. J. Ahmadi, J. Supercrit. Fluids, 2018, 133, 103–113 CrossRef CAS.
- M. Golmohammadi and M. Sattari, Ceram. Int., 2022, 48, 36401–36409 CrossRef CAS.
- J. Chen, Y. Bai, T. Meng, Q. Wang, C. Wang and E. Jiaqiang, Chem. Eng. J., 2023, 451, 138644 CrossRef CAS.
- M. Hu, Z. Li, X. Huang, M. Chen, Z.-T. Hu, S. Tang, I.-M. Chou, Z. Pan, Q. Wang and J. Wang, Chemosphere, 2023, 333, 138907 CrossRef CAS PubMed.
- L. Wang, J. Chen, J. Cui, G. Wang, H. Jin and L. Guo, J. Cleaner Prod., 2023, 385, 135755 CrossRef CAS.
- Q. Qin, S. Wang, H. Wang, H. Ma, K. Chen, Y. Qiao, L. He, Z. Qian, X. Liu, Z. Li and X. Xia, J. Radioanal. Nucl. Chem., 2017, 314, 1169–1176 CrossRef CAS.
- Q. Qin, S. Wang, H. Peng, Y. Qiao, H. Zhang, K. Wang, X. Liu, Z. Qian, L. He, J. Cai, Y. Li and X. Xia, J. Radioanal. Nucl. Chem., 2018, 317, 947–957 CrossRef CAS.
- W. Wagner, J. R. Cooper, A. Dittmann, J. Kijima, H.-J. Kretzschmar, A. Kruse, R. Mareš, K. Oguchi, H. Sato, I. Stöcker, O. Šifner, Y. Takaishi, I. Tanishita, J. Trübenbach and T. Willkommen, J. Eng. Gas Turbines Power, 2000, 122, 150–184 CrossRef CAS.
- L. M. S. Pereira, T. M. Milan and D. R. Tapia-Blácido, Biomass Bioenergy, 2021, 151, 106166 CrossRef CAS.
- A. Boublia, S. E. I. Lebouachera, N. Haddaoui, Z. Guezzout, M. A. Ghriga, M. Hasanzadeh, Y. Benguerba and N. Drouiche, Polym. Bull., 2023, 80, 5999–6031 CrossRef CAS.
- B. Benedetti, V. Caponigro and F. Ardini, Crit. Rev. Anal. Chem., 2022, 52, 1015–1028 CrossRef CAS PubMed.
- C. B. Felix, W.-H. Chen, J.-S. Chang, Y.-K. Park, S. Saeidi and G. Kumar, Bioresour. Technol., 2023, 382, 129200 CrossRef CAS PubMed.
- S.-B. Li, X.-B. Xia, Q. Qin, S. Wang and H.-J. Ma, Nucl. Sci. Tech., 2022, 33, 47 CrossRef CAS.
- J. Yu, Q. Chen, Q. Guan, B. Li, P. Ning, J. Gu and X. Lu, Int. J. Hydrogen Energy, 2016, 41, 17309–17322 CrossRef CAS.
- W. Yang, D. Xu, H. Wang, X. Gong, Y. Wei and Y. Wang, Fuel, 2022, 322, 124261 CrossRef CAS.
- Y. Gong, Y. Guo, S. Wang and W. Song, Water Res., 2016, 100, 116–125 CrossRef CAS PubMed.
- H. Ates and M. E. Argun, Chem. Eng. J., 2021, 414, 128762 CrossRef CAS.
- Z. Ge, S. Guo, L. Guo, C. Cao, X. Su and H. Jin, Int. J. Hydrogen Energy, 2013, 38, 12786–12794 CrossRef CAS.
- L. Aljerf, J. Environ. Manage., 2018, 225, 120–132 CrossRef CAS PubMed.
- J. Strothers, R. B. Matthews, A. Toney, M. R. Cobham, S. Cox, W. Ford, S. Joseph, W. Joyette, S. Khadka, S. Pinnock, M. Burns, M. Noel, M. G. Tamang, D. Saint Hilaire, J.-H. Kim and L. M. Pratt, Fuel, 2019, 239, 573–578 CrossRef CAS.
- L. Aljerf and N. Aljerf, Prog. Nutr., 2023, 25, e2023024 CAS.
- A. T. Melese, D. T. Ayele, L. Aljerf, D. F. Al-Fekaiki and M. L. Akele, BioMetals, 2023, 36, 1347–1359 CrossRef CAS PubMed.
- Q. Guan, P. E. Savage and C. Wei, J. Supercrit. Fluids, 2012, 61, 139–145 CrossRef CAS.
- A. R. M. Daud, C. Berrueco, K. Hellgardt, M. Millan and R. Kandiyoti, J. Supercrit. Fluids, 2021, 167, 105050 CrossRef CAS.
- A. Leybros, A. Roubaud, P. Guichardon and O. Boutin, Process Saf. Environ. Prot., 2010, 88, 213–222 CrossRef CAS.
- S. Xu, Z. Fang and J. A. Koziński, Combust. Sci. Technol., 2003, 175, 291–318 CrossRef CAS.
- S. Xu, I. Butler, I. Gökalp and J. A. Kozinski, Proc. Combust. Inst., 2011, 33, 3185–3194 CrossRef CAS.
| This journal is © The Royal Society of Chemistry 2024 |

